WO2010116888A1 - メッシュデータ作成方法 - Google Patents
メッシュデータ作成方法 Download PDFInfo
- Publication number
- WO2010116888A1 WO2010116888A1 PCT/JP2010/054969 JP2010054969W WO2010116888A1 WO 2010116888 A1 WO2010116888 A1 WO 2010116888A1 JP 2010054969 W JP2010054969 W JP 2010054969W WO 2010116888 A1 WO2010116888 A1 WO 2010116888A1
- Authority
- WO
- WIPO (PCT)
- Prior art keywords
- mesh data
- mesh
- size
- region
- data
- Prior art date
Links
Images


Classifications
-
- G—PHYSICS
- G06—COMPUTING; CALCULATING OR COUNTING
- G06F—ELECTRIC DIGITAL DATA PROCESSING
- G06F17/00—Digital computing or data processing equipment or methods, specially adapted for specific functions
- G06F17/10—Complex mathematical operations
- G06F17/18—Complex mathematical operations for evaluating statistical data, e.g. average values, frequency distributions, probability functions, regression analysis
-
- G—PHYSICS
- G06—COMPUTING; CALCULATING OR COUNTING
- G06F—ELECTRIC DIGITAL DATA PROCESSING
- G06F30/00—Computer-aided design [CAD]
- G06F30/20—Design optimisation, verification or simulation
-
- G—PHYSICS
- G06—COMPUTING; CALCULATING OR COUNTING
- G06Q—INFORMATION AND COMMUNICATION TECHNOLOGY [ICT] SPECIALLY ADAPTED FOR ADMINISTRATIVE, COMMERCIAL, FINANCIAL, MANAGERIAL OR SUPERVISORY PURPOSES; SYSTEMS OR METHODS SPECIALLY ADAPTED FOR ADMINISTRATIVE, COMMERCIAL, FINANCIAL, MANAGERIAL OR SUPERVISORY PURPOSES, NOT OTHERWISE PROVIDED FOR
- G06Q30/00—Commerce
- G06Q30/02—Marketing; Price estimation or determination; Fundraising
-
- G—PHYSICS
- G06—COMPUTING; CALCULATING OR COUNTING
- G06F—ELECTRIC DIGITAL DATA PROCESSING
- G06F2111/00—Details relating to CAD techniques
- G06F2111/02—CAD in a network environment, e.g. collaborative CAD or distributed simulation
Definitions
- the present invention relates to a mesh data creation method.
- a map is divided into a mesh shape, and the divided area is color-coded according to the population density (for example, see Patent Document 1).
- Such a method of expressing the population density is effective for, for example, a large number of samples (total number survey) in the national census.
- the conventional method for expressing population density has the following problems because the mesh size is preset with a constant value.
- the mesh size is kept constant as in the conventional case, if the required accuracy is secured at a high population density, the required number of samples is insufficient at a low population density, and the required accuracy cannot be secured. .
- the required accuracy is secured where the population density is low, the mesh size will be larger than necessary. Where the population density is high, the required accuracy could be secured with a smaller mesh, but the mesh size was increased more than necessary, so the population density in the mesh could not be grasped in detail.
- the mesh is made too fine and the accuracy is lowered, or conversely, the mesh is made too coarse and the granularity is lost, and as a result, detailed population density cannot be grasped. It was. This can be said to be that the balance between accuracy and granularity was not achieved in the prior art.
- an object of the present invention is to provide a mesh data creation method capable of appropriately expressing population density while maintaining a balance between accuracy and granularity.
- a mesh data creation method of the present invention is a mesh data creation method for creating mesh data for representing population density, and is a reference mesh data for creating reference mesh data having a predetermined size.
- a reference mesh data based on the position information obtained in the creation step, the position information acquisition step for obtaining the position information included in the area of the reference mesh data created in the reference mesh data creation step, and the position information acquisition step; Determining the number of samples existing in the region, and determining whether or not the number of samples is equal to or greater than a preset threshold, and when determining that the number of samples is equal to or greater than the threshold in the determination step, A mesh that creates divided mesh data by dividing the area of the reference mesh data. Characterized in that it comprises a data creation step.
- the divided mesh data obtained by dividing the reference mesh data area when the number of samples included in the reference mesh data area having a predetermined size is equal to or larger than the threshold value can be expressed finely in a portion where the population density is high, and the mesh data area can be expressed roughly in a portion where the population density is low.
- the area of the reference mesh data is divided when the number of samples is equal to or greater than the threshold, the area does not become unnecessarily large, and a portion having a particularly high population density can be expressed in detail.
- the accuracy and granularity can be prevented by making the mesh too fine and reducing accuracy, or conversely losing the granularity by making the mesh too coarse and consequently failing to grasp the detailed population density. It is possible to appropriately express the population density while maintaining a balance between the two.
- the mesh data is data divided into meshes for each display area.
- the method further includes a minimum size receiving step for receiving a request for designating a minimum size of the mesh data area from the user.
- the reference mesh data area is more than the minimum size requested by the user in the minimum size receiving step. It is preferable to create divided mesh data so as not to decrease.
- the size of the mesh data area may become extremely small. Therefore, by creating the divided mesh data so as not to be smaller than the minimum size requested by the user, it is possible to perform appropriate display for the user.
- a size receiving step for accepting a request for specifying the size of the mesh data area from the user, and a time width for obtaining the position information necessary for obtaining the size of the area requested by the user in the size receiving step is calculated. It is preferable that the position information is acquired in the position information acquisition step according to the time width calculated in the time width calculation step.
- the time width for acquiring the position information necessary to obtain the size of the area desired by the user is calculated, and mesh data is created based on the position information acquired according to the time width. Therefore, display according to the user's needs can be performed.
- a time width receiving step for receiving a request for specifying a time width for acquiring position information from the user is further included.
- the position information is set according to the time width requested by the user in the time width receiving step. It is preferable to acquire.
- mesh data is created based on the position information acquired according to the time width for acquiring the position information designated by the user, display according to the time width desired by the user can be performed. it can.
- a size determination step of comparing a plurality of mesh data created based on position information in a plurality of different time zones and determining whether or not the size of each region of the plurality of mesh data at the same position is the same
- the size determination step determines that the size of each region is not the same
- the size of each region of the plurality of mesh data is set so that the size of each region of the mesh data in a plurality of different time zones is the same. It is preferable to further include a size adjustment step of adjusting.
- the size of the mesh data area varies depending on the time because the number of samples of position information obtained varies depending on the time. This makes it difficult to grasp changes in population density. Therefore, in the mesh data created at different times, the size of each region of the mesh data at the same position is adjusted so that the size of each region is the same, so that when displaying a plurality of times continuously, at first glance And understand changes in population density.
- a plurality of mesh data created based on position information in a plurality of different time zones is acquired, and the size of each region of the plurality of mesh data at the same position is a predetermined size set in advance. It is preferable to further include a size adjustment step of adjusting the size of each region of the plurality of mesh data.
- the mesh data creation method of the present invention is a mesh data creation method for creating mesh data for representing population density, a reference mesh data creation step for creating reference mesh data having a predetermined size, and a reference mesh Based on the sector information acquisition step for acquiring sector information indicating that the sector included in the region of the reference mesh data generated in the data generation step is located, and the sector information acquired in the sector information acquisition step, A determination step of determining the number of sectors existing in the area of the reference mesh data and determining whether the number of sectors is equal to or greater than a preset threshold value, and the determination step determines that the number of sectors is equal to or greater than the threshold value In this case, create divided mesh data by dividing the reference mesh data area. Characterized in that it comprises a mesh data creation step of, a.
- the divided mesh data obtained by dividing the reference mesh data area when the number of samples included in the reference mesh data area having a predetermined size is equal to or larger than the threshold value.
- the mesh data area can be expressed finely in a portion where the number of sectors is large, and the mesh data area can be expressed roughly in a portion where the number of sectors is small.
- the area of the reference mesh data is divided when the number of sectors is equal to or greater than the threshold value, the area does not become larger than necessary, and a portion having a particularly large number of sectors can be expressed in detail.
- the method further includes a conversion step of converting the sector unit population information into the mesh data region unit population information according to the area ratio in which the sector region indicated by the sector information having the population information and the mesh data region overlap. Is preferred.
- the sector area is an area obtained by dividing the cell of the base station at a predetermined angle.
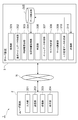
- FIG. 1 is a diagram showing an outline of a communication system.
- FIG. 2 is a diagram showing an outline of the mesh data creation system.
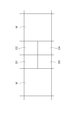
- FIG. 3 is a diagram showing divided mesh data.
- FIG. 4 is a sequence showing an example of the operation of the mesh data creation system.
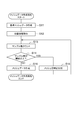
- FIG. 5 is a flowchart showing mesh data creation processing.
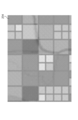
- FIG. 6 is a diagram illustrating an example of population density data displayed on the user terminal.
- FIG. 7 is a flowchart showing mesh data creation processing when the minimum mesh size is designated.
- FIG. 8 is a flowchart showing mesh data creation processing when a mesh size is designated.
- FIG. 9 is a flowchart showing mesh data creation processing when a time width for acquiring position information is designated.
- FIG. 10 is a flowchart showing mesh data creation processing when continuous display of population density data is requested.
- FIG. 11 is a flowchart showing mesh data creation processing when continuous display of population density data is requested.
- FIG. 12 is a diagram showing an overview of a mesh data creation system according to the second embodiment.
- FIG. 13 is a diagram showing a sector area and a mesh area.
- FIG. 14 is a diagram for explaining conversion of population information of sector information into population information of mesh data.
- the mesh data creation method according to the present embodiment is realized by a mesh data creation system.
- This mesh data creation system performs mapping processing on a map based on position information (position point data) of a mobile device (cellular phone) acquired by a communication system to create mesh data.
- position information position point data
- cellular phone mobile device
- FIG. 1 is a diagram showing an outline of a communication system.
- the communication system 10 includes a mobile device 20, a BTS (base station) 30, an RNC (radio network control device) 40, an exchange 50, and a management center 60.
- the management center 60 includes a social sensor unit 601, a petamining unit 602, a mobile demography unit 603, and a visualization solution unit 604.
- the exchange 50 collects the location information of the mobile device 20 via the BTS 30 and the RNC 40.
- the RNC 40 can measure the position of the mobile device 20 using the delay value in the RRC connection request signal when communication connection is established with the mobile device 20.
- the exchange 50 can receive the position information of the mobile device 20 measured in this way when the mobile device 20 performs communication connection.
- the exchange 50 stores the received position information, and outputs the collected position information to the management center 60 at a predetermined timing or in response to a request from the management center 60.
- the RNC 40 is composed of approximately 1,000 pieces, and is arranged throughout Japan. On the other hand, about 300 exchanges 50 are arranged in Japan.
- the management center 60 includes the social sensor unit 601, the petamining unit 602, the mobile demography unit 603, and the visualization solution unit 604. In each unit, the location information of the mobile device 20 is used. Perform statistical processing.
- the social sensor unit 601 is a server device that collects data including location information of the mobile device 20 from each exchange 50.
- the social sensor unit 601 is configured to receive data periodically output from the exchange 50 or to request data exchange from the exchange 50 according to a predetermined timing in the social sensor unit 601. .
- the petamining unit 602 is a server device that converts data received from the social sensor unit 601 into a predetermined data format. For example, the petamining unit 602 performs a sorting process using a user ID as a key, or performs a sorting process for each area.
- the mobile demography unit 603 is a server device that performs aggregation processing on the data processed in the petamining unit 602, that is, count processing for each item. For example, the mobile demography unit 603 can count the number of users who are in a certain area, and can total the distribution of the areas.
- the visualization solution unit 604 is a server device that processes the data aggregated in the mobile demography unit 603 so as to be visible.
- the visualization solution unit 604 can map the aggregated data on the map.
- the data processed by the visualization solution unit 604 is provided upon request from a user terminal 2 (described later) such as a company, a public office or an individual, and is used for store development, road traffic investigation, disaster countermeasures, environmental measures, etc. Is done. It should be noted that the information statistically processed in this way is processed so that individuals are not specified so as not to infringe privacy.
- the social sensor unit 601, petamining unit 602, mobile demography unit 603, and visualization solution unit 604 are all configured by the server device as described above, and although not shown, the basic configuration of a normal information processing device Needless to say, it includes a CPU, a RAM, a ROM, an input device such as a keyboard and a mouse, a communication device that communicates with the outside, a storage device that stores information, and an output device such as a display and a printer. Further, the user terminal 2 to be described later also has a basic configuration of a normal information processing apparatus, like the server apparatus.
- FIG. 2 is a diagram showing an outline of the mesh data creation system.
- the mesh data creation system 1 includes a user terminal 2 and a server device 3.
- the user terminal 2 and the server device 3 are connected to each other via a communication network N so that they can communicate with each other.
- the user terminal 2 is a terminal that requests the server device 3 to provide information on population density by a user operation, and receives and displays population density data transmitted from the server device 3 in response to the request.
- the user terminal 2 is, for example, a personal computer or a portable terminal operated by a company, a public office, or an individual as described above.
- the server device 3 is a device having a function of creating mesh data in response to an information request from the user terminal 2 and transmitting population density data obtained by mapping the mesh data and population data to map data to the user terminal 2. .
- the server device 3 corresponds to the visualization solution unit 604 described above.
- the user terminal 2 includes an input unit 201, a transmission unit 202, a reception unit 203, and a display unit 204.
- the input unit 201 receives an operation from the user.
- the input unit 201 receives an operation from the user, generates population density display request information corresponding to the user's input operation, and outputs the population density display request information to the transmission unit 202.
- the population density display request information generated by the input unit 201 includes minimum size designation information for designating the minimum mesh size of the mesh area when displaying the population density, size designation information for designating the mesh size of the mesh area, Also included are time width specifying information for specifying a time width for acquiring position information, and continuous display request information for requesting continuous display of population density data.
- the transmission unit 202 When the transmission unit 202 receives the population density display request information output from the input unit 201, the transmission unit 202 transmits the population density display request information to the server device 3.
- the receiving unit 203 receives population density data transmitted from the server device 3 in response to transmission of population density display request information from the transmitting unit 202.
- the receiving unit 203 outputs the received population density data to the display unit 204.
- the display unit 204 is, for example, a display.
- the display unit 204 displays an image corresponding to the population density data. Details of the image displayed on the display unit 204 will be described later.
- the server device 3 includes a reception unit 301, a reference mesh data creation unit 302, a time width calculation unit 303, a position information acquisition unit 304, a data storage unit 305, a determination unit 306, and mesh data.
- a creation unit 307, a size determination unit 308, a size adjustment unit 309, a population density data creation unit 310, and a transmission unit 311 are provided.
- the receiving unit 301 receives population density display request information transmitted from the user terminal 2.
- the reception unit 301 outputs the received population density display request information to the reference mesh data creation unit 302, the time width calculation unit 303, the position information acquisition unit 304, and the size determination unit 308.
- the reference mesh data creation unit 302 When the reference mesh data creation unit 302 receives the population density display request information from the reception unit 301, the reference mesh data creation unit 302 creates reference mesh data.
- the reference mesh data is data having a substantially square area having a predetermined size, divided into mesh shapes.
- the reference mesh data creation unit 302 creates the number of reference mesh data corresponding to the area for creating population density data.
- the reference mesh data creation unit 302 outputs the created reference mesh data to the determination unit 306 and the mesh data creation unit 307.
- the time width calculation unit 303 when the size designation information is included in the population density display request information output from the reception unit 301, the position necessary for realizing the mesh size of the mesh area indicated by the size designation information The minimum time width for acquiring information is calculated.
- the time width calculation unit 303 detects and compares the mesh size of the mesh region of the mesh data created by the mesh data creation unit 307, which will be described later, and the mesh size of the mesh region indicated by the size designation information, so that the position information Calculate the time span required for acquisition.
- the time width calculation unit 303 outputs time width information indicating the calculated time width to the position information acquisition unit 304.
- the location information acquisition unit 304 acquires location information.
- the location information acquisition unit 304 receives the population density display request information output from the reception unit 301
- the location information acquisition unit 304 acquires location information corresponding to the population density display request information from the data storage unit 305.
- the position information acquiring unit 304 receives the time information.
- the position information is acquired according to the width information. Specifically, the position information acquisition unit 304 extracts the position information corresponding to the time corresponding to the time width information from the position information stored in the data storage unit 305, thereby obtaining the position information. get.
- the location information acquisition unit 304 outputs the acquired location information to the determination unit 306 and the population density data creation unit 310.
- the data storage unit 305 stores position information as described above.
- the data storage unit 305 stores the location information of the mobile device acquired by the communication system 10.
- the data storage unit 305 stores the population density data created by the population density data creation unit 310 described later.
- the determination unit 306 When the determination unit 306 receives the reference mesh data output from the reference mesh data creation unit 302 and receives the position information output from the position information acquisition unit 304, the determination unit 306 specifies and counts the number of samples based on the position information. It is determined whether or not the number of samples is greater than or equal to a threshold value in the reference mesh data area. The threshold value is set to 400, for example. If the determination unit 306 determines that the number of samples is equal to or greater than the threshold, the determination unit 306 outputs division instruction information for instructing division of the region of the reference mesh data to the mesh data creation unit 307.
- the mesh data creation unit 307 creates divided mesh data based on the reference mesh data created by the reference mesh data creation unit 302. Upon receiving the division instruction information output from the determination unit 306, the mesh data creation unit 307 creates divided mesh data obtained by dividing the region of the reference mesh data based on the division instruction information. Specifically, this will be described with reference to FIG. FIG. 3 is a diagram showing divided mesh data. As shown in the figure, the mesh data creation unit 307 creates divided mesh data D1 to D4 obtained by dividing the mesh area M of the reference mesh data into, for example, four.
- the mesh data creation unit 307 determines that the mesh area of the divided mesh data is the mesh area indicated by the minimum size designation information. Create divided mesh data so that it is not smaller than the size. The mesh data creation unit 307 outputs the created divided mesh data to the population density data creation unit 310. Note that the number of divisions of the mesh data is arbitrarily set.
- the size determination unit 308 differs when the continuous display request information is included in the population density display request information output from the reception unit 301, that is, when the user requests continuous display (animation) of the population density data.
- a plurality of mesh data created based on position information in a plurality of time zones are compared, and it is determined whether or not the size of each region of the plurality of mesh data at the same position (same latitude and longitude) is the same. Is.
- the size determination unit 308 generates each of a plurality of mesh data at the same position in the population density data of a plurality of different time zones generated by the population density data creation unit 310 and stored in the data storage unit 305. When it is determined that the mesh sizes of the mesh areas are not the same, determination information indicating that is output to the size adjustment unit 309.
- the size adjustment unit 309 adjusts the mesh size of the mesh area of the mesh data. Upon receiving the determination information output from the size determination unit 308, the size adjustment unit 309 receives the determination information of each region of the plurality of mesh data so that the mesh sizes of the mesh regions of the mesh data in different time zones are the same. Adjust the size. Specifically, the size adjustment unit 309 acquires each mesh data from a plurality of population density data so that the mesh size of each mesh data in the display area is the same in all displayed time zones. Adjust the mesh size of each mesh area. The size adjustment unit 309 outputs the mesh data after the size adjustment to the population density data creation unit 310.
- the population density data creation unit 310 creates population density data.
- the population density data creation unit 310 creates population density data based on the reference mesh data output from the reference mesh data creation unit 302 and the location information output from the location information acquisition unit 304. Further, when the population density data creation unit 310 receives the divided mesh data output from the mesh data creation unit 307, the population density data creation unit 310 creates population density data based on the division mesh data and the position information. More specifically, the population density data creation unit 310 creates the population density data by mapping the reference mesh data or the divided mesh data and the position information (population data) corresponding to the mesh data to the map data.
- the population density data creation unit 310 creates population density data based on the mesh data.
- the population density data creation unit 310 outputs the created population density data to the transmission unit 311. Further, the population density data creation unit 310 outputs the created population density data to the data storage unit 305.
- the transmission unit 311 Upon receiving the population density data output from the population density data creation unit 310, the transmission unit 311 transmits this population density data to the user terminal 2. In addition, the transmission unit 311 transmits population density data stored in the data storage unit 305 to the user terminal 2.
- FIG. 4 is a sequence showing an example of the operation of the mesh data creation system 1.
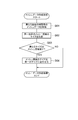
- FIG. 5 is a flowchart showing mesh data creation processing. In the following description, a manner in which population density data is created after a request for population density display from a user will be described.
- step S01 population density display request information for requesting display of population density is transmitted from the user terminal 2 to the server device 3 (step S01).
- step S02 mesh data creation processing is performed in the server apparatus 3 that has received the population display request information. The mesh data creation process will be described with reference to FIG.
- reference mesh data is first created by the reference mesh data creation unit 302 (step S11).
- position information included in the mesh area of the created reference mesh data is acquired by the position information acquisition unit 304 (step S12).
- the number of samples existing in the mesh area of the reference mesh data is specified and counted based on the position information (step S13), and the number of samples is equal to or greater than a threshold value (for example, 400). Is determined by the determination unit 306 (step S14). If it is determined that the number of samples is equal to or greater than the threshold, the process proceeds to step S15. On the other hand, if it is not determined that the number of samples is greater than or equal to the threshold, reference mesh data is created as mesh data (step S16).
- step S15 the mesh data creation unit 307 creates divided mesh data obtained by dividing the mesh area of the reference mesh data. As described above, the mesh data creation process is performed.
- the server device 3 creates population density data based on the mesh data created by the mesh data creation process (step S03).
- the created population density data is transmitted from the server device 3 to the user terminal 2 by the transmission unit 311 (step S04).
- an image corresponding to the population density data is displayed on the display unit (step S05).
- population density display request information is transmitted from the user terminal 2 to the server device 3, the population density created in advance in the server device 3 and stored in the data storage unit 305. Data may be sent.
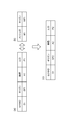
- FIG. 6 is a diagram illustrating an example of population density data displayed on the user terminal 2.
- the image based on the population density data displayed on the display unit 204 of the user terminal 2 is mapped with a mesh region of a plurality of mesh data created based on the number of samples on the map. Yes.
- the population density obtained based on the position information is shown by color classification and color shading.
- a small mesh region size indicates a high population density
- a large mesh region size indicates a low population density.
- FIG. 7 is a flowchart showing mesh data creation processing when the minimum mesh size is designated. Note that description of the same processing (step S21 to step S23) as in the flowchart of FIG. 5 is omitted.
- step S24 the number of samples existing in the mesh area of the reference mesh data is specified based on the position information, and the number of samples is greater than or equal to a threshold value (for example, 400), and the mesh data mesh
- the determination unit 306 determines whether or not the mesh size of the region is greater than or equal to the minimum mesh size. If it is determined that the number of samples is greater than or equal to the threshold and greater than or equal to the minimum mesh size, the mesh data creation unit 307 creates divided mesh data obtained by dividing the mesh area of the reference mesh data (step S25). The process returns to step S23. On the other hand, if it is not determined that the number of samples is equal to or greater than the threshold and greater than or equal to the minimum mesh size, mesh data is created (step S26).
- FIG. 8 shows a mesh data generation method when the mesh size of the mesh area in the mesh data is designated by the user, that is, when the size designation information is included in the population density display information in step S01 of FIG. The description will be given with reference.
- FIG. 8 is a flowchart showing mesh data creation processing when a mesh size is designated.
- step S31 position information is acquired by the position information acquisition unit 304 (step S31).
- step S32 extraction by time is performed on the acquired position information. That is, only position information corresponding to a preset time width is extracted from the position information acquired in step S31 (step S32).
- reference mesh data is created by the reference mesh data creation unit 302 (step S33). Based on the position information included in the created reference mesh data area, the number of samples existing in the mesh area of the reference mesh data is specified and counted (step S34). 400) It is determined by the determination unit 306 whether or not it is greater than or equal to (step S35). If it is determined that the number of samples is equal to or greater than the threshold value, the mesh data creation unit 307 creates divided mesh data obtained by dividing the mesh area of the reference mesh data (step S36), and the process returns to step S34. If it is not determined that the number of samples is equal to or greater than the threshold value, mesh data is created (step S37).
- step S38 when mesh data is created in step S37, the mesh area of the mesh data in the display range is cut out (step S38).
- the display range indicates the display range on the display unit 204 of the user terminal 2.
- the maximum mesh size in the display range is acquired (step S39), and it is determined whether or not this maximum mesh size satisfies the requested mesh size specified by the user (step S39). S40). If it is determined that the user's requested mesh size is satisfied, the process ends. On the other hand, if it is not determined that the user's requested mesh size is satisfied, the time width is expanded (step S41), and the process returns to step S32 with the expanded time width.
- FIG. 9 shows a mesh data creation method when the time width for acquiring position information from the user is designated, that is, when the time width designation information is included in the population density display information in step S01 of FIG.
- the description will be given with reference.
- FIG. 9 is a flowchart showing mesh data creation processing when a time width for acquiring position information is designated.
- a time width is set based on the time width information designated by the user (step S51).
- position information is acquired by the position information acquisition unit 304 (step S52).
- extraction based on time is performed on the acquired position information. That is, only the position information corresponding to the time width set in step S51 is extracted from the position information acquired in step S52 (step S53).
- reference mesh data is created by the reference mesh data creation unit 302 (step S54). Based on the position information included in the mesh area of the created reference mesh data, the number of samples existing in the mesh area of the reference mesh data is specified and counted (step S55), and the number of samples is counted as a threshold ( For example, it is determined by the determination unit 306 whether or not it is 400) or more (step S56).
- the mesh data creation unit 307 creates divided mesh data obtained by dividing the mesh area of the reference mesh data (step S57), and the process returns to step S55. If it is not determined that the number of samples is equal to or greater than the threshold value, mesh data is created (step S58). Note that the mesh size of the mesh area may be adjusted so that the created mesh data has, for example, the maximum mesh size of the mesh area of the mesh data in the display range.
- FIG. 10 is a flowchart showing mesh data creation processing when continuous display of population density data is requested.
- the population density data created by the population density data creation unit 310 is stored in the data storage unit 305 in advance.
- step S61 population density data in a plurality of different time zones is acquired from the data storage unit 305, and mesh data is acquired from each population density data (step S61).
- step S62 the mesh size of the mesh area
- step S63 the size determination unit 308 determines whether or not there are mesh regions having different mesh sizes at the same position.
- the mesh size is adjusted so that the mesh size of the corresponding mesh area is the same as the mesh size of the other mesh areas. Adjustment is performed by the unit 309 (step S64). On the other hand, if it is not determined that there is a mesh area having a different mesh size at the same position, the process ends. Note that the mesh size of the mesh area may be adjusted so as to be the maximum mesh size in the display range.
- the mesh data creation method in the mesh data creation system 1 when the number of samples included in the region of the reference mesh data having a predetermined size is equal to or greater than a threshold value, Create divided mesh data by dividing the region of the reference mesh data. That is, the mesh data area can be expressed finely in a portion where the population density is high, and the mesh data area can be expressed roughly in a portion where the population density is low.
- the area of the reference mesh data is divided when the number of samples is equal to or greater than the threshold, the area does not become unnecessarily large, and a portion having a particularly high population density can be expressed in detail.
- the accuracy and granularity can be prevented by making the mesh too fine and reducing accuracy, or conversely losing the granularity by making the mesh too coarse and consequently failing to grasp the detailed population density. It is possible to appropriately express the population density while maintaining a balance between the two.
- the specification of the minimum mesh size of the mesh area of the mesh data is received from the user, and the mesh data is generated so that the mesh size of the mesh area does not become smaller than the specified minimum mesh size.
- the mesh size of the mesh data area may become extremely small. Therefore, by creating the divided mesh data so as not to be smaller than the minimum mesh size requested by the user, it is possible to perform appropriate display for the user.
- a time width for acquiring position information necessary for obtaining the size of an area desired by the user is calculated, and mesh data is calculated based on the position information acquired according to the time width. Since it is created, display according to the user's needs can be performed.
- mesh data in which the mesh sizes of the mesh areas of the mesh data in the display range are all the same may be created and displayed.
- the population density request information transmitted from the user terminal 2 includes information specifying that all mesh sizes in the mesh area are the same mesh size
- the information is stored in the data storage unit 305.
- the acquired population density data is acquired, and the mesh data is adjusted so that the mesh sizes of the mesh areas of the mesh data in the population density data all become the same mesh size.
- the “same mesh size” here means any one of a plurality of mesh sizes calculated by performing the above-described processes according to the present embodiment, for example, the maximum displayed on the screen. Means the mesh size.
- the population density data which mapped this mesh data on map data are transmitted to a user. Thereby, it becomes possible to respond to a user's request to make all mesh sizes in the mesh region the same mesh size.
- the mesh adjustment unit 309 adjusts the mesh data so that the mesh sizes of the mesh regions of the plurality of mesh data in FIG. 6 are the same, the mesh data may be adjusted by the following method, for example.
- FIG. 11 is a flowchart showing mesh data creation processing when continuous display of population density data is requested.
- step S71 population density data in a plurality of different time zones is acquired from the data storage unit 305, and mesh data is acquired from each population density data (step S71).
- step S72 the maximum mesh size in the display range is acquired (step S72).
- step S73 the mesh data is adjusted by the size adjusting unit 309 so that the mesh size of the mesh area of each mesh data becomes the mesh size of the maximum mesh area (step S73).
- the mesh creation method according to the second embodiment is different from the first embodiment in that mesh data is created based on sector information.
- symbol is attached
- FIG. 12 is a diagram showing an outline of a mesh data creation system according to the second embodiment.
- the mesh data creation system 1A includes a user terminal 2 and a server device 3A.
- the user terminal 2 and the server device 3A are connected to each other via a communication network N so that they can communicate with each other.
- the server apparatus 3A functionally includes a sector information acquisition unit 312, a determination unit 313, and a population density conversion unit 314 as a configuration different from that of the first embodiment.
- the sector information acquisition unit 312 acquires sector information indicating that the sector is located. This sector information has population information. Upon receiving the population density display request information output from the reception unit 301, the sector information acquisition unit 312 acquires the sector information corresponding to the population density display request information from the data storage unit 305. The sector information acquisition unit 312 outputs the acquired sector information to the determination unit 313 and the population density conversion unit 314.
- the determination unit 313 When the determination unit 313 receives the reference mesh data output from the reference mesh data creation unit 302 and receives the sector information output from the sector information acquisition unit 312, the determination unit 313 identifies and counts the number of sectors based on the sector information. In this case, it is determined whether or not the number of sectors is equal to or greater than a threshold in the mesh area of the reference mesh data. For example, the threshold value is set to a value such that the number of sectors in the divided mesh data created by the mesh data creation unit 307 does not become zero. If the determination unit 313 determines that the number of sectors is equal to or greater than the threshold, the determination unit 313 outputs division instruction information for instructing division of the region of the reference mesh data to the mesh data creation unit 307. The mesh data creation unit 307 creates divided mesh data based on the division instruction information output from the determination unit 313.
- the population density conversion unit 314 assigns the population information included in the sector information to the mesh data, and converts the population information (population data) included in the sector information into the population information in the mesh data. Specifically, this will be described with reference to FIGS.
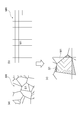
- FIG. 13 is a diagram showing a sector area and a mesh area.
- FIG. 14 is a diagram for explaining conversion of population information of sector information into population information of mesh data.
- FIG. 13A shows the sector area indicated by the sector information.
- the sector region SR is a region obtained by dividing the cell of the BTS (base station) 30 at a predetermined angle, and forms a polygonal polygon.
- Each sector area SR is assigned a sector ID (for example, S1) for identifying which sector area.
- FIG. 13B shows a mesh region MR of mesh data. As shown in the figure, a mesh ID (for example, M1) for identifying which mesh region is assigned to this mesh region MR.
- the population density conversion unit 314 superimposes the sector region SR and the mesh region MR, and divides the sector region SR by the mesh region MR. Then, the population density indicated in the population information of each sector region SR is assigned to the mesh region MR according to the area ratio divided by the mesh region MR. The total population information assigned to each mesh region MR is used as the population information of the mesh region MR.
- one sector ID in the sector region SR is, for example, S1
- one mesh ID in the mesh region MR is, for example, M1.
- the polygon (shape) is SP1
- the area is A1
- the population shown in the population information is P1.
- the polygon of the mesh region MR whose mesh ID is M1 is MP1.
- the polygon of the sector region SR is SP2, as shown in FIG. 14 (c).
- the sector region SR is divided into mesh regions MR, and the shape of the sector region MR is deformed.
- the area is also reduced by being divided into the mesh regions MR, for example, A2.
- the population allocated with respect to the area also decreases, for example, becomes P2.
- This P2 is a value obtained by (area A2 / area A1) ⁇ P1. Therefore, the population information of each sector region SR is assigned to the mesh region MR according to the area ratio divided by the mesh region MR. By adding together the population information assigned in this way, population information can be given to the mesh region MR having no population information.
- the mesh data creation method in the mesh data creation system 1A when the number of samples included in the region of the reference mesh data having a predetermined size is equal to or greater than the threshold value, Create divided mesh data by dividing the region of the reference mesh data. That is, the mesh data area can be expressed finely in a portion where the number of sectors is large, and the mesh data area can be expressed roughly in a portion where the number of sectors is small. Further, since the area of the reference mesh data is divided when the number of sectors is equal to or greater than the threshold value, the area does not become larger than necessary, and a portion having a particularly large number of sectors can be expressed in detail.
- the sector information is converted from the population information of the sector unit to the population information of the mesh data area unit.
- Population information can be suitably reflected in mesh data.
- M Reference mesh data
- MR Mesh area
- D Divided mesh data
- SR Sector area.
Landscapes
- Engineering & Computer Science (AREA)
- Physics & Mathematics (AREA)
- Theoretical Computer Science (AREA)
- General Physics & Mathematics (AREA)
- Data Mining & Analysis (AREA)
- Business, Economics & Management (AREA)
- Accounting & Taxation (AREA)
- General Engineering & Computer Science (AREA)
- Computational Mathematics (AREA)
- Mathematical Analysis (AREA)
- Mathematical Optimization (AREA)
- Strategic Management (AREA)
- Finance (AREA)
- Pure & Applied Mathematics (AREA)
- Development Economics (AREA)
- Mathematical Physics (AREA)
- Evolutionary Computation (AREA)
- Algebra (AREA)
- Databases & Information Systems (AREA)
- Bioinformatics & Computational Biology (AREA)
- Computer Hardware Design (AREA)
- Evolutionary Biology (AREA)
- Geometry (AREA)
- Bioinformatics & Cheminformatics (AREA)
- Life Sciences & Earth Sciences (AREA)
- Software Systems (AREA)
- Entrepreneurship & Innovation (AREA)
- Probability & Statistics with Applications (AREA)
- Game Theory and Decision Science (AREA)
- Operations Research (AREA)
- Economics (AREA)
- Marketing (AREA)
- General Business, Economics & Management (AREA)
- Processing Or Creating Images (AREA)
- Management, Administration, Business Operations System, And Electronic Commerce (AREA)
Abstract
精度と粒度との間のバランスを取りながらも人口密度を適切に表現することができるメッシュデータ作成方法を提供する。メッシュデータ作成方法によれば、所定の大きさを有する基準メッシュデータの領域内に含まれるサンプル数が閾値以上である場合に、基準メッシュデータの領域を分割した分割メッシュデータを作成する。すなわち、人口密度が高い部分はメッシュデータの領域を細かく、人口密度が低い部分はメッシュデータの領域を粗く表現することができる。以上により、メッシュを細かくしすぎて精度を落としてしまったり、逆にメッシュを粗くしすぎることにより粒度を失い、その結果で人口密度の詳細な把握ができなかったりすることを防ぎ、精度と粒度との間のバランスを取りながらも人口密度を適切に表現することが可能となる。
Description
本発明は、メッシュデータ作成方法に関する。
従来、人口密度(分布)を表現する方法として、例えば地図をメッシュ状に区切り、その区切られた領域を人口密度に応じて色分けするものが知られている(例えば、特許文献1参照)。このような人口密度の表現方法は、例えば国勢調査等において多くのサンプル(全数調査)を対象とするものに対しては有効である。
しかしながら、上記従来の人口密度の表現方法にあっては、メッシュのサイズが一定の値で予め設定されていたので、以下のような問題点があった。すなわち、従来のようにメッシュサイズを一定にした場合に、人口密度が高いところで必要な精度を確保するようにすると、人口密度が低いところではサンプル数が足りず、必要な精度を確保できなかった。逆に、人口密度が低いところで必要な精度を確保すると、メッシュサイズが必要以上に大きくなってしまう。人口密度が高いところでは、もっと小さいメッシュでも必要な精度を確保できるのに、必要以上にメッシュサイズを大きくしたため、メッシュ内の人口密度を詳細に把握できなかった。言い換えれば、従来の技術においては、メッシュを細かくしすぎて精度を落としてしまったり、逆にメッシュを粗くしすぎることにより粒度を失い、その結果で人口密度の詳細な把握ができなかったりしていた。これは、従来の技術においては、精度と粒度との間のバランスが取れていなかったともいえる。
そこで、本発明は上記に鑑みてなされたもので、精度と粒度との間のバランスを取りながらも人口密度を適切に表現することができるメッシュデータ作成方法を提供することを目的とする。
上記課題を解決するために、本発明のメッシュデータ作成方法は、人口密度を表すためのメッシュデータを作成するメッシュデータ作成方法であって、所定のサイズを有する基準メッシュデータを作成する基準メッシュデータ作成ステップと、基準メッシュデータ作成ステップにおいて作成された基準メッシュデータの領域内に含まれる位置情報を取得する位置情報取得ステップと、位置情報取得ステップにおいて取得された位置情報に基づいて、基準メッシュデータの領域内に存在するサンプル数を特定し、サンプル数が予め設定された閾値以上であるか否かを判定する判定ステップと、判定ステップにおいてサンプル数が閾値以上であると判定された場合に、基準メッシュデータの領域を分割した分割メッシュデータを作成するメッシュデータ作成ステップと、を含むことを特徴とする。
このような本発明のメッシュデータ作成方法によれば、所定の大きさを有する基準メッシュデータの領域内に含まれるサンプル数が閾値以上である場合に、基準メッシュデータの領域を分割した分割メッシュデータを作成する。すなわち、人口密度が高い部分はメッシュデータの領域を細かく、人口密度が低い部分はメッシュデータの領域を粗く表現することができる。また、サンプル数が閾値以上である場合に基準メッシュデータの領域を分割するので、必要以上に領域が大きくなることがなく、特に人口密度が高い部分を詳細に表すことができる。以上により、メッシュを細かくしすぎて精度を落としてしまったり、逆にメッシュを粗くしすぎることにより粒度を失い、その結果で人口密度の詳細な把握ができなかったりすることを防ぎ、精度と粒度との間のバランスを取りながらも人口密度を適切に表現することが可能となる。なお、メッシュデータとは、表示領域ごとにメッシュ状に区分されたデータである。
また、ユーザからメッシュデータの領域の最小サイズを指定する要求を受け付ける最小サイズ受付ステップを更に含み、メッシュデータ作成ステップにおいて、基準メッシュデータの領域が最小サイズ受付ステップにおいてユーザから要求された最小サイズよりも小さくならないように、分割メッシュデータを作成することが好適である。
メッシュデータの領域内に存在するサンプル数が多い場合には、メッシュデータの領域のサイズが極端に小さくなることがある。そこで、ユーザから要求された最小サイズよりも小さくならないように分割メッシュデータを作成することにより、ユーザに対して適切な表示を行うことができる。
また、ユーザからメッシュデータの領域のサイズを指定する要求を受け付けるサイズ受付ステップと、サイズ受付ステップにおいてユーザから要求された領域のサイズとするために必要な位置情報を取得するための時間幅を算出する時間幅算出ステップと、を更に含み、位置情報取得ステップにおいて、時間幅算出ステップにおいて算出された時間幅に応じて、位置情報を取得することが好適である。
この場合には、ユーザが所望する領域のサイズにするために必要な位置情報を取得するための時間幅を算出し、この時間幅に応じて取得された位置情報に基づいてメッシュデータが作成されるので、ユーザのニーズに応じた表示を行うことができる。
また、ユーザから位置情報を取得する時間幅を指定する要求を受け付ける時間幅受付ステップを更に含み、位置情報取得ステップにおいて、時間幅受付ステップにおいてユーザから要求された時間幅に応じて、位置情報を取得することが好適である。
この場合には、ユーザから指定された位置情報を取得する時間幅に応じて取得された位置情報に基づいてメッシュデータが作成されるので、ユーザが所望する時間幅に応じた表示を行うことができる。
また、異なる複数の時間帯における位置情報に基づいて作成された複数のメッシュデータを比較し、同一の位置における複数のメッシュデータの各領域のサイズが同一であるか否かを判定するサイズ判定ステップと、サイズ判定ステップにおいて各領域のサイズが同一でないと判定された場合に、異なる複数の時間帯におけるメッシュデータの各領域のサイズが同一となるように、複数のメッシュデータの各領域のサイズを調整するサイズ調整ステップと、を更に含むことが好適である。
異なる複数の時間において作成されたメッシュデータを連続して表示(アニメーション)する場合、それぞれの時間によって取得される位置情報のサンプル数が異なるため、時間によってメッシュデータの領域のサイズが異なり、一見して人口密度の変化を把握することが困難となる。そこで、異なる時間において作成されたメッシュデータにおいて、同一の位置におけるメッシュデータの各領域のサイズを同一となるよう領域のサイズを調整することで、複数の時間を連続して表示する際に、一見して人口密度の変化を把握することができる。
また、異なる複数の時間帯における位置情報に基づいて作成された複数のメッシュデータを取得し、同一の位置における複数のメッシュデータの各領域のサイズが予め設定された所定のサイズとなるように、複数のメッシュデータの各領域のサイズを調整するサイズ調整ステップを更に含むことが好適である。
異なる複数の時間において作成されたメッシュデータを連続して表示(アニメーション)する場合、それぞれの時間によって取得される位置情報のサンプル数が異なるため、時間によってメッシュデータの領域のサイズが異なり、一見して人口密度の変化を把握することが困難となる場合がある。そこで、異なる時間において作成されたメッシュデータにおいて、同一の位置におけるメッシュデータの各領域のサイズが予め設定された所定のサイズとなるよう領域のサイズを調整することで、複数の時間を連続して表示する際に、一見して人口密度の変化を把握することができる。
また、本発明のメッシュデータ作成方法は、人口密度を表すためのメッシュデータを作成するメッシュデータ作成方法であって、所定のサイズを有する基準メッシュデータを作成する基準メッシュデータ作成ステップと、基準メッシュデータ作成ステップにおいて作成された基準メッシュデータの領域内に含まれるセクタが位置していることを示すセクタ情報を取得するセクタ情報取得ステップと、セクタ情報取得ステップにおいて取得されたセクタ情報に基づいて、基準メッシュデータの領域内に存在するセクタ数を特定し、セクタ数が予め設定された閾値以上であるか否かを判定する判定ステップと、判定ステップにおいてセクタ数が閾値以上であると判定された場合に、基準メッシュデータの領域を分割した分割メッシュデータを作成するメッシュデータ作成ステップと、を含むことを特徴とする。
このような本発明のメッシュデータ作成方法によれば、所定の大きさを有する基準メッシュデータの領域内に含まれるサンプル数が閾値以上である場合に、基準メッシュデータの領域を分割した分割メッシュデータを作成する。すなわち、セクタ数が多い部分はメッシュデータの領域を細かく、セクタ数が少ない部分はメッシュデータの領域を粗く表現することができる。また、セクタ数が閾値以上である場合に基準メッシュデータの領域を分割するので、必要以上に領域が大きくなることがなく、特にセクタ数が多い部分を詳細に表すことができる。以上により、メッシュを細かくしすぎて精度を落としてしまったり、逆にメッシュを粗くしすぎることにより粒度を失い、その結果でセクタの密度の詳細な把握ができなかったりすることを防ぎ、精度と粒度との間のバランスを取りながらもセクタの密度を適切に表現することが可能となる。
また、人口情報を有するセクタ情報に示されるセクタ領域とメッシュデータの領域とが重なる面積比に応じて、セクタ単位の人口情報からメッシュデータの領域単位の人口情報に変換する変換ステップを更に含むことが好適である。
この場合には、セクタ情報が有する人口情報を、メッシュデータに好適に反映させることができる。なお、セクタ領域とは、基地局のセルを所定の角度で区分した領域である。
本発明によれば、精度と粒度との間のバランスを取りながらも人口密度を適切に表現することができる。
以下、添付図面を参照して本発明に係るメッシュデータ作成方法の好適な実施形態を詳細に説明する。なお、図面の説明において同一の要素には同一の符号を付し、重複する説明を省略する。
[第1実施形態]
まず、本発明の第1実施形態に係るメッシュデータ作成方法について説明する。本実施形態に係るメッシュデータ作成方法は、メッシュデータ作成システムによって実現される。このメッシュデータ作成システムは、通信システムによって取得された移動機(携帯電話機)の位置情報(位置ポイントデータ)に基づいて、地図上にマッピング処理を行い、メッシュデータを作成する。そこで、最初に通信システムについて説明する。
まず、本発明の第1実施形態に係るメッシュデータ作成方法について説明する。本実施形態に係るメッシュデータ作成方法は、メッシュデータ作成システムによって実現される。このメッシュデータ作成システムは、通信システムによって取得された移動機(携帯電話機)の位置情報(位置ポイントデータ)に基づいて、地図上にマッピング処理を行い、メッシュデータを作成する。そこで、最初に通信システムについて説明する。
図1は、通信システムの概略を示す図である。同図に示すように、通信システム10は、移動機20と、BTS(基地局)30と、RNC(無線ネットワーク制御装置)40と、交換機50と、管理センタ60とを含んで構成されている。また、この管理センタ60は、社会センサユニット601と、ペタマイニングユニット602と、モバイルデモグラフィユニット603と、可視化ソリューションユニット604とから構成されている。
交換機50は、BTS30、RNC40を介して、移動機20の位置情報を収集する。RNC40は、移動機20との間で通信接続が行われる際に、RRCコネクション要求信号における遅延値を用いて移動機20の位置を測定することができる。交換機50は、このように測定された移動機20の位置情報を、移動機20が通信接続を実行する際に受け取ることができる。交換機50は受け取った位置情報を記憶しておき、所定のタイミング、または管理センタ60からの要求に応じて収集した位置情報を管理センタ60に出力する。ここで、一般的に、RNC40は、約千個からなるものであり、日本全国に配置されている。一方で、交換機50は、300個程度日本国内に配置されている。
管理センタ60は、上述したとおり、社会センサユニット601、ペタマイニングユニット602、モバイルデモグラフィユニット603、及び可視化ソリューションユニット604を含んで構成されており、各ユニットでは、移動機20の位置情報を用いた統計処理を行う。
社会センサユニット601は、各交換機50から移動機20の位置情報等を含んだデータを収集するサーバ装置である。この社会センサユニット601は、交換機50から定期的に出力されたデータを受信したり、または社会センサユニット601において予め定められたタイミングに従って交換機50にデータ送信を要求したりできるように構成されている。
ペタマイニングユニット602は、社会センサユニット601から受信したデータを所定のデータ形式に変換するサーバ装置である。例えば、ペタマイニングユニット602は、ユーザIDをキーにソーティング処理を行ったり、エリアごとにソーティング処理を行ったりする。
モバイルデモグラフィユニット603は、ペタマイニングユニット602において処理されたデータに対する集計処理、すなわち各項目のカウンティング処理を行うサーバ装置である。例えば、モバイルデモグラフィユニット603は、あるエリアに在圏するユーザ数をカウントしたり、また在圏分布を集計したりすることができる。
可視化ソリューションユニット604は、モバイルデモグラフィユニット603において集計処理されたデータを可視可能に処理するサーバ装置である。可視化ソリューションユニット604は、集計されたデータを地図上にマッピング処理することができる。この可視化ソリューションユニット604にて処理されたデータは、企業、官公庁または個人等のユーザ端末2(後述)からの要求に応じて提供され、店舗開発、道路交通調査、災害対策、環境対策などに利用される。なお、このように統計処理された情報は、当然にプライバシーを侵害しないように個人等は特定されないように加工されている。
なお、社会センサユニット601、ペタマイニングユニット602、モバイルデモグラフィユニット603及び可視化ソリューションユニット604はいずれも、前述したようにサーバ装置により構成され、図示は省略するが、通常の情報処理装置の基本構成(即ち、CPU、RAM、ROM、キーボードやマウス等の入力デバイス、外部との通信を行う通信デバイス、情報を記憶する記憶デバイス、及び、ディスプレイやプリンタ等の出力デバイス)を備えることは言うまでもない。また、後述するユーザ端末2においても、サーバ装置と同様に通常の情報処理装置の基本構成を備える。
続いて、メッシュデータ作成システムついて説明する。図2は、メッシュデータ作成システムの概要を示す図である。図2に示すように、メッシュデータ作成システム1は、ユーザ端末2と、サーバ装置3とを含んで構成されている。ユーザ端末2とサーバ装置3とは、通信ネットワークNを介して互いに通信可能に接続されている。
ユーザ端末2は、ユーザの操作によってサーバ装置3に人口密度に関する情報の提供を要求し、この要求に応じてサーバ装置3から送信される人口密度データを受信して表示する端末である。ユーザ端末2は、上述のように企業、官公庁または個人等によって操作される例えばパソコンや携帯端末である。
サーバ装置3は、ユーザ端末2からの情報要求に応じて、メッシュデータを作成し、このメッシュデータ及び人口データを地図データにマッピングした人口密度データをユーザ端末2に送信する機能を有する装置である。サーバ装置3は、上述した可視化ソリューションユニット604に相当する。
次に、ユーザ端末2について詳細に説明する。ユーザ端末2は、機能的には、入力部201と、送信部202と、受信部203と、表示部204とを備えて構成されている。
入力部201は、ユーザからの操作を受け付けるものである。入力部201は、ユーザからの操作を受け付け、そのユーザの入力操作に応じた人口密度表示要求情報を生成し、この人口密度表示要求情報を送信部202に出力する。なお、入力部201によって生成される人口密度表示要求情報には、人口密度を表示する際のメッシュ領域の最小メッシュサイズを指定する最小サイズ指定情報、メッシュ領域のメッシュサイズを指定するサイズ指定情報、位置情報を取得する時間幅を指定する時間幅指定情報、及び人口密度データの連続表示を要求する連続表示要求情報なども含まれる。
送信部202は、入力部201から出力された人口密度表示要求情報を受け取ると、この人口密度表示要求情報をサーバ装置3に送信するものである。
受信部203は、送信部202から人口密度表示要求情報を送信したことに応じてサーバ装置3から送信される人口密度データを受信するものである。受信部203は、受信した人口密度データを表示部204に出力する。
表示部204は、例えばディスプレイであり、受信部203から出力された人口密度データを受け取ると、この人口密度データに応じた画像表示を行うものである。表示部204に表示される画像の詳細については後述する。
次に、サーバ装置3について詳細に説明する。サーバ装置3は、機能的には、受信部301と、基準メッシュデータ作成部302と、時間幅算出部303と、位置情報取得部304と、データ保存部305と、判定部306と、メッシュデータ作成部307と、サイズ判定部308と、サイズ調整部309と、人口密度データ作成部310と、送信部311とを備えている。
受信部301は、ユーザ端末2から送信された人口密度表示要求情報を受信するものである。受信部301は、受信した人口密度表示要求情報を基準メッシュデータ作成部302、時間幅算出部303、位置情報取得部304、及びサイズ判定部308に出力する。
基準メッシュデータ作成部302は、受信部301から人口密度表示要求情報を受け取ると、基準メッシュデータを作成するものである。この基準メッシュデータは、メッシュ状に区分され、所定のサイズを有する略正方形状の領域を有するデータである。基準メッシュデータ作成部302は、人口密度データを作成する領域に対応する数の基準メッシュデータを作成する。基準メッシュデータ作成部302は、作成した基準メッシュデータを判定部306及びメッシュデータ作成部307に出力する。
時間幅算出部303は、受信部301から出力された人口密度表示要求情報にサイズ指定情報が含まれている場合に、そのサイズ指定情報が示すメッシュ領域のメッシュサイズを実現するために必要な位置情報を取得するための最小の時間幅を算出するものである。時間幅算出部303は、後述するメッシュデータ作成部307によって作成されたメッシュデータのメッシュ領域のメッシュサイズとサイズ指定情報が示すメッシュ領域のメッシュサイズとを検出して比較することで、位置情報の取得に必要な時間幅を算出する。時間幅算出部303は、算出した時間幅を示す時間幅情報を位置情報取得部304に出力する。
位置情報取得部304は、位置情報を取得するものである。位置情報取得部304は、受信部301から出力された人口密度表示要求情報を受け取ると、この人口密度表示要求情報に応じた位置情報をデータ保存部305から取得する。また位置情報取得部304は、受信部301から出力された人口密度表示要求情報に時間幅情報が含まれている場合、或いは時間幅算出部303から出力された時間幅情報を受け取ると、その時間幅情報に応じて位置情報を取得する。具体的には、位置情報取得部304は、時間幅情報に応じた時間に対応する位置情報を、データ保存部305に保存されている位置情報の中から抜き出す処理を行うことで、位置情報を取得する。位置情報取得部304は、取得した位置情報を判定部306及び人口密度データ作成部310に出力する。
データ保存部305は、上述のように位置情報を保存するものである。データ保存部305は、通信システム10によって取得された移動機の位置情報を保存する。また、データ保存部305は、後述する人口密度データ作成部310によって作成された人口密度データを保存する。
判定部306は、基準メッシュデータ作成部302から出力された基準メッシュデータを受け取ると共に、位置情報取得部304から出力された位置情報を受け取ると、位置情報に基づいてサンプル数を特定してカウントし、このサンプル数が基準メッシュデータの領域内において閾値以上であるか否かを判定するものである。閾値は、例えば400に設定されている。判定部306は、サンプル数が閾値以上であると判定した場合には、基準メッシュデータの領域の分割を指示する分割指示情報をメッシュデータ作成部307に出力する。
メッシュデータ作成部307は、基準メッシュデータ作成部302によって作成された基準メッシュデータに基づいて、分割メッシュデータを作成するものである。メッシュデータ作成部307は、判定部306から出力された分割指示情報を受け取ると、この分割指示情報に基づいて基準メッシュデータの領域を分割した分割メッシュデータを作成する。具体的には、図3を参照しながら説明する。図3は、分割メッシュデータを示す図である。同図に示すように、メッシュデータ作成部307は、基準メッシュデータのメッシュ領域Mを例えば4分割した分割メッシュデータD1~D4を作成する。また、メッシュデータ作成部307は、受信部301から出力された人口密度表示要求情報に最小サイズ指定情報が含まれている場合に、分割メッシュデータのメッシュ領域が最小サイズ指定情報の示すメッシュ領域のサイズよりも小さくならないように分割メッシュデータを作成する。メッシュデータ作成部307は、作成した分割メッシュデータを人口密度データ作成部310に出力する。なお、メッシュデータの分割数は、任意に設定される。
サイズ判定部308は、受信部301から出力された人口密度表示要求情報に連続表示要求情報が含まれている場合、すなわちユーザから人口密度データの連続表示(アニメーション)を要求された場合に、異なる複数の時間帯における位置情報に基づいて作成された複数のメッシュデータを比較し、同一の位置(同一の緯度経度)における複数のメッシュデータの各領域のサイズが同一であるか否かを判定するものである。具体的に、サイズ判定部308は、人口密度データ作成部310によって生成され、データ保存部305に保存されている異なる複数の時間帯の人口密度データにおいて、同一の位置における複数のメッシュデータの各メッシュ領域のメッシュサイズが同一でないと判定した場合に、その旨を示す判定情報をサイズ調整部309に出力する。
サイズ調整部309は、メッシュデータのメッシュ領域のメッシュサイズを調整するものである。サイズ調整部309は、サイズ判定部308から出力された判定情報を受け取ると、異なる複数の時間帯におけるメッシュデータの各メッシュ領域のメッシュサイズが同一となるように、複数のメッシュデータの各領域のサイズを調整する。具体的に、サイズ調整部309は、複数の人口密度データから各メッシュデータを取得し、表示される全ての時間帯において表示区域内の各メッシュデータのメッシュ領域のメッシュサイズが同一となるように各メッシュ領域のメッシュサイズを調整する。サイズ調整部309は、サイズ調整後のメッシュデータを人口密度データ作成部310に出力する。
人口密度データ作成部310は、人口密度データを作成するものである。人口密度データ作成部310は、基準メッシュデータ作成部302から出力された基準メッシュデータと、位置情報取得部304から出力された位置情報とに基づいて、人口密度データを作成する。また、人口密度データ作成部310は、メッシュデータ作成部307から出力された分割メッシュデータを受け取ると、この分割メッシュデータと位置情報とに基づいて、人口密度データを作成する。より具体的には、人口密度データ作成部310は、基準メッシュデータ或いは分割メッシュデータ及びそのメッシュデータに対応する位置情報(人口データ)を地図データにマッピングし、人口密度データを作成する。また、人口密度データ作成部310は、サイズ調整部309からメッシュデータが出力された場合には、そのメッシュデータに基づいた人口密度データを作成する。人口密度データ作成部310は、作成した人口密度データを送信部311に出力する。また、人口密度データ作成部310は、作成した人口密度データをデータ保存部305に出力する。
送信部311は、人口密度データ作成部310から出力された人口密度データを受け取ると、この人口密度データをユーザ端末2に送信する。また、送信部311は、データ保存部305に保存されている人口密度データをユーザ端末2に送信する。
続いて、メッシュデータ作成システム1により行われる動作について、図4及び図5を参照しながら説明する。図4は、メッシュデータ作成システム1の動作の一例を示すシーケンスである。図5は、メッシュデータ作成処理を示すフローチャートである。なお、以下の説明においては、ユーザからの人口密度表示の要求後に、人口密度データが作成される様態について説明する。
図4に示すように、まずユーザ端末2から人口密度の表示を要求する人口密度表示要求情報がサーバ装置3に送信される(ステップS01)。この人口表示要求情報が受信されたサーバ装置3では、メッシュデータ作成処理が実施される(ステップS02)。メッシュデータ作成処理について、図5を参照しながら説明する。
図5に示すように、メッシュデータ作成処理が実施されると、まず基準メッシュデータ作成部302によって基準メッシュデータが作成される(ステップS11)。次に、作成された基準メッシュデータのメッシュ領域内に含まれる位置情報が位置情報取得部304によって取得される(ステップS12)。位置情報が取得されると、この位置情報に基づいて、基準メッシュデータのメッシュ領域内に存在するサンプル数が特定されてカウントされ(ステップS13)、このサンプル数が閾値(例えば400)以上であるか否かが判定部306によって判定される(ステップS14)。サンプル数が閾値以上であると判定された場合には、ステップS15に進む。一方、サンプル数が閾値以上であると判定されなかった場合には、基準メッシュデータがメッシュデータとして作成される(ステップS16)。
ステップS15では、メッシュデータ作成部307によって、基準メッシュデータのメッシュ領域が分割された分割メッシュデータが作成される。以上のように、メッシュデータ作成処理が実施される。
図4に戻って、サーバ装置3において、メッシュデータ作成処理によって作成されたメッシュデータに基づいて、人口密度データが作成される(ステップS03)。そして、作成された人口密度データが送信部311によってサーバ装置3からユーザ端末2に送信される(ステップS04)。この人口密度データを受信したユーザ端末2では、人口密度データに応じた画像が表示部に表示される(ステップS05)。なお、図4での図示はしないが、ユーザ端末2から人口密度表示要求情報がサーバ装置3に送信された場合に、サーバ装置3において予め作成されてデータ保存部305に保存されている人口密度データが送信されてもよい。
図6は、ユーザ端末2に表示される人口密度データの一例を示す図である。同図に示すように、ユーザ端末2の表示部204に表示される人口密度データに基づいた画像には、地図上にサンプル数に基づいて作成された複数のメッシュデータのメッシュ領域がマッピングされている。このメッシュ領域においては、色分けや色の濃淡により、位置情報に基づいて求められた人口密度を示している。図6において、メッシュ領域のサイズが小さいところは、人口密度が高いことを示し、メッシュ領域のサイズが大きいところは、人口密度が低いことを示している。
次に、ユーザからメッシュ領域の最小サイズが指定された場合、つまり図4のステップS01において人口密度表示要求情報に最小サイズ指定情報が含まれていた場合のメッシュデータ作成方法について、図7を参照しながら説明する。図7は、最小メッシュサイズが指定された場合におけるメッシュデータ作成処理を示すフローチャートである。なお、図5のフローチャートと同様の処理(ステップS21~ステップS23)については、説明を省略する。
図7に示すように、ステップS24では、位置情報に基づいて、基準メッシュデータのメッシュ領域内に存在するサンプル数が特定され、このサンプル数が閾値(例えば400)以上で、且つメッシュデータのメッシュ領域のメッシュサイズが最小メッシュサイズ以上であるか否かが判定部306によって判定される。サンプル数が閾値以上で、且つ最小メッシュサイズ以上であると判定された場合には、メッシュデータ作成部307によって、基準メッシュデータのメッシュ領域が分割された分割メッシュデータが作成され(ステップS25)、ステップS23の処理に戻る。一方、サンプル数が閾値以上で、且つ最小メッシュサイズ以上あると判定されなかった場合には、メッシュデータが作成される(ステップS26)。
次に、ユーザからメッシュデータにおけるメッシュ領域のメッシュサイズが指定された場合、つまり図4のステップS01において人口密度表示情報にサイズ指定情報が含まれていた場合のメッシュデータ作成方法について、図8を参照しながら説明する。図8は、メッシュサイズが指定された場合におけるメッシュデータ作成処理を示すフローチャートである。
図8に示すように、まず位置情報が位置情報取得部304によって取得される(ステップS31)。次に、取得された位置情報に対して、時間による抽出が行われる。つまり、ステップS31にて取得された位置情報のうち、予め設定された時間幅に該当する位置情報だけが抽出される(ステップS32)。
続いて、基準メッシュデータ作成部302によって基準メッシュデータが作成される(ステップS33)。そして、作成された基準メッシュデータの領域内に含まれる位置情報に基づいて、基準メッシュデータのメッシュ領域内に存在するサンプル数が特定されてカウントされ(ステップS34)、このサンプル数が閾値(例えば400)以上であるか否かが判定部306によって判定される(ステップS35)。サンプル数が閾値以上であると判定された場合には、メッシュデータ作成部307によって、基準メッシュデータのメッシュ領域が分割された分割メッシュデータが作成され(ステップS36)、ステップS34の処理に戻る。サンプル数が閾値以上であると判定されなかった場合には、メッシュデータが作成される(ステップS37)。
次に、ステップS37においてメッシュデータが作成されると、表示範囲におけるメッシュデータのメッシュ領域が切り出される(ステップS38)。表示範囲とは、ユーザ端末2の表示部204おける表示範囲を示している。そして、切り出されたメッシュ領域において、表示範囲における最大のメッシュサイズが取得され(ステップS39)、この最大のメッシュサイズがユーザから指定された要求メッシュサイズを満たしているか否かが判定される(ステップS40)。ユーザの要求メッシュサイズを満たしていると判定された場合には、処理が終了する。一方、ユーザの要求メッシュサイズを満たしていると判定されなかった場合には、時間幅が拡大され(ステップS41)、当該拡大された時間幅をもってステップS32の処理に戻る。
続いて、ユーザから位置情報を取得する時間幅が指定された場合、つまり図4のステップS01において人口密度表示情報に時間幅指定情報が含まれていた場合のメッシュデータ作成方法について、図9を参照しながら説明する。図9は、位置情報を取得する時間幅が指定された場合におけるメッシュデータ作成処理を示すフローチャートである。
図9に示すように、まずユーザから指定された時間幅情報に基づいて、時間幅が設定される(ステップS51)。次に、位置情報が位置情報取得部304によって取得される(ステップS52)。そして、取得された位置情報に対して、時間による抽出が行われる。つまり、ステップS52にて取得された位置情報のうち、ステップS51にて設定された時間幅に該当する位置情報だけが抽出される(ステップS53)。
続いて、基準メッシュデータ作成部302によって基準メッシュデータが作成される(ステップS54)。そして、作成された基準メッシュデータのメッシュ領域内に含まれる位置情報に基づいて、基準メッシュデータのメッシュ領域内に存在するサンプル数が特定されてカウントされ(ステップS55)、このサンプル数が閾値(例えば400)以上であるか否かが判定部306によって判定される(ステップS56)。
サンプル数が閾値以上であると判定された場合には、メッシュデータ作成部307によって、基準メッシュデータのメッシュ領域が分割された分割メッシュデータが作成され(ステップS57)、ステップS55の処理に戻る。サンプル数が閾値以上であると判定されなかった場合には、メッシュデータが作成される(ステップS58)。なお、作成されたメッシュデータは、表示範囲におけるメッシュデータのメッシュ領域の例えば最大メッシュサイズとなるように、メッシュ領域のメッシュサイズが調整されてもよい。
続いて、ユーザから人口密度データの連続表示が要求された場合、つまり図4のステップS01において人口密度表示情報に連続表示要求が含まれていた場合のメッシュデータ作成方法について、図10を参照しながら説明する。図10は、人口密度データの連続表示が要求された場合におけるメッシュデータ作成処理を示すフローチャートである。なお、以下の説明においては、人口密度データ作成部310によって作成された人口密度データが予めデータ保存部305に保存されているものとする。
図10に示すように、まず異なる複数の時間帯の人口密度データがデータ保存部305から取得され、その各人口密度データからメッシュデータが取得される(ステップS61)。次に、取得された各メッシュデータにおいて、同一の位置におけるメッシュ領域のメッシュサイズが比較される(ステップS62)。そして、同一の位置において異なるメッシュサイズのメッシュ領域があるか否かがサイズ判定部308によって判定される(ステップS63)。
同一の位置において異なるサイズのメッシュ領域があると判定された場合には、その該当するメッシュ領域のメッシュサイズを他のメッシュ領域のメッシュサイズと同一のメッシュサイズになるように、メッシュサイズがサイズ調整部309によって調整される(ステップS64)。一方、同一の位置において異なるメッシュサイズのメッシュ領域があると判定されなかった場合には、処理を終了する。なお、メッシュ領域のメッシュサイズは、表示範囲において最大メッシュサイズとなるようにメッシュサイズが調整されてもよい。
以上説明したように、本実施形態に係るメッシュデータ作成システム1におけるメッシュデータ作成方法によれば、所定の大きさを有する基準メッシュデータの領域内に含まれるサンプル数が閾値以上である場合に、基準メッシュデータの領域を分割した分割メッシュデータを作成する。すなわち、人口密度が高い部分はメッシュデータの領域を細かく、人口密度が低い部分はメッシュデータの領域を粗く表現することができる。また、サンプル数が閾値以上である場合に基準メッシュデータの領域を分割するので、必要以上に領域が大きくなることがなく、特に人口密度が高い部分を詳細に表すことができる。以上により、メッシュを細かくしすぎて精度を落としてしまったり、逆にメッシュを粗くしすぎることにより粒度を失い、その結果で人口密度の詳細な把握ができなかったりすることを防ぎ、精度と粒度との間のバランスを取りながらも人口密度を適切に表現することが可能となる。
また、本実施形態では、ユーザからメッシュデータのメッシュ領域の最小メッシュサイズの指定を受け付け、その指定された最小メッシュサイズよりもメッシュ領域のメッシュサイズが小さくならないようにメッシュデータを作成する。メッシュデータの領域内に存在するサンプル数が多い場合には、メッシュデータの領域のメッシュサイズが極端に小さくなることがある。そこで、ユーザから要求された最小メッシュサイズよりも小さくならないように分割メッシュデータを作成することにより、ユーザに対して適切な表示を行うことができる。
また、本実施形態では、ユーザが所望する領域のサイズにするために必要な位置情報を取得するための時間幅を算出し、この時間幅に応じて取得された位置情報に基づいてメッシュデータが作成されるので、ユーザのニーズに応じた表示を行うことができる。
また、本実施形態では、ユーザから指定された位置情報を取得する時間幅に応じて取得された位置情報に基づいてメッシュデータが作成されるので、ユーザが所望する時間幅に応じた表示を行うことができる。
ところで、異なる複数の時間において作成されたメッシュデータを連続して表示(アニメーション)する場合、それぞれの時間によって取得される位置情報のサンプル数が異なるため、時間によってメッシュデータの領域のメッシュサイズが異なり、一見して人口密度の変化を把握することが困難となる。そこで、本実施形態では、異なる時間において作成されたメッシュデータにおいて、同一の位置におけるメッシュデータの各メッシュ領域のメッシュサイズを同一となるようメッシュ領域のメッシュサイズを調整することで、複数の時間を連続して表示する際に、一見して人口密度の変化を把握することができる。
なお、本発明は上記実施形態に限定されるものではない。例えば、上記実施形態に加えて、表示範囲のメッシュデータのメッシュ領域のメッシュサイズが全て同一となるメッシュデータが作成されて表示されてもよい。具体的には、ユーザ端末2から送信された人口密度要求情報に、メッシュ領域のメッシュサイズを全て同じメッシュサイズにすることを指定する情報が含まれている場合には、データ保存部305に保存されている人口密度データを取得し、この人口密度データにおけるメッシュデータのメッシュ領域のメッシュサイズが全て同じメッシュサイズとなるようにメッシュデータを調整する。なお、ここでいう「同じメッシュサイズ」とは、本実施形態による上記の各処理が行われることにより算出された複数のメッシュサイズのうちの何れかを意味し、例えば画面に表示されている最大のメッシュサイズを意味する。そして、このメッシュデータを地図データにマッピングした人口密度データをユーザに送信する。これにより、メッシュ領域のメッシュサイズを全て同一のメッシュサイズとしたいユーザの要求に対応することが可能となる。
また、上記実施形態では、連続して人口密度データが表示される場合において、サイズ判定部308によって異なる複数の時間帯における位置情報に基づいて作成された複数のメッシュデータを比較し、同一の位置における複数のメッシュデータの各メッシュ領域のメッシュサイズが同一となるようにメッシュ調整部309がメッシュデータを調整しているが、例えば以下のような方法でメッシュデータが調整されてもよい。
具体的には、図11を参照しながら説明する。図11は、人口密度データの連続表示が要求された場合におけるメッシュデータ作成処理を示すフローチャートである。
図11に示すように、まず異なる複数の時間帯の人口密度データがデータ保存部305から取得され、その各人口密度データからメッシュデータが取得される(ステップS71)。次に、表示範囲における最大メッシュサイズが取得される(ステップS72)。そして、各メッシュデータのメッシュ領域のメッシュサイズを、最大のメッシュ領域のメッシュサイズとなるようにサイズ調整部309によってメッシュデータを調整する(ステップS73)。
以上のような方法であっても、異なる時間において作成されたメッシュデータにおいて、同一の位置におけるメッシュデータの各メッシュ領域のメッシュサイズを同一となるようメッシュサイズを調整することで、複数の時間を連続して表示する際に、一見して人口密度の変化を把握することができる。
[第2実施形態]
次に、本発明の第2実施形態に係るメッシュ作成方法について説明する。第2実施形態に係るメッシュ作成方法は、セクタ情報に基づいてメッシュデータが作成される点で、第1実施形態と異なる。なお、第1実施形態と同様の構成については同一の符号を付し、その説明を省略する。
次に、本発明の第2実施形態に係るメッシュ作成方法について説明する。第2実施形態に係るメッシュ作成方法は、セクタ情報に基づいてメッシュデータが作成される点で、第1実施形態と異なる。なお、第1実施形態と同様の構成については同一の符号を付し、その説明を省略する。
図12は、第2実施形態に係るメッシュデータ作成システムの概要を示す図である。図12に示すように、メッシュデータ作成システム1Aは、ユーザ端末2と、サーバ装置3Aとを含んで構成されている。ユーザ端末2とサーバ装置3Aとは、通信ネットワークNを介して互いに通信可能に接続されている。
サーバ装置3Aは、第1実施形態と異なる構成として、機能的には、セクタ情報取得部312と、判定部313と、人口密度変換部314とを備えている。
セクタ情報取得部312は、セクタが位置していることを示すセクタ情報を取得するものである。このセクタ情報は、人口情報を有している。セクタ情報取得部312は、受信部301から出力された人口密度表示要求情報を受け取ると、この人口密度表示要求情報に応じたセクタ情報をデータ保存部305から取得する。セクタ情報取得部312は、取得したセクタ情報を判定部313及び人口密度変換部314に出力する。
判定部313は、基準メッシュデータ作成部302から出力された基準メッシュデータを受け取ると共に、セクタ情報取得部312から出力されたセクタ情報を受け取ると、セクタ情報に基づいてセクタ数を特定してカウントし、このセクタ数が基準メッシュデータのメッシュ領域内において閾値以上であるか否かを判定するものである。閾値は、例えばメッシデータ作成部307によって作成される分割メッシデータにおけるセクタ数の0にならない程度の値に設定されている。判定部313は、セクタ数が閾値以上であると判定した場合には、基準メッシュデータの領域の分割を指示する分割指示情報をメッシュデータ作成部307に出力する。メッシュデータ作成部307では、判定部313から出力された分割指示情報に基づいて、分割メッシュデータを作成する。
人口密度変換部314は、セクタ情報が有する人口情報をメッシュデータに割り当て、セクタ情報が有する人口情報(人口データ)をメッシュデータにおける人口情報に変換するものである。具体的には、図13及び図14を参照しながら説明する。図13は、セクタ領域とメッシュ領域とを示す図である。図14は、セクタ情報の人口情報からメッシュデータの人口情報への変換を説明するための図である。
図13(a)は、セクタ情報に示されるセクタ領域を示している。同図に示すように、セクタ領域SRは、BTS(基地局)30のセルを所定の角度で区分した領域であり、多角形のポリゴンをなしている。この各セクタ領域SRには、どのセクタ領域であるのかを識別するためのセクタID(例えばS1)が付与されている。また、図13(b)は、メッシュデータのメッシュ領域MRを示している。同図に示すように、このメッシュ領域MRにも、どのメッシュ領域であるのを識別するためのメッシュID(例えばM1)が付与されている。
人口密度変換部314は、図13(c)に示すように、セクタ領域SRとメッシュ領域MRとを重ね合わせ、セクタ領域SRをメッシュ領域MRで分割する。そして、各セクタ領域SRの人口情報に示される人口密度をメッシュ領域MRによって分割された面積比に応じて、メッシュ領域MRに割り当てる。そして、各メッシュ領域MRに割り当てられた人口情報の合計を、そのメッシュ領域MRの人口情報とする。
上述の面積比に応じた人口情報の割り当てについて、図13及び図14を参照しながら更に詳細に説明する。図13に示すように、セクタ領域SRにおける一のセクタIDが例えばS1であり、メッシュ領域MRにおける一のメッシュIDが例えばM1であるとする。そして、図14(a)に示すように、セクタIDがS1のセクタ領域SRは、ポリゴン(形状)がSP1、その面積がA1、人口情報に示される人口がP1であるとする。また、図14(b)に示すように、メッシュIDがM1のメッシュ領域MRは、そのポリゴンがMP1であるとする。
以上のようなセクタ領域SRとメッシュ領域MRとを重ね合わせた場合、図14(c)に示すように、セクタ領域SRのポリゴンはSP2となる。具体的には、セクタ領域SRがメッシュ領域MRに分割され、セクタ領域MRの形状が変形する。このとき、その面積もメッシュ領域MRに分割されることで小さくなり、例えばA2となる。そして、この面積の変化に応じて、その面積に対して割り振られる人口も減少し、例えばP2となる。このP2は、(面積A2/面積A1)×P1によって求められる値である。従って、各セクタ領域SRの人口情報が、メッシュ領域MRによって分割された面積比に応じてメッシュ領域MRに割り当てられることになる。このようにして割り当てられた人口情報を足し合わせることで、人口情報を有さないメッシュ領域MRに対して人口情報を与えることができる。
以上説明したように、本実施形態に係るメッシュデータ作成システム1Aにおけるメッシュデータ作成方法によれば、所定の大きさを有する基準メッシュデータの領域内に含まれるサンプル数が閾値以上である場合に、基準メッシュデータの領域を分割した分割メッシュデータを作成する。すなわち、セクタ数が多い部分はメッシュデータの領域を細かく、セクタ数が少ない部分はメッシュデータの領域を粗く表現することができる。また、セクタ数が閾値以上である場合に基準メッシュデータの領域を分割するので、必要以上に領域が大きくなることがなく、特にセクタ数が多い部分を詳細に表すことができる。以上により、メッシュを細かくしすぎて精度を落としてしまったり、逆にメッシュを粗くしすぎることにより粒度を失い、その結果でセクタの密度の詳細な把握ができなかったりすることを防ぎ、精度と粒度との間のバランスを取りながらもセクタの密度を適切に表現することが可能となる。
また、人口情報を有するセクタ情報に示されるセクタ領域とメッシュデータの領域とが重なる面積比に応じて、セクタ単位の人口情報からメッシュデータの領域単位の人口情報に変換するので、セクタ情報が有する人口情報を、メッシュデータに好適に反映させることができる。
M…基準メッシュデータ、MR…メッシュ領域、D…分割メッシュデータ、SR…セクタ領域。
Claims (8)
- 人口密度を表すためのメッシュデータを作成するメッシュデータ作成方法であって、
所定のサイズを有する基準メッシュデータを作成する基準メッシュデータ作成ステップと、
前記基準メッシュデータ作成ステップにおいて作成された前記基準メッシュデータの領域内に含まれる位置情報を取得する位置情報取得ステップと、
前記位置情報取得ステップにおいて取得された前記位置情報に基づいて、前記基準メッシュデータの前記領域内に存在するサンプル数を特定し、当該サンプル数が予め設定された閾値以上であるか否かを判定する判定ステップと、
前記判定ステップにおいて前記サンプル数が前記閾値以上であると判定された場合に、前記基準メッシュデータの前記領域を分割した分割メッシュデータを作成するメッシュデータ作成ステップと、を含むことを特徴とするメッシュデータ作成方法。 - ユーザから前記メッシュデータの前記領域の最小サイズを指定する要求を受け付ける最小サイズ受付ステップを更に含み、
前記メッシュデータ作成ステップにおいて、前記基準メッシュデータの前記領域が前記最小サイズ受付ステップにおいて前記ユーザから要求された前記最小サイズよりも小さくならないように、前記分割メッシュデータを作成することを特徴とする請求項1記載のメッシュデータ作成方法。 - ユーザから前記メッシュデータの前記領域のサイズを指定する要求を受け付けるサイズ受付ステップと、
前記サイズ受付ステップにおいて前記ユーザから要求された前記領域のサイズとするために必要な前記位置情報を取得するための時間幅を算出する時間幅算出ステップと、を更に含み、
前記位置情報取得ステップにおいて、前記時間幅算出ステップにおいて算出された前記時間幅に応じて、前記位置情報を取得することを特徴とする請求項1記載のメッシュデータ作成方法。 - ユーザから前記位置情報を取得する時間幅を指定する要求を受け付ける時間幅受付ステップを更に含み、
前記位置情報取得ステップにおいて、前記時間幅受付ステップにおいて前記ユーザから要求された前記時間幅に応じて、前記位置情報を取得することを特徴とする請求項1記載のメッシュデータ作成方法。 - 異なる複数の時間帯における前記位置情報に基づいて作成された複数のメッシュデータを比較し、同一の位置における前記複数のメッシュデータの各領域のサイズが同一であるか否かを判定するサイズ判定ステップと、
前記サイズ判定ステップにおいて前記各領域のサイズが同一でないと判定された場合に、前記異なる複数の時間帯における前記メッシュデータの前記各領域のサイズが同一となるように、前記複数のメッシュデータの各領域のサイズを調整するサイズ調整ステップと、を更に含むことを特徴とする請求項1~4のいずれか一項記載のメッシュデータ作成方法。 - 異なる複数の時間帯における前記位置情報に基づいて作成された複数のメッシュデータを取得し、同一の位置における前記複数のメッシュデータの各領域のサイズが予め設定された所定のサイズとなるように、前記複数のメッシュデータの各領域のサイズを調整するサイズ調整ステップを更に含むことを特徴とする請求項1~4のいずれか一項記載のメッシュデータ作成方法。
- 人口密度を表すためのメッシュデータを作成するメッシュデータ作成方法であって、
所定のサイズを有する基準メッシュデータを作成する基準メッシュデータ作成ステップと、
前記基準メッシュデータ作成ステップにおいて作成された前記基準メッシュデータの領域内に含まれるセクタが位置していることを示すセクタ情報を取得するセクタ情報取得ステップと、
前記セクタ情報取得ステップにおいて取得された前記セクタ情報に基づいて、前記基準メッシュデータの前記領域内に存在するセクタ数を特定し、当該セクタ数が予め設定された閾値以上であるか否かを判定する判定ステップと、
前記判定ステップにおいて前記セクタ数が前記閾値以上であると判定された場合に、前記基準メッシュデータの領域を分割した分割メッシュデータを作成するメッシュデータ作成ステップと、を含むことを特徴とするメッシュデータ作成方法。 - 人口情報を有する前記セクタ情報に示されるセクタ領域と前記メッシュデータの領域とが重なる面積比に応じて、セクタ単位の人口情報から前記メッシュデータの領域単位の人口情報に変換する変換ステップを更に含むことを特徴とする請求項7記載のメッシュデータ作成方法。
Priority Applications (2)
| Application Number | Priority Date | Filing Date | Title |
|---|---|---|---|
| US13/258,073 US8600957B2 (en) | 2009-04-10 | 2010-03-23 | Mesh data creation method |
| EP10761588.2A EP2418615A4 (en) | 2009-04-10 | 2010-03-23 | METHOD FOR CREATING MESH DATA |
Applications Claiming Priority (2)
| Application Number | Priority Date | Filing Date | Title |
|---|---|---|---|
| JP2009095781A JP5084776B2 (ja) | 2009-04-10 | 2009-04-10 | メッシュデータ作成方法 |
| JP2009-095781 | 2009-04-10 |
Publications (1)
| Publication Number | Publication Date |
|---|---|
| WO2010116888A1 true WO2010116888A1 (ja) | 2010-10-14 |
Family
ID=42936174
Family Applications (1)
| Application Number | Title | Priority Date | Filing Date |
|---|---|---|---|
| PCT/JP2010/054969 WO2010116888A1 (ja) | 2009-04-10 | 2010-03-23 | メッシュデータ作成方法 |
Country Status (4)
| Country | Link |
|---|---|
| US (1) | US8600957B2 (ja) |
| EP (1) | EP2418615A4 (ja) |
| JP (1) | JP5084776B2 (ja) |
| WO (1) | WO2010116888A1 (ja) |
Cited By (2)
| Publication number | Priority date | Publication date | Assignee | Title |
|---|---|---|---|---|
| JP2016031589A (ja) * | 2014-07-28 | 2016-03-07 | 株式会社インテック | 情報処理システム、情報処理方法及びプログラム |
| CN111738894A (zh) * | 2020-07-29 | 2020-10-02 | 武大吉奥信息技术有限公司 | 一种构建平衡网格的方法、系统和终端设备 |
Families Citing this family (5)
| Publication number | Priority date | Publication date | Assignee | Title |
|---|---|---|---|---|
| CA2769586C (en) * | 2009-07-31 | 2020-07-28 | Bce Inc. | Method and system for controlling media conveyance by a device to a user based on current location of the device |
| CN103154980A (zh) * | 2011-01-31 | 2013-06-12 | 株式会社Ntt都科摩 | 加入终端数量估计装置及加入终端数量估计方法 |
| JP5770667B2 (ja) * | 2012-03-27 | 2015-08-26 | 株式会社ゼンリンデータコム | 情報検索システムおよび情報検索装置 |
| JP6998819B2 (ja) * | 2018-04-02 | 2022-01-18 | Kddi株式会社 | 分布した各点の有する値の分布情報を生成する装置、プログラム及び方法 |
| CN110427531B (zh) * | 2019-07-19 | 2022-07-01 | 清华大学 | 对多个样本进行网格布局可视化的方法和系统 |
Citations (5)
| Publication number | Priority date | Publication date | Assignee | Title |
|---|---|---|---|---|
| JPH1125292A (ja) * | 1997-07-02 | 1999-01-29 | Hitachi Eng Co Ltd | メッシュ分割装置及び分割方法 |
| JP2001229186A (ja) | 2000-02-18 | 2001-08-24 | Dainippon Printing Co Ltd | 地図複合情報作成システム |
| JP2002189834A (ja) * | 2000-12-22 | 2002-07-05 | Fujitsu Social Science Laboratory Ltd | 地理的代替点決定システム及び方法並びに地理的代替点決定プログラムを記録した記録媒体 |
| JP2003091620A (ja) * | 2001-09-19 | 2003-03-28 | Kao Corp | 統計情報集計装置 |
| JP2003167881A (ja) * | 2001-12-04 | 2003-06-13 | Kao Corp | 統計情報集計装置 |
Family Cites Families (6)
| Publication number | Priority date | Publication date | Assignee | Title |
|---|---|---|---|---|
| US6137492A (en) * | 1997-04-03 | 2000-10-24 | Microsoft Corporation | Method and system for adaptive refinement of progressive meshes |
| JP2001000055A (ja) | 1999-06-23 | 2001-01-09 | Matsushita Seiko Eng Kk | 伸縮式防霜ファン |
| JP2005122387A (ja) * | 2003-10-15 | 2005-05-12 | Fujitsu Ltd | メッシュ分割装置およびメッシュ分割プログラム |
| JP4771822B2 (ja) * | 2006-02-08 | 2011-09-14 | 富士通株式会社 | 数値解析メッシュ生成装置、数値解析メッシュ生成方法、数値解析メッシュ生成プログラム |
| US8386211B2 (en) * | 2008-08-15 | 2013-02-26 | International Business Machines Corporation | Monitoring virtual worlds to detect events and determine their type |
| US8983808B2 (en) * | 2008-10-15 | 2015-03-17 | The United States Of America, As Represented By The Secretary Of The Navy | Automated mesh generation and editing tools |
-
2009
- 2009-04-10 JP JP2009095781A patent/JP5084776B2/ja not_active Expired - Fee Related
-
2010
- 2010-03-23 US US13/258,073 patent/US8600957B2/en not_active Expired - Fee Related
- 2010-03-23 WO PCT/JP2010/054969 patent/WO2010116888A1/ja active Application Filing
- 2010-03-23 EP EP10761588.2A patent/EP2418615A4/en not_active Withdrawn
Patent Citations (5)
| Publication number | Priority date | Publication date | Assignee | Title |
|---|---|---|---|---|
| JPH1125292A (ja) * | 1997-07-02 | 1999-01-29 | Hitachi Eng Co Ltd | メッシュ分割装置及び分割方法 |
| JP2001229186A (ja) | 2000-02-18 | 2001-08-24 | Dainippon Printing Co Ltd | 地図複合情報作成システム |
| JP2002189834A (ja) * | 2000-12-22 | 2002-07-05 | Fujitsu Social Science Laboratory Ltd | 地理的代替点決定システム及び方法並びに地理的代替点決定プログラムを記録した記録媒体 |
| JP2003091620A (ja) * | 2001-09-19 | 2003-03-28 | Kao Corp | 統計情報集計装置 |
| JP2003167881A (ja) * | 2001-12-04 | 2003-06-13 | Kao Corp | 統計情報集計装置 |
Cited By (2)
| Publication number | Priority date | Publication date | Assignee | Title |
|---|---|---|---|---|
| JP2016031589A (ja) * | 2014-07-28 | 2016-03-07 | 株式会社インテック | 情報処理システム、情報処理方法及びプログラム |
| CN111738894A (zh) * | 2020-07-29 | 2020-10-02 | 武大吉奥信息技术有限公司 | 一种构建平衡网格的方法、系统和终端设备 |
Also Published As
| Publication number | Publication date |
|---|---|
| JP5084776B2 (ja) | 2012-11-28 |
| EP2418615A4 (en) | 2015-06-10 |
| JP2010250358A (ja) | 2010-11-04 |
| US20120066266A1 (en) | 2012-03-15 |
| US8600957B2 (en) | 2013-12-03 |
| EP2418615A1 (en) | 2012-02-15 |
Similar Documents
| Publication | Publication Date | Title |
|---|---|---|
| JP5084776B2 (ja) | メッシュデータ作成方法 | |
| EP3272144B1 (en) | Connection technology-based wireless coverage verification | |
| US6879835B2 (en) | Location-specific messaging system | |
| US7047131B2 (en) | Apparatus and method for displaying detailed map of selected area | |
| EP3629163A1 (en) | Load balance scheduling method and device, and computer readable storage medium | |
| US10986508B2 (en) | Enhanced network performance and/or capability information related to both a mobile communication network and a user equipment within the mobile communication network | |
| US11811586B2 (en) | Method and apparatus for configuring alarm rule of IoT device, device, and storage | |
| CN113094601B (zh) | 一种gis云管理方法及系统 | |
| EP2976750B1 (en) | Geospatial smoothing in web applications | |
| CN110087185A (zh) | 商圈围栏生成方法、装置、设备及计算机可读存储介质 | |
| KR20010100609A (ko) | 지리정보 시스템의 지도정보 제공방법 | |
| CN113052198A (zh) | 一种数据处理方法、装置、设备及存储介质 | |
| CN109992637A (zh) | 一种规划移动调研系统 | |
| CN115935060A (zh) | 网点布局位置筛选方法、装置和计算机设备 | |
| WO2020235523A1 (ja) | データ処理装置、データ処理方法、データ処理プログラム、制御プログラムおよび端末装置 | |
| CN111723169B (zh) | 一种地图显示方法、装置、电子设备和存储介质 | |
| WO2019038905A1 (ja) | 情報処理装置、情報処理方法、およびプログラム | |
| Lemelson et al. | A study on user acceptance of error visualization techniques | |
| CN114257755A (zh) | 图像处理方法、装置、设备及存储介质 | |
| JP2013058176A (ja) | 通信サービスにおける地理的領域の価値を判定するサーバ装置及びプログラム | |
| KR100527682B1 (ko) | 3차원 지리정보 처리방법 및 그 장치 | |
| WO2023090360A1 (ja) | 出荷後の製品の管理を支援するシステム及び方法 | |
| WO2021135324A1 (zh) | 地图多屏显示方法、装置、计算机设备和存储介质 | |
| WO2020110384A1 (ja) | データ処理装置、データ処理システムおよびデータ処理方法 | |
| CN112783992A (zh) | 一种基于兴趣点的地图功能区域确定方法和装置 |
Legal Events
| Date | Code | Title | Description |
|---|---|---|---|
| 121 | Ep: the epo has been informed by wipo that ep was designated in this application |
Ref document number: 10761588 Country of ref document: EP Kind code of ref document: A1 |
|
| WWE | Wipo information: entry into national phase |
Ref document number: 2010761588 Country of ref document: EP |
|
| NENP | Non-entry into the national phase |
Ref country code: DE |
|
| WWE | Wipo information: entry into national phase |
Ref document number: 13258073 Country of ref document: US |