US7978887B2 - Methods and apparatus for identifying subject matter in view data - Google Patents
Methods and apparatus for identifying subject matter in view data Download PDFInfo
- Publication number
- US7978887B2 US7978887B2 US11/299,558 US29955805A US7978887B2 US 7978887 B2 US7978887 B2 US 7978887B2 US 29955805 A US29955805 A US 29955805A US 7978887 B2 US7978887 B2 US 7978887B2
- Authority
- US
- United States
- Prior art keywords
- filter
- view data
- interest
- subject matter
- splat
- Prior art date
- Legal status (The legal status is an assumption and is not a legal conclusion. Google has not performed a legal analysis and makes no representation as to the accuracy of the status listed.)
- Expired - Fee Related, expires
Links
- 238000000034 method Methods 0.000 title claims abstract description 101
- 239000013598 vector Substances 0.000 claims description 64
- 238000001914 filtration Methods 0.000 claims description 55
- 230000008569 process Effects 0.000 claims description 44
- 210000004204 blood vessel Anatomy 0.000 claims description 20
- PXFBZOLANLWPMH-UHFFFAOYSA-N 16-Epiaffinine Natural products C1C(C2=CC=CC=C2N2)=C2C(=O)CC2C(=CC)CN(C)C1C2CO PXFBZOLANLWPMH-UHFFFAOYSA-N 0.000 claims description 19
- 230000009466 transformation Effects 0.000 claims description 19
- 238000012360 testing method Methods 0.000 claims description 17
- 230000008859 change Effects 0.000 claims description 11
- 210000003484 anatomy Anatomy 0.000 claims description 5
- 238000011065 in-situ storage Methods 0.000 claims description 3
- 238000010603 microCT Methods 0.000 claims 1
- 230000006870 function Effects 0.000 description 90
- 230000004044 response Effects 0.000 description 63
- 238000009826 distribution Methods 0.000 description 35
- 238000001514 detection method Methods 0.000 description 23
- 230000005855 radiation Effects 0.000 description 22
- 238000012545 processing Methods 0.000 description 11
- 229910052704 radon Inorganic materials 0.000 description 10
- SYUHGPGVQRZVTB-UHFFFAOYSA-N radon atom Chemical compound [Rn] SYUHGPGVQRZVTB-UHFFFAOYSA-N 0.000 description 10
- 230000000694 effects Effects 0.000 description 8
- 239000000463 material Substances 0.000 description 8
- 230000011218 segmentation Effects 0.000 description 7
- 238000003860 storage Methods 0.000 description 7
- 238000004458 analytical method Methods 0.000 description 5
- 238000002591 computed tomography Methods 0.000 description 5
- 238000013461 design Methods 0.000 description 5
- 238000005516 engineering process Methods 0.000 description 5
- 238000013507 mapping Methods 0.000 description 5
- 238000005070 sampling Methods 0.000 description 5
- 230000002238 attenuated effect Effects 0.000 description 4
- 238000003384 imaging method Methods 0.000 description 4
- 230000010354 integration Effects 0.000 description 4
- 238000013459 approach Methods 0.000 description 3
- 238000004422 calculation algorithm Methods 0.000 description 3
- 238000004195 computer-aided diagnosis Methods 0.000 description 3
- 230000014509 gene expression Effects 0.000 description 3
- 230000000149 penetrating effect Effects 0.000 description 3
- 230000002829 reductive effect Effects 0.000 description 3
- 206010028980 Neoplasm Diseases 0.000 description 2
- 238000010521 absorption reaction Methods 0.000 description 2
- 230000003247 decreasing effect Effects 0.000 description 2
- 238000002059 diagnostic imaging Methods 0.000 description 2
- 238000010586 diagram Methods 0.000 description 2
- 230000004807 localization Effects 0.000 description 2
- 238000010606 normalization Methods 0.000 description 2
- 238000005457 optimization Methods 0.000 description 2
- 230000036961 partial effect Effects 0.000 description 2
- 238000000638 solvent extraction Methods 0.000 description 2
- 238000007619 statistical method Methods 0.000 description 2
- 230000007704 transition Effects 0.000 description 2
- 210000005166 vasculature Anatomy 0.000 description 2
- 241000039435 Aphanarthrum affine Species 0.000 description 1
- 238000012935 Averaging Methods 0.000 description 1
- 238000010207 Bayesian analysis Methods 0.000 description 1
- 208000006545 Chronic Obstructive Pulmonary Disease Diseases 0.000 description 1
- 206010014561 Emphysema Diseases 0.000 description 1
- 241000282412 Homo Species 0.000 description 1
- 201000009794 Idiopathic Pulmonary Fibrosis Diseases 0.000 description 1
- 206010058467 Lung neoplasm malignant Diseases 0.000 description 1
- 238000007476 Maximum Likelihood Methods 0.000 description 1
- 206010064911 Pulmonary arterial hypertension Diseases 0.000 description 1
- 238000003491 array Methods 0.000 description 1
- 230000008901 benefit Effects 0.000 description 1
- 230000005540 biological transmission Effects 0.000 description 1
- 238000012512 characterization method Methods 0.000 description 1
- 239000002131 composite material Substances 0.000 description 1
- 238000004590 computer program Methods 0.000 description 1
- 238000011437 continuous method Methods 0.000 description 1
- 238000007796 conventional method Methods 0.000 description 1
- 238000005520 cutting process Methods 0.000 description 1
- 230000007812 deficiency Effects 0.000 description 1
- 238000009795 derivation Methods 0.000 description 1
- 238000003745 diagnosis Methods 0.000 description 1
- 238000011438 discrete method Methods 0.000 description 1
- 201000010099 disease Diseases 0.000 description 1
- 208000037265 diseases, disorders, signs and symptoms Diseases 0.000 description 1
- 230000005670 electromagnetic radiation Effects 0.000 description 1
- 238000004836 empirical method Methods 0.000 description 1
- 230000005284 excitation Effects 0.000 description 1
- 238000002474 experimental method Methods 0.000 description 1
- 238000009472 formulation Methods 0.000 description 1
- 238000009499 grossing Methods 0.000 description 1
- 230000036039 immunity Effects 0.000 description 1
- 230000003993 interaction Effects 0.000 description 1
- 208000036971 interstitial lung disease 2 Diseases 0.000 description 1
- 230000000670 limiting effect Effects 0.000 description 1
- 210000004072 lung Anatomy 0.000 description 1
- 201000005202 lung cancer Diseases 0.000 description 1
- 208000020816 lung neoplasm Diseases 0.000 description 1
- 238000002595 magnetic resonance imaging Methods 0.000 description 1
- 238000005259 measurement Methods 0.000 description 1
- 230000003278 mimic effect Effects 0.000 description 1
- 239000000203 mixture Substances 0.000 description 1
- 230000003287 optical effect Effects 0.000 description 1
- 230000007170 pathology Effects 0.000 description 1
- 230000000737 periodic effect Effects 0.000 description 1
- 238000002600 positron emission tomography Methods 0.000 description 1
- 238000003672 processing method Methods 0.000 description 1
- 210000001147 pulmonary artery Anatomy 0.000 description 1
- 230000002685 pulmonary effect Effects 0.000 description 1
- 230000002123 temporal effect Effects 0.000 description 1
- 238000000844 transformation Methods 0.000 description 1
- 230000001131 transforming effect Effects 0.000 description 1
- 230000000007 visual effect Effects 0.000 description 1
Images


Classifications
-
- G—PHYSICS
- G06—COMPUTING; CALCULATING OR COUNTING
- G06T—IMAGE DATA PROCESSING OR GENERATION, IN GENERAL
- G06T7/00—Image analysis
- G06T7/10—Segmentation; Edge detection
- G06T7/194—Segmentation; Edge detection involving foreground-background segmentation
-
- A—HUMAN NECESSITIES
- A61—MEDICAL OR VETERINARY SCIENCE; HYGIENE
- A61B—DIAGNOSIS; SURGERY; IDENTIFICATION
- A61B6/00—Apparatus or devices for radiation diagnosis; Apparatus or devices for radiation diagnosis combined with radiation therapy equipment
- A61B6/02—Arrangements for diagnosis sequentially in different planes; Stereoscopic radiation diagnosis
- A61B6/03—Computed tomography [CT]
- A61B6/032—Transmission computed tomography [CT]
-
- A—HUMAN NECESSITIES
- A61—MEDICAL OR VETERINARY SCIENCE; HYGIENE
- A61B—DIAGNOSIS; SURGERY; IDENTIFICATION
- A61B6/00—Apparatus or devices for radiation diagnosis; Apparatus or devices for radiation diagnosis combined with radiation therapy equipment
- A61B6/52—Devices using data or image processing specially adapted for radiation diagnosis
- A61B6/5211—Devices using data or image processing specially adapted for radiation diagnosis involving processing of medical diagnostic data
- A61B6/5217—Devices using data or image processing specially adapted for radiation diagnosis involving processing of medical diagnostic data extracting a diagnostic or physiological parameter from medical diagnostic data
-
- A—HUMAN NECESSITIES
- A61—MEDICAL OR VETERINARY SCIENCE; HYGIENE
- A61P—SPECIFIC THERAPEUTIC ACTIVITY OF CHEMICAL COMPOUNDS OR MEDICINAL PREPARATIONS
- A61P1/00—Drugs for disorders of the alimentary tract or the digestive system
-
- A—HUMAN NECESSITIES
- A61—MEDICAL OR VETERINARY SCIENCE; HYGIENE
- A61P—SPECIFIC THERAPEUTIC ACTIVITY OF CHEMICAL COMPOUNDS OR MEDICINAL PREPARATIONS
- A61P11/00—Drugs for disorders of the respiratory system
-
- A—HUMAN NECESSITIES
- A61—MEDICAL OR VETERINARY SCIENCE; HYGIENE
- A61P—SPECIFIC THERAPEUTIC ACTIVITY OF CHEMICAL COMPOUNDS OR MEDICINAL PREPARATIONS
- A61P35/00—Antineoplastic agents
-
- C—CHEMISTRY; METALLURGY
- C07—ORGANIC CHEMISTRY
- C07D—HETEROCYCLIC COMPOUNDS
- C07D401/00—Heterocyclic compounds containing two or more hetero rings, having nitrogen atoms as the only ring hetero atoms, at least one ring being a six-membered ring with only one nitrogen atom
- C07D401/14—Heterocyclic compounds containing two or more hetero rings, having nitrogen atoms as the only ring hetero atoms, at least one ring being a six-membered ring with only one nitrogen atom containing three or more hetero rings
-
- G—PHYSICS
- G06—COMPUTING; CALCULATING OR COUNTING
- G06T—IMAGE DATA PROCESSING OR GENERATION, IN GENERAL
- G06T11/00—2D [Two Dimensional] image generation
- G06T11/003—Reconstruction from projections, e.g. tomography
- G06T11/008—Specific post-processing after tomographic reconstruction, e.g. voxelisation, metal artifact correction
-
- G—PHYSICS
- G06—COMPUTING; CALCULATING OR COUNTING
- G06T—IMAGE DATA PROCESSING OR GENERATION, IN GENERAL
- G06T17/00—Three dimensional [3D] modelling, e.g. data description of 3D objects
- G06T17/10—Constructive solid geometry [CSG] using solid primitives, e.g. cylinders, cubes
-
- G—PHYSICS
- G06—COMPUTING; CALCULATING OR COUNTING
- G06T—IMAGE DATA PROCESSING OR GENERATION, IN GENERAL
- G06T5/00—Image enhancement or restoration
-
- G—PHYSICS
- G06—COMPUTING; CALCULATING OR COUNTING
- G06T—IMAGE DATA PROCESSING OR GENERATION, IN GENERAL
- G06T5/00—Image enhancement or restoration
- G06T5/70—Denoising; Smoothing
-
- A—HUMAN NECESSITIES
- A61—MEDICAL OR VETERINARY SCIENCE; HYGIENE
- A61B—DIAGNOSIS; SURGERY; IDENTIFICATION
- A61B5/00—Measuring for diagnostic purposes; Identification of persons
- A61B5/48—Other medical applications
- A61B5/4887—Locating particular structures in or on the body
- A61B5/489—Blood vessels
-
- A—HUMAN NECESSITIES
- A61—MEDICAL OR VETERINARY SCIENCE; HYGIENE
- A61B—DIAGNOSIS; SURGERY; IDENTIFICATION
- A61B6/00—Apparatus or devices for radiation diagnosis; Apparatus or devices for radiation diagnosis combined with radiation therapy equipment
- A61B6/02—Arrangements for diagnosis sequentially in different planes; Stereoscopic radiation diagnosis
- A61B6/03—Computed tomography [CT]
-
- A—HUMAN NECESSITIES
- A61—MEDICAL OR VETERINARY SCIENCE; HYGIENE
- A61B—DIAGNOSIS; SURGERY; IDENTIFICATION
- A61B6/00—Apparatus or devices for radiation diagnosis; Apparatus or devices for radiation diagnosis combined with radiation therapy equipment
- A61B6/12—Arrangements for detecting or locating foreign bodies
-
- G—PHYSICS
- G06—COMPUTING; CALCULATING OR COUNTING
- G06F—ELECTRIC DIGITAL DATA PROCESSING
- G06F2218/00—Aspects of pattern recognition specially adapted for signal processing
- G06F2218/02—Preprocessing
-
- G—PHYSICS
- G06—COMPUTING; CALCULATING OR COUNTING
- G06F—ELECTRIC DIGITAL DATA PROCESSING
- G06F2218/00—Aspects of pattern recognition specially adapted for signal processing
- G06F2218/12—Classification; Matching
- G06F2218/16—Classification; Matching by matching signal segments
-
- G—PHYSICS
- G06—COMPUTING; CALCULATING OR COUNTING
- G06T—IMAGE DATA PROCESSING OR GENERATION, IN GENERAL
- G06T2200/00—Indexing scheme for image data processing or generation, in general
- G06T2200/04—Indexing scheme for image data processing or generation, in general involving 3D image data
-
- G—PHYSICS
- G06—COMPUTING; CALCULATING OR COUNTING
- G06T—IMAGE DATA PROCESSING OR GENERATION, IN GENERAL
- G06T2207/00—Indexing scheme for image analysis or image enhancement
- G06T2207/10—Image acquisition modality
- G06T2207/10072—Tomographic images
- G06T2207/10081—Computed x-ray tomography [CT]
-
- G—PHYSICS
- G06—COMPUTING; CALCULATING OR COUNTING
- G06T—IMAGE DATA PROCESSING OR GENERATION, IN GENERAL
- G06T2207/00—Indexing scheme for image analysis or image enhancement
- G06T2207/10—Image acquisition modality
- G06T2207/10116—X-ray image
-
- G—PHYSICS
- G06—COMPUTING; CALCULATING OR COUNTING
- G06T—IMAGE DATA PROCESSING OR GENERATION, IN GENERAL
- G06T2207/00—Indexing scheme for image analysis or image enhancement
- G06T2207/20—Special algorithmic details
- G06T2207/20024—Filtering details
Definitions
- the present invention relates to imaging and more particularly to techniques for identifying subject matter of interest in view data, for example, in view data obtained from an X-ray scanning device.
- X-ray imaging technology provides a non-invasive technique for visualizing the internal structure of an object of interest by exposing the object to high energy electromagnetic radiation (i.e., X-rays).
- X-rays emitted from a radiation source interact with the object and are absorbed, scattered and/or diffracted at varying levels by the internal structures of the object.
- Transmitted X-ray radiation for example, is attenuated according to the various absorption characteristics of the materials which the X-rays encounter. By measuring the attenuation of the X-ray radiation that exits the object, information related to the density distribution of the object may be obtained.
- an X-ray source and an array of detectors responsive to X-ray radiation may be arranged about the object.
- Each detector in the array may generate an electrical signal proportional to the intensity and/or energy of X-ray radiation impinging on a surface of the detector.
- the source and array may be rotated around the object in a predetermined path to obtain a number of views of the object at different angles.
- the detector signal generated by each detector in the array indicates the total absorption (i.e., attenuation) incurred by material substantially in a line between the X-ray source and the detector. Therefore, the array of detection signals records the projection of the object onto the detector array at a number of views of the object, and provides one method of obtaining view data of the object.
- View data obtained from an X-ray scanning device may be of any form that provides transmission (attenuation), scatter and/or diffraction information as a function of view angle or orientation with respect to the object being scanned.
- View data may be obtained by exposing a planar cross-section of an object, referred to as a slice, to X-ray radiation.
- Each rotation about the object e.g., a 180° rotation of the radiation source and detector array
- 2D two-dimensional
- the X-ray scanning process transforms a generally unknown material distribution of an object into view data having information about how the X-rays interacted with the unknown density.
- the view data may indicate how the material distribution attenuated the X-rays, providing information related to the density and/or atomic number of the material distribution.
- FIG. 1A illustrates a diagram of the transformation operation performed by the X-ray scanning process.
- An object 100 having an unknown density distribution in object space is subjected to X-ray scanning.
- Object space refers herein to the coordinate frame of an object of interest, for example, an object undergoing an X-ray scan.
- a Cartesian coordinate frame i.e., (x, y, z)
- object space may be described by any other suitable coordinate frame, such as spherical or cylindrical coordinates.
- X-ray scanning process 110 generates object view data 105 in a view space coordinate frame (e.g., coordinate frame (t, ⁇ ,z)).
- object view data 105 may include attenuation information from a plurality of detectors in an array (corresponding to the view space t-axis), at a number of orientations of the X-ray scanning device (corresponding to the view space ⁇ -axis), over a number of cross-sections of the object (corresponding to the view space z-axis) to form three dimensional (3D) view data.
- the 3D view data may be considered as a series of 2D slices stacked on top of one another to form the third axis (e.g., the z-axis). Accordingly, X-ray scanning process 110 transforms a continuous density distribution in object space to discrete view data in view space.
- FIG. 1B illustrates a reconstruction process 120 that transforms view data 105 into reconstructed data 100 ′ (e.g., a reconstructed density image of a portion of object 100 ).
- reconstructed data 100 ′ e.g., a reconstructed density image of a portion of object 100
- a density value for each desired discrete location of object 100 in object space is determined based on the information available in view data 105 .
- 2D and 3D images in an object space coordinate frame are reconstructed data.
- the view data may be of any dimensionality.
- the view data may be two dimensional (2D) representing a cross-section or slice of an object being scanned.
- the 2D view data may be reconstructed to form reconstructed data in two dimensional object space. This process may be repeated with view data obtained over successive slices of an object of interest.
- the reconstructed data may be stacked together to form reconstructed data in 3D (e.g., 3D voxel data I(x i ,y i ,z i )).
- 3D 3D voxel data I(x i ,y i ,z i )
- computed tomography (CT) images may be acquired in this manner.
- Reconstructed data contains less information than the view data from which the reconstructed data was computed.
- the loss in information is due, at least in part, to the discrete nature of X-ray scanning (i.e., a finite number of detectors and a finite number of views) and to assumptions made during back-projection.
- reconstructed data represents intensity as a discrete function of space.
- intensity refers generally to a magnitude, degree and/or value at some location in the data, whether it be view data or reconstructed data.
- the scan plane i.e., the 2D cross-section of the object being scanned
- the reconstruction process when determining intensity values for each of the pixel regions, typically operates on the assumption that all structure within a pixel region has a same and single density and therefore computes an average of the density values within the corresponding region of space. This averaging blurs the reconstructed data and affects the resulting resolution.
- This averaging blurs the reconstructed data and affects the resulting resolution.
- a human operator such as a physician or diagnostician
- this process may be difficult and time consuming.
- it may be difficult to assess 3D biological structure by attempting to follow structure through stacked 2D reconstructed data.
- it may be perceptually difficult and time consuming to understand how 2D structure is related to 3D structure as it appears, changes in size and shape, and/or disappears in successive 2D slices of reconstructed data.
- a physician may have to mentally arrange hundreds or more 2D slices into a 3D picture of the anatomy. To further frustrate this process, when anatomical structure of interest is small, the structure may be difficult to discern or absent altogether in the reconstructed data.
- Image processing techniques have been developed to automate or partially automate the task of understanding and partitioning the structure in reconstructed data. Such techniques are employed in computer aided diagnosis (CAD) to assist a physician in identifying and locating structure of interest in 2D or 3D reconstructed data.
- CAD techniques often involve segmenting reconstructed data into groups of related pixels (in 2D) or voxels (in 3D) and identifying the various groups of voxels, for example, as those comprising a tumor or a vessel or some other structure of interest.
- segmentation on reconstructed data has proven difficult, especially with respect to relatively small or less salient structure in the reconstructed data.
- Filtering processes involve comparing reconstructed data with a numerical operator (i.e., the filter) to examine properties of the reconstructed data.
- filters may be applied to reconstructed data to examine higher order properties of the data, such as first derivative and second derivative information.
- the higher order information often reveals characteristics of the reconstructed data that suggest how the data should be segmented, such as edge features that may demarcate boundaries between structures or ridge features that identify properties of a particular structure of interest.
- Filters may be designed to respond, emphasize or otherwise identify any number of properties, characteristics and/or features in the reconstructed data.
- Filtering may be achieved by applying a function to the reconstructed data.
- a filter may comprise a function or discrete collection of numbers over the domain of the filter, referred to as the filter kernel.
- the filter may be superimposed on the reconstructed data and the underlying data convolved with the filter kernel to generate a value at the location (e.g., the center of the kernel) at which the kernel was applied.
- the filter may then be applied to the reconstructed data at a new location, and convolved with the reconstructed data to generate another value. This process may be repeated over all the reconstructed data or desired portion of the reconstructed data to generate new data having the filter output at each location as the intensity.
- the filter outputs may be used to modify, label or otherwise augment the reconstructed data being operated on.
- a filter may be n-dimensional. That is, the domain of the filter may be a continuous or discrete function over any number of dimensions.
- 2D filters and 3D filters may be applied to 2D and 3D reconstructed data to detect and/or identify properties of the data that facilitate locating structure of interest or otherwise facilitating the segmentation of the reconstructed data.
- a vast array of filters are known in the art such as Gaussian filters, derivative Gaussian filters, Hessian filters, edge detectors such as difference filters like the Sobel and Canny operators, and numerous other filters specially designed to perform a specific image processing task.
- Reconstructed data from view data obtained from conventional X-ray scanning devices may be limited in resolution due, in part, to the lossy reconstruction process.
- reconstructed data from some conventional X-ray scanning devices may be limited to a resolution of approximately 500 microns.
- conventional imaging techniques may be unable to capture structure having dimensions smaller than 500 microns. That is, variation in the density distribution of these small structures cannot be resolved by conventional reconstruction.
- Micro-computer tomography can produce view data of small objects at resolutions that are an order of magnitude greater than conventional X-ray scanning devices.
- microCT cannot image large objects such as a human patient and therefore is unavailable for in situ and generally non-invasive scanning of the human anatomy.
- One embodiment according to the present invention includes a method of filtering view data to detect subject matter of interest in view data obtained by scanning an object, the view data including scan information about the object at least along a view axis indicative of a view angle about the object at which the scan information was obtained, the method comprising acts of providing a filter adapted to respond to the subject matter of interest in the view data, the filter including a filter kernel, varying the filter kernel according to which location in the view data to which the filter is to be applied, and applying the filter to a plurality of locations to facilitate identifying the subject matter of interest in the view data.
- Another embodiment according to the embodiment according to the present invention includes a method of detecting subject matter of interest in view data obtained by scanning an object, the subject matter of interest arising from structure of interest in the object, the method comprising acts of providing a filter, splatting the filter to provide a filter splat responsive to the subject matter of interest, and performing at least one operation on at least a portion of the view data using the filter splat to facilitate determining whether the subject matter of interest is present in the portion of the view data.
- Another embodiment according to the present invention includes a computer readable medium encoded with a program for execution on at least one processor, the program, when executed on the at least one processor, performing a method of detecting subject matter of interest in view data obtained by scanning an object, the subject matter of interest arising from structure of interest in the object, the method comprising acts of providing a filter associated with the structure of interest, splatting the filter to provide a filter splat responsive to the subject matter of interest, and performing at least one operation on at least a portion of the view data using the filter splat to facilitate determining whether the subject matter of interest is present in the portion of the view data.
- Another embodiment according to the present invention includes an apparatus adapted to detect subject matter of interest in view data obtained by scanning an object, the apparatus comprising at least one input adapted to receive the view data, and at least one controller, coupled to the at least one input, the at least one controller adapted to generate a filter adapted to respond to the subject matter of interest, splat the filter onto a portion of the view data to provide a filter splat, and perform at least one operation on the portion of the view data using the filter splat to facilitate determining whether the subject matter of interest is present in the portion of the view data.
- FIGS. 1A , 1 B and 1 C illustrate transformations of an X-ray scanning process, a reconstruction process, and the radon transform, respectively;
- FIG. 2 illustrates one example of a system including an X-ray scanning device and a computer system suitable for practicing various aspects of the invention
- FIG. 3 illustrates an exemplary X-ray scanning process of an elliptical object having a Gaussian density distribution
- FIG. 4 illustrates a schematic of a sinogram of the view data obtained from the X-ray scanning process illustrated in FIG. 3 ;
- FIGS. 5A-5C illustrates examples of logically partitioning three dimensional (3D) view data into multiple two dimensional (2D) planes.
- FIG. 6 illustrates one example of splatting a filter by computing line integrals along rays extending from an X-ray source location to a plane of view data, in accordance with one embodiment of the present invention
- FIG. 7 illustrates a number of filter splats resulting from splatting a filter onto multiple views of 3D view data, in accordance with one embodiment of the present invention
- FIG. 8 illustrates positioning a number of filters throughout a logical tesselation of object space to be splatted onto view data, in accordance with one embodiment of the present invention
- FIG. 9A illustrates a cylinder model in accordance with one embodiment of the present invention.
- FIG. 9B illustrates a configuration of a cylinder network model built from the cylinder model in FIG. 9A , in accordance with one embodiment of the present invention
- FIG. 10A illustrates a schematic of a filter adapted to respond to the cylindrical structure shown in FIG. 9A , in accordance with one embodiment of the present invention
- FIG. 10B illustrates an example the filter of FIG. 10A positioned at a number of different orientations and scales to form a filter cluster, in accordance with one embodiment of the present invention
- FIG. 10C illustrates one example of sampling object space to determine orientations of filters in a filter cluster, in accordance with one embodiment of the present invention
- FIG. 11 illustrates the filter cluster of FIG. 10B sampled according to FIG. 10C positioned throughout logically tesselated object space to be splatted onto view data, in accordance with one embodiment of the present invention
- FIG. 12 illustrates a method of detecting subject matter of interest in view data by splatting a filter adapted to respond to the subject matter of interest onto the view data, in accordance with one embodiment of the present invention
- FIG. 13 illustrates a profile of one example of a filter adapted to respond to tubular structure, in accordance with one embodiment of the present invention
- FIG. 14 illustrates symbolically one example of a filter adapted to respond to tubular structure with three parameterized lines penetrating the filter at three different angles ⁇ , in accordance with one embodiment of the present invention
- FIG. 15A illustrates profiles of a filter function of one example of the filter in FIG. 14 along the parameterized lines illustrated in FIG. 14 , in accordance with one embodiment of the present invention
- FIG. 15B illustrates profiles of impulse line responses through the filter function of the filter in FIG. 14 using three different sharpness ratios ⁇ , in accordance with one embodiment of the present invention
- FIG. 16A illustrates line impulse responses over a range of angles ⁇ of four filters oriented every 45 degrees, in accordance with one embodiment of the present invention
- FIG. 16B illustrates the sum of the impulse responses shown in FIG. 16B , in accordance with one embodiment of the present invention
- FIG. 17A illustrates probability density functions for a filter response to a line impulse at three different standard deviations ⁇ , in accordance with one embodiment of the present invention
- FIG. 17B illustrates probability density functions for a filter response to a line impulse at three filter sharpness values ⁇ , in accordance with one embodiment of the present invention
- FIG. 18 illustrates a probability density function for observed data under an assumption that a cylinder hypothesis and a noise hypothesis are equally likely, in accordance with one embodiment of the present invention
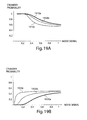
- FIG. 19A illustrates the probability of a cylinder being present in the data as a function of the standard deviation of the noise for three different filter sharpness values ⁇ , in accordance with one embodiment of the present invention
- FIG. 19B illustrates the probability of a cylinder being present in the data as a function of the standard deviation of the noise for three different filter sharpness values ⁇ , in accordance with one embodiment of the present invention
- FIG. 21A illustrates the probability density of line impulse orientation for different sharpness values ⁇ , in accordance with one embodiment of the present invention
- FIG. 21B illustrates the standard deviation in probable line orientation as a function of noise ratio for different sharpness values ⁇ , in accordance with one embodiment of the present invention
- FIG. 22A illustrates the probability density for line impulse orientation with filters oriented at 45 degrees and 90 degrees for three different noise ratios, in accordance with one embodiment of the present invention
- FIG. 22B illustrates cylinder probabilities over a range of line impulse orientations for three different sharpness ratios ⁇ , in accordance with one embodiment of the present invention
- FIG. 24 illustrates the class probability for a cylinder, sphere and noise assuming each class is equally likely, in accordance with one embodiment of the present invention
- FIG. 25 illustrates the class probability for a cylinder, sphere and noise when the respective filter outputs are equal, in accordance with one embodiment of the present invention
- FIG. 26 illustrates the class probability for a cylinder, sphere and noise when the respective filter outputs are randomly distributed with a small variance about zero, in accordance with one embodiment of the present invention
- FIGS. 27A-27F illustrate the use of the Hessian as a filter, in accordance with one embodiment of the present invention
- FIGS. 28A-28C illustrate the use of steerable filters, in accordance with one embodiment of the present invention
- FIGS. 29A and 29B illustrate projections of an object in non-parallel ray and parallel ray environments, respectively, in accordance with one embodiment of the present invention.
- FIGS. 30A and 30B illustrate projections of an object in non-parallel ray and parallel ray environments, respectively, in accordance with one embodiment of the present invention.
- segmentation of reconstructed data is limited by noise, blurring and loss of resolution resulting from the reconstruction process.
- Structure at or below the resolution of the reconstructed data may be unavailable to detection and/or segmentation algorithms that operate on reconstructed data, such as the application of filters adapted to respond to structure of interest in the reconstructed data.
- the reconstruction processes may blur or eliminate structure to the extent that a filter will not be responsive enough to provide filter outputs that can distinguish the structure of interest.
- Model-based techniques have been employed to avoid some of the problems associated with reconstruction and post-reconstruction image processing algorithms, such as filtering.
- Model-based techniques may include generating a model to describe structure assumed to be present in the view data of an object of interest. For example, a priori knowledge of the internal structure of an object of interest may be used to generate the model. The model may then be compared to the view data to test the validity of the model and to modify its configuration based on the view data.
- conventional model-based techniques may suffer from the computational complexity of determining how to most appropriately configure the model.
- optimization techniques used to modify the configuration of the model may be vulnerable to converging to local minimum solutions that are not representative of the actual structure in the view data.
- model refers herein to any geometric, parametric or other mathematical description and/or definition of properties and/or characteristics of a structure, physical object, or system.
- a model of structure may include a mathematical description of the structure's shape and density distribution.
- a model may include one or more parameters that are allowed to vary over a range of values, such that the model may be deformed to take on a variety of configurations.
- configuration with respect to a model refers herein to an instance wherein model parameters have been assigned a particular value.
- model view data view data of the model
- the radon transform operating on a function, projects the function into view space.
- FIG. 1C illustrates the operation of the radon transform 130 on a model 125 of object 100 .
- Model 125 is described by the function ⁇ ( ⁇ ) in model space, where ⁇ is a vector of the parameters characterizing the model. Since model 125 is generated to describe object 100 , it may be convenient to use the same coordinate frame for model space and object space, although they may be different so long as the transformation between the two coordinate frames are known.
- the radon transform 130 transforms model 125 from model space to model view data 105 ′ (i.e., to a function in the view space coordinate frame).
- X-ray scanning process 110 and radon transform 130 perform substantially the same operation, i.e., both perform a transformation from object space (or model space) to view space.
- the scanning process performs a discrete transformation from object space to view space (i.e., to a discrete function in ( ⁇ i ,t i )) and the radon transform performs a continuous transformation from object space to view space (i.e., to a continuous function in ( ⁇ ,t)).
- Model view data obtained by projecting a configuration of the model i.e., an instance of f where each parameter in ⁇ has been assigned a value
- the model may then be deformed or otherwise updated until its radon transform (the model view data) satisfactorily fits the object view data, i.e., until the configuration of the model has been optimized.
- filtering techniques are applied to view data obtained from scanning an object to identify and/or locate properties characteristic of structure of interest within the object, rather than applying filtering techniques to reconstructed data formed from the view data.
- Filtering in the domain of the view data provides the flexibility of conventional filtering of reconstructed data, while permitting the filter to operate at the higher resolution of the view data. Filter processing on the view data thus facilitates detection of relatively small structure missed by and/or invisible to conventional filtering of reconstructed data.
- filtering view data to facilitate detection and/or segmentation of subject matter associated with structure of interest may be complicated due to the changing appearance of the subject matter in different portions of the view data, for example, across multiple views. That is, the structure of interest scanned at various view angles will project and therefore appear differently in the view data depending on the view angle. Accordingly, a filter adapted to respond to subject matter associated with structure of interest in one view may not be well suited to respond to the subject matter in another view. For example, the scale of the filter may become increasingly mismatched with the scale of the subject matter in the view data as the view angle changes.
- filtering in view data may be made more effective by varying one or more characteristics of a filter as a function of one or more variables to more accurately match properties of the subject matter the filter is designed to detect. For example, by varying one or more characteristics of a filter across multiple views, the filter may be more responsive to the appearance of the subject matter as it varies across the multiple views of the view data.
- a filter kernel of a filter is varied depending on the location in the view data that the filter is applied. For example, in view data having an axis corresponding to view angle, the filter kernel may be varied depending on the location along the view axis at which the filter is applied. In one embodiment, the size of the filter kernel is varied depending on the location in the view data at which it is applied. In another embodiment, the values in the kernel are varied depending on the location in the view data at which the filter is applied. In one embodiment, a filter kernel is varied by splatting a filter represented in object space onto the view, as described in further detail below. It should be appreciated that the filter kernel may be varied in any manner such that the filter is generally more responsive to the subject matter of interest as it changes throughout the view data, as the aspects of the invention are not limited in this respect.
- Applicant has appreciated that by providing a filter described and/or defined in object space (e.g., in the same coordinate frame as the structure of interest) and projecting the filter onto the view data (a process referred to herein as splatting, which is described in further detail below) may improve upon certain deficiencies in filtering view data caused by the variation of the appearance of the subject matter across one or more dimensions of the view data. That is, by performing an operation that, for example, causes a filter to undergo a same or similar transformation as the structure of interest, the transformed filter may be more responsive to the subject matter of interest as it varies throughout the view data.
- a 3D filter associated with structure of interest is generated and positioned at a desired location and orientation in object space.
- the 3D filter is then splatted (e.g., projected) onto two dimensions of view data obtained from scanning an object assumed to contain at least some structure of interest whose projection is assumed to produce the subject matter of interest.
- the resulting filter splat responsive to the subject matter of interest, may then be used to operate on the underlying view data to generate a filter output indicative of the likelihood that the filter splat is operating on the subject matter of interest.
- the filter splat may be convolved with the underlying view data to generate a likelihood value related to the strength of an assertion that structure is present at a position and orientation characterized by the configuration of the filter.
- the 3D filter is splatted onto a plurality of 2D views that form the view data obtained from scanning an object, each view representing 2D view data obtained at a different view angle with respect to an X-ray source.
- the resulting filter splats are then convolved with the underlying view data within the respective view onto which the 3D filter was splatted to generate filter data through each view (e.g., for an orbit) of the 3D view data.
- the filter data may be analyzed to determine the likelihood that the view data arose from structure of interest located and oriented (e.g., configured) approximately as characterized by the 3D filter configuration.
- structure below 500 microns is detected, at least in part, by performing filtering operations in view data obtained from a conventional large object X-ray scanning device, more preferably below 250 microns, more preferably below 100 microns, and even more preferably below 50 microns.
- structure at or below 50 microns is detected, at least in part, by performing filtering operations in view data obtained from a microCT scanning device, more preferably below 25 microns, more preferably below 10 microns, and even more preferably below 5 microns.
- COPD chronic obstructive pulmonary disease
- a filter adapted to respond to portions of a vessel network in 3D view data is provided at one or more configurations (e.g., locations, orientations and/or scales) to generate multiple hypotheses about the existence of vessel structure in the view data.
- the variously configured filters are then splatted onto two dimensions and compared with the underlying view data across multiple views of the 3D view data.
- the filter data produced from the filter splat comparisons with the view data may be used to analyze the probability that the view data resulted from vessel structure existing in the object at approximately the configuration of the corresponding filters.
- FIG. 2 illustrates a block diagram of one embodiment of a system 200 suitable for practicing various aspects of the present invention.
- System 200 includes an X-ray scanning device 210 and computer system 220 .
- X-ray scanning device 210 may be any device capable of acquiring view data of an object of interest.
- X-ray scanning devices may be designed with varying capabilities, such as resolution, scan speed and scan path (e.g., circular, helical, etc.), may employ a variety of radiation emission technologies, such as cone beam, fan beam and pencil beam technologies, and may be arranged in numerous configurations, such as circular or rectangular geometry detector arrays, and may provide data of different types such as CT or laminographic data.
- Any X-ray scanning device providing view data may be suitable, as aspects of the invention are not limited to view data obtained from any particular type, arrangement and/or capability. As discussed above, view data may be obtained from other types of scanning devices, as aspects of the invention are not limited for use with view data obtained from X-ray scanning devices.
- Computer system 220 may include a processor 222 connected to one or more storage devices including storage medium 224 .
- Storage medium 224 may be any of various computer-readable media capable of storing electronic information and may be implemented in any number of ways. Storage medium 224 may be encoded with instructions, for example, as part of one or more programs that, as a result of being executed by processor 220 , instruct the computer to perform one or more of the methods or functions described herein, and/or various embodiments, variations and combinations thereof.
- Computer system 220 may be, for example, a personal computer (PC), work station, general purpose computer, or any other computing device.
- Computer system 220 may be integrated into X-ray scanning device 210 or may be a separate stand alone system, either proximate to or remote from X-ray scanning device 210 .
- computer system 220 may be connected to X-ray scanning device 210 over a network, connected to multiple scanning devices or may not be connected to any X-ray scanning device at all.
- computer system 220 may operate on view data previously stored in storage medium 224 , or may obtain the view data from some other location, e.g., another computer system, over a network, via transportable storage medium, etc.
- any computing environment may be used, as the aspects of the invention described herein are not limited to use with a computer system of any particular type or implementation.
- FIGS. 3A-3C illustrates a scanning process of an ellipse that may represent, for example, a cross-section of a vessel structure having a radial density similar to a Gaussian function.
- X-ray scanning device 300 may be used, for example, as the X-ray scanning device 210 in system 200 illustrated in FIG. 2 , to obtain successive cross-sections of an object to form 3D view data.
- One cross-section of the view data obtained from the scan is represented by sinogram 400 illustrated schematically in FIG. 4 .
- FIG. 3A illustrates a snapshot of portions of an X-ray scanning device 300 at a 0° orientation, including a radiation source 320 adapted to emit X-ray radiation and an array of detectors 330 responsive to the X-ray radiation.
- Radiation source 320 may emit a substantially continuous fan beam 325 , e.g., over an arc between rays 325 a and 325 b defining the extent of the fan beam.
- the radiation source 320 may be positioned along the circular extensions of the semi-circular detector array and adapted to rotate together with detector array 330 about a center point 335 .
- the detectors in the array respond to impinging X-rays by generating a detection signal, for example, an electrical signal proportional to the intensity of the radiation impinging on respective detectors.
- a detection signal for example, an electrical signal proportional to the intensity of the radiation impinging on respective detectors.
- the detector array records the radiation intensity profile at various orientations of the source and array with respect to ellipse 310 .
- the detection signals generated by each detector in the array may be sampled to obtain values indicating the intensity of an X-ray extending substantially in a line between each detector and the radiation source.
- the detector array may be sampled, for example, at a degree angle interval, half-degree angle interval, quarter-degree angle interval, etc., as the device rotates to obtain a number of projections of the ellipse 310 at different views.
- FIGS. 3B and 3C illustrate snap-shots of the X-ray scanning device at 45° and 90°, respectively.
- a 2D scan of ellipse 310 may include obtaining projections of ellipse 310 over a 180° arc at a desired angle interval ⁇ .
- the majority of the radiation emitted by source 320 will impinge unimpeded on the detector array 330 . However, some portion of the rays will pass through ellipse 310 before reaching the detector array.
- the impeded rays will be attenuated to an extent related to the density of ellipse 310 .
- Exemplary rays 325 c and 325 e substantially tangent to the object will be the least attenuated rays of those that pass through the ellipse. Rays passing substantially through the center of ellipse 310 (e.g., ray 325 d ) have the most material to penetrate at the highest density and therefore will exhibit the greatest attenuation.
- profile 365 may be a grayscale representation of the detection signals provided by the detectors in the array that are in the shadow of the ellipse, wherein lighter gray levels indicate greater X-ray attenuation. Accordingly, detectors that are not in the shadow of ellipse 310 produce detection signals having substantially black grayscale values.
- Profile 365 is illustrated at a higher resolution than the detector array, i.e., profile 365 includes more than a single grayscale value for each detector in the shadow of ellipse 310 to illustrate the characteristic shape of the profile.
- each detector illustrated in detector array 330 may be considered as any number of individual detectors generating detection signals such that a profile may be provided at the resolution of the illustrated profile 365 .
- the density distribution of the ellipse will project onto a changing combination of detectors.
- a 360° rotation of the device causes ellipse 310 to orbit center point 335 (from the perspective of radiation source 320 ) causing the location of the ellipse projection on the detectors to repeat.
- Ellipse 310 casts a periodic shadow that falls on the detectors at locations that trace across the detector array as a sinusoid as the orientation of the device increases, which can be mapped to 2D view space as discussed below.
- FIG. 4 illustrates a sinogram 400 of the view data obtained from scanning ellipse 310 over a 180° degree rotation at an angle interval of one degree.
- a sinogram is a representation of view data in view space.
- a sinogram maps intensity values (e.g., attenuation values, density values, etc.) to a discrete coordinate location in view space.
- Sinogram 400 has axes of ⁇ and t, where ⁇ represents the orientation of the X-ray device with respect to ellipse 310 and t refers to a location along the detector array. Accordingly, sinogram 400 provides a grayscale representation of the detection signals generated by detector array 330 as the X-ray scanning device rotates.
- sinogram 400 includes a grid of pixels 450 , wherein each pixel has an intensity related to a sample of a detection signal from a respective detector in array 330 at a particular orientation of the X-ray device.
- the characteristic profile 365 from the detectors in the shadow of ellipse 310 centered approximately at the ninth detector in the snapshot illustrated in FIG. 3A , appears centered approximately at pixel (0,9) in the sinogram.
- the second column of pixels indicates samples from respective detectors responding to impinging radiation at a 1° orientation of the X-ray device and so on at degree angle intervals.
- the location of the profile 365 traces out a portion of a sinusoid that reaches its half-period substantially at a 180° orientation. Portions of the sinogram 400 are illustrated in the vicinity of a 45° orientation, a 90° orientation, a 135° orientation and a 180° orientation to illustrate the sinusoidal transition of the location of profile 365 during the scan.
- Sinogram 400 illustrates a 2D slice of view data at a particular scan plane (or cross-section) intersecting the object being scanned.
- the object being scanned and the scan plane may be moved relative to one another so that the scan plane intersects the object at a successive cross-section.
- the scanning process may be repeated to obtain multiple slices.
- the multiple slices obtained from scanning an object form 3D view data of the object.
- view data may be represented as a discrete 3D function of t, ⁇ and z, where the t-axis describes detector location, the ⁇ -axis describes view angle, and the z-axis describes the location of the scan plane relative to cross-sections of the object from which the view data was obtained.
- View data 500 is represented schematically as a cube in 3D view space (e.g., in coordinate frame t, ⁇ , z).
- the 3D view data 500 may be viewed as 2D planes by cutting the view data with planes parallel to the plane formed by any two of the axes, (e.g., planes 510 , 520 , 530 illustrated in FIGS. 5A-5C ). That is, the view data may be viewed in the (t, ⁇ ) plane, the (t,z) plane, or the ( ⁇ , z) plane.
- FIG. 5A illustrates planes 510 a - 510 c intersecting view data 500 at different slices.
- View data in the (t,z) plane at a given value of ⁇ i is referred to herein as a view and represents 2D view data from a particular viewing angle of the X-ray source.
- FIG. 5B illustrates planes 520 a - 520 c intersecting view data 500 at different views.
- FIG. 5C shows planes 530 a - 530 c intersecting view data 500 to illustrate 2D view data with respect to a particular detector t i .
- structure of interest when scanned, may result in characteristic features or properties in the resulting view data that can be detected to identify and/or locate subject matter of interest in the view data.
- the elliptical structure in FIG. 3 having a generally Gaussian cross-section results in a generally detectable ridge structure that can be detected and used to configure a model of the structure of interest.
- Various methods of detecting features in view data to establish one or more parameters of a model configuration were described in application Ser. No. 10/871,265, of which this application is a continuation-in-part (CIP).
- the appearance of structure of interest in the view data may change, sometimes substantially, through different portions of the view data.
- the appearance of the structure of interest may change from view to view, from cross-section to cross-section, etc.
- structure within the object may be relatively close to the X-ray source at certain view angles and relatively far from the X-ray source at other view angles.
- the appearance of the structure in the view data i.e., the subject matter arising from the scanned structure
- the different view angles may be vary across the multiple views.
- a filter having a kernel adapted to respond to the subject matter arising from the structure in one view may not be well suited to respond to the subject matter arising from the structure in another view.
- Applicant herein describes a generalized filtering scheme that facilitates, ultimately, identifying subject matter in view data at generally increased resolutions by filtering the view data.
- Embodiments of the generalized filter model include splatting a desired filter represented in object space onto the view data in view space, as described in further detail below.
- a filter that is responsive to, or that is adapted to respond to subject matter of interest describes a filter that, when applied to data having subject matter of interest, provides an output that has at least one property that is generally distinguishable from outputs resulting when the filter is applied to data essentially without the subject matter of interest.
- the filter may respond with a stronger (e.g., larger magnitude value) output when applied to subject matter of interest than when applied to other content and/or noise.
- Various aspects of the present invention derive from Applicant's appreciation that the appearance of structure of interest in view data may change as a function of one or more variables associated with the view data (e.g., as a function of view angle, cross-section, etc.).
- Applicant has developed filtering techniques that include varying the kernel of a filter as a function of the one or more variables associated with the view data to better respond to the appearance of the structure of interest as it varies in the view data.
- splatting filtering techniques conventionally used on reconstructed data
- the process of splatting a filter onto view data allows a filter to undergo a process similar to the scanning process.
- the kernel of the filter may vary through the different portions of the view data in a manner corresponding to the change in appearance of the structure of interest in the view data. Accordingly, the kernel of the filter may be more responsive to the appearance of the structure of the interest throughout the view data (e.g., across multiple views, cross-sections, etc.).
- structure of interest is identified by splatting a 3D filter onto two dimensions of view data obtained from scanning an object assumed to contain at least some of the structure of interest to provide a filter splat responsive to subject matter of interest in the view data arising from the scanned structure of interest.
- splatting refers herein to a process of projecting an n-dimensional function to n ⁇ i dimensions, where i is a non-zero integer less than n.
- splatting may involve projecting a 3D function onto any one or combination of 2D planes of view data as shown in FIGS. 5A-5C .
- a splat of a 3D function may be computed in any number of ways, such as performing a volume integral over an appropriate domain of the 3D filter.
- the splatting process is performed by taking line integrals through the filter along sampled rays extending from an X-ray source location through the filter, as discussed in further detail below.
- the splatting process performs a similar transformation on a filter as the scanning process performs on an object being scanned.
- filter splat refers herein to the projection of a filter after the process of splatting (e.g., projecting) the filter. It should be appreciated that the filter splat operates as a filter on the view data and includes some domain over which the filter splat is defined (i.e., the filter kernel of the filter splat).
- FIG. 6 illustrates one method of splatting a 3D filter onto two dimensions of view data, in accordance with one embodiment of the present invention.
- Filter 620 may be any 3D function that can be used to filter the view data.
- a 3D filter may be designed to have a strong response when applied to (e.g., convolved with) view data arising from structure of interest and a relatively weak response when applied to other structure or content in the view data.
- filter 620 is shown as an ellipsoid to represent generically the domain of the 3D filter (i.e., locations where the filter function is defined).
- the filter function can be any continuous or discrete function in object space, and operates as the kernel of the 3D filter.
- the filter function may be any of various 3D filters conventionally applied to reconstructed data, or any other function adapted to respond to structure of interest, as the aspects of the invention are not limited in this respect.
- Filter 620 is centered at a location (x 0 , y 0 , z 0 ) in object space to test whether structure of interest was similarly situated in object space when the object was scanned. To test for the likelihood of the presence or absence of structure of interest, filter 620 may be splatted onto view 630 .
- View 630 may correspond to view data in the (t,z) plane at a particular viewing angle ⁇ 0 of 3D view data of the scanned object.
- rays e.g., exemplary rays 615
- emanating from source 610 that pass through filter 620 are generated, and the filter function is evaluated along each of the rays. In particular, a line integral of the filter function may be evaluated along each of the rays passing through filter 620 .
- filter splat 625 is a 2D discrete function in t and z, wherein each location (t i , z i ) stores the value of the line integral of the filter 620 along a ray extending from source 610 to the location (t i , z i ), and may also be associated with the underlying view data value at (t i , z i ).
- the view data generally within the domain of filter splat 625 is referred to herein as the underlying view data.
- Filter splat 625 may then be used as an operator to process the underlying view data, e.g., by performing a convolution operation between the filter splat and the underlying view data, or otherwise comparing or applying the filter splat to the underlying view data.
- rays 615 are exemplary and used to illustrate one embodiment of a splatting process.
- the filter function may be evaluated along any number of rays penetrating the filter at any number of locations, as the aspects of the invention are not limited in this respect.
- the filter function may be sampled by a ray at a resolution that results in a line integral value that overlays every discrete location in the view data within the domain of filter splat 25 , facilitating convolution or other filtering operations on the underlying view data.
- the filter splat may be over-sampled to provide line integral values at a sub-pixel resolution or under sampled such that line integral values are sparse with respect to the underlying view data.
- filter splat 625 may be used as an operator on view data of an object to facilitate determining whether certain structures are present.
- filter splat 625 is convolved with the underlying view data to obtain a filter output indicative of whether content generally responsive to the filter is present at the configuration of the filter. This can be viewed as a form of hypothesis testing. In particular, a hypothesis is made that structure having a particular density distribution and having a particular orientation and location existed during an X-ray scan of the object.
- a filter adapted to respond to the structure is instantiated with a configuration corresponding to the hypothesis.
- the filter is positioned and oriented to reflect location and orientation of the structure according to the hypothesis.
- the filter is then splatted into two dimensions (e.g., onto a view of the view data).
- the splatted filter may then be convolved or otherwise compared with the underlying view data to obtain a filter output (e.g., a single value) indicative of the likelihood that structure represented by the filter was present at the given configuration.
- a strong response is highly suggestive that structure of interest was present.
- a weak response suggests that the filter splat is operating on noise or content associated with structure other than the structure of interest.
- a single filter splat provides information indicating the existence of structure configured approximately the same as the filter at a single view angle.
- the process of splatting a filter onto a view and operating on the view data with the filter splat may be repeated for multiple views, for example, each angle ⁇ from which view data was obtained.
- the information across the different views may be used to help support or contradict the hypothesis that structure of interest was present at the filter configuration during the scan.
- a single filter output value from a view ⁇ 0 may be vulnerable to false negatives or false positives.
- a 3D filter may be splatted on the next view (e.g., a view at the next viewing angle ⁇ 1 ) and the filter splat compared to the underlying view data of the second view.
- each view in the 3D view data can provide an indication as to whether structure of interest was present at the configuration chosen for the filter, by examining the response of the filter on the content of the underlying view data across multiple views.
- FIG. 7 illustrates the process of splatting a filter 720 onto the (t,z) plane of successive views of 3D view data obtained from scanning an object of interest, in accordance with one embodiment of the present invention.
- Planes 730 a - 730 i are a sample of views of 3D view data. It should be appreciated that 3D view data may include hundreds, thousands, tens of thousands of views or more, and the illustrated views are merely exemplary samples of views across a view angle range from 0° to 180°.
- planes 730 a - 730 b may be three samples of views in the range of 0° to 30° view angle
- planes 730 d - 730 f may be view samples in the range between 75° to 105° view angle
- planes 730 g - 730 i may be view samples in the range between 150° to 180° view angle.
- Filter splats 725 a - 725 i were computed from a volumetric filter positioned at a particular configuration in object space. Since a filter splat depends in part on the position of the filter relative to the X-ray source and the view plane, (e.g., depends on rays extending from the source to the view plane via the filter) the size and location of the resulting filter splat will vary from view to view as the X-ray source rotates about the filter (i.e., as the view angle ⁇ is varied). As discussed above in connection with FIGS.
- a projected object will have an orbit as a function of ⁇ that is generally sinusoidal shape, and which depends on the location of the object with respect to the central axis of rotation (e.g., axis 635 in FIG. 6 ).
- the orbit of filter splat 725 is shown schematically on sampled views 730 a - 730 i.
- the filter Since the filter undergoes a transformation similar to the transformation performed by scanning the object, the filter splat adapts to changes in the appearance of the structure of interest and may be better suited to detect the subject matter arising from the structure of interest in the corresponding view. That is, the kernel of the filter is varied as a function of view angle to better respond to the appearance of the structure of the interest in the corresponding view. It should be appreciated that the filter kernel may be varied according to other variables such as cross-section, for example, by projecting the filter onto different planes of the view data. The kernel of the filter may be varied in any number of ways, as the aspects of the invention are not limited in this respect.
- the filter splat associated with each view may then be compared with the underlying view data.
- filter splat 725 may be convolved with the values of the view data onto which the filter was splatted, to provide multiple filter outputs indicating the likelihood of the presence of corresponding structure.
- likelihood information derived from multiple views the chances of arriving at an erroneous conclusion as to whether structure is present may be decreased.
- a generally strong response from the filter across multiple views is more suggestive of structure of interest than a strong response in a single view.
- false negative rates and false positive rates may be reduced.
- the filter outputs computed from each view may be analyzed in any manner.
- the values may be summed or averaged to obtain a single likelihood value, or analyzed as separate values and/or compared to one another.
- the filter output from each slice may be used in a maximum likelihood statistical analysis, or in any other way, as the aspects of the invention are not limited in this respect.
- a volumetric filter may be splatted on any number of views and any number of filter splats may be used to compute a likelihood value, as the aspects of the invention are not limited in this respect.
- the filter may be splatted on each of n views taken of the object during the scan.
- a subset of the n views and/or a sampling of the views on which the filter is splatted may be chosen to reduce computation time.
- any number of values computed by comparing a filter splat with the corresponding view data may be used in determining whether structure of interest is present in the object that was scanned.
- Applicant has recognized that the data obtained from comparing a filter splat with the underlying view data at each angle from which the view data was obtained (e.g., by performing a filter splat comparison in each view) is equivalent to comparing the 3D filter with the reconstructed data, but for the higher resolution of the view data.
- a convolution operation between a filter splat and the underlying view data in each of the views in given view data is equivalent to convolving the volumetric filter with the 3D reconstructed data.
- any of the various filtering operations conventionally performed on reconstructed data may be performed in view space without suffering the loss of resolution that is incurred during reconstruction. Accordingly, structure may be detected at higher resolutions (e.g., at the resolution of the view data rather than at the resolution of the reconstructed data).
- filter outputs from filter splats operating on view data relate to the likelihood that the view data resulted from structure situated with approximately with the same configuration as the filter. That is, a given filter asserts a hypothesis about the presence of structure similarly situated.
- multiple filters may be distributed throughout object space to assert hypotheses at different configurations. For example, object space may be partitioned into uniform or non-uniform regions and one or more filters may be positioned in each region to form hypotheses of the existence of structure throughout a desired portion of object space.
- FIG. 8 illustrates an object space partitioned into a regular 3D grid to form multiple hypotheses about the existence of corresponding structure.
- a portion of object space 875 is tessellated with regular Cartesian cubes, having a width w along the y-axis, a height h along the z-axis, and a depth d along the x-axis.
- One or more filters 820 may be positioned inside each cube at a desired orientation. Filters 820 are shown as ellipsoids to denote a generic filter that may be of any type. The filters in FIG.
- each cube 8 are all illustrated as having the major axis of the ellipsoid aligned with the z-axis, however, the filters can have any desired orientation for which it is desired to test for the presence of structure of interest. Moreover, each cube may include more than one filter at different orientations such that each region provides multiple hypotheses, as described in further detail below.
- each filter may be splatted to two dimensions, for example, splatted to the (t,z) plane of a view of view data in which structure is being detected.
- the resulting filter splats may then be compared to the underlying view data to generate a value indicative of the likelihood of the presence of structure similarly situated.
- the splatting procedure may be repeated in any number of views to further support or contradict the hypothesis that structure exists.
- the likelihood information collected from each view may be analyzed to determine whether structure corresponding to the associated filter was present in the scanned object.
- the size of the filter may be chosen to reflect the size of the structure being detected (i.e., to achieve detection at a desired resolution). For example, when the structure of interest is small, the regions in partitioned space may be decreased in size to reflect the dimensions of the structure being detected. In addition, the size of the filters may be varied to simultaneously detect structure of different dimensions within the view data.
- the view space filtering allows for detection of structure at a resolution conventionally not attainable by filtering reconstructed data.
- the structure being detected is blood vessels in an X-ray scan of biological tissue.
- Blood vessels may be modeled by cylindrical segments having an appropriate cross-sectional function that approximates the density distribution of the blood vessel.
- a blood vessel network often consists of a network of branching blood vessels of varying dimensions. A number of cylindrical segments together may form a model of a blood vessel network.
- filter outputs can be used to establish parameter values for a model configuration.
- the configured model may then operate as the representation of the object, may be further optimized, and/or used to make a determination about the object, such as a medical diagnosis.
- FIG. 9 illustrates one example of a cylindrical segment 900 that may be used as a component primitive in a cylinder network model of, for example, vessel structure such as human vasculature.
- a configuration of cylindrical segment 900 may be described by a number of parameters in a particular coordinate frame (i.e., parameterized in model space).
- model space may be the same 3D coordinate frame as an object or structure being modeled (i.e., model space and object space may describe the same space).
- the position of cylindrical segment 900 may be described by a location of the cylindrical axis 905 at a point (x i , y i , z i ) in space, for example, the origin or termination of the cylindrical segment.
- the orientation of cylindrical segment 900 may be specified by the angle ⁇ i from the x-axis and the angle ⁇ i from the y-axis. Since cylindrical segment 900 is axially symmetric, its rotation about the z-axis may not need to be specified, although it may be parameterized as well.
- the length of the cylindrical segment may be specified by l i and the radius of the cylindrical segment 900 may be specified by r i . Accordingly, cylindrical segment 900 may be configured by assigning values to the seven parameters x i , y 1 , z 1 ⁇ i , ⁇ i , l i and r i .
- FIG. 9B illustrates a configuration 950 of a cylindrical network model formed from a plurality of cylindrical segments arranged in a hierarchy.
- a vessel structure may include numerous vessels, each vessel having its own configuration in space to be described by the model.
- Configuration 950 includes a cylindrical segment 910 a which branches into two cylindrical segments 920 a and 920 b , which further branch until the network terminates at the leaves of the hierarchy (i.e., cylindrical segments 920 branch into cylindrical segments 930 , which in turn branch into segments 940 , 950 , 960 and so on).
- FIG. 10A illustrates a filter configured to respond to cylindrically shaped (tubular) structure.
- Filter 1020 is depicted as a cylinder to demarcate the approximate domain of the filter and is symbolic of the structure it is configured to respond to and does not illustrate the actual filter function. It should be appreciated that the filter is actually a 3D function that responds in some detectable manner to tubular or cylindrically shaped objects.
- filter 1020 may be a Gaussian function, one or more derivatives of the Gaussian function, a Hessian operator, etc.
- filter 1020 has a radial second derivative Gaussian distribution, is described below.
- Filter 1020 includes a number of parameters that together define the configuration of the filter. For example, to detect vessel structures, it may be desirable to vary the filter with respect to orientation and/or scale to account for the variation of the vessels in a vessel network. Accordingly, filter 1020 may include orientation parameters ⁇ i , ⁇ i to describe its orientation with respect to the x-axis and y-axis, respectively, and a radial parameter r i to describe the scale. It should be appreciated that the parameters of filter 1020 may correspond to parameters of the model of vessel structures in FIG. 9 . The parameterization of the filter allows the filter function to be configured to respond to structure of interest at a variety of locations, orientation and/or scales.
- the configuration of the filter parameters at which the filter is the most responsive may indicate the configuration of the underlying structure in the view data.
- the cylinder is merely symbolic of the domain of the filter function and the parameterization of any particular filter function may depend on the function itself.
- the ⁇ of a Gaussian filter function may operate as the scale parameter.
- FIG. 10B illustrates a plurality of the filters 1020 parameterized to form a cluster providing a wide range of hypotheses about how the structure is configured.
- Filter cluster 400 includes multiple filters 1020 positioned at a number of different orientations and scales, forming a filter bank adapted to test multiple hypotheses about the existence of structure at different configurations.
- cylindrical filter 1020 a has a radius r i and a longitudinal axis oriented along vector ⁇ x l , y l , z l >, which has orientation parameters ⁇ i , ⁇ i .
- Cylindrical filter 1020 b has a radius of r 2 and is oriented along the same vector ⁇ x l , y l , z l >.
- a selected number of other cylindrical filters are distributed at various orientations and scales to provide multiple hypotheses at a given location in space. It should be appreciated that, to better illustrate the orientations, the cylinders are not shown as having a common location, however, each of the filters 1020 may be given a common location point P 0 .
- the orientations of filters in a filter cluster located at a point P 0 are selected by sampling a 3D space at ⁇ /2 intervals over the 4 ⁇ directions, as shown in FIG. 10C .
- any orientation in 3D may be described by the direction of a vector from a center point P 0 to a surface of a sphere 1090 .
- One sampling of this orientation space includes providing a vector ⁇ x,y,z> from center location P 0 to each of the twenty-six locations of the 3D space sampled every ⁇ /2 radians.
- a cylinder positioned at P 0 and oriented along vector ⁇ x 0 ,y 0 ,z 0 > is identical to a cylinder positioned at P 0 and oriented along vector ⁇ x 0 , ⁇ y 0 , ⁇ z 0 >.
- the thirteen unique orientations are used to form a filter cluster.
- a filter may then be provided at location P 0 for each sampled orientation.
- filters at one or more scales e.g., filters being assigned different radii
- a filter cluster may comprise any type of filter that responds to structure of interest and may include filters of different types. For example, a combination of different filter types may be associated with a point P 0 to test for the existence of different or the same structure generally located at point P 0 .
- any number of filters at any configuration may be used, as the invention is not limited in this respect.
- the number of orientations and scale at which filters are distributed may depend on the type of structure that is being identified in the view data. For example, when vessels of the human body are being detected, the scale of the filters may correspond approximately to the scale of the vessels being detected. When vessels at multiple scales are being detected, filters may be provided by distributing filters over a wide range of scales.
- a filter cluster may be positioned at sample locations P in object space to generate hypotheses at multiple locations.
- FIG. 11 illustrates a filter cluster 1100 distributed over a selected volume of object space.
- the filter 1020 illustrated in FIG. 10A may be assigned sampled orientations as described in FIG. 10C to form filter cluster 1100 .
- the filter cluster may then be distributed at various locations in object space to test for the presence of structure similarly located.
- each partitioned region of tessellation 1175 may include a filter cluster comprising a filter oriented at the thirteen orientations of a 3D space sampled over the 4 ⁇ directions at ⁇ /2 radian intervals.
- one or more filters having different scales may be provided at each of the orientations. It should be appreciated that any filter cluster distributed in any fashion (e.g., uniformly or non-uniformly) may be used, as the aspects of the invention are not limited in this respect.
- the filters in each of the filter clusters may then be splatted to two dimensions, such as onto the (t,z) plane 1130 of view data obtained from scanning an object of interest.
- the filter splats may then be compared with the underlying view data to generate a measure of likelihood of structure for the corresponding configuration of the filter.
- the filter clusters described in FIGS. 10B and 10C produce a vector l of length 13 if a single scale is used (i.e., each filter configuration has the same radius r), a vector l of length 26 if two scales are used, etc.
- Each filter cluster may be splatted onto multiple views of the view data.
- each cluster may generate a number of values equal to the product of the length of the vector l and the number of views onto which the cluster is splatted.
- This set of data referred to herein as filter cluster data, provides a likelihood measure for the existence of structure positioned at the location of the corresponding filters in the cluster. That is, at each location in object space where a filter cluster is positioned, a hypothesis of structure existing at that location is made at multiple values for each varied filter parameter (e.g., a hypothesis may be made over multiple orientations and/or scales).
- the resulting filter cluster data from each filter cluster may be analyzed in any number of ways to determine whether the structure hypothesis is true, and which filter configurations most likely correspond to the actual configuration of the structure.
- the components of a vector l may be thresholded and peaks selected as the most likely configuration of the structure.
- Various probabilistic models may be used to determine the likelihood that structure exists at a particular configuration given the filter cluster data.
- the operation of convolving a filter splat from a 3D filter with the underlying view data in each of the views is equivalent to performing the convolution of the 3D filter with the 3D reconstructed data, except at the higher resolution of the view data.
- the various methods used to interpret conventional filter data from reconstructed data may be used to analyze the filter data from the view data to detect, identify and/or determine whether structure of interest is present.
- the process of the splatting the filters becomes more computationally expensive.
- the number of splatting operations may also need to be increased. For example, if each of the filters positioned in object space is splatted onto each view taken over a view angle range of 180°, the number of splatting operations may be relatively large. Applicant has appreciated that, by symmetry, the number of splatting operations may be reduced, often significantly. In particular, filter splats computed for particular filters at certain view angles may be reused at different view angles, reducing the total number of splatting operations that need be performed.
- FIG. 12 illustrates a method of detecting structure of interest in view data obtained from scanning an object assumed to contain at least some of the structure of interest, in accordance with one embodiment of the present invention.
- view data 1205 of an object of interest is obtained.
- the view data may correspond to 3D information formed from scanning a plurality of two-dimensional slices of the object of interest.
- View data 1205 may be obtained in any suitable way, as the invention is not limited in this respect.
- the view data may be obtained directly from an X-ray scanning device, from a storage medium storing previously obtained view data, over a network, etc.
- a filter adapted to respond in a detectable way to the structure of interest is generated.
- the filter may be configured to have a strong response when operating on view data resulting from the structure of interest and a weak response when operating on noise or content other than the structure of interest.
- the filter may be configured to respond in a pattern or other detectable characteristic in the presence of the subject matter of interest.
- the filter may be configured such that filter data resulting from application of a filter over a selected region of the view data has peaks, zero-crossings or other identifying patterns that indicate the presence of the structure of interest. Any filter configured to respond to or extract detectable properties of the structure of interest may be used, as the aspects of the invention are not limited in this respect.
- the selected filter is distributed in object space at a desired number of configurations.
- the filter may be distributed throughout object space at locations spaced apart to achieve a desired resolution in the detection of the structure of interest.
- the filter may be provided with multiple configurations, such as providing the filters at a number of different orientations and/or scales.
- the filter may be distributed in object space in any way and at any number of configurations, as the aspects of the invention are not limited in this respect.
- each of the filters distributed in object space are splatted into view space, to provide a plurality of filter splats to be compared with the underlying view data.
- each of the filters may be projected onto one or more views of the view data by computing line integrals through the filter function along a number of rays penetrating the filter.
- Other discrete and continuous methods may be used to splat the configured filters to provide filter splats to operate on the view data, as the aspects of the invention are not limited in this respect.
- the configured filters distributed in object space are splatted onto each view of the 3D view data.
- the filter splats are compared with the underlying view data.
- each filter splat may function as an operator on the view data over which the filter was projected to produce a filter-output.
- the filter operation may be a convolution operation or other comparison of the filter splat values with the underlying view data.
- the filter splats resulting from the differently configured filters at a given location in object space are convolved with the underlying view data in each view onto which the filter is splatted, each convolution operation providing the response of the underlying view data with the filter at the respective filter configuration. This operation may be repeated in each view to provide the equivalent operation of convolving the 3D filter with 3D reconstructed data, but at the increased resolution of the view data.
- the filter outputs are analyzed to determine the likelihood that structure of interest is present at the configuration of the corresponding filter.
- the filter outputs resulting from a particular location may (e.g., filter outputs resulting from each filter in a particular filter cluster) form a vector indicative of the likelihood of structure of interest being present in a respective view and having the configuration of the respective filters.
- each filter cluster provides a vector filter output in each view onto which the filter cluster is projected.
- the vectors over multiple views provide an indicator of whether or not structure is present at a given location, and at what configuration (e.g., orientation and/or scale).
- the vectors across multiple views resulting from a given filter cluster may be compared to provide a likelihood measure that structure of interest is present.
- the vectors from a given filter cluster may be summed or averaged to provide a single likelihood vector at each location at which a filter cluster is provided.
- a likelihood vector may then be analyzed in any number of ways to determine whether structure of interest is present. For example, a strong response (e.g., a large value) in one of the components of the likelihood vector relative to responses in other components may indicate the presence of structure of interest having the configuration associated with the predominant component. Accordingly, detection of the structure may include inspecting peaks and/or strong responses in the likelihood vectors.
- the likelihood vectors may be used in a probabilistic framework to determine the likelihood that structure is present. For example, a hypothesis that structure exists at a given location may be tested by determining the probability that the computed likelihood vectors resulted from the presence of structure.
- filter outputs may be analyzed for patterns such as peaks, zero-crossings, edges or other detectable properties in much the same way as conventional filter outputs are analyzed. Any method may be used to analyze the filter outputs to determine whether structure of interest is present in a location and configuration indicated by the associated filter, as the aspects of the invention are not limited for use with any particular analysis technique.
- filter design may depend on the type of structure being detected.
- a filter is designed to be responsive to the subject matter of interest in the view data, or to produce a detectable property or pattern when operating on the view data.
- the second derivative of the Gaussian function is used to form a filter for identifying the presence or absence of tubular structure in view data obtained from scanning an object of interest.
- the filter may be used to detect vessel structures in view data obtained from scanning a human patient or other biological subject containing vasculature.
- a filter designed to respond to subject matter of interest in view data arising from tubular structure, and the response of the projected filter splat.
- One embodiment of determining the likelihood that subject matter of interest is present from the filter data using Bayesian analysis is set forth in section C below.
- One embodiment of a filter for identifying tubular structure for example, blood vessels, includes a three dimensional filter function having the second derivative of the Gaussian function as a radial distribution (e.g., in the XY plane of object space) and a Gaussian distribution along the z-axis. That is, the filter has a second derivative Gaussian cross-section having a radius that falls off as the Gaussian.
- the filter function may be expressed as:
- h rr ( r 2 ⁇ r 2 - 1 ) ⁇ e - 1 2 ⁇ ⁇ r 2 ⁇ ( r 2 ) ⁇ e - 1 2 ⁇ ⁇ z 2 ⁇ ( z 2 ) ( 1 )
- a filter may be applied to view data by splatting the filter to two dimensions, a process which includes taking a volume integral of the filter. It may be desirable to have the volume integral of the filter vanish such that the filter does not respond to view data having a constant density. However, the 2 nd derivative of the Gaussian does not integrate to zero. Rather,
- the integral can be forced to zero by providing an offset
- a tubular structure is modeled as a line impulse.
- the line impulse may be parameterized as an infinite line of the parameter t passing through an origin at an angle ⁇ from the radial axis r (i.e., from the XY plane).
- h rr ⁇ ( t , ⁇ ) k ⁇ 1 ⁇ r 2 ⁇ ( t 2 ⁇ Cos 2 ⁇ ⁇ ⁇ r 2 - 2 ) ⁇ e - 1 2 ⁇ ⁇ r 2 ⁇ ( t 2 ⁇ Cos 2 ⁇ ⁇ ) ⁇ e - 1 2 ⁇ ⁇ z 2 ⁇ ( t 2 ⁇ Sin 2 ⁇ ⁇ ) ( 5 )
- FIG. 14 symbolically illustrates the filter described in equation 3.
- filter 1420 generally demarcates the domain of the filter.
- the filter function describes a second derivative Gaussian in the radial direction that falls off as the Gaussian in the z direction, and does not describe a cylinder.
- the filter is represented as a cylinder.
- Line impulses 1410 illustrate three possible ways in which an arbitrarily positioned filter may be located with respect to structure of interest (e.g., line impulses).
- FIG. 15A illustrates profiles of the filter function along each of lines 1410 with respect to the line parameter t.
- profile 1510 a corresponds to the variation of the filter function described in equation 5 along line impulse 1410 a
- profile 1510 b corresponds to the variation of the filter function along line impulse 1410 b
- profile 1510 c corresponds to the variation of the filter function along line impulse 1410 c .
- the line impulse response may be found by integrating the profiles over t. For an arbitrary ⁇ , the line impulse response may be expressed in closed form as,
- h ⁇ ⁇ ( ⁇ ) k ⁇ r 2 ⁇ ⁇ - ⁇ ⁇ ⁇ ( t 2 ⁇ Cos 2 ⁇ ⁇ ⁇ r 2 - 1 ) ⁇ e - 1 2 ⁇ ⁇ r 2 ⁇ ( t 2 ⁇ Cos 2 ⁇ ⁇ ) ⁇ e - 1 2 ⁇ ⁇ z 2 ⁇ ( t 2 ⁇ Sin 2 ⁇ ⁇ ) ⁇ ⁇ d t ( 6 )
- the line impulse response may be found at desired values of ⁇ .
- the shape of the filter may be controlled by varying the width of the radial profile of the second derivative (i.e., ⁇ r of the filter function) and by varying how quickly the radial distribution decays in the z-direction (i.e., ⁇ r of the filter function).
- the normalization function may be expressed as,
- FIG. 15B illustrates impulse line responses for three different sharpness ratios ⁇ .
- the filter bank has maximum response at ⁇ /2 for each 45° location.
- the sum of the filter responses is illustrated in FIG. 16B .
- the response of the filter bank to structure for example, a cylinder modeling tubular structure in the view data can be found by integrating over the cross-section of the cylinder. That is, the impulse response of the filter designed according to equation 5 can be used to determine the response of the filter to any structure by integrating over the modeled function for the structure of interest.
- the filter data obtained from filtering the view data in view space may be used to determine the likelihood that the response to the filter resulted from the structure being detected or whether the response resulted from noise or other subject matter or content.
- There are numerous methods of processing the filter data to make this determination including the various methods currently used in conventional filtering of reconstructed data to categorize, classify and/or otherwise identify filter responses resulting from subject matter of interest. For example, empirical methods such as analyzing the features of the filter response to identify characteristic patterns such as peaks, zero-crossings, maximal/minimal gradients, etc., may be used. Any of various statistical methods may be used to generate the likelihood that a filter response resulted from subject matter of interest.
- a Bayesian framework is used to determine the likelihood of the presence of subject matter of interest and to determine the parameters of that subject matter (e.g., to determine the orientation, scale, etc. of the subject matter of interest), as described below. It should be appreciated that any method of analyzing the filter data may be used, as the aspects of the invention are not limited in this respect.
- the following hypothesis testing framework is one exemplary formulation that may be used to determine the likelihood that subject matter of interest is present in view data based on the filter data output by a filter splat. Probabilistic methods such as the one described below are known in the art. Hypothesis testing includes determining the likelihood that structure of interest modeled by a selected model parameter vector ⁇ is present based on observed data D. It should be appreciated that model parameter vector ⁇ may be chosen to model any desired structure of interest.
- the posterior probability distribution for a set of models, M i is given by,
- p ⁇ ( ⁇ M i , ⁇ ⁇ ⁇ f 0 , f 1 , ... ⁇ ⁇ f n - 1 ) p ( f 0 , f 1 , ... ⁇ ⁇ f n - 1 ⁇ ⁇ M i , ⁇ ) p ⁇ ( f 0 , f 1 , ... ⁇ ⁇ f n - 1 ) ⁇ p ⁇ ( M i , ⁇ )
- the latter expression only provides the joint probability that we have model M i when the parameter values are in an interval around ⁇ circumflex over ( ⁇ ) ⁇ . If there are multiple solutions with nearly the same probability, the estimate of the model probability may not locate the optimal solution. In either case, the model that should be selected is the one that maximizes either of the expressions in equation 8 and equation 9 below.
- p ⁇ ( M i ) ⁇ ⁇ ⁇ p ( M i , ⁇ ⁇ ⁇ f 0 , f 1 , ... ⁇ ⁇ f n - 1 ) ⁇ ⁇ d ⁇ MP ( 8 )
- n filters for the one-dimensional orientation of a cylinder in a meridian plane there are n filters for the one-dimensional orientation of a cylinder in a meridian plane and these filters are spaced equally in object space.
- Each filter, f i is centered on an angle, ⁇ i .
- a cylinder Given a set of parameters, ⁇ , a cylinder would have a specific ideal response, [f 0 ,f 1 , . . . f n ⁇ 1 ] Cyl ( ⁇ ).
- the actual response [f 0 ,f 1 , . . . f n-1 ] D will differ from the ideal response due to noise.
- the MAP probability for the cylinder is,
- the transformed joint density is given by,
- FIG. 17A illustrates the conditional probability density p(f i
- FIG. 17B shows the conditional probability density for a single filter response to a unit line impulse at various filter sharpness values, ⁇ .
- the probability density at the peak orientation of the filter is independent of filter sharpness since the peak value is always unity, so the density is just that of a normal distribution at zero, i.e., 1/ ⁇ square root over (2 ⁇ ) ⁇ .
- observed filter output densities near zero are most probable since both noise and line impulses not at the peak filter response produce small observed data values.
- the parameters of the cylinder can be determined by a number of processing methods once a cylinder has been detected. For example, a linked chain of cylinder detections may be used to determine the local orientation of the axis.
- the cylinder orientation is determined from the filter outputs in the probabilistic framework, as analyzed below.
- the posterior probability density for the line impulse orientation, given that a line impulse is present is,
- FIG. 21B illustrates the standard deviation in probable line orientation as a function of noise ratio, ⁇ , with different filter sharpness values, ⁇ .
- FIG. 22A illustrates the probability density for line impulse orientation with filters oriented at 45° and 90°.
- the observed filter output vector is [0.42, 0.21], corresponding to an ideal filter response to a line impulse at 60°.
- the probability densities are shown for various noise ratios.
- FIG. 22B illustrates cylinder probabilities over a range of line impulse orientations for different filter sharpness ratios ⁇ .
- the observed filter output vector is [0.12, 0.42, 0.21, 0.10], corresponding to an ideal filter response to a line impulse at 60 degrees.
- Orientations near the peak response of each filter have negligible probability density, since the observed filter outputs are far from the required values for a line impulse oriented at one of the filter orientations, i.e., [0, . . . , 1, 0, . . . 0].
- Class probability 2410 a illustrates the class probability for a cylinder.
- Class probability 2410 b illustrates the class probability for a sphere.
- Class probability 2410 c illustrates the class probability for noise.
- the observed filter output vector is [0.12, 0.42, 0.21, 0.10], corresponding to an ideal filter response to a line impulse at 60 degrees. The spherical impulse becomes most probable if the filter outputs are all equal.
- An example is shown in the class probabilities illustrated in FIG. 25 .
- the dominance of the sphere hypothesis persists to significantly higher noise levels than the cylinder hypothesis in the example of FIG. 24 .
- Class probability 2510 a illustrates the class probability for a cylinder.
- Class probability 2510 b illustrates the class probability for a sphere.
- Class probability 2510 c illustrates the class probability for noise.
- the observed filter output vector is [0.5, 0.5, 0.5, 0.5], corresponding to a spherical impulse with density, 0.5.
- Class probability 2610 a illustrates the class probability for a cylinder.
- Class probability 2610 b illustrates the class probability for a sphere.
- Class probability 2610 c illustrates the class probability for noise.
- the observed filter output vector is [ ⁇ 0.08, 0.075, ⁇ 0.05, 0.01], corresponding to a spherical impulse with density, 0.5.
- any number or type of hypothesis for various class types may be tested.
- the above hypothesis testing in a Bayesian framework is described merely as one exemplary embodiment of a method for analyzing filter outputs to determine if subject matter of interest is present in the view.
- any method of analyzing the filter outputs or processing the filter data may be used, as the aspects of the invention are not limited for use with any particular analysis method or type of processing the filter data.
- a filter may be designed to respond to any subject matter in the view data associated with any structure, material, item, etc. in an object, as the aspects of the invention are limited for use with any particular filter or to detect the presence of any particular type of subject matter.
- tubular or generally cylindrical structure may be of interest when detecting the presence of such things as blood vessels in view data of a biological object, such as a patient, and the filter described in Section B illustrates one embodiment of a filter designed to respond to generally tubular structure.
- any filter may be used in connection with the various aspects of the invention (e.g., from relatively simple filters such as difference and/or smoothing filters, to more complex and sophisticated filters adapted to respond to specific subject matter of interest), several exemplary filters are provided below.
- FIGS. 27 and 28 illustrate embodiments of other filter designs that may be used in connection with the various aspects of the present invention.
- FIG. 27 illustrates the use of the Hessian operator in designing a filter as a derivation of the Taylor Series expansion of the density as illustrated in FIG. 27A .
- the 3D Hessian operator is illustrated in FIG. 27B .
- FIGS. 27C and 27D illustrate the even function associated with the second partial derivative with respect to x
- FIGS. 27E and 27F illustrate the odd function associated the partial derivative with respect to x and y.
- the principal directions of the output from the Hessian operator indicate the orientation of, for example, tubular structure that, when scanned, gave rise to the view data on which the filter operates.
- FIG. 28 illustrates the use of steerable filters formed from an even 2 nd order polynomial (e.g., derivative of Gaussian as in the Hessian).
- the steerable filter may be rotated to form six evenly distributed directions to be used as basis filters f(x).
- the direction cosines are illustrated in FIG. 28A .
- the steering equation for an arbitrary filter direction defined by the direction cosines ( ⁇ , ⁇ , ⁇ ) is shown in FIG. 28B .
- the steering coefficients k i may be found by inverting the set of constraints on the monomials illustrated in FIG. 28C .
- a cylinder model is expanded into a set of spherical harmonics as shown in equation 26 below.
- the filters may be applied by using any number of harmonics. For example, up to 3 rd order harmonics may be applied as filters. Cylinder parameters may be recovered from the values of A lm in equation 26.
- I ⁇ ⁇ ( ⁇ , ⁇ , ⁇ ) ⁇ l , m ⁇ A lm ⁇ Y lm ⁇ ( ⁇ , ⁇ ) ⁇ e - 1 2 ⁇ ⁇ 2 ⁇ ( ⁇ - ⁇ 0 ) 2 ( 26 )
- the filters described in the embodiments herein are merely exemplary, as the aspects of the invention are not limited in this respect.
- Various concepts related to applying a filter to view data that varies as a function of at least one variable associated with the view data and/or concepts related to splatting or projecting filters onto view data are intended to be general and can be used with any type of filter having any type of filter function.
- the generalized filter model described above may be used to filter view data obtained in any number of X-ray scanning configurations.
- the generalized filter model may be used with view data obtained using a cone beam, a fan beam, a pencil beam, or other beam configurations, as the aspects of the invention are not limited in this respect.
- filtering view data according to some aspects of the present invention may result in the same operation as filtering reconstructed data (and at the higher resolution of the view data) for view data obtained using an X-ray beam having either parallel or non-parallel rays, as discussed in further detail below.
- FIG. 29A illustrates a filter 2920 being splat (e.g., projected) onto plane 2930 using non-parallel X-rays emanating from a source 2910 .
- X-ray imaging with a fan beam (or cone beam) geometry causes an apparent change in scale of the shadow of an object (e.g., an object being scanned, or a filter being splatted) on the plane 2930 , for example, the relative scale of disks A, B, C and D are 7, 8, 7 and 6, respectively.
- filter splatting may be performed by taking line integrals through the filter in correspondence to the same process by which the original X-ray projection is formed.
- non-parallel rays e.g., a fan beam geometry
- FIG. 29B illustrates a filter 2920 being projected or splat onto plane 2930 using parallel rays.
- parallel beam projection produces the Radon transform for a given projection angle, ⁇ , as shown in FIG. 29B .
- the projection of a structure e.g., structure being scanned, a filter being splatted, etc.
- the projection of a structure in the X-Y plane is formed by line integration along the s direction forming a 1-d image as a function of t. That is,
- ⁇ ⁇ denotes the parallel X-ray projection of the corresponding 2-d function ⁇ along direction ⁇ .
- the projection of the convolution is the convolution of the projection for the parallel beam case, which is an assumption underlying embodiments of the filter splat process of model-based reconstruction.
- g ⁇ ( t ) ⁇ - ⁇ ⁇ ⁇ ⁇ ⁇ ⁇ ⁇ ⁇ e 2 ⁇ ⁇ ⁇ ⁇ i ⁇ t ⁇ d ⁇ ( 31 )
- the relationship between the X-Y coordinate system and the t-s coordinate system in the case of fan beam geometry can be represented by a projective mapping.
- the projection of a world point (x,y) is given by,
- mapping can be expanded about a point (x 0 ,y 0 ) as shown in FIGS. 30A and 30B .
- w projective scale factor
- the affine projection of the filter region is identical to the parallel projection case, except that there is a scaling in the image by a factor, ⁇ .
- the resulting local image coordinate, ⁇ is given by,
- ⁇ para is the projection coordinate that corresponds to a true parallel projection at point (x 0 ,y 0 ). Note that under this approximation, the ray arc length is the same as in the parallel beam case but the orientation of the rays is now different from the orientation specified by the parallel projection rotation angle, ⁇ para .
- the actual orientation is given by,
- ⁇ ⁇ * f ⁇ affine _ _ ⁇ ( 0 ) ⁇ - ⁇ ⁇ ⁇ ⁇ _ _ ⁇ ⁇ ( u a ) ⁇ f _ _ ⁇ ⁇ ( - u a ) ⁇ d u ( 45 )
- the current filtering dot products may be corrected by dividing out the scale factor, that is,
- h affine ⁇ ( - u a ) ⁇ - ⁇ ⁇ ⁇ g ⁇ ( - t ) ⁇ f _ _ ⁇ i ⁇ ( t - u a ) ⁇ d t . ( 48 )
- h affline ⁇ ( - u a ) a ⁇ ⁇ - ⁇ ⁇ ⁇ g ⁇ ( - av ) ⁇ f — — ⁇ i ⁇ ( v - u a ) ⁇ d v ( 49 )
- processing speeds may be increased by an order of magnitude.
- increased processing speeds are not a limitation on the aspects of the invention.
- filtering the view data may perform the same operation as filtering reconstructed data (but at the higher resolution of the view data), other embodiments of filtering the view data may perform separate operations, as the aspects of the invention are not limited in this respect.
- the view data operated on in methods of the various embodiments described herein may be at the maximum resolution that a given X-ray scanning device can generate.
- various factors such as the number of detectors in the X-ray scanning device (or the sampling rate of a detector array), the angle interval over which the data is obtained, etc., limit the resolution of the view data.
- the resolution of the view data exceeds the resolution of images reconstructed from the data.
- the resolution of the view data may be up to five times the resolution of the reconstructed image data, or more. Accordingly, by operating directly on the view data, various aspects of the invention may facilitate detection of structure at a higher resolution than available by detection methods applied to conventional reconstructed images.
- conventional reconstructed data computed from view data obtained by large object X-ray devices may be unable to resolve structure below 500 microns.
- structures may be detected having dimensions below 500 microns, more preferably below 250 microns, more preferably below 100 microns, and even more preferably below 50 microns.
- microCT may be capable of providing view data at a resolution an order of magnitude or more higher than large object X-ray devices.
- Conventional reconstructed data computed from view data obtained by microCT devices may be unable to resolve structure below 50 microns.
- structures may be detected below 50 microns, more preferably below 25 microns, more preferably below 10 microns, and even more preferably below 5 microns.
- optimizing or otherwise updating a configuration via comparisons with the view data is different than detecting features in the view data to determine a value for one or more model parameters.
- Detecting a feature involves gleaning information directly from the view data itself as opposed to conventional techniques for optimizing a model to view data, whereby any information about the view data is determined indirectly through the use of the model.
- the above-described embodiments of the present invention can be implemented in any of numerous ways.
- the embodiments may be implemented using hardware, software or a combination thereof.
- the software code can be executed on any suitable processor or collection of processors, whether provided in a single computer or distributed among multiple computers.
- any component or collection of components that perform the functions described above can be generically considered as one or more controllers that control the above-discussed function.
- the one or more controller can be implemented in numerous ways, such as with dedicated hardware, or with general purpose hardware (e.g., one or more processor) that is programmed using microcode or software to perform the functions recited above.
- one embodiment of the invention is directed to a computer readable medium (or multiple computer readable media) (e.g., a computer memory, one or more floppy discs, compact discs, optical discs, magnetic tapes, etc.) encoded with one or more programs that, when executed on one or more computers or other processors, perform methods that implement the various embodiments of the invention discussed above.
- the computer readable medium or media can be transportable, such that the program or programs stored thereon can be loaded onto one or more different computers or other processors to implement various aspects of the present invention as discussed above.
- program is used herein in a generic sense to refer to any type of computer code or set of instructions that can be employed to program a computer or other processor to implement various aspects of the present invention as discussed above. Additionally, it should be appreciated that according to one aspect of this embodiment, one or more computer programs that when executed perform methods of the present invention need not reside on a single computer or processor, but may be distributed in a modular fashion amongst a number of different computers or processors to implement various aspects of the present invention.
Landscapes
- Engineering & Computer Science (AREA)
- Health & Medical Sciences (AREA)
- Physics & Mathematics (AREA)
- Life Sciences & Earth Sciences (AREA)
- Chemical & Material Sciences (AREA)
- Organic Chemistry (AREA)
- Theoretical Computer Science (AREA)
- General Physics & Mathematics (AREA)
- Veterinary Medicine (AREA)
- Animal Behavior & Ethology (AREA)
- General Health & Medical Sciences (AREA)
- Public Health (AREA)
- Nuclear Medicine, Radiotherapy & Molecular Imaging (AREA)
- Medical Informatics (AREA)
- Geometry (AREA)
- Pharmacology & Pharmacy (AREA)
- Medicinal Chemistry (AREA)
- General Chemical & Material Sciences (AREA)
- Chemical Kinetics & Catalysis (AREA)
- Optics & Photonics (AREA)
- Pathology (AREA)
- Surgery (AREA)
- Molecular Biology (AREA)
- Heart & Thoracic Surgery (AREA)
- Biophysics (AREA)
- High Energy & Nuclear Physics (AREA)
- Biomedical Technology (AREA)
- Radiology & Medical Imaging (AREA)
- Pulmonology (AREA)
- Computer Vision & Pattern Recognition (AREA)
- Computer Graphics (AREA)
- Software Systems (AREA)
- Bioinformatics & Cheminformatics (AREA)
- Physiology (AREA)
- Apparatus For Radiation Diagnosis (AREA)
- Image Processing (AREA)
- Investigating Or Analysing Biological Materials (AREA)
- Measuring Or Testing Involving Enzymes Or Micro-Organisms (AREA)
Priority Applications (8)
| Application Number | Priority Date | Filing Date | Title |
|---|---|---|---|
| US11/299,558 US7978887B2 (en) | 2003-06-17 | 2005-12-09 | Methods and apparatus for identifying subject matter in view data |
| JP2008544585A JP5570725B2 (ja) | 2005-12-09 | 2006-12-08 | 表示データ内の関心対象物を識別するための方法および装置 |
| CA2672094A CA2672094C (en) | 2005-12-09 | 2006-12-08 | Methods and apparatus for identifying subject matter in view data |
| PCT/US2006/047236 WO2007084221A2 (en) | 2005-12-09 | 2006-12-08 | Methods and apparatus for identifying subject matter in view data |
| EP06845213A EP2046776A2 (en) | 2005-12-09 | 2006-12-08 | Methods and apparatus for identifying subject matter in view data |
| US13/154,787 US8515145B2 (en) | 2003-06-17 | 2011-06-07 | Methods and apparatus for identifying subject matter in view data |
| US13/969,669 US20150003737A1 (en) | 2003-06-17 | 2013-08-19 | Methods and apparatus for identifying subject matter in view data |
| US14/706,522 US9576198B2 (en) | 2003-06-17 | 2015-05-07 | Methods and apparatus for identifying subject matter in view data |
Applications Claiming Priority (3)
| Application Number | Priority Date | Filing Date | Title |
|---|---|---|---|
| US47911403P | 2003-06-17 | 2003-06-17 | |
| US10/871,265 US7492934B2 (en) | 2003-06-17 | 2004-06-17 | Methods and apparatus for model-based detection of structure in view data |
| US11/299,558 US7978887B2 (en) | 2003-06-17 | 2005-12-09 | Methods and apparatus for identifying subject matter in view data |
Related Parent Applications (1)
| Application Number | Title | Priority Date | Filing Date |
|---|---|---|---|
| US10/871,265 Continuation-In-Part US7492934B2 (en) | 2003-06-17 | 2004-06-17 | Methods and apparatus for model-based detection of structure in view data |
Related Child Applications (1)
| Application Number | Title | Priority Date | Filing Date |
|---|---|---|---|
| US13/154,787 Continuation US8515145B2 (en) | 2003-06-17 | 2011-06-07 | Methods and apparatus for identifying subject matter in view data |
Publications (2)
| Publication Number | Publication Date |
|---|---|
| US20060182327A1 US20060182327A1 (en) | 2006-08-17 |
| US7978887B2 true US7978887B2 (en) | 2011-07-12 |
Family
ID=37998293
Family Applications (4)
| Application Number | Title | Priority Date | Filing Date |
|---|---|---|---|
| US11/299,558 Expired - Fee Related US7978887B2 (en) | 2003-06-17 | 2005-12-09 | Methods and apparatus for identifying subject matter in view data |
| US13/154,787 Expired - Fee Related US8515145B2 (en) | 2003-06-17 | 2011-06-07 | Methods and apparatus for identifying subject matter in view data |
| US13/969,669 Abandoned US20150003737A1 (en) | 2003-06-17 | 2013-08-19 | Methods and apparatus for identifying subject matter in view data |
| US14/706,522 Active US9576198B2 (en) | 2003-06-17 | 2015-05-07 | Methods and apparatus for identifying subject matter in view data |
Family Applications After (3)
| Application Number | Title | Priority Date | Filing Date |
|---|---|---|---|
| US13/154,787 Expired - Fee Related US8515145B2 (en) | 2003-06-17 | 2011-06-07 | Methods and apparatus for identifying subject matter in view data |
| US13/969,669 Abandoned US20150003737A1 (en) | 2003-06-17 | 2013-08-19 | Methods and apparatus for identifying subject matter in view data |
| US14/706,522 Active US9576198B2 (en) | 2003-06-17 | 2015-05-07 | Methods and apparatus for identifying subject matter in view data |
Country Status (5)
| Country | Link |
|---|---|
| US (4) | US7978887B2 (ja) |
| EP (1) | EP2046776A2 (ja) |
| JP (1) | JP5570725B2 (ja) |
| CA (1) | CA2672094C (ja) |
| WO (1) | WO2007084221A2 (ja) |
Cited By (7)
| Publication number | Priority date | Publication date | Assignee | Title |
|---|---|---|---|---|
| US20080013815A1 (en) * | 2006-06-16 | 2008-01-17 | Ruggero Scorcioni | Arborization Reconstruction |
| US20090123053A1 (en) * | 2003-06-17 | 2009-05-14 | Brown University | Methods and apparatus for model-based detection of structure in view data |
| US20100145681A1 (en) * | 2008-12-08 | 2010-06-10 | Begel Daniel M | Method and system to identify, quantify, and display acoustic transformational structures in speech |
| US20110255761A1 (en) * | 2007-06-26 | 2011-10-20 | University Of Rochester | Method and system for detecting lung tumors and nodules |
| US10127717B2 (en) | 2016-02-16 | 2018-11-13 | Ohzone, Inc. | System for 3D Clothing Model Creation |
| US10373386B2 (en) | 2016-02-16 | 2019-08-06 | Ohzone, Inc. | System and method for virtually trying-on clothing |
| US11615462B2 (en) | 2016-02-16 | 2023-03-28 | Ohzone, Inc. | System for virtually sharing customized clothing |
Families Citing this family (18)
| Publication number | Priority date | Publication date | Assignee | Title |
|---|---|---|---|---|
| US7978887B2 (en) | 2003-06-17 | 2011-07-12 | Brown University | Methods and apparatus for identifying subject matter in view data |
| US8126226B2 (en) * | 2007-09-20 | 2012-02-28 | General Electric Company | System and method to generate a selected visualization of a radiological image of an imaged subject |
| US8676744B2 (en) * | 2007-10-25 | 2014-03-18 | Lawrence Livermore National Security, Llc | Physics-based, Bayesian sequential detection method and system for radioactive contraband |
| US8761466B2 (en) * | 2008-01-02 | 2014-06-24 | Bio-Tree Systems, Inc. | Methods of obtaining geometry from images |
| CN102177528B (zh) * | 2008-10-10 | 2014-05-14 | 皇家飞利浦电子股份有限公司 | 高对比度成像和快速成像重建 |
| US8116426B2 (en) * | 2008-11-11 | 2012-02-14 | Kabushiki Kaisha Toshiba | Computed tomography device and method using circular-pixel position-adaptive interpolation |
| KR101014563B1 (ko) * | 2009-08-07 | 2011-02-16 | 주식회사 메디슨 | 혈관 세그먼테이션을 수행하는 초음파 시스템 및 방법 |
| KR100975128B1 (ko) * | 2010-01-11 | 2010-08-11 | (주)올라웍스 | 뷰잉 프러스텀을 이용하여 객체에 대한 정보를 제공하기 위한 방법, 시스템 및 컴퓨터 판독 가능한 기록 매체 |
| JP5590548B2 (ja) * | 2010-02-03 | 2014-09-17 | 国立大学法人京都大学 | X線ct画像処理方法,x線ctプログラムおよび該プログラムが搭載されたx線ct装置 |
| ES2382774B1 (es) * | 2010-02-12 | 2013-04-26 | Universitat Pompeu Fabra | Metodo para obtener una reconstruccion tridimensional a partir de una o mas vistas proyectivas, y uso de la misma |
| US8971599B2 (en) * | 2010-12-20 | 2015-03-03 | General Electric Company | Tomographic iterative reconstruction |
| WO2012102990A2 (en) * | 2011-01-25 | 2012-08-02 | President And Fellows Of Harvard College | Method and apparatus for selecting clusterings to classify a data set |
| US8787644B2 (en) * | 2011-06-14 | 2014-07-22 | Kabushiki Kaisha Toshiba | Method and device for calculating voxels defining a tube-of-response using a central-ray-filling algorithm |
| US9412040B2 (en) * | 2013-12-04 | 2016-08-09 | Mitsubishi Electric Research Laboratories, Inc. | Method for extracting planes from 3D point cloud sensor data |
| EP3413033B1 (en) * | 2017-06-09 | 2020-09-23 | Roche Diagnostics GmbH | Method and apparatus for determining properties of a laboratory sample contained in a laboratory sample container |
| JP7072158B2 (ja) * | 2017-09-29 | 2022-05-20 | 株式会社 資生堂 | 皮膚の血管網を可視化する装置、方法およびプログラム |
| US10885368B2 (en) * | 2018-05-16 | 2021-01-05 | Government Of The United States Of America, As Represented By The Secretary Of Commerce | Six-dimensional smart target |
| CN111096761B (zh) * | 2018-10-29 | 2024-03-08 | 上海西门子医疗器械有限公司 | 修正楔形滤波器散射的方法、装置和相关设备 |
Citations (25)
| Publication number | Priority date | Publication date | Assignee | Title |
|---|---|---|---|---|
| US5699799A (en) | 1996-03-26 | 1997-12-23 | Siemens Corporate Research, Inc. | Automatic determination of the curved axis of a 3-D tube-shaped object in image volume |
| US5712803A (en) | 1995-06-23 | 1998-01-27 | Kreon Industrie | Method of acquiring and digitizing objects through a transparent wall |
| US5769640A (en) | 1992-12-02 | 1998-06-23 | Cybernet Systems Corporation | Method and system for simulating medical procedures including virtual reality and control method and system for use therein |
| US5921920A (en) | 1996-12-12 | 1999-07-13 | The Trustees Of The University Of Pennsylvania | Intensive care information graphical display |
| US5966141A (en) | 1996-09-03 | 1999-10-12 | Monolith Co., Ltd. | Apparatus and method for animation using topology |
| US6028907A (en) * | 1998-05-15 | 2000-02-22 | International Business Machines Corporation | System and method for three-dimensional geometric modeling by extracting and merging two-dimensional contours from CT slice data and CT scout data |
| US6236878B1 (en) | 1998-05-22 | 2001-05-22 | Charles A. Taylor | Method for predictive modeling for planning medical interventions and simulating physiological conditions |
| US20010020175A1 (en) * | 1998-06-16 | 2001-09-06 | Yuval Yassour | Implantable blood filtering device |
| WO2002031768A2 (en) | 2000-10-13 | 2002-04-18 | Vimatix Technologies Ltd. | Method and apparatus for image analysis and processing by identification of characteristic lines and corresponding parameters |
| US6409760B1 (en) | 1998-03-05 | 2002-06-25 | University Of Cincinnati | Device and method for restructuring heart chamber geometry |
| US6434265B1 (en) | 1998-09-25 | 2002-08-13 | Apple Computers, Inc. | Aligning rectilinear images in 3D through projective registration and calibration |
| US20020114503A1 (en) * | 2001-02-17 | 2002-08-22 | Siemens Aktiengesellschaft | Method and apparatus for processing a computed tomography image of a lung obtained using contrast agent |
| WO2002066470A1 (en) | 2001-01-12 | 2002-08-29 | Amgen Inc. | Substituted alkylamine derivatives and methods of use |
| US20020142294A1 (en) | 2000-11-30 | 2002-10-03 | Blair Edward Duncan | Diagnostic method |
| US6501848B1 (en) | 1996-06-19 | 2002-12-31 | University Technology Corporation | Method and apparatus for three-dimensional reconstruction of coronary vessels from angiographic images and analytical techniques applied thereto |
| US6507633B1 (en) | 2001-02-15 | 2003-01-14 | The Regents Of The University Of Michigan | Method for statistically reconstructing a polyenergetic X-ray computed tomography image and image reconstructor apparatus utilizing the method |
| US20030053697A1 (en) | 2000-04-07 | 2003-03-20 | Aylward Stephen R. | Systems and methods for tubular object processing |
| US20030076987A1 (en) | 1999-12-07 | 2003-04-24 | Wilson Laurence Sydney | Knowledge based computer aided diagnosis |
| US20030099391A1 (en) | 2001-11-29 | 2003-05-29 | Ravi Bansal | Automated lung nodule segmentation using dynamic progamming and EM based classifcation |
| US20030187358A1 (en) | 2001-11-05 | 2003-10-02 | Okerlund Darin R. | Method, system and computer product for cardiac interventional procedure planning |
| US20040267114A1 (en) | 2003-06-17 | 2004-12-30 | Brown University | Methods and apparatus for model-based detection of structure in view data |
| US6915004B2 (en) | 2002-02-28 | 2005-07-05 | Cti Pet Systems, Inc. | Continuous tomography bed motion data processing apparatus and method |
| US7043290B2 (en) | 2001-09-06 | 2006-05-09 | Koninklijke Philips Electronics N.V. | Method and apparatus for segmentation of an object |
| US20060182327A1 (en) | 2003-06-17 | 2006-08-17 | Brown Universtiy | Methods and apparatus for identifying subject matter in view data |
| US7257237B1 (en) | 2003-03-07 | 2007-08-14 | Sandia Corporation | Real time markerless motion tracking using linked kinematic chains |
Family Cites Families (15)
| Publication number | Priority date | Publication date | Assignee | Title |
|---|---|---|---|---|
| JP3488515B2 (ja) * | 1994-08-31 | 2004-01-19 | 東芝医用システムエンジニアリング株式会社 | 診断支援システムおよび診断支援方法 |
| JPH08166995A (ja) * | 1994-12-13 | 1996-06-25 | Toshiba Corp | 医用診断支援システム |
| JP4046399B2 (ja) * | 1998-02-09 | 2008-02-13 | オリンパス株式会社 | 画像検出装置及び画像検出方法、並びに画像検出プログラムを記録した記録媒体 |
| US6226350B1 (en) * | 1998-12-31 | 2001-05-01 | General Electric Company | Methods and apparatus for cardiac scoring with a multi-beam scanner |
| JP2001216517A (ja) * | 2000-02-04 | 2001-08-10 | Zio Software Inc | 物体認識方法 |
| DE10143484A1 (de) * | 2001-09-05 | 2003-04-03 | Siemens Ag | Adaptives Filter |
| US7379572B2 (en) * | 2001-10-16 | 2008-05-27 | University Of Chicago | Method for computer-aided detection of three-dimensional lesions |
| US6609021B1 (en) * | 2002-05-20 | 2003-08-19 | Siemens Corporate Research, Inc. | Pulmonary nodule detection using cartwheel projection analysis |
| FI116750B (fi) * | 2002-08-28 | 2006-02-15 | Instrumentarium Corp | Lääketieteellisen röntgenkuvauksen menetelmä ja järjestely |
| US7593562B2 (en) * | 2002-09-24 | 2009-09-22 | Carestream Health, Inc. | Method and system for computer aided detection (CAD) cued reading of medical images |
| JP2004159913A (ja) * | 2002-11-13 | 2004-06-10 | Fuji Photo Film Co Ltd | 異常陰影候補検出装置 |
| JP2004195080A (ja) * | 2002-12-20 | 2004-07-15 | Fuji Photo Film Co Ltd | 異常陰影検出装置 |
| US6937776B2 (en) * | 2003-01-31 | 2005-08-30 | University Of Chicago | Method, system, and computer program product for computer-aided detection of nodules with three dimensional shape enhancement filters |
| JP3947152B2 (ja) * | 2003-10-14 | 2007-07-18 | 東芝医用システムエンジニアリング株式会社 | マンモグラフィ装置 |
| CN1902640A (zh) * | 2003-11-12 | 2007-01-24 | 西门子共同研究公司 | 对医学图像中的候选解剖结构进行滤波和自动检测的系统和方法 |
-
2005
- 2005-12-09 US US11/299,558 patent/US7978887B2/en not_active Expired - Fee Related
-
2006
- 2006-12-08 JP JP2008544585A patent/JP5570725B2/ja not_active Expired - Fee Related
- 2006-12-08 CA CA2672094A patent/CA2672094C/en not_active Expired - Fee Related
- 2006-12-08 WO PCT/US2006/047236 patent/WO2007084221A2/en active Application Filing
- 2006-12-08 EP EP06845213A patent/EP2046776A2/en not_active Withdrawn
-
2011
- 2011-06-07 US US13/154,787 patent/US8515145B2/en not_active Expired - Fee Related
-
2013
- 2013-08-19 US US13/969,669 patent/US20150003737A1/en not_active Abandoned
-
2015
- 2015-05-07 US US14/706,522 patent/US9576198B2/en active Active
Patent Citations (25)
| Publication number | Priority date | Publication date | Assignee | Title |
|---|---|---|---|---|
| US5769640A (en) | 1992-12-02 | 1998-06-23 | Cybernet Systems Corporation | Method and system for simulating medical procedures including virtual reality and control method and system for use therein |
| US5712803A (en) | 1995-06-23 | 1998-01-27 | Kreon Industrie | Method of acquiring and digitizing objects through a transparent wall |
| US5699799A (en) | 1996-03-26 | 1997-12-23 | Siemens Corporate Research, Inc. | Automatic determination of the curved axis of a 3-D tube-shaped object in image volume |
| US6501848B1 (en) | 1996-06-19 | 2002-12-31 | University Technology Corporation | Method and apparatus for three-dimensional reconstruction of coronary vessels from angiographic images and analytical techniques applied thereto |
| US5966141A (en) | 1996-09-03 | 1999-10-12 | Monolith Co., Ltd. | Apparatus and method for animation using topology |
| US5921920A (en) | 1996-12-12 | 1999-07-13 | The Trustees Of The University Of Pennsylvania | Intensive care information graphical display |
| US6409760B1 (en) | 1998-03-05 | 2002-06-25 | University Of Cincinnati | Device and method for restructuring heart chamber geometry |
| US6028907A (en) * | 1998-05-15 | 2000-02-22 | International Business Machines Corporation | System and method for three-dimensional geometric modeling by extracting and merging two-dimensional contours from CT slice data and CT scout data |
| US6236878B1 (en) | 1998-05-22 | 2001-05-22 | Charles A. Taylor | Method for predictive modeling for planning medical interventions and simulating physiological conditions |
| US20010020175A1 (en) * | 1998-06-16 | 2001-09-06 | Yuval Yassour | Implantable blood filtering device |
| US6434265B1 (en) | 1998-09-25 | 2002-08-13 | Apple Computers, Inc. | Aligning rectilinear images in 3D through projective registration and calibration |
| US20030076987A1 (en) | 1999-12-07 | 2003-04-24 | Wilson Laurence Sydney | Knowledge based computer aided diagnosis |
| US20030053697A1 (en) | 2000-04-07 | 2003-03-20 | Aylward Stephen R. | Systems and methods for tubular object processing |
| WO2002031768A2 (en) | 2000-10-13 | 2002-04-18 | Vimatix Technologies Ltd. | Method and apparatus for image analysis and processing by identification of characteristic lines and corresponding parameters |
| US20020142294A1 (en) | 2000-11-30 | 2002-10-03 | Blair Edward Duncan | Diagnostic method |
| WO2002066470A1 (en) | 2001-01-12 | 2002-08-29 | Amgen Inc. | Substituted alkylamine derivatives and methods of use |
| US6507633B1 (en) | 2001-02-15 | 2003-01-14 | The Regents Of The University Of Michigan | Method for statistically reconstructing a polyenergetic X-ray computed tomography image and image reconstructor apparatus utilizing the method |
| US20020114503A1 (en) * | 2001-02-17 | 2002-08-22 | Siemens Aktiengesellschaft | Method and apparatus for processing a computed tomography image of a lung obtained using contrast agent |
| US7043290B2 (en) | 2001-09-06 | 2006-05-09 | Koninklijke Philips Electronics N.V. | Method and apparatus for segmentation of an object |
| US20030187358A1 (en) | 2001-11-05 | 2003-10-02 | Okerlund Darin R. | Method, system and computer product for cardiac interventional procedure planning |
| US20030099391A1 (en) | 2001-11-29 | 2003-05-29 | Ravi Bansal | Automated lung nodule segmentation using dynamic progamming and EM based classifcation |
| US6915004B2 (en) | 2002-02-28 | 2005-07-05 | Cti Pet Systems, Inc. | Continuous tomography bed motion data processing apparatus and method |
| US7257237B1 (en) | 2003-03-07 | 2007-08-14 | Sandia Corporation | Real time markerless motion tracking using linked kinematic chains |
| US20040267114A1 (en) | 2003-06-17 | 2004-12-30 | Brown University | Methods and apparatus for model-based detection of structure in view data |
| US20060182327A1 (en) | 2003-06-17 | 2006-08-17 | Brown Universtiy | Methods and apparatus for identifying subject matter in view data |
Non-Patent Citations (18)
| Title |
|---|
| A. F. Frangi et al., "Model-Based Quantization of 3-D Magnetic Resonance Angiographic Images", IEEE Transactions on Medical Imaging, vol. 18, No. 10, Oct. 1999, pp. 946-956. |
| B. Preim et al., "Resection Proposals for Oncologic Liver Surgery based on Vascular Territories", CARS/Springer 2002, pp. 1-6. |
| David J. Rossi, and Alan s. Willsky, "Reconstruction from Projections Based on Detection and Estimation of Objects-Parts I and II: Performance Analysis and Robustness Analysis", Aug. 1984, IEEE Transactions on Acoustics, Speech, and Signal Processing, vol. ASSP-32, No. 4, pp. 886-906. * |
| E. Bullitt et al., "Computer-Assisted Visualization of Arteriovenous Malformatrions on the Home PC", 2001, Neurosusrgery, vol. 48, pp. 576-583. |
| European Office Action for Application No. 04 755 629.5-2218 dated Jun. 27, 2006. |
| International Search Report for International application No. PCT/US2004/019584 dated Oct. 14, 2004. |
| International Search Report for International application No. PCT/US2004/019584 mailed Nov. 11, 2004. |
| International Search Report for International application No. PCT/US2006/047236 dated Oct. 6, 2009. |
| International Search Report for International application No. PCT/US2006/047236 mailed Apr. 4, 2008. |
| K. Mueller, N. Shareef, J. Huang and R. Crawfis, "High-Quality Splatting on Rectilinear Grids with Efficient Culling of Occluded Voxels," IEEE Transactions on Visualization and Computer Graphics, Apr.-Jun. 1999, pp. 116-134, vol. 5, No. 2. |
| L. A. Westover, "Splatting: A Parallel, Feed-Forward Volume Rendering Algorithm," PhD Thesis, Department of Computer Science, University of North Carolina, Chapel Hill, NC, 1991, 103 pages. |
| L. M. Lorigo et al., "CURVES: Curve Evolution for Vessel Segmentation", Medical Image Analysis, 2001, pp. 1-14. |
| M. Salome et al., "A Synchrotron Radiation Microtomography System for the Analysis of Trabecular Bone Samples", Am. Assoc. Phys. Med., Oct. 1999, Med. Phys., vol. 26, No. 10, pp. 2194-2204. |
| Murielle Salomé et al., "A synchrontron radiation microtomography system for the analysis of trabecular bone samples," Am. Assoc. Phys. Med., Med. Phys. 26(10), Oct. 1999, pp. 2194-2204. |
| N. Neophytou and K. Mueller, "Post-Convolved Splatting," Joint Eurographics, IEEE TGVG Symposium on Visualization, 2003, Section 3, pp. 223-230, 300. |
| N. Srinivasa, K.R. Ramakrishnan, and K. Rajgopal, "Detection of Edges from Projections", Mar. 1992, IEEE Transactions on Medical Imaging, vol. 11, No. 1, pp. 76-80. * |
| Q. Huang and G. C. Stockman, "Generalized Tube Model: Recognizing 3D Elongated Objects from 2D Intensity Images," Proceedings CVPR, 1993, 6 pages. |
| Yoram Bresler, and Albert Macovski, "Three-Dimensional Reconstruction from Projections with Incomplete and Noisy Data by Object Estimation", Aug. 1987, IEEE Transactions on Acoustics, Speech, and Signal Processing, vol. ASSP-35, No. 8, pp. 1139-1152. * |
Cited By (9)
| Publication number | Priority date | Publication date | Assignee | Title |
|---|---|---|---|---|
| US20090123053A1 (en) * | 2003-06-17 | 2009-05-14 | Brown University | Methods and apparatus for model-based detection of structure in view data |
| US20080013815A1 (en) * | 2006-06-16 | 2008-01-17 | Ruggero Scorcioni | Arborization Reconstruction |
| US8649576B2 (en) * | 2006-06-16 | 2014-02-11 | George Mason Intellectual Properties, Inc. | Arborization reconstruction |
| US20110255761A1 (en) * | 2007-06-26 | 2011-10-20 | University Of Rochester | Method and system for detecting lung tumors and nodules |
| US20100145681A1 (en) * | 2008-12-08 | 2010-06-10 | Begel Daniel M | Method and system to identify, quantify, and display acoustic transformational structures in speech |
| US8155967B2 (en) * | 2008-12-08 | 2012-04-10 | Begel Daniel M | Method and system to identify, quantify, and display acoustic transformational structures in speech |
| US10127717B2 (en) | 2016-02-16 | 2018-11-13 | Ohzone, Inc. | System for 3D Clothing Model Creation |
| US10373386B2 (en) | 2016-02-16 | 2019-08-06 | Ohzone, Inc. | System and method for virtually trying-on clothing |
| US11615462B2 (en) | 2016-02-16 | 2023-03-28 | Ohzone, Inc. | System for virtually sharing customized clothing |
Also Published As
| Publication number | Publication date |
|---|---|
| WO2007084221A3 (en) | 2008-05-29 |
| JP5570725B2 (ja) | 2014-08-13 |
| WO2007084221A2 (en) | 2007-07-26 |
| US9576198B2 (en) | 2017-02-21 |
| WO2007084221A9 (en) | 2009-11-26 |
| CA2672094A1 (en) | 2007-07-26 |
| JP2009518143A (ja) | 2009-05-07 |
| EP2046776A2 (en) | 2009-04-15 |
| US20120114214A1 (en) | 2012-05-10 |
| US20160104026A1 (en) | 2016-04-14 |
| US20150003737A1 (en) | 2015-01-01 |
| US20060182327A1 (en) | 2006-08-17 |
| US8515145B2 (en) | 2013-08-20 |
| CA2672094C (en) | 2021-06-01 |
Similar Documents
| Publication | Publication Date | Title |
|---|---|---|
| US9576198B2 (en) | Methods and apparatus for identifying subject matter in view data | |
| US7492934B2 (en) | Methods and apparatus for model-based detection of structure in view data | |
| Anirudh et al. | Lose the views: Limited angle CT reconstruction via implicit sinogram completion | |
| US9613442B2 (en) | Image reconstruction from limited or incomplete data | |
| US7672421B2 (en) | Reduction of streak artifacts in low dose CT imaging through multi image compounding | |
| US20060182340A1 (en) | Multidimensional segmentation based on adaptive bounding box and ellipsoid models | |
| Cierniak | An analytical iterative statistical algorithm for image reconstruction from projections | |
| US8160367B2 (en) | Circular intensity distribution analysis for the detection of convex, concave and flat surfaces | |
| Constantino et al. | Sinogram recovery for sparse angle tomography using a sinusoidal Hough transform | |
| Katsevich | Analysis of reconstruction from noisy discrete generalized Radon data | |
| Valat et al. | Sinogram Inpainting with Generative Adversarial Networks and Shape Priors. Tomography 2023, 9, 1137–1152 | |
| Ha | A Safe, Accurate, Flexible, and Efficient Computed Tomographic System: SAFE-CT | |
| Schmitt | Fast Variance Prediction for Iteratively Reconstructed CT with Applications to Tube Current Modulation. | |
| Yoon | Limited-data tomography: A level-set reconstruction algorithm, a tomosynthesis system model, and an anthropomorphic phantom | |
| Toumoulin | Strategy of CT sinogram inpainting based on sinusoid-like curve decomposition and eigenvector-guided interpolation |
Legal Events
| Date | Code | Title | Description |
|---|---|---|---|
| AS | Assignment |
Owner name: BROWN UNIVERSITY, RHODE ISLAND Free format text: ASSIGNMENT OF ASSIGNORS INTEREST;ASSIGNORS:MUNDY, JOSEPH L.;KIMIA, BENJAMIN;KLEIN, PHILIP NATHAN;AND OTHERS;REEL/FRAME:017281/0853 Effective date: 20060221 |
|
| STCF | Information on status: patent grant |
Free format text: PATENTED CASE |
|
| REMI | Maintenance fee reminder mailed | ||
| FPAY | Fee payment |
Year of fee payment: 4 |
|
| SULP | Surcharge for late payment | ||
| FEPP | Fee payment procedure |
Free format text: MAINTENANCE FEE REMINDER MAILED (ORIGINAL EVENT CODE: REM.); ENTITY STATUS OF PATENT OWNER: SMALL ENTITY |
|
| FEPP | Fee payment procedure |
Free format text: 7.5 YR SURCHARGE - LATE PMT W/IN 6 MO, SMALL ENTITY (ORIGINAL EVENT CODE: M2555); ENTITY STATUS OF PATENT OWNER: SMALL ENTITY |
|
| MAFP | Maintenance fee payment |
Free format text: PAYMENT OF MAINTENANCE FEE, 8TH YR, SMALL ENTITY (ORIGINAL EVENT CODE: M2552); ENTITY STATUS OF PATENT OWNER: SMALL ENTITY Year of fee payment: 8 |
|
| FEPP | Fee payment procedure |
Free format text: MAINTENANCE FEE REMINDER MAILED (ORIGINAL EVENT CODE: REM.); ENTITY STATUS OF PATENT OWNER: SMALL ENTITY |
|
| LAPS | Lapse for failure to pay maintenance fees |
Free format text: PATENT EXPIRED FOR FAILURE TO PAY MAINTENANCE FEES (ORIGINAL EVENT CODE: EXP.); ENTITY STATUS OF PATENT OWNER: SMALL ENTITY |
|
| STCH | Information on status: patent discontinuation |
Free format text: PATENT EXPIRED DUE TO NONPAYMENT OF MAINTENANCE FEES UNDER 37 CFR 1.362 |
|
| FP | Lapsed due to failure to pay maintenance fee |
Effective date: 20230712 |