US20170003215A1 - Method for quantitative estimation of fouling of the spacers plates in a steam generator - Google Patents
Method for quantitative estimation of fouling of the spacers plates in a steam generator Download PDFInfo
- Publication number
- US20170003215A1 US20170003215A1 US15/107,323 US201415107323A US2017003215A1 US 20170003215 A1 US20170003215 A1 US 20170003215A1 US 201415107323 A US201415107323 A US 201415107323A US 2017003215 A1 US2017003215 A1 US 2017003215A1
- Authority
- US
- United States
- Prior art keywords
- fouling
- indicators
- vectors
- database
- plate portion
- Prior art date
- Legal status (The legal status is an assumption and is not a legal conclusion. Google has not performed a legal analysis and makes no representation as to the accuracy of the status listed.)
- Abandoned
Links
Images
Classifications
-
- G—PHYSICS
- G05—CONTROLLING; REGULATING
- G05B—CONTROL OR REGULATING SYSTEMS IN GENERAL; FUNCTIONAL ELEMENTS OF SUCH SYSTEMS; MONITORING OR TESTING ARRANGEMENTS FOR SUCH SYSTEMS OR ELEMENTS
- G05B23/00—Testing or monitoring of control systems or parts thereof
- G05B23/02—Electric testing or monitoring
- G05B23/0205—Electric testing or monitoring by means of a monitoring system capable of detecting and responding to faults
- G05B23/0218—Electric testing or monitoring by means of a monitoring system capable of detecting and responding to faults characterised by the fault detection method dealing with either existing or incipient faults
- G05B23/0221—Preprocessing measurements, e.g. data collection rate adjustment; Standardization of measurements; Time series or signal analysis, e.g. frequency analysis or wavelets; Trustworthiness of measurements; Indexes therefor; Measurements using easily measured parameters to estimate parameters difficult to measure; Virtual sensor creation; De-noising; Sensor fusion; Unconventional preprocessing inherently present in specific fault detection methods like PCA-based methods
-
- G—PHYSICS
- G01—MEASURING; TESTING
- G01N—INVESTIGATING OR ANALYSING MATERIALS BY DETERMINING THEIR CHEMICAL OR PHYSICAL PROPERTIES
- G01N17/00—Investigating resistance of materials to the weather, to corrosion, or to light
- G01N17/008—Monitoring fouling
-
- G—PHYSICS
- G06—COMPUTING; CALCULATING OR COUNTING
- G06F—ELECTRIC DIGITAL DATA PROCESSING
- G06F17/00—Digital computing or data processing equipment or methods, specially adapted for specific functions
- G06F17/10—Complex mathematical operations
- G06F17/16—Matrix or vector computation, e.g. matrix-matrix or matrix-vector multiplication, matrix factorization
-
- G—PHYSICS
- G06—COMPUTING; CALCULATING OR COUNTING
- G06F—ELECTRIC DIGITAL DATA PROCESSING
- G06F17/00—Digital computing or data processing equipment or methods, specially adapted for specific functions
- G06F17/10—Complex mathematical operations
- G06F17/18—Complex mathematical operations for evaluating statistical data, e.g. average values, frequency distributions, probability functions, regression analysis
-
- G—PHYSICS
- G21—NUCLEAR PHYSICS; NUCLEAR ENGINEERING
- G21C—NUCLEAR REACTORS
- G21C17/00—Monitoring; Testing ; Maintaining
- G21C17/017—Inspection or maintenance of pipe-lines or tubes in nuclear installations
-
- F—MECHANICAL ENGINEERING; LIGHTING; HEATING; WEAPONS; BLASTING
- F01—MACHINES OR ENGINES IN GENERAL; ENGINE PLANTS IN GENERAL; STEAM ENGINES
- F01K—STEAM ENGINE PLANTS; STEAM ACCUMULATORS; ENGINE PLANTS NOT OTHERWISE PROVIDED FOR; ENGINES USING SPECIAL WORKING FLUIDS OR CYCLES
- F01K7/00—Steam engine plants characterised by the use of specific types of engine; Plants or engines characterised by their use of special steam systems, cycles or processes; Control means specially adapted for such systems, cycles or processes; Use of withdrawn or exhaust steam for feed-water heating
- F01K7/16—Steam engine plants characterised by the use of specific types of engine; Plants or engines characterised by their use of special steam systems, cycles or processes; Control means specially adapted for such systems, cycles or processes; Use of withdrawn or exhaust steam for feed-water heating the engines being only of turbine type
-
- Y—GENERAL TAGGING OF NEW TECHNOLOGICAL DEVELOPMENTS; GENERAL TAGGING OF CROSS-SECTIONAL TECHNOLOGIES SPANNING OVER SEVERAL SECTIONS OF THE IPC; TECHNICAL SUBJECTS COVERED BY FORMER USPC CROSS-REFERENCE ART COLLECTIONS [XRACs] AND DIGESTS
- Y02—TECHNOLOGIES OR APPLICATIONS FOR MITIGATION OR ADAPTATION AGAINST CLIMATE CHANGE
- Y02E—REDUCTION OF GREENHOUSE GAS [GHG] EMISSIONS, RELATED TO ENERGY GENERATION, TRANSMISSION OR DISTRIBUTION
- Y02E30/00—Energy generation of nuclear origin
- Y02E30/30—Nuclear fission reactors
Definitions
- the present invention generally relates to the field of inspecting tubes of heat exchanger with tubes. More specifically, the invention relates to a method for evaluating fouling of a spacer plate of a heat exchanger with tubes, said passages being made along the tubes and used for circulation of a fluid in said heat exchanger through said plate.
- a steam generator generally consists of a bundle of tubes in which flows the hot fluid, and around which flows the fluid to be heated.
- the steam generators are heat exchangers which use the energy of the primary circuit from the nuclear reaction for transforming the water of the secondary circuit into the steam which will supply the turbine and thus produce electricity.
- the steam generator brings the secondary fluid from a liquid water condition to the steam condition just at the limit of saturation, by using the heat of the primary water.
- the latter flows in tubes around which flows the secondary water.
- the outlet of the steam generator is the point with the highest temperature and pressure of the secondary circuit.
- the exchange surface physically separating both circuits, thus consists of a tubular bundle, consisting of 3,500 to 5,600 tubes, depending on the version, in which flows the primary water brought to a high temperature (320° C.) and to a high pressure (155 bars).
- the passages of these spacer plates are foliated, i.e. their shape has lobes around the tubes.
- the water passes from the liquid condition to the steam condition, it deposits all the materials which it contained. If material deposits are made in the lobes, they reduce the free passage: this is fouling, which is therefore the gradual obturation by deposits of holes intended for letting through the water/steam mixture.
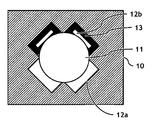
- FIG. 1 schematically illustrates a top view of a foliated passage in a spacer plate 10 , in which passes a tube 11 .
- the lobes 12 a and 12 b allow the water to cross the spacer plate 10 along the tube 11 , thereby allowing flow of the water in the steam generator.
- a deposit 13 is visible at the lobe 12 b, fouling said lobe 12 b.
- the deposit may be located on the side of the tube and/or on the side of the plate.
- Fouling leads to modifications of the flow of the water in the steam generator, and thus promotes the occurrence of excessive vibrations of the tubes, as well as to inducing significant mechanical forces on the internal structures of the steam generators.
- This degradation therefore has both effects on the safety and on the performances of the facilities. It is therefore indispensable to be well aware of the nature and of the time-dependent change in this degradation.
- This fouling level corresponds to the ratio between the blocked surface area of these passages over the total surface area of the latter. More generally this consists in quantitatively evaluating this fouling level.
- SAX probe eddy current axial probe
- a variation of the magnetic induction notably by a coil in which circulates an alternating current, generates eddy currents, for which the induced variation in the magnetic field is detected.
- the voltage difference generated by the variation of the impedance of the coil is measured.
- This eddy current probe initially intended for detecting damaging of the tubes, is also sensitive to fouling. Further, the interpretation of this signal is presently achieved manually by specialized operators, which takes a very long time, of the order of about one week of processing for analyzing a single steam generator. Further, the intervention of an operator for noting down the measurements from a piece of analysis software often gives rise to a bias which is difficult to quantify.
- the evaluation of the fouled aspect of a foliated passage by an operator from the measurement signal is further not very reliable, as it is generally carried out empirically upon examination of the received signal.
- r sax ⁇ Y 1 - Y 2 ⁇ max ⁇ ( Y 1 , Y 2 )
- this correlation between the SAX ratio and the estimated fouling level by remote viewing examination depends on the type of steam generator.
- the SAX ratio integrates all these perturbations and is then not representative of the fouling. For example, a fouling failure in the vicinity of the edge of the spacer plate has an influence on the signal of the eddy current probe, therefore on the SAX ratio, since the latter does not allow discrimination of the causes of the perturbation.
- Document EP 2 474 826 A1 proposes a method for evaluating the fouling, wherein the eddy current measurements are noted, and the signals corresponding to the passages of the spacer plates are identified and then an average value is determined, which is used as an evaluation signal. Characteristics extracted from these signals are then used as fouling indicators and a fouling level is inferred therefrom. For example, the distance between the extreme points of a Lissajous representation may be used for determining the fouling level, by means of a predetermined calibration curve relating said distance to a fouling level.
- the comparison is carried out by means of a predetermined equation.
- the equation is described as having been obtained by data read-out means on a device for which the fouling characteristics are known.
- the fouling level corresponds to the result of the equation assuming as variables the fouling indicators.
- Document EP 2 584 254 A2 in a similar context to the preceding one, proposes a method aiming at predicting the time-dependent change in the fouling by determining for each passage through the spacer plate, the fouling level. For this purpose, a model for viewing the spacer plates illustrating the fouling of the passages and their time-dependent change is provided. This time-dependent change is determined by means of a fouling curve which is determined by measurements via visual inspections and via eddy currents.
- a relationship is established between the actual fouling level obtained by visual inspection of a passage and a fouling indicator from the signal of the corresponding eddy current probe, for example a distance on a Lissajous representation as earlier. Subsequent measurements with eddy currents give the possibility of readjusting the estimation of the fouling rate by estimating the fouling level by comparing the fouling indicator determined from the signal of the eddy current probe with the fouling evaluation curve.
- a general object of the invention is to overcome all or part of the defects in the methods for evaluating fouling of foliated passages around tubes in the spacer plates of the state of the art, by proposing a comparison of a vector consisting of several fouling indicators with other vectors consisting of several fouling indicators.
- a method for evaluating the fouling of passages of a spacer plate of a heat exchanger with tubes is notably proposed, said passages being made along the tubes for crossing the spacer plate with a fluid, wherein, for each of at least one passage:
- At least one measurement of a parameter depending on the fouling or on the presence of magnetite is conducted in the vicinity of the passage by means of an eddy current probe,
- At least one fouling indicator of said passage is derived from this measurement
- fouling is evaluated by comparing a set of one or several vectors of fouling indicators with a dimension of at least two, built from the thereby obtained fouling indicators, with a plurality of sets of vectors of fouling indicators contained in a database, each of said sets of vectors of fouling indicators of the database being associated with a quantitative fouling descriptor.
- the fouling level of the inspected tube or plate portion is determined from an average of the quantitative descriptors of each packet weighted from the calculated similarity measurements.
- the invention also relates to a computer program product comprising program code instructions for executing the steps of the method according to the invention when said program is executed on a computer.
- FIG. 1 schematically illustrates, in a top view a foliated passage in a spacer plate, in which passes a tube, according to a common configuration of a steam generator;
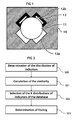
- FIG. 2 schematically illustrates the steps of the method according to a first alternative of the invention
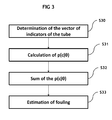
- FIG. 3 schematically illustrates the steps of the method according to a second alternative of the invention.
- the method in a way known to one skilled in the art begins by, in the vicinity of passages, conducting at least one measurement of a parameter depending on the fouling or on the presence of magnetite, typically by means of an eddy current probe, the measurement of which is representative of the impedance variations which fouling may cause, for example by magnetite.
- At least one fouling indicator of said passage is derived.
- the description below gives a non-limiting example of deriving such a fouling indicator.
- the eddy current probe typically acquires at least partly the measurement signal in a differential mode, and the measurement signal is a multi-frequency signal consisting of at least two signals at different frequencies.
- the signals corresponding to the differential mode are used since they are more sensitive to the passage of the spacer plate 10 .
- These signals are acquired at different frequencies and the lower edge signal is determined as a linear combination of at least two signals at different frequencies of said measurement signal, in this case z 1 and z 3 .
- This linear combination involves a complex coefficient ⁇ optimized for minimizing the signal power along the tube 11 outside the spacer plate areas 10 .
- the lower edge signal z inf is determined from signals obtained in a differential mode on the frequencies f 3 and f 1 , so that
- the lower edge signal is de-convoluted by the complex impulse response of the probe.
- the signal should only contain a sequence of complex pulses, corresponding to the passage through a spacer plate edge 10 , to the encounter of a deposit, and the study of the sole lower edge signal should be sufficient for quantifying the fouling.
- the response of the SAX probe to an impedance variation is not perfect. This is called the impulse response of the probe. Therefore it is necessary to restore the lower edge signal in order to again find the response of the probe representative of the fouling condition of the foliated passage in the spacer plate 10 .
- an estimation of the impulse response of the probe is determined, preferably corresponding to the passage of a specific edge of the spacer plate 10 by the probe in the tube 11 , for example from the upper edge signal. It is then sought to de-convolute the lower edge signal z inf [n] with a signal h[n] corresponding to the impulse response of the probe upon passing the spacer plate.
- a filter Such a filter is called a deconvolution filter or further a restoration filter.
- the deconvolution filter is calculated from the estimation of the impulse response, and it applies a deconvolution of the lower edge signal by means of said deconvolution filter.
- the deconvolution filter may be an approximation of the reciprocal of the impulse response of the probe. It may also be a Wiener filter and the deconvolution may thus be a Wiener deconvolution, which is a preferential embodiment of the described method. Other deconvolution methods exist and may be used.
- z inf,id [n ] argmin z[n] ⁇ J 1 ( z inf [n] h[n ]) + ⁇ J 2 ( z[n ]) ⁇
- J 1 being the criterion suitable for the data (for example a standard L 2, a standard L 2 squared, a standard L 1, . . . ) and J 2 a criterion expressing a characteristic a priori known on the signal which one seeks to rebuild (for example a standard L2, a standard L 2 squared, a standard L 1, a function of the deviations between neighboring samples z[n] ⁇ z[n ⁇ 1]).
- ⁇ gives the possibility of assigning more or less importance to the a priori on the solution (J 2 ) relatively to the suitability to the data (J 1 ).
- This criterion may also be written in the frequency domain.
- deconvolution criteria J1 and J2 which may be used, and for each alternative, several resolution methods, for example by filtering or by optimization methods.
- the frequency response of the Wiener filter is of the form:
- G ⁇ [ f ] H * ⁇ [ f ] ⁇ H ⁇ [ f ] ⁇ 2 + B ⁇ [ f ] S ⁇ [ f ]
- H[f] the Fourier transform of the impulse response of the probe
- S[f] the spectrum power density of the signal to be estimated
- B[f] the spectrum power density of the noise.
- Zero-padding i.e. adding zeros within the signals, may be carried out during the calculation of the discrete Fourier transforms in order to increase the frequency resolution.
- the impulse response h[n] of the probe may be estimated from the response of the probe upon passing the upstream edge of the spacer plate 10 by the probe, i.e. by means of the upper edge signal, according to the formula:
- indices i inf and i sup of the measurement signal respectively corresponding to the passages of the lower and upper edges of the spacer plate 10 are known.
- the range of values of the upper edge signal z sup [n] the 60 samples according to the center of the spacer plate 10 determined to be about 0.5 ⁇ (i inf +i sup ), i.e. a margin of 20 samples on each side of the impulse response.
- the noise-to-signal ratio corresponding to the ratio of the power spectral density of the noise B[f] and of the spectral power density S[f] of the signal to be estimated.
- One of these approaches consists of approximating this ratio with a constant.
- the signal to be estimated corresponds to an ideal lower edge signal which would have a sequence of pulses corresponding to the complex impedance variations encountered by the probe in the vicinity of the lower edge of the spacer plate 10 . Consequently, the power spectral density S[f] of this signal may be considered as a constant.
- the power spectral density of the noise B[f] may be determined on the portions of the signal between the spacer plates 10 .
- this power spectral density of the noise B[f] may be considered as a constant.
- the ratio of the power spectral densities of noise and of the signal to be estimated may be considered as a constant. This constant may be adjusted empirically, for example by assuming:
- the deconvolution filter determines whether the deconvolution filter is a complex de-convoluted lower edge signal z inf id introduced by the impulse response of the probe:
- filtering with a low-pass filter is applied to the de-convoluted lower edge signal, the cutoff frequency of said low-pass filter being determined by means of a standard deviation of a Gaussian function forming an approximation of the real portion of a lower edge signal pulse corresponding to the passing of the edge of the spacer plate 10 .
- the real or imaginary portion of the lower edge signal impulse corresponding to the passing of the edge of the spacer plate 10 has shapes very close to Gaussian functions or to their derivatives.
- the impulse 0 in the real portion of the lower edge signal corresponding to the passing of the lower edge of the spacer plate 10 in a configuration without fouling may be assimilated to a Gaussian function, and a linear combination of derivatives of the Gaussian function may be assimilated to pulses in the imaginary portion of the lower edge signal corresponding to the passing of the lower edge of the spacer plate 10 in a fouled configuration.
- ⁇ is the standard deviation of this Gaussian function, generally of the order of 3 or 4 samples, the Fourier transforms of the signals to be de-convoluted no longer contain any energy beyond a maximum frequency f max :
- ⁇ Y+ / ⁇ Y ⁇ standard deviation of the values assumed by y+ and by y ⁇ It is also possible to take the minimum and maximum values of the quantities below, for example for each pair of physical quantities, X Y+ /X Y ⁇ , with X corresponding to E, P, M or ⁇ , and a minimum indicator and a maximum indicator may be defined:
- X max max ⁇ X Y +, X Y ⁇ .
- the fouling is then evaluated by comparing a set of one or several vectors of fouling indicators, of the dimension of at least two, built from the thereby obtained indicators, with a plurality of sets of vectors of fouling indicators contained in a database, each of said sets being associated with a quantitative fouling descriptor.
- a vector of fouling indicators is preferably of a dimension of at least two, i.e. it is not preferably a scalar.
- Each vector of indicators is of a dimension of at least two, which means that it comprises at least two indicators as components.
- the fouling indicators contained in a database are typically fouling levels from remote viewing examination (RVE).
- RVE remote viewing examination
- the design of the steam generators actually allows inspection of their upper spacer plate via an automated camera.
- On each photograph one of the foliages of the tube/plate intersection is observed.
- the fouling level of the observed foliated passage is evaluated by measuring the section reduction at the lower edge. By considering that the obstruction phenomenon is homogeneous on each of the foliages of the tube/plate intersection, the fouling level of the passage of the latter is obtained.
- This method unlike the examination by an eddy current probe; gives the possibility of having a quantitative indication of the fouling level of the plate, which forms a quantitative fouling descriptor. But it is only applicable to the upper spacer plate, except for certain types of steam generators, also allowing the passing of the image-shooting apparatus over a few tubes of the intermediate plate. The RVE therefore does not give the possibility of obtaining the profile of the fouling on the whole of the steam generator. On the other hand, on an inspected plate, the peripheral tubes remain inaccessible.
- the sets of fouling indicators of the database are therefore represented by distributions of vectors of fouling indicators of passages of a spacer plate portion and the quantitative descriptor associated with each distribution is an average fouling level of each of the passages of said spacer plate portion, said database dealing with at least N portions of spacer plates of different heat exchangers, N ⁇ 2, and including N distributions of vectors of indicators each associated with an average fouling level of the passages of said spacer plate portion.
- the spacer plate portions are half-spacer-plates, corresponding to the portion of the spacer plates present in the cold or hot branch of the heat exchanger, here a steam generator. It is therefore assumed that one has N half-plates for which the fouling level is determined from the remote viewing examination C n and the values of the vectors of indicators ⁇ for each of their tubes.
- a first approach lies on similarity measurements between distributions of vectors of indicators.
- the principle of this approach is to recognize in the available database, the distributions of vectors of indicators the most similar to the one of the half-plate which is intended to be evaluated.
- the P test ( ⁇ ), the distribution of the vectors of indicators of the inspected half-plate, and P n ,( ⁇ ) (n ⁇ [[1, N]]) the distributions of the vectors of indicators of N half-plates available in the database are considered.
- a similarity measurement d n is calculated between the distribution of vectors of indicators P test ( ⁇ ) of the inspected spacer plate portion and each of the distributions of vectors of indicators P n ( ⁇ ) of the database (step S 21 ).
- the similarity measurement between distributions may for example be evaluated by means of a distance function which will be noted as D.
- the distance d n is thus calculated between the distribution of vectors of indicators of the plate to be evaluated P test ( ⁇ ) and each of the distributions P n ( ⁇ ) of the database:
- step S 22 it is then possible to select (step S 22 ), from among the N thereby calculated distances, the K smallest ones (K ⁇ [[1, NJ]]), therefore corresponding to the most similar distributions.
- the K distributions of indicators P n ,( ⁇ ) of the database are thus selected, the similarity measurements of which with the distribution of indicators P test ( ⁇ ) of the inspected spacer plate portion are the greatest, are therefore selected.
- the similarity measurement is a distance, this therefore amounts to taking the smallest K distributions.
- the fouling (step S 23 ) is then determined from the fouling levels associated with said selected K distributions of vectors of indicators P n ,( ⁇ ) of the database.
- each fouling level being weighted by the similarity measurement between the distribution of vectors of indicators P n ,( ⁇ ) of the database with which it is associated and the distribution of vectors of indicators P test ( ⁇ ) of the inspected spacer plate portion.
- the calculation of the similarity measurement d n , between the distribution of vectors of indicators P test ( ⁇ ) of the inspected spacer plate portion and each of the distributions of vectors of indicators P n ( ⁇ ) of the database may comprise an estimation of the distributions by means of a model of a probability law , preferably a Gaussian law, a Parzen modeling or a weighted average of probability laws.
- ⁇ represents the average vector of indicators of the half-plate, and ⁇ is its variance-covariance matrix (both of these elements forming the parameters of the distribution to be calculated).
- Parzen modeling Its principle is to place a kernel function, for example a Gaussian on each of the observations of the statistical population for which one seeks to estimate the probability density. The sum of all these Gaussians gives the Parzen likelihood.
- the observations are the vectors of indicators extracted from each of the tubes.
- the distribution of the vectors of indicators of the half-plate n including M n , tubes of vectors of indicators ⁇ m (m ⁇ [[1, M n ]]) of dimension d is then given by:
- the variance-covariance matrix ⁇ n is calculated on the whole of the vectors of indicators belonging to the half-plate n. This inverse matrix may be approached by the matrix formed with its sole inverse diagonal coefficients, according to
- ⁇ n - 1 ( ⁇ i , j ) - 1 ⁇ ( 1 ⁇ 1 , 1 ... 0 ⁇ ⁇ ⁇ 0 ... 1 ⁇ d , d )
- the similarity measurement between distributions gives the possibility of introducing an uncertainty score of the result: small distances between a half-plate to be evaluated and certain half-plates of the database predict strong similarity with fouling examples already observed, and therefore high confidence in the result. Conversely, an atypical half-plate differing from the available history, will see its distribution of vectors of indicators moved away from all the others, expressing greater uncertainty on the result of the estimation.
- the method may thus comprise a determination of the uncertainty evaluation on the thereby determined fouling, on the basis of the similarity measurement between the K distributions of vectors of indicators P n ( ⁇ ) of the database which were thereby selected and the distribution of vectors of indicators P test ( ⁇ ) of the inspected spacer plate portion, and/or the variability of the quantitative descriptors associated with the distributions of vectors of indicators of a spacer plate portion, i.e. the half-plates.
- vector quantification Another approach lies on vector quantification.
- the principle of vector quantification is to partition a large number of data (vectors of a given space) into a restricted number of packets (or “cluster”) in the sense of a similarity measurement (generally a distance).
- the space of the vectors of indicators ⁇ is separated into K packets, K being a parameter of the algorithm determined beforehand, each including a center or an average.
- K being a parameter of the algorithm determined beforehand, each including a center or an average.
- Each vector of indicators ⁇ belongs to the cluster for which the center or the average is the closest.
- the sets of vectors of fouling indicators of the database are then packets having each a center or an average, and grouping on the basis of a similarity measurement dealing with the vectors of fouling indicators, the vectors of fouling indicators which are the closest to said center or said average, in the sense of the similarity measurement, a quantitative fouling descriptor being associated with each of said packets, and in which, for a set of one or several vectors of fouling indicators of the inspected tube or plate portion:
- the partitioning of the space of the indicators may be obtained in diverse ways. It may be set arbitrarily a priori, or may use an algorithm which gives the packets or clusters, being more naturally disengaged from the set of vectors of indicators of the database (such as the so-called “K-means” algorithm). Once this partitioning has been carried out, for the half-plate to be inspected the number of tubes making it up is determined, belonging to each partition of the space of the vectors of indicators.
- the estimation is then directly carried out on these vectors r, by for example searching for the N half-plates of the database for which the vectors r n , (n ⁇ [[1, N]]) are the closest to the vector of the half-plate to be estimated in the sense of a given similarity measurement, typically a distance. Finally it is possible to calculate the average fouling by the average of the fouling c n , of the selected half-plates weighted by the calculated distances d n :
- the distributions of vectors of fouling indicators may be associated with spatial information, such as the position of tubes in the spacer plate, so as to correspond to the representative images of the spatial distribution of the fouling values.
- the fouling is estimated by means of an image recognition process, which may resume the principles stated above, in order to estimate the fouling by recognizing in the database, the image(s) the closest to those obtained for the inspected heat exchanger.
- a set of vectors of fouling indicators is a vector of fouling indicators of a tube and the quantitative descriptor associated with said vector is a fouling level of said tube, said database dealing with at least M tubes from different heat exchangers, M ⁇ 2, said database including M vectors of fouling indicators of one passage, each associated with a fouling level of said passage of said tube.
- the spacer plate portions are spacer half-plates, corresponding to the portion of the spacer plates present in the cold or hot branch of the heat exchanger, here a steam generator.
- the fouling level obtained for example by remote viewing examination is noted as c and ⁇ is the vector of the qualitative indicators calculated earlier, after having determined the vectors of indicators ⁇ of the inspected tube. Therefore M pairs ⁇ , c ⁇ are available in the database.
- ⁇ ) for the vectors of indicators ⁇ is calculated from vectors of the database (step S 31 ), and the fouling is determined by the sum of the a posteriori fouling distribution weighted with fouling levels (step S 32 ).
- ⁇ ⁇ ⁇ ⁇ ⁇ c ⁇ ( c est - c ) 2 ⁇ p ⁇ ( c ⁇ ⁇ )
- the a posteriori law may be given by Bayes theorem:
- p(c) designates the a priori law and p( ⁇
- the calculation of the a posteriori law may thus comprise an estimation of the a priori law p(c) and of the likelihood p( ⁇
- the a priori law is obtained according to a ratio between:
- N k represents the number of tubes of the database having fouling c comprised in the interval C k
- Card(database) is the total number of tubes in the database.
- the likelihood law is approached on c comprised on an interval [c k ; c k+1 ] by a probability law , preferably a Gaussian law, a Parzen modeling, or a weighted average of laws, depending on parameters cu to be determined, like what was indicated above:
- a probability law preferably a Gaussian law, a Parzen modeling, or a weighted average of laws, depending on parameters cu to be determined, like what was indicated above:
- h 0.5
- the variance-covariance matrix of the vectors of indicators of the tubes belonging to the class C k , ⁇ k is also possible here to approach its inverse matrix with the matrix formed of its sole inverse diagonal coefficients, according to
- ⁇ k - 1 ( ⁇ i , j ) - 1 ⁇ ( 1 ⁇ 1 , 1 ... 0 ⁇ ⁇ ⁇ 0 ... 1 ⁇ d , d )
- step S 33 The estimation c est of the fouling (step S 33 ) for the vectors of indicators ⁇ of the inspected tube is inferred from the previous equation:
- c est ⁇ c ⁇ ⁇ c i ⁇ ⁇ p ⁇ ( c ⁇ ⁇ ⁇ ⁇ ⁇ C i ⁇ ⁇ )
- vector quantification techniques has the purpose of evaluating the fouling level of a tube according to the position of its vectors of indicators ⁇ in the space of the vectors of indicators, relatively to the examples of vectors which make up the database.
- the principle is to give to the inspected tube for which the fouling is to be evaluated, a fouling level similar to those of the tubes of the base which are close to its vectors of indicators ⁇ .
- the sets of vectors indicating fouling of the database are packets each having a center or an average and grouping on the basis of a similarity measurement dealing with the values of said fouling indicators, the fouling indicators for which the values are the closest to said center or to said average, a quantitative descriptor of fouling being associated with each of said packets.
- the set of the vectors of indicators of the database is thus partitioned into K sets, for example with the so-called “K-means” algorithm.
- each of the vectors of indicators of the set of fouling indicators are each compared with the respective centers or averages of the packets of the database, by means of a similarity measurement, for example by calculating the distances d k of the vectors of indicators ⁇ of the inspected tube to each of the centers of the clusters (k ⁇ [[1, K]]).
- Several types of distances may be used, from the customary Euclidean distance to similarity measurements taking into account the distribution of the data.
- the Mahalanobis distance which involves the variance-covariance matrix) ⁇ k of the partition k and its center ⁇ k .
- the Mahalanobis distance between a vectors of indicators ⁇ and the set of the data of the cluster k is then written as:
- a solution is to proceed with an averaging of the average foulings ⁇ ck> of each packet weighted from similarity measurements, for example the reciprocal of the distances such as the distances d k calculated previously:
- the average may be calculated on the basis of the fouling levels of the totality of the packets, or on a selection of m of them on the basis of a comparison in the sense of a similarity measurement, as previously. It is therefore considered that the selection of the m packets may comprise all the packets, the closest packets, or all the packets except for certain of them which are set aside because of anomalies.
Landscapes
- Engineering & Computer Science (AREA)
- Physics & Mathematics (AREA)
- General Physics & Mathematics (AREA)
- General Engineering & Computer Science (AREA)
- Mathematical Physics (AREA)
- Data Mining & Analysis (AREA)
- Pure & Applied Mathematics (AREA)
- Mathematical Optimization (AREA)
- Mathematical Analysis (AREA)
- Computational Mathematics (AREA)
- Theoretical Computer Science (AREA)
- High Energy & Nuclear Physics (AREA)
- Plasma & Fusion (AREA)
- Automation & Control Theory (AREA)
- Life Sciences & Earth Sciences (AREA)
- Databases & Information Systems (AREA)
- Algebra (AREA)
- Software Systems (AREA)
- Environmental & Geological Engineering (AREA)
- Ecology (AREA)
- Computing Systems (AREA)
- Analytical Chemistry (AREA)
- Chemical & Material Sciences (AREA)
- Health & Medical Sciences (AREA)
- Environmental Sciences (AREA)
- General Health & Medical Sciences (AREA)
- Pathology (AREA)
- Biochemistry (AREA)
- Immunology (AREA)
- Biodiversity & Conservation Biology (AREA)
- Bioinformatics & Cheminformatics (AREA)
- Bioinformatics & Computational Biology (AREA)
- Evolutionary Biology (AREA)
- Operations Research (AREA)
- Probability & Statistics with Applications (AREA)
- Investigating Or Analyzing Materials By The Use Of Magnetic Means (AREA)
- Application Of Or Painting With Fluid Materials (AREA)
Applications Claiming Priority (3)
| Application Number | Priority Date | Filing Date | Title |
|---|---|---|---|
| FR1363489A FR3015757B1 (fr) | 2013-12-23 | 2013-12-23 | Procede d'estimation quantitative du colmatage des plaques d'un generateur de vapeur |
| FR1363489 | 2013-12-23 | ||
| PCT/EP2014/079163 WO2015097221A2 (fr) | 2013-12-23 | 2014-12-23 | Procédé d'estimation quantitative du colmatage des plaques d'un générateur de vapeur |
Publications (1)
| Publication Number | Publication Date |
|---|---|
| US20170003215A1 true US20170003215A1 (en) | 2017-01-05 |
Family
ID=50543185
Family Applications (1)
| Application Number | Title | Priority Date | Filing Date |
|---|---|---|---|
| US15/107,323 Abandoned US20170003215A1 (en) | 2013-12-23 | 2014-12-23 | Method for quantitative estimation of fouling of the spacers plates in a steam generator |
Country Status (9)
| Country | Link |
|---|---|
| US (1) | US20170003215A1 (ja) |
| EP (1) | EP3087444B9 (ja) |
| JP (1) | JP6466457B2 (ja) |
| KR (1) | KR102367340B1 (ja) |
| CN (1) | CN106030428B (ja) |
| CA (1) | CA2934949C (ja) |
| ES (1) | ES2655520T3 (ja) |
| FR (1) | FR3015757B1 (ja) |
| WO (1) | WO2015097221A2 (ja) |
Cited By (2)
| Publication number | Priority date | Publication date | Assignee | Title |
|---|---|---|---|---|
| US11156354B2 (en) | 2017-12-13 | 2021-10-26 | Electricite De France | Method for evaluating fouling of a heat exchanger |
| FR3130013A1 (fr) * | 2021-12-08 | 2023-06-09 | Electricite De France | Procédé d'entretien d'un générateur de vapeur impliquant un modèle |
Citations (11)
| Publication number | Priority date | Publication date | Assignee | Title |
|---|---|---|---|---|
| US20030059837A1 (en) * | 2000-01-07 | 2003-03-27 | Levinson Douglas A. | Method and system for planning, performing, and assessing high-throughput screening of multicomponent chemical compositions and solid forms of compounds |
| US20040039968A1 (en) * | 2000-09-11 | 2004-02-26 | Kimmo Hatonen | System, device and method for automatic anomally detection |
| US20050011278A1 (en) * | 2003-07-18 | 2005-01-20 | Brown Gregory C. | Process diagnostics |
| US20060111844A1 (en) * | 2004-11-12 | 2006-05-25 | Chandler Larry S | Implementing two dimensional segment inversions with inversion-conforming data sets processing being rendered to include generalized composite weight factors in the processing of error-affected multivariate data samples |
| US20070276270A1 (en) * | 2006-05-24 | 2007-11-29 | Bao Tran | Mesh network stroke monitoring appliance |
| US7428514B2 (en) * | 2004-01-12 | 2008-09-23 | Honda Research Institute Europe Gmbh | System and method for estimation of a distribution algorithm |
| US20120179402A1 (en) * | 2011-01-06 | 2012-07-12 | Mitsubishi Heavy Industries, Ltd. | Deposit measurement apparatus, deposit measurement method, and computer-readable storage medium storing deposit measurement program |
| US20130041636A1 (en) * | 2011-08-12 | 2013-02-14 | Anna CRAIG | Methods and systems for comparing vertical axis turbine arrays and providing configurations thereof |
| US20130101153A1 (en) * | 2011-10-20 | 2013-04-25 | Mitsubishi Heavy Industries, Ltd. | Insertion-hole blockage-rate evaluation system, insertion-hole blockage-rate evaluation method, and insertion-hole blockage-rate evaluation program |
| US20140039834A1 (en) * | 2012-08-01 | 2014-02-06 | Hitachi Power Solutions Co., Ltd. | Method and apparatus for monitoring equipment conditions |
| US20150363925A1 (en) * | 2013-01-22 | 2015-12-17 | Hitachi, Ltd. | Anomaly Diagnosis Method and Apparatus |
Family Cites Families (11)
| Publication number | Priority date | Publication date | Assignee | Title |
|---|---|---|---|---|
| DE3022060A1 (de) * | 1979-06-18 | 1981-01-22 | Electric Power Res Inst | Verfahren und vorrichtung zur feststellung von magnetitablagerungen |
| JPS6450953A (en) * | 1987-08-21 | 1989-02-27 | Mitsubishi Heavy Ind Ltd | Signal processing apparatus for detecting flaw using eddy current |
| JPH03296167A (ja) * | 1990-04-13 | 1991-12-26 | Ono Sokki Co Ltd | ハール変換による信号解析方法 |
| JPH05281199A (ja) * | 1992-03-31 | 1993-10-29 | Nuclear Fuel Ind Ltd | 探傷データ評価装置及び方法 |
| JP3649659B2 (ja) * | 2000-09-18 | 2005-05-18 | 三菱重工業株式会社 | 渦電流検査信号識別方法及びこの方法を用いる装置 |
| JP4232937B2 (ja) * | 2000-12-19 | 2009-03-04 | 株式会社原子力エンジニアリング | 渦電流探傷信号の処理方法 |
| US7866211B2 (en) * | 2004-07-16 | 2011-01-11 | Rosemount Inc. | Fouling and corrosion detector for process control industries |
| JP4875382B2 (ja) * | 2006-02-27 | 2012-02-15 | 三菱重工業株式会社 | 渦流探傷信号の評価方法及び装置 |
| US7405558B2 (en) * | 2006-07-10 | 2008-07-29 | Areva Np, Inc. | Steam generator mapping with reflections of eddy current signal |
| FR2939928B1 (fr) * | 2008-12-15 | 2012-08-03 | Snecma | Standardisation de donnees utilisees pour la surveillance d'un moteur d'aeronef |
| CN102564747B (zh) * | 2011-12-13 | 2014-12-10 | 中国农业大学 | 一种滴灌系统灌水器堵塞特性的综合评价方法及测试系统 |
-
2013
- 2013-12-23 FR FR1363489A patent/FR3015757B1/fr active Active
-
2014
- 2014-12-23 WO PCT/EP2014/079163 patent/WO2015097221A2/fr active Application Filing
- 2014-12-23 JP JP2016542741A patent/JP6466457B2/ja active Active
- 2014-12-23 CA CA2934949A patent/CA2934949C/fr active Active
- 2014-12-23 US US15/107,323 patent/US20170003215A1/en not_active Abandoned
- 2014-12-23 KR KR1020167019975A patent/KR102367340B1/ko active IP Right Grant
- 2014-12-23 CN CN201480075689.2A patent/CN106030428B/zh active Active
- 2014-12-23 ES ES14819020.0T patent/ES2655520T3/es active Active
- 2014-12-23 EP EP14819020.0A patent/EP3087444B9/fr active Active
Patent Citations (14)
| Publication number | Priority date | Publication date | Assignee | Title |
|---|---|---|---|---|
| US20050089923A9 (en) * | 2000-01-07 | 2005-04-28 | Levinson Douglas A. | Method and system for planning, performing, and assessing high-throughput screening of multicomponent chemical compositions and solid forms of compounds |
| US20030059837A1 (en) * | 2000-01-07 | 2003-03-27 | Levinson Douglas A. | Method and system for planning, performing, and assessing high-throughput screening of multicomponent chemical compositions and solid forms of compounds |
| US7519860B2 (en) * | 2000-09-11 | 2009-04-14 | Nokia Corporation | System, device and method for automatic anomaly detection |
| US20040039968A1 (en) * | 2000-09-11 | 2004-02-26 | Kimmo Hatonen | System, device and method for automatic anomally detection |
| US20050011278A1 (en) * | 2003-07-18 | 2005-01-20 | Brown Gregory C. | Process diagnostics |
| US7290450B2 (en) * | 2003-07-18 | 2007-11-06 | Rosemount Inc. | Process diagnostics |
| US7428514B2 (en) * | 2004-01-12 | 2008-09-23 | Honda Research Institute Europe Gmbh | System and method for estimation of a distribution algorithm |
| US20060111844A1 (en) * | 2004-11-12 | 2006-05-25 | Chandler Larry S | Implementing two dimensional segment inversions with inversion-conforming data sets processing being rendered to include generalized composite weight factors in the processing of error-affected multivariate data samples |
| US20070276270A1 (en) * | 2006-05-24 | 2007-11-29 | Bao Tran | Mesh network stroke monitoring appliance |
| US20120179402A1 (en) * | 2011-01-06 | 2012-07-12 | Mitsubishi Heavy Industries, Ltd. | Deposit measurement apparatus, deposit measurement method, and computer-readable storage medium storing deposit measurement program |
| US20130041636A1 (en) * | 2011-08-12 | 2013-02-14 | Anna CRAIG | Methods and systems for comparing vertical axis turbine arrays and providing configurations thereof |
| US20130101153A1 (en) * | 2011-10-20 | 2013-04-25 | Mitsubishi Heavy Industries, Ltd. | Insertion-hole blockage-rate evaluation system, insertion-hole blockage-rate evaluation method, and insertion-hole blockage-rate evaluation program |
| US20140039834A1 (en) * | 2012-08-01 | 2014-02-06 | Hitachi Power Solutions Co., Ltd. | Method and apparatus for monitoring equipment conditions |
| US20150363925A1 (en) * | 2013-01-22 | 2015-12-17 | Hitachi, Ltd. | Anomaly Diagnosis Method and Apparatus |
Non-Patent Citations (3)
| Title |
|---|
| John C, Sloan "Finite safety models for high-assurance systems", A Dissertation Submitted to the Faculty of The College of Engineering and Computer Science in Partial Fulfillment of the Requirements for the Degree of Doctor of Philosophy, Florida Atlantic University Boca Raton, Florida August 2010 * |
| K.G. Murti and et al, "Classification of Spectral Patterns Obtained from Eustachian Tube Sonometry", IEEE TRANSACTIONS ON BIOMEDICAL ENGINEERING, VOL. BME-29, NO. 6, JUNE 1982 * |
| M. Halkidi and et al, "On Clustering Validation Techniques", Journal of Intelligent Information Systems, 17:2/3, 107–145, 2001, © 2001 Kluwer Academic Publishers. Manufactured in The Netherlands. * |
Cited By (3)
| Publication number | Priority date | Publication date | Assignee | Title |
|---|---|---|---|---|
| US11156354B2 (en) | 2017-12-13 | 2021-10-26 | Electricite De France | Method for evaluating fouling of a heat exchanger |
| FR3130013A1 (fr) * | 2021-12-08 | 2023-06-09 | Electricite De France | Procédé d'entretien d'un générateur de vapeur impliquant un modèle |
| WO2023105165A1 (fr) * | 2021-12-08 | 2023-06-15 | Electricite De France | Procede d'entretien d'un generateur de vapeur impliquant un modele |
Also Published As
| Publication number | Publication date |
|---|---|
| FR3015757A1 (fr) | 2015-06-26 |
| EP3087444B1 (fr) | 2017-10-11 |
| EP3087444B9 (fr) | 2018-06-27 |
| FR3015757B1 (fr) | 2019-05-31 |
| WO2015097221A2 (fr) | 2015-07-02 |
| CA2934949A1 (fr) | 2015-07-02 |
| ES2655520T3 (es) | 2018-02-20 |
| JP6466457B2 (ja) | 2019-02-06 |
| KR20160102049A (ko) | 2016-08-26 |
| WO2015097221A3 (fr) | 2015-08-13 |
| EP3087444A2 (fr) | 2016-11-02 |
| CN106030428A (zh) | 2016-10-12 |
| JP2017502293A (ja) | 2017-01-19 |
| CA2934949C (fr) | 2023-01-24 |
| KR102367340B1 (ko) | 2022-02-25 |
| CN106030428B (zh) | 2018-12-21 |
Similar Documents
| Publication | Publication Date | Title |
|---|---|---|
| Yang et al. | Pipeline magnetic flux leakage image detection algorithm based on multiscale SSD network | |
| US10451268B2 (en) | Method for evaluating the clogging of a heat exchanger | |
| JP4235648B2 (ja) | 渦電流探傷信号処理方法 | |
| Kandroodi et al. | Detection of natural gas pipeline defects using magnetic flux leakage measurements | |
| CN112699912A (zh) | 一种通过改进gan增强红外热图像的方法 | |
| WO2020090767A1 (ja) | 異常診断装置、異常診断方法、及びプログラム | |
| US20170003215A1 (en) | Method for quantitative estimation of fouling of the spacers plates in a steam generator | |
| CN105300267A (zh) | 基于电磁涡流和数据融合算法的金属板厚度测量方法 | |
| Manshadi et al. | Speed detection in wind-tunnels by processing schlieren images | |
| Tian et al. | Signal processing schemes for Eddy Current Testing of steam generator tubes of nuclear power plants | |
| CN112034312A (zh) | 一种电力设备绝缘缺陷模式识别方法 | |
| CN107180293A (zh) | 一种面向勘探目标的地质评价水平测定方法 | |
| Banerjee et al. | Confidence metric for signal classification in non destructive evaluation | |
| Li et al. | Distinguishing between uncertainty and variability in nondestructive evaluation | |
| CN117214284B (zh) | 一种基于电磁感应技术的油品检测方法 | |
| Shi et al. | Classification and evaluation for nearside/backside defect via magnetic flux leakage: A dual probe design with SVM and PSO intelligence algorithms | |
| Ardila et al. | An automated procedure for continuous dynamic monitoring of structures: theory and validation | |
| Girard et al. | State of the art of clogging diagnosis | |
| Wei et al. | Application of Lp-regularized least squares for 0<= p<= 1 in estimating discrete spectrum of relaxations for electromagnetic induction responses | |
| Banerjee et al. | Hidden Markov Model-Based Detection and Classification of Foreign Objects in Heat-Exchanger Tubes | |
| Xie et al. | Corrosion Assessment and Classification in SPCC Steel Using Eddy Current Testing | |
| CN113348758B (zh) | 一种消除材料属性影响的脉冲涡流缺陷轮廓重构方法 | |
| Wei et al. | Estimation of the discrete spectrum of relaxation frequencies using multiple measurements | |
| Doran et al. | Adequate sampling of a chaotic time series | |
| Sadr et al. | Intelligent defect recognition from magnetic flux leakage inspection |
Legal Events
| Date | Code | Title | Description |
|---|---|---|---|
| AS | Assignment |
Owner name: ELECTRICITE DE FRANCE, FRANCE Free format text: ASSIGNMENT OF ASSIGNORS INTEREST;ASSIGNORS:RENARD, BRUNO;PAUL, NICOLAS;SIGNING DATES FROM 20160818 TO 20160822;REEL/FRAME:040024/0070 |
|
| STPP | Information on status: patent application and granting procedure in general |
Free format text: FINAL REJECTION MAILED |
|
| STCB | Information on status: application discontinuation |
Free format text: ABANDONED -- FAILURE TO RESPOND TO AN OFFICE ACTION |