US10049567B2 - Traffic flow rate calculation method and device - Google Patents
Traffic flow rate calculation method and device Download PDFInfo
- Publication number
- US10049567B2 US10049567B2 US15/407,475 US201715407475A US10049567B2 US 10049567 B2 US10049567 B2 US 10049567B2 US 201715407475 A US201715407475 A US 201715407475A US 10049567 B2 US10049567 B2 US 10049567B2
- Authority
- US
- United States
- Prior art keywords
- path
- observations
- traffic flow
- flow rate
- edges
- Prior art date
- Legal status (The legal status is an assumption and is not a legal conclusion. Google has not performed a legal analysis and makes no representation as to the accuracy of the status listed.)
- Active
Links
Images




Classifications
-
- G—PHYSICS
- G08—SIGNALLING
- G08G—TRAFFIC CONTROL SYSTEMS
- G08G1/00—Traffic control systems for road vehicles
- G08G1/01—Detecting movement of traffic to be counted or controlled
- G08G1/0104—Measuring and analyzing of parameters relative to traffic conditions
- G08G1/0137—Measuring and analyzing of parameters relative to traffic conditions for specific applications
- G08G1/0141—Measuring and analyzing of parameters relative to traffic conditions for specific applications for traffic information dissemination
-
- G—PHYSICS
- G08—SIGNALLING
- G08G—TRAFFIC CONTROL SYSTEMS
- G08G1/00—Traffic control systems for road vehicles
- G08G1/01—Detecting movement of traffic to be counted or controlled
- G08G1/0104—Measuring and analyzing of parameters relative to traffic conditions
- G08G1/0108—Measuring and analyzing of parameters relative to traffic conditions based on the source of data
- G08G1/0112—Measuring and analyzing of parameters relative to traffic conditions based on the source of data from the vehicle, e.g. floating car data [FCD]
-
- G—PHYSICS
- G08—SIGNALLING
- G08G—TRAFFIC CONTROL SYSTEMS
- G08G1/00—Traffic control systems for road vehicles
- G08G1/01—Detecting movement of traffic to be counted or controlled
- G08G1/0104—Measuring and analyzing of parameters relative to traffic conditions
- G08G1/0108—Measuring and analyzing of parameters relative to traffic conditions based on the source of data
- G08G1/0116—Measuring and analyzing of parameters relative to traffic conditions based on the source of data from roadside infrastructure, e.g. beacons
-
- G—PHYSICS
- G08—SIGNALLING
- G08G—TRAFFIC CONTROL SYSTEMS
- G08G1/00—Traffic control systems for road vehicles
- G08G1/01—Detecting movement of traffic to be counted or controlled
- G08G1/0104—Measuring and analyzing of parameters relative to traffic conditions
- G08G1/0125—Traffic data processing
- G08G1/0133—Traffic data processing for classifying traffic situation
-
- G—PHYSICS
- G08—SIGNALLING
- G08G—TRAFFIC CONTROL SYSTEMS
- G08G1/00—Traffic control systems for road vehicles
- G08G1/01—Detecting movement of traffic to be counted or controlled
- G08G1/0104—Measuring and analyzing of parameters relative to traffic conditions
- G08G1/0108—Measuring and analyzing of parameters relative to traffic conditions based on the source of data
- G08G1/012—Measuring and analyzing of parameters relative to traffic conditions based on the source of data from other sources than vehicle or roadside beacons, e.g. mobile networks
Definitions
- the embodiments discussed herein are related to a traffic flow rate calculation method and a traffic flow rate calculation device.
- An estimation of a traffic situation such as a traffic volume, or the like of people, vehicles, or the like on a road, a track, a facility, or the like is being made.
- the estimation is performed using sensor data that was observed by sensors capable of observing information regarding movement of moving bodies, such as people, vehicles, or the like.
- An example of the sensor is a global positioning system (GPS) capable of observing the movement trajectory of a moving body.
- GPS global positioning system
- Other examples of the sensor is a road sensor for the system under the trademark “Vehicle Information and Communication System” (VICS) that is capable of observing the number of moving bodies that pass through a fixed location, and a ticket gate that supports a traffic system IC card.
- VICS Vehicle Information and Communication System
- One of proposed technologies for estimating a traffic situation is a technique for estimating a traveling time in each link on a road network by using the traffic information obtained by the information from road sensors and traffic information transmitted from a running vehicle.
- the estimated value of the traveling time is ⁇ times the average speed of a vehicle in each link when information from a running vehicle is obtained.
- ⁇ is the actual distance of a road section represented by a link length or a link.
- the estimated value of the traveling time is a times the average speed of a vehicle in each link when information is obtained from a road sensor.
- the estimated value of the traveling time is the weighted sum of the estimated value calculated based on the information from a running vehicle and the estimated value calculated based on the information from a road sensor.
- a method for solving an integer programming problem under the constraint condition which is the traffic flow rate observed by each sensor located at each site.
- a variable is the traffic flow rate for each path on a time-space network obtained by expanding a network representing a traffic system in the time axis.
- the traffic flow rate is obtained for a path having actual passage results of people in the past.
- a traffic flow rate calculation method includes, by using a road network produced by representing a road system with a plurality of nodes and a plurality of edges, the road system including a stationary sensor for measuring the number of moving bodies, the plurality of edges including a stationary sensor edge corresponding a road including the stationary sensor, obtaining, by a processor, the first number of observations and the second number of observations, the first number of observations being the number of trajectories measured by mobile sensors for each path, the each path including the at least one edge, the each of trajectories corresponding to a movement trajectory of the moving body, the second number of observations being the number of moving bodies measured by the stationary sensor for the each of the stationary sensor edges; estimating an observation rate represented by a ratio of the first number of observations to an actual traffic flow rate of the path for the each path by using the first number of observations and the second number of observations; calculating a traffic flow rate for the each path by using the estimated observation rate for the each path and the first number of observations for each path.
- FIG. 1 is a functional block diagram illustrating a schematic configuration of a traffic flow rate calculation device according to the present embodiment
- FIG. 2 is a diagram illustrating an example of mobile sensor data
- FIG. 3 is a diagram illustrating an example of stationary sensor data
- FIG. 4 is a diagram illustrating an example of a data structure a path graph
- FIG. 5 is a diagram for explaining matching of mobile sensor data with a path graph
- FIG. 6 is a diagram illustrating an example of total results of the number of observations of moving bodies by stationary sensors
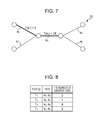
- FIG. 7 is a diagram illustrating an example of total results of the number of observations of moving bodies by stationary sensors
- FIG. 8 is a diagram illustrating an example of total results of the number of observations for each path by mobile sensors
- FIG. 9 is a diagram illustrating an example of total results of the number of observations for each path by mobile sensors.
- FIG. 10 is a diagram for explaining the case of applying a certain observation rate to each edge
- FIG. 11 is a diagram for explaining the case where only the number of observations by stationary sensors is used as a constraint condition
- FIG. 12 is a diagram for explaining the case where the number of observations by stationary sensors and the number of observations for each path are used as a constraint condition
- FIG. 13 is a diagram illustrating an example of a calculation result screen
- FIG. 14 is a block diagram illustrating a schematic configuration of a computer that functions as the traffic flow rate calculation device according to the present embodiment
- FIG. 15 is a flowchart illustrating an example of traffic flow rate calculation processing according to the present embodiment.
- FIG. 16 is a flowchart illustrating an example of expression creation processing.
- a sensor capable of observing a movement trajectory of a moving body such as a GPS, or the like to partially observe the traffic flow rate at each point.
- a sensor capable of observing a movement trajectory of a moving body such as a GPS, or the like
- just summing of observation information by the mobile sensors may give the traffic flow rate regarding limited moving bodies such as people having a smartphone with a specific application installed thereon, a vehicle in which a car navigation system having a specific function is installed or the like.
- a road sensor for VICSTM or a sensor, such as a ticket gate that supports a traffic system IC card, or the like
- the road sensor and the sensor provided in ticket gate are hereinafter referred to as a “stationary sensor”. That is to say, on a road, a facility, or the like on which a stationary sensor is installed, it is possible to correctly know the actual traffic flow rate. However, it is impossible to know the traffic flow rate of the other places at all.
- the observation rate by a mobile sensor in each edge or link is equal to the value given by dividing the traffic flow rate observed by mobile sensors by the actual traffic flow rate.
- This observation rate is equivalent to a in the related art technique.
- a is the actual distance of a road section indicated by an edge length or an edge, and is a known value.
- a traffic flow rate calculation device 10 receives input of mobile sensor data 31 and stationary sensor data 32 , calculates the traffic flow rate for each path in a path graph 33 , and displays the calculation result on the display device 20 .
- the mobile sensor data 31 is data observed by a sensor (hereinafter referred to as a “mobile sensor”), such as a global positioning system (GPS) capable of observing the movement trajectory of a moving body, such as a person, a vehicle, or the like.
- the mobile sensor data 31 is trajectory data represented by an observation data sequence that indicates the position of the moving body observed by the mobile sensor at predetermined time intervals.
- the observation data observed by the mobile sensor includes a sensor ID for identifying a mobile sensor, positional data (x-coordinate and y-coordinate) of a moving body, which is indicated by a latitude and a longitude for each observation point, and observation time.
- the trajectory data (the mobile sensor data 31 ) is produced by extracting a plurality of pieces of observation data for each sensor ID, and arranging positional data for each observation point included in each observation data in time series based on the observation time. In this regard, even when trajectory data has the same data sensor ID, when the difference in observation time between observation points is a predetermined time period or more, the trajectory data is divided at that position.
- trajectory ID that is uniquely identifiable of trajectory data is given to each trajectory data by adding a serial number to a sensor ID, or the like.
- trajectory data having a trajectory ID of ⁇ i is denoted by “trajectory data ⁇ i ”, and the trajectory represented by trajectory data ⁇ i is also denoted by “trajectory ⁇ i ”.
- trajectory data ⁇ i are P i1 , P i2 , . . . , P ij , . . . P iJ (J is the number of observation points included in the trajectory data ⁇ i ).
- J is the number of observation points included in the trajectory data ⁇ i .
- ⁇ i ⁇ P i1 , P i2 , . . . , P ij , . . . , P iJ ⁇ .
- the observation data indicating each observation point includes a trajectory ID of the trajectory data including the observation point, an observation point ID which is the identification information of the observation point, positional data (x-coordinate and y-coordinate), and observation time.
- P ij ⁇ i , P ij , (x ij , y ij ), s ij ⁇ .
- (x ij , y ij ) is the positional data of the observation point P ij
- s ij is the observation time of the observation point P ij .
- FIG. 2 illustrates an example in which the trajectory data (the mobile sensor data 31 ) is expressed by a data structure in a table form.
- the stationary sensor data 32 is data observed by a sensor (hereinafter referred to as a “stationary sensor”) that is disposed at a predetermined location and is capable of observing the correct number of moving bodies that pass the location.
- the stationary sensor is, for example, a road sensor for the system under the trademark Vehicle Information and Communication System (VICS), a ticket gate that supports a traffic system IC card, or the like.
- VICS Vehicle Information and Communication System
- FIG. 3 illustrates an example of the stationary sensor data 32 expressed by a data structure in a table form.
- the stationary sensor data 32 includes a “sensor ID” which is identification information of the stationary sensor, and positional data (“x-coordinate” and “y-coordinate”) indicating the location where the stationary sensor is disposed.
- the stationary sensor data 32 includes an item of “the number of observations” of the moving body observed by the stationary sensor at predetermined time intervals.
- the path graph 33 is an example of a road network produced by expressing a road traffic system by a plurality of nodes each of which represents positional information, and a plurality of edges that connect the nodes.
- FIG. 4 illustrates an example in which the path graph 33 is expressed by a data structure in a table form.
- the path graph 33 is represented by a set of node information indicating the nodes included in the path graph 33 , and a set of edge information indicating edges.
- the node information includes, for example, identification information (the node ID) of each node, and the positional data (x-coordinate and y-coordinate) of each node.
- the edge information includes the identification information (the edge ID) of each edge, and connected node information that is expressed by the notation of the node IDs of the nodes connected by the edge using an “ — (underscore)”.
- an edge having an edge ID of e i is also denoted by an “edge e i ”.
- the path graph 33 may be stored in a predetermined storage area of the traffic flow rate calculation device 10 , or may be stored in an external storage device coupled to the traffic flow rate calculation device 10 , or in a storage medium, such as a CD-ROM, a USB memory, or the like.
- the traffic flow rate calculation device 10 includes a mobile sensor data reception unit 11 , a stationary sensor data reception unit 12 , a matching unit 13 , an aggregation unit 14 , an expression creation unit 15 , a calculation unit 16 , and a display control unit 17 .
- the mobile sensor data reception unit 11 , the stationary sensor data reception unit 12 , the matching unit 13 , and the aggregation unit 14 are examples of the acquisition unit according to the present embodiment.
- the expression creation unit 15 and the calculation unit 16 are examples of the estimation unit and the calculation unit of the present embodiment respectively.
- the mobile sensor data reception unit 11 receives the mobile sensor data 31 , and transfers the received mobile sensor data 31 to the matching unit 13 .
- the stationary sensor data reception unit 12 receives the stationary sensor data 32 , and transfers the received stationary sensor data 32 to the aggregation unit 14 .
- the matching unit 13 reads the path graph 33 , performs matching of the trajectory indicated by each mobile sensor data 31 with the path graph 33 , and calculates the path corresponding to the trajectory. For example, as illustrated in FIG. 5 , the matching unit 13 performs matching of the path graph 33 including edges e 1 , e 2 , e 3 , e 4 , and e 5 with the trajectory ⁇ 1 including observation points P 11 , P 12 , and P 13 so as to calculate a path (e 1 , e 3 ) that corresponds to the trajectory ⁇ i . The matching unit 13 transfers the information of the path calculated for each of the mobile sensor data 31 to the aggregation unit 14 .
- the aggregation unit 14 Based on the stationary sensor data 32 transferred from the stationary sensor data reception unit 12 , the aggregation unit 14 identifies an edge corresponding to the location where the stationary sensor is disposed, the edge being hereinafter referred to as a “stationary sensor edge”, among the edges included in the path graph 33 . It is possible for the aggregation unit 14 to identify the stationary sensor edge based on the positional data included in the stationary sensor data 32 , for example. Also, the edge ID of the stationary sensor edge corresponding to the stationary sensor may be included in the stationary sensor data in advance. As illustrated in FIG. 6 , the aggregation unit 14 stores the edge ID of the identified stationary sensor edge and the number of observations of moving bodies observed by the stationary sensor corresponding to the stationary sensor edge.
- FIG. 7 illustrates an example in which the edges e 1 and e 3 are identified as stationary sensor edges in the path graph 33 that includes the edges e 1 , e 2 , e 3 , e 4 , and e 5 .
- the stationary sensor edges are indicated by double lines. This is the same in the following diagrams.
- an edge other than the stationary sensor edges is hereinafter referred to as a “normal edge”, and is illustrated by a solid line in the diagrams.
- the aggregation unit 14 sums up the number of observations for each path based on the path information transferred from the matching unit 13 .
- a path ID which is the identification information of a path
- a path having a path ID of T i is also denoted by a “path T i ”.
- FIG. 9 illustrates an example of the total result of the number of observations for each path.
- the aggregation unit 14 transfers the number of observations by the stationary sensors in the stationary sensor edges and the total result of the number of observations for each path by the mobile sensors to the expression creation unit 15 .
- the expression creation unit 15 creates an expression for estimating the observation rate by the mobile sensor for each path based on the total result transferred from the aggregation unit 14 .
- the observation rate by the mobile sensor is indicated by the ratio of the number of observations by the mobile sensors to the actual traffic flow rate of each path included in the path graph 33 .
- the expression creation unit 15 creates an expression for estimating the observation rate for each path using the number of observations by the mobile sensors regarding the path and the number of observations at the stationary sensor edges included in the path.
- the traffic flow rate for each edge is estimated by applying a technique for estimating the traveling time for each edge by multiplying the average speed of a vehicle transmitted from the road sensor and the average speed per hour of the vehicle that is transmitted from the running vehicle itself by ⁇ that is the actual distance of the road section indicated by the edge length or the edge.
- the traffic flow rate of each edge is unknown, and thus the observation rate ⁇ of each edge by the mobile sensor is also unknown.
- the average observation rate of the number of observations by a stationary sensor in a stationary sensor edge in which a correct traffic flow rate is observed is obtained from the number of observations by the mobile sensor in that stationary sensor edge. Assuming that the average observation rate is a, it is thought that the average observation rate is applied to each of all the edges.
- the number of observations (C(e i )) by the mobile sensor is obtained for each of the edges e 1 , e 2 , e 3 , e 4 , and e 5
- the number of observations (F(e i )) by the stationary sensor is obtained for each of the stationary sensor edges e 1 and e 3
- the number in parentheses, which is written with each edge is the actual traffic flow rate for each edge that is illustrated for reference.
- the traffic flow rate calculated by applying the average observation rate ⁇ to each edge sometimes has a large error with the actual traffic flow rate. This is because although the observation rate by a mobile sensor differs depending on the observation point, the observation rate for each edge is assumed to be a certain value ( ⁇ ).
- the reciprocal of the observation rate for the path T j observed by the mobile sensor is ⁇ j which is used instead of the observation rate for each edge.
- a constraint satisfaction problem is formulated by using the number of observations by the stationary sensor as a constraint and ⁇ j as a variable. Thereby, it is possible to express that the observation rate differs depending on the observation point, and the fact in which even one stationary sensor edge is included in the path becomes possible to be utilized as a constraint condition.
- a consideration is given to a method of solving an integer programming problem in which a constraint is the traffic flow rate observed by the stationary sensors and a variable is the traffic flow rate of the path having actual traffic results among the paths on a path graph.
- a constraint is the traffic flow rate observed by the stationary sensors
- a variable is the traffic flow rate of the path having actual traffic results among the paths on a path graph.
- a path T 1 (e 1 , e 3 ), a path T 2 (e 2 , e 3 ), a path T 3 (e 3 , e 4 ), and a path T 4 (e 3 , e 5 ) are paths having actual traffic results, and the stationary sensor edges are e 1 and e 3 .
- the traffic flow rates of the paths T 1 , T 2 , T 3 , and T 4 are ⁇ 1 , ⁇ 2 , ⁇ 3 , and ⁇ 4 respectively, the following relationship holds.
- the number of observations for each path which is obtained from mobile sensors, is added as a constraint condition.
- the solution is fixed by the constraint condition regarding the number of observations by the mobile sensors.
- the expression creation unit 15 specifically assumes the reciprocal of the observation rate of the path t for any path t on the path graph 33 is ⁇ (t) ( ⁇ (t)>1).
- the expression creation unit 15 then formulates the constraint satisfaction problem as illustrated in the following Expression (1) under the constraint of the number of observations C(t) of each path t and the number of observations F(e j ) of the stationary sensor edge.
- ⁇ T j ⁇ is a set of paths that includes the stationary sensor edge e j .
- F ( e j ) ⁇ t ⁇ Tj ⁇ C ( t ) ⁇ ( t ) (1)
- the expression creation unit 15 creates, in accordance with Expression (1), an expression using the number of observations of the path including the stationary sensor edge for each stationary sensor edge. For example, as illustrated in FIG. 12 , it is assumed that the number of observations C(T 1 ) of the path T 1 (e 1 , e 3 ) is 2, the number of observations C(T 2 ) of T 2 (e 2 , e 3 ) is 1, the number of observations C(T 3 ) of T 3 (e 3 , e 4 ) is 4, and the number of observations C(T 4 ) of T 4 (e 3 , e 5 ) is 6.
- the expression creation unit 15 creates the following Expression (2) and Expression (3) in accordance with Expression (1).
- the expression creation unit 15 transfers the created expressions to the calculation unit 16 .
- the calculation unit 16 multiplies ⁇ (t) by C(t) to calculate the traffic flow rate for each path t.
- ⁇ (t) is the reciprocal of the observation rate for each path t and the solution of the expression transferred from the expression creation unit 15
- C(t) is the number of observations of the path t observed by the mobile sensor. It is possible to use a solver of an existing linear programming, or the like for this calculation.
- the expression creation unit 15 calculates the following candidate values of the traffic flow rate by solving the above-described Expression (4) using a solver.
- E 1 6.
- the calculation unit 16 selects the traffic flow rate for each path, for example at random from the above-described candidate values, and transfers the traffic flow rate for each path to the display control unit 17 .
- the display control unit 17 controls the display device 20 so as to display the calculation result screen in which the calculated traffic flow rate for each path is superimposed on the path graph 33 , for example as illustrated in FIG. 13 .
- the paths on the path graph 33 include a path including only one edge
- FIG. 13 is the example in which the traffic flow rate is calculated for the path including only the one edge.
- the display control unit 17 may display the observation rate for each path with the traffic flow rate for each path. The observation rate for each path is obtained as the reciprocal of ⁇ (t) that is the solution of the expression created by the expression creation unit 15 .
- the computer 40 includes a processor or CPU 41 , a memory 42 as a temporary storage area, and a nonvolatile storage unit 43 . Also, the computer 40 includes an input and output device 44 including a display device 20 , a read/write(R/W) unit 45 that controls reading data from and writing data to the recording medium 49 , and a communication interface (I/F) 46 .
- the processor or CPU 41 , the memory 42 , the storage unit 43 , the input and output device 44 , the R/W unit 45 , and the communication I/F 46 are mutually coupled via a bus 47 .
- the storage unit 43 it is possible to realize the storage unit 43 by a hard disk drive (HDD), a solid state drive (SSD), a flash memory, or the like.
- a traffic flow rate calculation program 50 for functioning the computer 40 as the traffic flow rate calculation device 10 is stored.
- the traffic flow rate calculation program 50 includes a mobile sensor data reception process 51 , a stationary sensor data reception process 52 , a matching process 53 , an aggregation process 54 , an expression creation process 55 , a calculation process 56 , and a display control process 57 .
- the processor or CPU 41 reads the traffic flow rate calculation program 50 from the storage unit 43 and loads the program into the memory 42 , and executes the processes of the traffic flow rate calculation program 50 in sequence.
- the processor or CPU 41 executes the mobile sensor data reception process 51 so as to operate as the mobile sensor data reception unit 11 illustrated in FIG. 1 .
- the processor or CPU 41 executes the stationary sensor data reception process 52 so as to operate as the stationary sensor data reception unit 12 illustrated in FIG. 1 .
- the processor or CPU 41 executes the matching process 53 so as to operate as the matching unit 13 illustrated in FIG. 1 .
- the processor or CPU 41 executes the aggregation process 54 so as to operate as the aggregation unit 14 illustrated in FIG. 1 .
- the processor or CPU 41 executes the expression creation process 55 so as to operate as the expression creation unit 15 illustrated in FIG. 1 . Also, the processor or CPU 41 executes the calculation process 56 so as to operate as the calculation unit 16 illustrated in FIG. 1 . Also, the processor or CPU 41 executes the display control process 57 so as to operate as the display control unit 17 illustrated in FIG. 1 . Thereby, the computer 40 that has executed the traffic flow rate calculation program 50 functions as the traffic flow rate calculation device 10 .
- the traffic flow rate calculation program 50 it is possible to realize the functions that are realized by the traffic flow rate calculation program 50 by, for example a semiconductor integrated circuit, more specifically an application specific integrated circuit (ASIC), or the like.
- a semiconductor integrated circuit more specifically an application specific integrated circuit (ASIC), or the like.
- ASIC application specific integrated circuit
- the traffic flow rate calculation device 10 performs the traffic flow rate calculation processing illustrated in FIG. 15 .
- step S 10 the mobile sensor data reception unit 11 receives the mobile sensor data 31 , and transfers the received mobile sensor data 31 to the matching unit 13 . Also, the stationary sensor data reception unit 12 receives the stationary sensor data 32 , and transfers the received stationary sensor data 32 to the aggregation unit 14 .
- step S 20 the matching unit 13 reads the path graph 33 , and performs matching of the trajectory indicated by each of the mobile sensor data 31 with the path graph 33 so as to calculate the path corresponding to the trajectory.
- step S 30 the aggregation unit 14 identifies a stationary sensor edge based on the stationary sensor data 32 transferred from the stationary sensor data reception unit 12 , and sums up the number of observations of the moving bodies observed by the stationary sensor corresponding to the stationary sensor edge. Also, the aggregation unit 14 sums up the number of observations for each path on the path graph 33 based on the path information transferred from the matching unit 13 .
- step S 40 the expression creation processing, the details of which is illustrated in FIG. 16 , is performed.
- step S 41 of the expression creation processing illustrated in FIG. 16 the expression creation unit 15 sets the variable ⁇ (t) of the reciprocal of the observation rate of the path t for each path t on the path graph 33 . Also, the expression creation unit 15 sets the number of observations of the path t by the mobile sensor, which has been summed up in step S 30 to C(t), and sets the number of observations of the stationary sensor edge e by the stationary sensor to F(e).
- step S 42 the expression creation unit 15 determines whether or not the processing of the steps S 43 to S 48 illustrated below has completed for all the edges included in the path graph 33 .
- the processing proceeds to step S 43 , the expression creation unit 15 fetches one of the unprocessed edges, and sets the unprocessed edge to the processing target edge e j .
- step S 44 the expression creation unit 15 obtains a set of paths that pass through the edge e j as ⁇ T j ⁇ .
- step S 45 the expression creation unit 15 determines whether or not ⁇ T j ⁇ is an empty set.
- ⁇ T j ⁇ is not an empty set
- the processing proceeds to step S 46
- ⁇ T j ⁇ is an empty set
- the processing proceeds to step S 48 .
- step S 46 the expression creation unit 15 determines whether or not the edge e j is a stationary sensor edge.
- the processing proceeds to step S 47 , whereas when the edge e j is a normal edge, the processing proceeds to step S 48 .
- step S 47 the expression creation unit 15 creates an expression in accordance with Expression (1) as the expression Eq(e j ) for the edge e j .
- the expression creation unit 15 creates an expression in which the reciprocal of the observation rate of each path t (t ⁇ T j ⁇ ) is used as the variable ⁇ (t) using the number of observations C(t) of each path t (t ⁇ T j ⁇ ) included in the number of observations F(e j ) of the stationary sensor edge e j , and the set ⁇ T j ⁇ .
- the expression creation unit 15 outputs the created expression to the calculation unit 16 , and the processing returns to step S 42 .
- step S 48 the expression creation unit 15 outputs an empty expression to the calculation unit 16 as the expression Eq(e j ) for the edge e j , and the processing returns to step S 42 .
- step S 42 when the expression creation unit 15 determines that the processing of steps S 43 to S 48 has completed for all the edges included in the path graph 33 , the processing returns to the traffic flow rate calculation processing illustrated in FIG. 15 .
- step S 50 of the traffic flow rate calculation processing illustrated in FIG. 15 the calculation unit 16 multiplies the reciprocal ⁇ (t) of the observation rate for each path t, which is the solution of the expression created by expression creation unit 15 , with the number of observations C(t) of the path t observed by the mobile sensor, to calculate the candidate values of the traffic flow rate for each path t.
- the calculation unit 16 selects the traffic flow rate for each path from the candidate values, for example at random, and transfers the traffic flow rate to the display control unit 17 .
- step S 60 the display control unit 17 controls the display device 20 , for example as illustrated in FIG. 13 , so that a calculation result screen in which the calculated traffic flow rate for each path and the observation rate is displayed in a superimposed manner on the path graph 33 , and the traffic flow rate calculation processing is terminated.
- the observation rate of the path included in a path graph is estimated using the number of observations of the stationary sensor edge sensor included in the path and the number of observations of the path.
- the traffic flow rate for each path is then calculated using the estimated observation rate for each path.
- the expression for estimating the observation rate for each path is not limited to Expression (1).
- a constraint condition such as minimizing the difference between the maximum value and the minimum value of the observation rate for each path may be further added.
- the traffic flow rate of a path including a stationary sensor edge is calculated in advance.
- the calculated traffic flow rate of the path ought to be used as the number of observations of the stationary sensor edge, and the traffic flow rate of the path not including the stationary sensor edge and including the path having the calculated traffic flow rate ought to be calculated.
- the road network may be expressed by a graph having edges that mutually intersect, or may be expressed in a three or more dimensional graph.
- the traffic flow rate calculation program 50 is stored (installed) in the storage unit 43 in advance.
- the present embodiment is not limited to this. It is possible to provide the traffic flow rate calculation program according to the present embodiment in a mode of being recorded on a recording medium, such as a CD-ROM, a DVD-ROM, a USB memory, or the like.
Landscapes
- Chemical & Material Sciences (AREA)
- Analytical Chemistry (AREA)
- Physics & Mathematics (AREA)
- General Physics & Mathematics (AREA)
- Traffic Control Systems (AREA)
Applications Claiming Priority (2)
| Application Number | Priority Date | Filing Date | Title |
|---|---|---|---|
| JP2016009081A JP6705179B2 (ja) | 2016-01-20 | 2016-01-20 | 交通流量算出方法、装置、及びプログラム |
| JP2016-009081 | 2016-01-20 |
Publications (2)
| Publication Number | Publication Date |
|---|---|
| US20170206782A1 US20170206782A1 (en) | 2017-07-20 |
| US10049567B2 true US10049567B2 (en) | 2018-08-14 |
Family
ID=57799594
Family Applications (1)
| Application Number | Title | Priority Date | Filing Date |
|---|---|---|---|
| US15/407,475 Active US10049567B2 (en) | 2016-01-20 | 2017-01-17 | Traffic flow rate calculation method and device |
Country Status (3)
| Country | Link |
|---|---|
| US (1) | US10049567B2 (de) |
| EP (1) | EP3200170A3 (de) |
| JP (1) | JP6705179B2 (de) |
Cited By (1)
| Publication number | Priority date | Publication date | Assignee | Title |
|---|---|---|---|---|
| US20210025724A1 (en) * | 2018-03-27 | 2021-01-28 | Nippon Telegraph And Telephone Corporation | Estimation apparatus, estimation method and program |
Families Citing this family (10)
| Publication number | Priority date | Publication date | Assignee | Title |
|---|---|---|---|---|
| US10025563B2 (en) | 2016-09-14 | 2018-07-17 | International Business Machines Corporation | Selecting COBOL perform statements for inlining |
| JP6723967B2 (ja) * | 2017-10-27 | 2020-07-15 | 日本電信電話株式会社 | 推定装置、推定方法及びプログラム |
| JP2019175240A (ja) * | 2018-03-29 | 2019-10-10 | 西日本電信電話株式会社 | データ解析装置、データ解析方法、及びプログラム |
| CN109064751A (zh) * | 2018-09-29 | 2018-12-21 | 中国科学技术大学苏州研究院 | 一种实现差分隐私的路口间交通流量估计方法及系统 |
| US20220327924A1 (en) * | 2019-05-23 | 2022-10-13 | Nippon Telegraph And Telephone Corporation | Traffic volume by route estimation device, traffic volume by route estimation method, and traffic volume by route estimation program |
| US20220245486A1 (en) * | 2019-06-26 | 2022-08-04 | Nippon Telegraph And Telephone Corporation | Prediction device, prediction method, and prediction program |
| WO2021033316A1 (ja) * | 2019-08-22 | 2021-02-25 | 日本電信電話株式会社 | 人数推定装置、人数推定方法、及び人数推定プログラム |
| US11719541B2 (en) * | 2019-11-13 | 2023-08-08 | Aclima Inc. | Hyper-local mapping of environmental conditions |
| JP7294660B2 (ja) * | 2019-12-24 | 2023-06-20 | 株式会社未来シェア | 経路計画装置、経路計画方法、ならびに、プログラム |
| US12524180B2 (en) * | 2020-06-16 | 2026-01-13 | Samsung Electronics Co., Ltd. | Edge solid state drive (SSD) device and edge data system |
Citations (5)
| Publication number | Priority date | Publication date | Assignee | Title |
|---|---|---|---|---|
| JP2001148094A (ja) | 1999-11-18 | 2001-05-29 | Denso Corp | 移動体通信装置の移動情報収集システムおよび交通情報収集システム |
| US6490519B1 (en) * | 1999-09-27 | 2002-12-03 | Decell, Inc. | Traffic monitoring system and methods for traffic monitoring and route guidance useful therewith |
| JP2003203289A (ja) | 2001-12-28 | 2003-07-18 | Fujitsu Fip Corp | 渋滞分布を推測する経路探査システム |
| JP2004029871A (ja) | 2002-06-21 | 2004-01-29 | Hitachi Ltd | 交通情報システム |
| JP2012079197A (ja) | 2010-10-05 | 2012-04-19 | Sumitomo Electric Ind Ltd | プローブ情報の処理装置、コンピュータプログラム、情報処理システム及びリンク端の通過時刻算出方法 |
Family Cites Families (4)
| Publication number | Priority date | Publication date | Assignee | Title |
|---|---|---|---|---|
| JP4633505B2 (ja) * | 2005-03-04 | 2011-02-16 | パナソニック株式会社 | 交通情報生成装置及び交通情報生成方法、交通情報提供装置並びに交通情報配信システム |
| JP2008210123A (ja) * | 2007-02-26 | 2008-09-11 | Aisin Aw Co Ltd | 渋滞情報作成装置 |
| JP5471212B2 (ja) * | 2009-09-10 | 2014-04-16 | 住友電気工業株式会社 | 交通信号制御装置及びコンピュータプログラム |
| CN104025166B (zh) * | 2011-12-28 | 2016-10-12 | 三菱电机株式会社 | 中心侧系统及车辆侧系统 |
-
2016
- 2016-01-20 JP JP2016009081A patent/JP6705179B2/ja not_active Expired - Fee Related
-
2017
- 2017-01-13 EP EP17151367.4A patent/EP3200170A3/de not_active Ceased
- 2017-01-17 US US15/407,475 patent/US10049567B2/en active Active
Patent Citations (5)
| Publication number | Priority date | Publication date | Assignee | Title |
|---|---|---|---|---|
| US6490519B1 (en) * | 1999-09-27 | 2002-12-03 | Decell, Inc. | Traffic monitoring system and methods for traffic monitoring and route guidance useful therewith |
| JP2001148094A (ja) | 1999-11-18 | 2001-05-29 | Denso Corp | 移動体通信装置の移動情報収集システムおよび交通情報収集システム |
| JP2003203289A (ja) | 2001-12-28 | 2003-07-18 | Fujitsu Fip Corp | 渋滞分布を推測する経路探査システム |
| JP2004029871A (ja) | 2002-06-21 | 2004-01-29 | Hitachi Ltd | 交通情報システム |
| JP2012079197A (ja) | 2010-10-05 | 2012-04-19 | Sumitomo Electric Ind Ltd | プローブ情報の処理装置、コンピュータプログラム、情報処理システム及びリンク端の通過時刻算出方法 |
Non-Patent Citations (2)
| Title |
|---|
| Extended European Search Report dated Jul. 7, 2017, issued in counterpart European Application No. 17151367.4. (8 pages). |
| Umetani et al., "Estimation of Movement History of People based on the Observation Information", CSIS DAYS 2014 Research Abstracts, pp. 26, 2014. |
Cited By (2)
| Publication number | Priority date | Publication date | Assignee | Title |
|---|---|---|---|---|
| US20210025724A1 (en) * | 2018-03-27 | 2021-01-28 | Nippon Telegraph And Telephone Corporation | Estimation apparatus, estimation method and program |
| US11859992B2 (en) * | 2018-03-27 | 2024-01-02 | Nippon Telegraph And Telephone Corporation | Estimation apparatus, estimation method and program |
Also Published As
| Publication number | Publication date |
|---|---|
| JP6705179B2 (ja) | 2020-06-03 |
| EP3200170A3 (de) | 2017-08-09 |
| JP2017130057A (ja) | 2017-07-27 |
| US20170206782A1 (en) | 2017-07-20 |
| EP3200170A2 (de) | 2017-08-02 |
Similar Documents
| Publication | Publication Date | Title |
|---|---|---|
| US10049567B2 (en) | Traffic flow rate calculation method and device | |
| US10319232B2 (en) | Traffic flow rates | |
| EP2976762B1 (de) | Fahrzeugankunftsvorhersage | |
| JP5930920B2 (ja) | 地図生成サーバ、地図生成方法及び地図生成システム | |
| US9644976B2 (en) | Building missing movement path of an object | |
| US20140005916A1 (en) | Real-time traffic prediction and/or estimation using gps data with low sampling rates | |
| US20140136453A1 (en) | Statistical estimation of origin and destination points of trip using plurality of types of data sources | |
| JP5931989B2 (ja) | プローブデータのマップマッチング結果の信頼性判定方法、装置およびプログラム | |
| GB2541710A (en) | Locating train events on a railway network | |
| Stipancic et al. | Measuring and visualizing space–time congestion patterns in an urban road network using large-scale smartphone-collected GPS data | |
| US20190249997A1 (en) | Effective search of travelling data corresponding to measured positions of a vehicle | |
| US20170045363A1 (en) | Path graph generation method, path graph generation device and storage medium | |
| US20190045327A1 (en) | Device diversity correction method for rss-based precise location tracking | |
| CN115390118B (zh) | 定位精度的测量方法、系统、车辆和存储介质 | |
| CN115407370B (zh) | 用于gnss信号的可靠性检验方法、装置、电子设备和介质 | |
| US11480648B2 (en) | Device and method for determining at least one position of a mobile terminal | |
| JP2020076721A (ja) | 位置推定装置、プログラム、位置推定方法、情報処理装置、及び情報処理方法 | |
| EP3470790A1 (de) | Informationsverarbeitungsvorrichtung und fahrtsteuerungssystem | |
| US11391808B2 (en) | Method for direction finding of at least one stationary and/or moving transmitter as well as system for direction finding | |
| CN109270566B (zh) | 导航方法、导航效果测试方法、装置、设备和介质 | |
| JP7273649B2 (ja) | ナビゲーションシステム、ナビゲーション方法及びプログラム | |
| CN111288942B (zh) | 轨道应答器位置测量方法、装置及计算机设备 | |
| CN114158119B (zh) | 行驶方向的识别方法、装置、电子设备和介质 | |
| EP4682470A1 (de) | Informationsverarbeitungsvorrichtung, informationsverarbeitungsverfahren und informationsverarbeitungsprogramm | |
| CN111428608B (zh) | 交通工具定位方法、装置、计算机设备和存储介质 |
Legal Events
| Date | Code | Title | Description |
|---|---|---|---|
| AS | Assignment |
Owner name: FUJITSU LIMITED, JAPAN Free format text: ASSIGNMENT OF ASSIGNORS INTEREST;ASSIGNORS:ASAI, TATSUYA;SHIGEZUMI, JUNICHI;INAKOSHI, HIROYA;REEL/FRAME:041380/0008 Effective date: 20161228 |
|
| STCF | Information on status: patent grant |
Free format text: PATENTED CASE |
|
| MAFP | Maintenance fee payment |
Free format text: PAYMENT OF MAINTENANCE FEE, 4TH YEAR, LARGE ENTITY (ORIGINAL EVENT CODE: M1551); ENTITY STATUS OF PATENT OWNER: LARGE ENTITY Year of fee payment: 4 |
|
| FEPP | Fee payment procedure |
Free format text: MAINTENANCE FEE REMINDER MAILED (ORIGINAL EVENT CODE: REM.); ENTITY STATUS OF PATENT OWNER: LARGE ENTITY |