EP4523616A2 - Verarbeitung physiologischer elektrischer daten für analytische beurteilungen - Google Patents
Verarbeitung physiologischer elektrischer daten für analytische beurteilungen Download PDFInfo
- Publication number
- EP4523616A2 EP4523616A2 EP25154819.4A EP25154819A EP4523616A2 EP 4523616 A2 EP4523616 A2 EP 4523616A2 EP 25154819 A EP25154819 A EP 25154819A EP 4523616 A2 EP4523616 A2 EP 4523616A2
- Authority
- EP
- European Patent Office
- Prior art keywords
- analyte
- ecg
- data
- beats
- beat
- Prior art date
- Legal status (The legal status is an assumption and is not a legal conclusion. Google has not performed a legal analysis and makes no representation as to the accuracy of the status listed.)
- Pending
Links
Images











Classifications
-
- A—HUMAN NECESSITIES
- A61—MEDICAL OR VETERINARY SCIENCE; HYGIENE
- A61B—DIAGNOSIS; SURGERY; IDENTIFICATION
- A61B5/00—Measuring for diagnostic purposes; Identification of persons
-
- A—HUMAN NECESSITIES
- A61—MEDICAL OR VETERINARY SCIENCE; HYGIENE
- A61B—DIAGNOSIS; SURGERY; IDENTIFICATION
- A61B5/00—Measuring for diagnostic purposes; Identification of persons
- A61B5/02—Detecting, measuring or recording for evaluating the cardiovascular system, e.g. pulse, heart rate, blood pressure or blood flow
-
- A—HUMAN NECESSITIES
- A61—MEDICAL OR VETERINARY SCIENCE; HYGIENE
- A61B—DIAGNOSIS; SURGERY; IDENTIFICATION
- A61B5/00—Measuring for diagnostic purposes; Identification of persons
- A61B5/02—Detecting, measuring or recording for evaluating the cardiovascular system, e.g. pulse, heart rate, blood pressure or blood flow
- A61B5/0205—Simultaneously evaluating both cardiovascular conditions and different types of body conditions, e.g. heart and respiratory condition
-
- A—HUMAN NECESSITIES
- A61—MEDICAL OR VETERINARY SCIENCE; HYGIENE
- A61B—DIAGNOSIS; SURGERY; IDENTIFICATION
- A61B5/00—Measuring for diagnostic purposes; Identification of persons
- A61B5/02—Detecting, measuring or recording for evaluating the cardiovascular system, e.g. pulse, heart rate, blood pressure or blood flow
- A61B5/024—Measuring pulse rate or heart rate
-
- A—HUMAN NECESSITIES
- A61—MEDICAL OR VETERINARY SCIENCE; HYGIENE
- A61B—DIAGNOSIS; SURGERY; IDENTIFICATION
- A61B5/00—Measuring for diagnostic purposes; Identification of persons
- A61B5/02—Detecting, measuring or recording for evaluating the cardiovascular system, e.g. pulse, heart rate, blood pressure or blood flow
- A61B5/024—Measuring pulse rate or heart rate
- A61B5/0245—Measuring pulse rate or heart rate by using sensing means generating electric signals, i.e. ECG signals
-
- A—HUMAN NECESSITIES
- A61—MEDICAL OR VETERINARY SCIENCE; HYGIENE
- A61B—DIAGNOSIS; SURGERY; IDENTIFICATION
- A61B5/00—Measuring for diagnostic purposes; Identification of persons
- A61B5/02—Detecting, measuring or recording for evaluating the cardiovascular system, e.g. pulse, heart rate, blood pressure or blood flow
- A61B5/026—Measuring blood flow
- A61B5/0285—Measuring or recording phase velocity of blood waves
-
- A—HUMAN NECESSITIES
- A61—MEDICAL OR VETERINARY SCIENCE; HYGIENE
- A61B—DIAGNOSIS; SURGERY; IDENTIFICATION
- A61B5/00—Measuring for diagnostic purposes; Identification of persons
- A61B5/145—Measuring characteristics of blood in vivo, e.g. gas concentration or pH-value ; Measuring characteristics of body fluids or tissues, e.g. interstitial fluid or cerebral tissue
- A61B5/14532—Measuring characteristics of blood in vivo, e.g. gas concentration or pH-value ; Measuring characteristics of body fluids or tissues, e.g. interstitial fluid or cerebral tissue for measuring glucose, e.g. by tissue impedance measurement
-
- A—HUMAN NECESSITIES
- A61—MEDICAL OR VETERINARY SCIENCE; HYGIENE
- A61B—DIAGNOSIS; SURGERY; IDENTIFICATION
- A61B5/00—Measuring for diagnostic purposes; Identification of persons
- A61B5/145—Measuring characteristics of blood in vivo, e.g. gas concentration or pH-value ; Measuring characteristics of body fluids or tissues, e.g. interstitial fluid or cerebral tissue
- A61B5/14546—Measuring characteristics of blood in vivo, e.g. gas concentration or pH-value ; Measuring characteristics of body fluids or tissues, e.g. interstitial fluid or cerebral tissue for measuring analytes not otherwise provided for, e.g. ions, cytochromes
-
- A—HUMAN NECESSITIES
- A61—MEDICAL OR VETERINARY SCIENCE; HYGIENE
- A61B—DIAGNOSIS; SURGERY; IDENTIFICATION
- A61B5/00—Measuring for diagnostic purposes; Identification of persons
- A61B5/24—Detecting, measuring or recording bioelectric or biomagnetic signals of the body or parts thereof
- A61B5/316—Modalities, i.e. specific diagnostic methods
- A61B5/318—Heart-related electrical modalities, e.g. electrocardiography [ECG]
- A61B5/346—Analysis of electrocardiograms
- A61B5/349—Detecting specific parameters of the electrocardiograph cycle
- A61B5/355—Detecting T-waves
-
- A—HUMAN NECESSITIES
- A61—MEDICAL OR VETERINARY SCIENCE; HYGIENE
- A61B—DIAGNOSIS; SURGERY; IDENTIFICATION
- A61B5/00—Measuring for diagnostic purposes; Identification of persons
- A61B5/72—Signal processing specially adapted for physiological signals or for diagnostic purposes
- A61B5/7235—Details of waveform analysis
- A61B5/7264—Classification of physiological signals or data, e.g. using neural networks, statistical classifiers, expert systems or fuzzy systems
-
- G—PHYSICS
- G16—INFORMATION AND COMMUNICATION TECHNOLOGY [ICT] SPECIALLY ADAPTED FOR SPECIFIC APPLICATION FIELDS
- G16H—HEALTHCARE INFORMATICS, i.e. INFORMATION AND COMMUNICATION TECHNOLOGY [ICT] SPECIALLY ADAPTED FOR THE HANDLING OR PROCESSING OF MEDICAL OR HEALTHCARE DATA
- G16H50/00—ICT specially adapted for medical diagnosis, medical simulation or medical data mining; ICT specially adapted for detecting, monitoring or modelling epidemics or pandemics
- G16H50/70—ICT specially adapted for medical diagnosis, medical simulation or medical data mining; ICT specially adapted for detecting, monitoring or modelling epidemics or pandemics for mining of medical data, e.g. analysing previous cases of other patients
-
- A—HUMAN NECESSITIES
- A61—MEDICAL OR VETERINARY SCIENCE; HYGIENE
- A61B—DIAGNOSIS; SURGERY; IDENTIFICATION
- A61B5/00—Measuring for diagnostic purposes; Identification of persons
- A61B5/24—Detecting, measuring or recording bioelectric or biomagnetic signals of the body or parts thereof
- A61B5/316—Modalities, i.e. specific diagnostic methods
- A61B5/318—Heart-related electrical modalities, e.g. electrocardiography [ECG]
- A61B5/346—Analysis of electrocardiograms
- A61B5/349—Detecting specific parameters of the electrocardiograph cycle
- A61B5/35—Detecting specific parameters of the electrocardiograph cycle by template matching
-
- G—PHYSICS
- G16—INFORMATION AND COMMUNICATION TECHNOLOGY [ICT] SPECIALLY ADAPTED FOR SPECIFIC APPLICATION FIELDS
- G16H—HEALTHCARE INFORMATICS, i.e. INFORMATION AND COMMUNICATION TECHNOLOGY [ICT] SPECIALLY ADAPTED FOR THE HANDLING OR PROCESSING OF MEDICAL OR HEALTHCARE DATA
- G16H50/00—ICT specially adapted for medical diagnosis, medical simulation or medical data mining; ICT specially adapted for detecting, monitoring or modelling epidemics or pandemics
- G16H50/20—ICT specially adapted for medical diagnosis, medical simulation or medical data mining; ICT specially adapted for detecting, monitoring or modelling epidemics or pandemics for computer-aided diagnosis, e.g. based on medical expert systems
Definitions
- This document generally describes computer-based technology for analyzing physiological electrical data (e.g., electrocardiogram data).
- Blood potassium levels are tightly homeostatically regulated, and critical for normal physiologic cellular function. See Einhorn LM, Zhan M, Walker LD, Moen MF, Seliger SL, Weir MR, Fink JC: The frequency of hyperkalemia and its significance in chronic kidney disease. Archives of Internal Medicine 169, 1156-1162 (2009 ); Goyal A, Spertus JA, Gosch K: Serum potassium levels and mortality in acute myocardial infarction. JAMA 307, 157-164, doi:10.1001/jama.2011.1967 (2012 ). Fluctuations in potassium values are found in many disease states and can expose patients to life threatening arrhythmias. See Gennari, F. J. Hypokalemia.
- Potassium levels outside the normal range are concerning, as they are usually clinically silent, occurring without warning to the patient or provider in the absence of blood tests. See Gumz, M. L., Rabinowitz, L. & Wingo, C. S. An Integrated View of Potassium Homeostasis. New England Journal of Medicine 373, 60-72, doi:doi:10.1056/NEJMra1313341 (2015 ).
- ECG signals or other types of electrogram data
- levels of analytes e.g., potassium
- analytes e.g., potassium
- a personalized strategy can be employed in which an algorithm is individualized based on seeding blood tests.
- a global analysis strategy can be employed that requires no blood tests at all.
- these techniques can include noninvasive remote potassium monitoring, which may permit the administration of evidence-based life-saving measures and medications, including recently developed safe and effective potassium lowering medications. See Ash, S. R., Singh, B., Lavin, P. T., Stavros, F. & Rasmussen, H. S. A phase 2 study on the treatment of hyperkalemia in patients with chronic kidney disease suggests that the selective potassium trap, ZS-9, is safe and efficient.
- Kidney Int doi:10.1038/ki.2014.382 (2015 ); Packham DK, Rasmussen HS, Lavin PT, El-Shahawy MA, Roger SD, Block G, Qunibi W, Pergola P, Singh B: Sodium Zirconium Cyclosilicate in Hyperkalemia. New England Journal of Medicine 372, 222-231, doi:doi:10.1056/NEJMoa1411487 (2015 ); Bakris GL, Pitt B, Weir MR, Freeman MW, Mayo MR, Garza D, Stasiv Y, Zawadzki R, Berman L, Bushinsky DA; AMETHYST-DN Investigators.
- Some implementations of the subject matter described herein include a computer-implemented method for assessing a level of an analyte within a human.
- the method can include obtaining data indicating electrocardiogram results from the human.
- a plurality of beats represented in the electrocardiogram results can be identified.
- For each beat in the plurality of beats represented in the electrocardiogram results a value for a first feature of the beat can be determined.
- Statistical analysis can be performed on the values for the first feature of the plurality of beats.
- An indication of the level of the analyte within the human can be generated based on a result of the statistical analysis performed on the values for the first feature of the plurality of beats.
- the indication of the level of the analyte within the human can be provided.
- electrocardiogram results are referred to by way of example, other forms of physiological electrical data may be used in some examples (i.e., electrogram data).
- the analyte can be potassium, magnesium, phosphorous, calcium, bicarbonate, hydrogen ion, or glucose.
- the analyte is a pharmaceutical (e.g., digoxin, Class I-C anti-arrhythmia drugs, sotalol, dofetilide, amiodarone, beta blockers, calcium channel blockers, tricyclic antidepressants, lithium, and the like).
- Determining, for each beat in the plurality of beats represented in the electrocardiogram results, the value for the first feature of the beat can include calculating, for each beat in the plurality of beats, a slope of at least a portion of a T-wave in the beat between the peak of the T-wave and the end of the T-wave.
- Determining, for each beat in the plurality of beats represented in the electrocardiogram results, the value for the first feature of the beat can include calculating, for each beat in the plurality of beats, a magnitude of the peak of a T-wave in the beat.
- a value can be determined for a second feature of the beat other than the first feature.
- Statistical analysis can be performed on the values for the second feature of the plurality of beats.
- the indication of the level of the analyte within the human can be generated further based on a result of the statistical analysis performed on the values for the second feature of the plurality of beats.
- the statistical analysis may be performed with our without signal-averaging techniques.
- values for the first feature may be determined for individual beats represented in the ECG data, rather than for a "composite" beat that has been averaged from multiple different beats and/or from multiple different signals recorded for the same beat.
- the statistical analysis may then be performed on the values for the first feature of the individual beats.
- statistical analysis may be performed on values for the first feature of at least some beats that are "composite" representations of multiple individual beats that have been averaged or otherwise combined.
- the data indicating the electrocardiogram results from the human can be data recorded from only a single lead of an electrocardiogram device.
- the data indicating the electrocardiogram results from the human can be data recorded from a portable electrocardiogram device having less than 12 leads.
- the data indicating the electrocardiogram results from the human can be analyzed to identify segments of the electrocardiogram results having a signal quality score that does not meet a threshold signal quality score. Segments of the electrocardiogram results having the signal quality score that does not meet the threshold signal quality score can be discarded.
- Identifying the plurality of beats represented in the electrocardiogram results can include identifying beats from segments of the electrocardiogram results other than the discarded segments having the signal quality score that does not meet the threshold signal quality score.
- Performing statistical analysis on the values for the first feature of the plurality of beats can include fitting a distribution of the values for the first feature of at least some of the plurality of beats to a probability distribution function.
- the probability distribution function can be a normal probability distribution function, a gamma probability distribution function, or a Gaussian probability distribution function.
- Generating the indication of the level of the analyte within the human can include comparing the values for the first feature of at least a subset of the plurality of beats to a pre-defined template that maps values for the first feature to levels of the analyte within a human or that maps values derived at least in part from the first feature to levels of the analyte within a human.
- the pre-defined template can be generated based on assessments of the level of the analyte within a population of humans other than the human from which the data indicating the electrocardiogram results was obtained.
- the pre-defined template can be generated based on assessments of the level of the analyte within the human from which the data indicating the electrocardiogram results was obtained.
- Generating the indication of the level of the analyte within the human can include comparing the result of the statistical analysis performed on the values for the first feature of the plurality of beats to a pre-defined template that maps statistical results for historical values for the first feature to levels of the analyte within a human.
- the pre-defined template can be generated based on assessments of the level of the analyte within a population of humans other than the human from which the data indicating the electrocardiogram results was obtained.
- the pre-defined template can be generated based on assessments of the level of the analyte within the human from which the data indicating the electrocardiogram results was obtained.
- the method or operations can be performed at least in part on a mobile computing device of the human. Different divisions of processing among a mobile computing device (or other user/client device) and remote servers are possible.
- the entire algorithm for assessing analyte levels may be performed locally on a mobile device.
- portions of the algorithm may be performed remotely, such as through a cloud-based software-as-a-service (SAAS) platform (e.g., raw ECG data may be transmitted from the mobile device over the Internet to a remote server, and the remote server may process the ECG data to determine an analyte level that is sent back to the mobile device for presentation to a user, or sent to another platform or device for care provider review).
- SAAS software-as-a-service
- pre-processing of the ECG data may be performed locally by the mobile device, and the processed ECG data and/or feature values derived from the ECG data may be submitted to a remote server for processing to ultimately determine an analyte level.
- Providing the indication of the level of the analyte within the human can include presenting the indication of the level of the analyte on an electronic display of the mobile computing device.
- Identifying the plurality of beats can include identifying QRS complexes that occur in at least a subset of the plurality of beats. Identifying the QRS complexes that occur in the at least the subset of the plurality of beats can include identifying features that occur in the electrocardiogram results at a frequency indicated by the human's heart rate or by an estimate of the R-R interval in the electrocardiogram results.
- Determining the values for the first feature of the plurality of beats can include determining initial values for the first feature of the plurality of beats and filtering the initial values.
- physiological electrical data may be obtained using any suitable technique such as electrocardiogram ("ECG") measurements (which may include surface, intracardiac, or subcutaneous ECGs, or measurements obtained using a pacemaker implanted in a patient's body, or defibrillators, for example).
- ECG electrocardiogram
- Other physiological electrograms may also be employed, including brain electrograms ("EEG”), muscular electrograms, myoelectrograms that cover smooth and striated muscle, for example, and neuro-electrograms.
- EEG brain electrograms
- muscular electrograms myoelectrograms that cover smooth and striated muscle, for example
- neuro-electrograms Either or both tonic and resting physiologic electrograms may be employed, as well as electrograms that measure responses to provocations such as evoked stimuli or extrinsic electrical stimulation or other stimulation.
- a system can non-invasively measure and/or determine changes in analyte levels of the subject (e.g., levels of calcium, potassium, magnesium, glucose, and the like), determine levels and monitor the effects of pharmaceuticals (e.g., digoxin, Class I-C anti-arrhythmia drugs, sotalol, dofetilide, amiodarone, beta blockers, calcium channel blockers, tricyclic antidepressants, lithium, and the like), detect physiological abnormalities (e.g., acute myocardial infarction, subarachnoid bleed, fluid accumulation around the heart, and the like), or a combination of these.
- the system can monitor for compliance with avoidance of drugs such as cocaine, amphetamines, marijuana, and the like.
- electrogram data generally refers to an electrical recording of any electrically active biological tissue, whether recorded from a traditional surface ECG electrode, custom body surface electrodes that may vary in size, shape, and inter-electrode distance, for example, or from intracoporeal electrodes, whether they be subcutaneous, intracardiac, or within other tissues or natural cavities. Electrograms from which such data is obtained may be spontaneous, or in response to a stimulus or provocation, and may be recorded from contact or non-contact electrodes. By way of example, the electrogram data may be obtained from one or more physiological electrograms including electrocardiograms (ECG), brain electrograms (EEG), muscular electrograms, myoelectrograms, and neuro-electrograms.
- ECG electrocardiograms
- EEG brain electrograms
- muscular electrograms myoelectrograms
- myoelectrograms myoelectrograms
- neuro-electrograms neuro-electrograms
- electrogram data may be obtained from one or more of a standard 12 lead ECG, a wearable patch with one or more channels, and wearable elements including shirts, watches, bands and bracelets with conductive elements capable of recording physiologic signals.
- Electrogram data may be obtained in some examples from implanted devices such as loop recorders, pacemakers, and/or defibrillators.
- ECG data may be collected during a dialysis session.
- the ECG data may be processed in real-time to monitor changes in electrolyte levels during dialysis. For example, every 10, 15, 30, 45, or 60 seconds, updated analyte levels may be determined based on the latest ECG data available. Such information may be used to adjust the duration or intensity of dialysis sessions.
- the ECG signal may be acquired from skin worn electrodes, or from electrodes integrated into the dialysis fistula or the equipment used to access the fistula. Filters may be added to clean electrical signals by removing dialysis machine electrical noise.
- ⁇ While the term "computer-based” is applied, it is recognized that this may refer to any suitable form of computer processing, including mobile-based processing.
- the techniques disclosed herein may be implemented at least in part by a mobile computing device such as a smartphone, tablet, or notebook computer that communicates with a system of wearable or hand-held electrodes. These techniques may also be implemented in wearable ECG patches or implantable devices. These techniques permit data compression and distribution of processing among various aspects of such a system, to enable near real-time, frequent, analyte assessment in ambulatory/outpatient individuals. This may be particularly useful in dialysis patients who are at risk for abnormal analyte levels (e.g., hyperkalemia), patients with cardiac disease, and/or renal insufficiency.
- abnormal analyte levels e.g., hyperkalemia
- QRS complexes are identified as the peaks of the wavelet transform that are greater than a threshold value within a certain frequency range.
- the threshold may be adaptive and set the local maximum for a window set for the estimate R-R interval (the time between successive QRS complexes, which relates to a patient's heart rate).
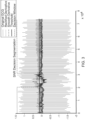
- Fig. 1 is a chart that plots an estimation of a patient's heartrate before QRS detection
- Fig. 2 is a plot of a wavelet response of the ECG to which an adaptive threshold has been applied.
- the computing system processing ECG data can detect and reject artifacts in the data that may result from factors such as external noise, noise from the patient's body, mislocated lead(s), and bad contact between the lead and surface of the patient's body.
- the ECG signal may have a relatively low signal-to-noise ratio as compared to a standard 12-lead ECG setup. Therefore, in some approaches, overly noisy data can be rejected and discarded from further use in processing the ECG data to make analyte assessments or arrhythmia predictions.
- Accelerometer data may also be used to determine when to record ECG data (e.g., choose to record ECG data while the patient motion is below a threshold level, but choose not to record while the patient motion is above a threshold level). Accelerometer data may be used in some examples to determine when the patient's body is in an appropriate position/orientation to acquire quality signals.
- the threshold may be static and pre-determined, or it may be an adaptive threshold that, for example, accounts for a limit on the amount of discarded data that is permitted to be discarded. Thus, the threshold may be lowered as the discarded data limit is raised, whereas the threshold may be raised as the discarded data limit is lowered.
- the smoothed derivative may indicate a level of noise in the signal at any given time (e.g., SNR or inverse SNR), such that when the noise level exceeds the threshold value, the corresponding segment of the ECG signal is identified as an artifact and marked for rejection from the signal.
- Fig. 4 is a plot of the original ECG signal from Fig. 3 , including a dashed-line box surrounding the portion of the ECG signal that has been marked for rejection as being overly noisy.
- accelerometer-based thresholds are used to reject data collected during periods of excessive (threshold-exceeding) mechanical motion.
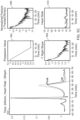
- the plots 502 each also show the algorithmically calculated T-wave peak and offset, and a tangent line that is useful in assessing analyte levels from ECG data.
- the plots 504 show true potassium levels measured in the patient's bloodstream at certain times before, during, and upon completion of the dialysis session.
- the plots 506 show normalized features, both before and after application of a Kalman filter, over time.
- the plots 508 show the t-right slope from the beats at each segment, plotted over time.
- the plots 510 show the patient's heart rate at each segmented interval, plotted over time.
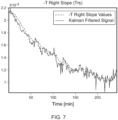
- a Kalman filter (also referred to as "linear quadratic estimation”) may be applied to smooth the ECG signal.
- Figure 7 is a graph that plots two lines, namely (1) a pre-filtered plot of T-right slope values and (2) a filtered plot of T-right slope values smoothed by application of the Kalman filter. The ultimate determination of potassium levels (or levels of other analytes, as appropriate), may be determined based on the filtered T-right slope values.
- a plot is shown of several beats from an original ECG signal.
- the original signal is superimposed with a plot of the ECG signal after processing used time principal component analysis (PCA) filtering techniques.
- PCA principal component analysis
- the ECG signal can be processed using Limited Karuhan-Loeve expansion, which can facilitate extraction of key signal components. These techniques are useful to reduce the noise in the signal.
- PCA filtering involves Eigen value decomposition and separation between strong eigenvectors known as the signal.
- key signal components that may be extracted using PCA filtering are representing beat and the main noise factor.
- PCA known as the Karuhan-Loeve Transform (KLT) can be used for noise reduction using a limited version of the original KLT column.
- the computing system may correlate different potassium levels (or levels of other analytes) with changes in the statistics of the ECT/ T wave.
- plots are shown of histograms of the T wave as an approximation of the t wave data's density function and the second moment function (autocorrelation).
- the computing system may select one or a subset of all the available leads from which ECG data is collected to analyze as the basis for determining analyte levels in a patient.
- ECG electrode patches are attached to a patient, there is often variance in the relative location of electrodes in the patch on the patient as compared to their locations on the patient in previous ECG sessions. Differences in the locations at which electrodes are placed on the patient can impact characteristics of the recorded ECG signal.
- the computing system may select data from a particular lead for analysis, and may discard data from one or more other leads.
- the lead chosen for analysis may be selected, in some implementations, based on comparison of the recorded ECG signal (or features of the recorded ECG signal) to a pre-stored signal template (or comparison to one or more feature templates).
- the data from each available ECG lead may be compared to the template(s) and a similarity score determined for the data from each lead using, for example, pattern recognition techniques.
- the data for a given lead having the highest similarity score may then be selected for further processing and analysis in the analyte assessment to the exclusion of data for the other leads.
- the signal template is generated based on QRS Complex morphology.
- Some pattern recognition techniques that may be employed in comparing the recorded ECG data to the template(s) include principal component analysis ("PCA") and spanning the function using the coefficients results in the best approximation to the QRS complex.
- PCA principal component analysis
- the computing system may assess a patient's analyte levels based on a statistical analysis of features in a processed ECG signal.
- signal averaging techniques have been described for assessing analyte levels in a patient's bloodstream.
- signal averaging techniques can involve averaging ECG data for multiple beats over a period of time to create a representative beat. The representative beat is then analyzed to determine its relevant features (e.g., T-right slope, T-peak value), and the analyte level is then determined based on the features from the averaged, representative beat.
- the computing system determines feature values (e.g., T-right slope, T-peak value, T-wave shape) for individual beats in the ECG data (rather than for an averaged beat derived from an average of multiple beats). Feature values may be calculated for every beat, or for a subset of beats over a period of time, such as if certain beats have been discarded due to the presence of excessive signal noise.
- feature values e.g., T-right slope, T-peak value, T-wave shape
- statistical techniques may be used to select the ultimate feature value(s) from which the computing system calculates the estimate of analyte levels in the patient's bloodstream for that period of time. For example, the mean or median T-right slope value of all the beats over a period of time may be discerned and applied in the analyte level calculation. Other higher-order statistics may be used in some implementations to select the ultimate feature value(s) from which the analyte levels are determined, such as variances, skewness, and kurtosis.
- the computing system performs statistical analysis on raw values of the ECG data for individual beats.
- the system can use statistical tecniques to select raw values of the ECG data that correlate with estimated analyte levels in the patient's bloodstream. For example, the mean or median of the raw ECG values for one or more beats, or portions thereof, may be computed and applied in the analyte level calculation. Other higher-order statistics may be used in some implementations to select the raw ECG value(s) from which the analyte levels are determined, such as variances, skewness, and kurtosis.
- the system combines statistical analysis on raw values of the ECG data and feature values for individual beats derived from the ECG data to select the criteria, e.g., feature value(s) or raw waveform values, from which to determine analyte levels, such as variances, skewness, and kurtosis of the feature value(s), raw waveform values, or both.
- criteria e.g., feature value(s) or raw waveform values, from which to determine analyte levels, such as variances, skewness, and kurtosis of the feature value(s), raw waveform values, or both.
- the computing system generates histograms of feature values from multiple beats over a period of time to facilitate a statistical analysis of beats from recorded ECG data.
- Fig. 10 shows three histograms 1000a, 1000b, and 1000c of T-right slope values from a patient. Each histogram indicates the T-right slope statistics at a different potassium level.
- plot 1000a is a histogram of T-right slope values at a potassium level of 4.6 Mmol/L
- plot 1000b is a histogram of T-right slope values at a potassium level of 3.6 Mmol/L
- plot 1000c is a histogram of T-right slope values at a potassium level of 3.4 Mmol/L.
- the system assigns to each beat in a set of beats characterized by ECG data a respective quality score that indicates a quality of the recorded beat, and hence a suitability of the beat for processing.
- the system may compare the quality score for each beat to a static or dynamic threshold score and, based on the comparison, take appropriate action with respect to the beat. For example, if the quality score is too low, i.e., indicates insufficient quality, then the beat may be discarded. If the beat is discarded, it may be excluded from a set of beats that are averaged to form a representative beat using averaging techniques.
- the features of the beat may be excluded from a set of beats from which features are derived and used in a statistical analysis to determine a correlation between waveform features of beats and analyte levels.
- the system can evaluate the robustness of either an averaged representative beat or waveform features that have been statistically correlated with analyte levels based on the quality scores of the beats from which the averaged representative beat or waveform features were derived.
- a representative beat or correlated waveform features that were derived from higher quality beats may be more robust than a representative beat or correlated waveform feature derived from lower quality beats.
- the quality score for a beat can, in some implementations be based on features or characteristics of the beat.
- the quality score is determined by fitting a portion of the beat's waveform from the J point to the end of the beat to a Gaussian curve. The score is then computed as the R-squared value of the fit.
- the quality score is determined as the ratio of the area of the T-wave before rectification and the area of the T-wave after rectification.
- the quality score is by comparing statistics for features of the T-wave to pre-defined patterns of T-wave features from the same species, e.g., a T-wave dictionary.
- the computing system may use linear correlation techniques, non-linear correlation techniques, or both, to compare a morphologic pattern of the T-wave to potassium values.
- Fig. 11 shows a plot in which a histogram of the T-amp feature has been fitted to both a normal probability distribution function and to a gamma probability distribution function.
- the parameters of the distribution functions may be determined, for example, using maximum-likelihood estimation. Higher-order statistics may then be performed based on the fitted distributions.
- the computing system may compensate for different body positions when calculating the level of analyte in the patient's body.
- ECG signals are often sensitive to the patient's body position (e.g., whether the patient is standing or sitting when the ECG data is recorded). Therefore, different feature values may be derived from a patient's ECG data depending on the patient's body position at the time the data was recorded.
- the computing system may store different templates for comparison against the recorded ECG data. Each of the stored templates may correspond to a particular body position and the recorded ECG data can be compared against an appropriate template for the body position.
- the computing system can transform features from a given set of ECG data to the features space in the position that the learning of the potassium curve was done.
- a patient may wear a remote monitoring ECG that includes an accelerometer.
- the potassium (or other analyte) level may be estimated using the ECGs captured at the corresponding times for each position. If the calculated potassium values for different positions are similar, then the values may be averaged and returned. On the other hand, if the potassium values differ by more than a threshold value, the measurement may be deemed invalid.
- the computing system may remove noise from a set of ECG data before statistically analyzing the features of beats represented in the ECG data.
- the computing system may perform local signal averaging.
- the local signal averaging techniques can include aligning a plurality of beats by fiducial points in a 2d-matrix and applying an image processing filter (e.g., 2d-window filter) to smooth each beat with its neighboring beats over a relatively small window in time.
- an image processing filter e.g., 2d-window filter
- a Gaussian filter may be used for the smoothing, although other types of filters are also contemplated.
- the computing system may generate image representations of beats from ECG data to facilitate visual analysis of the relations between neighboring beats.
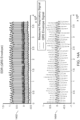
- Figures 12A and 13A each show the 2d images of a series of beats over a period of time.
- the images each include 250 rows, where each row corresponds to a different beat form a set of ECG data.
- the color / intensity of the image at each time (as indicated along the x-axis) for each beat indicates the amplitude of the ECG signal at that time.
- the distribution of colors over time for each beat represented in the image should be fairly similar. However, if the QRS complex is wider for some beats than their neighboring beats, for example, such an abnormality may be visually discernible from the image.
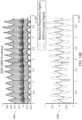
- Figures 12B and 13B are time-domain plots of a plurality of neighboring beats that have been aligned at one or more fiducial points (e.g., the peak of the QRS complex).
- Figures 12A and 12B depict representations of the ECG signals before local signal averaging was applied.
- Figures 13A and 13B depict representations of the ECG signals after applying local signal averaging.
- machine-learning techniques can be used to build a model (e.g., a feedforward neural network, a deep convolutional neural network, a support vector machine, a Gaussian mixture model, a hidden Markov model, Bayesian decision rules, logistic regression, nearest neighbor model, decision trees, or other classifier models) that estimates analyte levels for a patient based on raw or pre-processed ECG data.
- the model may be trained to classify ECG segments to different analyte levels or bins (e.g., "low,” “normal,” “high” or "3-3.5,” “3.5-4,” “4-4.5”).
- Semi-supervised learning techniques can be employed in some implementations, which use labeled training data in which each sample of training data is pre-labeled with one of the possible output/classification values (e.g., "low,” “normal,” “high” or "3-3.5,” “3.5-4,” “4-4.5”).
- Each training sample may be, for example, data representative of a segment of ECG data.
- the training samples may be pre-processed to remove noise and smooth the signal.
- the model can automatically discern patterns and features of an ECG segment that indicate the likelihood that the segment falls within of one or more classifications for a given ECG segment.
- a given ECG segment may be automatically classified into a most probable classification among the available classifications (e.g., "low,” “normal,” “high” or "3-3.5,” “3.5-4,” “4-4.5”).
- the model may classify based on features such as morphologic feature of mean beat and/or median beat, an estimated probability distribution function of the morphologic features, and classification of the ECG representation as an image.
- the computing system may process ECG data so as to substantially remove the impact of the patient's respiration on the ECG data.
- the computing system may derive the patient's respiratory pattern from the ECG using ECG derived respiratory techniques.
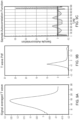
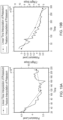
- Figures 14A and 14B show two examples of ECGs (in the top plot).
- the top envelope of the ECG signal generally include the peaks of QRS complexes across a series of beats, and the envelope generally correlates to the patient's respiratory cycle as indicated in the bottom plots of each of the figures.
- the computing system may analyze the QRS envelope from the ECG signal and take action to compensate for the impact of the respiratory cycle on the ECG signals. For example, the computing system may demodulate the envelope in some implementations before determining feature values and performing statistical analysis on the ECG signal.
- a personalized or population-based analyte estimation model may be constantly updated each time new, verified data points become available.
- the model may thus learn from new data and may evolve over time to generate predicted analyte levels based on ECG features with greater statistical confidence.
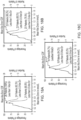
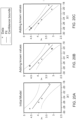
- an initial linear model is fitted to an initial set of four data points.
- the initial data points indicate measured analyte levels in the patient's bloodstream (e.g., measured by a blood test) and the T-wave right slope/Sqrt(Tamp) value from an ECG at or near the time of the analyte measurement.
- the initial model may be used by some time for a patient, but as can be seen, the statistical confidence of estimated analyte levels is relatively low (as indicated by the separation between the model and the plotted confidence bounds).
- the patient may obtain additional verified data points that map measured analyte levels to T-right slope or other waveform features.
- the additional data points can be added to the model to refine and update the model.
- plot B includes two new data points (indicated by the circled crosses), and the gap between the confidence bounds has narrowed as a result.
- a third new data point is added to the model at a later time, and the confidence bounds are shown to narrow even further.
- older data points may be removed as new ones are added to reflect potential changes in time and health status of the patient.
- a computing system may provide a graphical user interface displayed on a screen of a computing system with which a user can interact to invoke a model update procedure. For example, the user may input the measured analyte values into the computing system via the user interface.
- the computing system Upon receiving the analyte values and identifying the appropriate ECG features for the times associated with the measured analyte values, the computing system automatically determines whether to update the model based on one or more criteria. For example, the system may determine whether the measured values are outliers that fall outside of a statistically acceptable range of values. In such cases, the system may reject the new data and block the model from being updated based on the new data. If the new data is within the acceptable range, the system may update the model automatically.
- the computing system may maintain multiple models.
- the system may classify new data as being relevant to one or more of the models, and may select to update only those models for which the new data is classified as being relevant to.
- the system may maintain models for each of a plurality of patient poses or positions.
- the system may identify (e.g., via user input or based on analysis of data from an accelerometer coupled to the patient) a particular pose or position of the patient that applies to a new data point and may select to update only one or more of the models that correspond to the identified pose or position.
- a user may use a mobile computing device (e.g., a smartphone or tablet computer) having a camera to take a photograph of test results.
- Software on the mobile device or executed on a remote cloud-based server may than analyze the photograph, extract the test results, and enter the extracted results into a database that can be used for updating models.
- an ECG processing system may be configured to process signals from multiple input sources. Information derived from these signals may be combined and applied to determine an estimated level of an analyte in a patient.
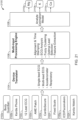
- Figure 21 depicts an example system 2100 that accepts multiple inputs to assess concentrations of analytes in a patient.
- the system 2100 is configured to perform batch or real-time processing of ECG data obtained from a set of input sources 2102a-h.
- various ECG sensing devices are deployed as input sources 2102a-h. Each of these devices is capable of generating ECG signals representative of a patient's cardiac electrical activity in different ways and in different settings.
- a patient may tend to use different ones of the devices in different settings or situations.
- a standard 12-lead ECG (2102c) may be preferable to obtain comprehensive results for evaluation of a patient in a clinical setting, but a BODY GUARDIAN (2102a) or KARDIA PHONE (2102b) may be more convenient for periodic use at home or during travel.
- a patient may alternately use different combinations of one or more available input sources to monitor cardiac and other physiologic activity.
- the system 2100 is configured to accept different combinations of signals from input sources 2102a-h and to determine estimated analyte levels based on the different combinations of signals.
- the system 2100 includes a device translator 2104, a multi-input processing engine 2106, and an analyte estimation model 2108. Each of these components 2104, 2106, and 2108 may be implemented on a system of one or more computers in one or more locations.
- the device translator 2104 prepares signals generated by the various input sources 2102a-h for processing by the multi-input processing engine 2106.
- the device translator 2104 may classify a given signal as having originated from a particular source 2102 and may classify the type of signal, e.g., as a single-lead ECG signal, a multi-lead ECG signal, an orientation or motion signal from an accelerometer or other orientation or motion sensing device, or a respiratory signal.
- input sources 2104 may be pre-registered with the system 2100 so the device translator 2104 can automatically identify the source and type of an input signal by comparing the signal, or metadata associated with the signal, to stored registration information for each of the devices.
- the device translator 2104 may also adapt signals from one or more sources for processing by the multi-input processing engine 2106.
- Signal adaptation can include normalizing signals with respect to each other and synchronizing signals in the time domain. In some implementations, further signal adaptation is performed by the multi-input processing engine 2106.
- the multi-input processing (“MIP”) engine 2106 is configured to process signals from one or more input sources 2102.
- the MIP engine 2106 may identify a requested task and determine how to process the signals based on the identified task. For example, a first set of ECG waveform features may be extracted if the task is to estimate a level of Magnesium in a patient's bloodstream, but a different second set of ECG waveform features may be extracted if the task is to estimate a level of Potassium in the patient's bloodstream.
- the MIP engine 2106 may also determine a manner of processing the input signals based on which signals are available for a given task.
- the MIP engine 2106 may align and time stamp (e.g., synchronize) the signals, combine like signals (e.g., determine a signal-averaged beat from multiple ECG signals from different sources), and extract feature values from the signals.
- the analyte estimation model 2108 is configured to generate estimations of analyte levels for one or more analytes based on data provided by MIP engine 2106.
- the model 2108 may be trained on labeled data that associates known analyte levels (e.g., measured by a blood test) with features of one or more types of input data, including input data selected from the group comprising ECG data, heartrate, body position/pose, and respiratory data.
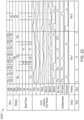
- Figure 22 shows a time-aligned plot 2200 of features from multiple types of input data that the model 2108 may process to generate estimated analyte levels for a patient.
- the validation group was composed of two sub-groups, Group 2A and Group 2B.
- Group 2A consisted of 8 patients, each of whom underwent three recorded dialysis sessions with two blood tests, one before and one immediately following dialysis.
- Group 2B consisted of 11 patients who had been previously studied so that full dialysis and digitized ECG data were available. See Dillon JJ, DeSimone CV, Sapir Y, Somers VK, Dugan JL, Bruce CJ, Ackerman MJ, Asirvatham SJ, Striemer BL, Bukartyk J: Noninvasive potassium determination using a mathematically processed ECG: Proof of concept for a novel "blood-less, blood test”. Journal of electrocardiology 48, 12-18 (2015 ). None of the data from the Group 2 patients was used to create the potassium predication algorithms described in this manuscript.
- ECG Feature Extraction The averaged, processed ECG complex was used for feature extraction for analysis. T-wave peak and T-wave end points were selected in an automated manner as described elsewhere. See Dillon JJ, DeSimone CV, Sapir Y, Somers VK, Dugan JL, Bruce CJ, Ackerman MJ, Asirvatham SJ, Striemer BL, Bukartyk J: Noninvasive potassium determination using a mathematically processed ECG: Proof of concept for a novel "blood-less, blood test”. Journal of electrocardiology 48, 12-18 (2015 ). The algorithm then automatically selected a representative section of the descending T-wave to estimate its slope (T-right slope) using the mean derivative approach. See Hamming, R. Numerical methods for scientists and engineers.
Landscapes
- Health & Medical Sciences (AREA)
- Life Sciences & Earth Sciences (AREA)
- Engineering & Computer Science (AREA)
- Physics & Mathematics (AREA)
- Medical Informatics (AREA)
- Public Health (AREA)
- Biomedical Technology (AREA)
- Pathology (AREA)
- General Health & Medical Sciences (AREA)
- Cardiology (AREA)
- Veterinary Medicine (AREA)
- Surgery (AREA)
- Animal Behavior & Ethology (AREA)
- Heart & Thoracic Surgery (AREA)
- Biophysics (AREA)
- Molecular Biology (AREA)
- Physiology (AREA)
- Optics & Photonics (AREA)
- Signal Processing (AREA)
- Artificial Intelligence (AREA)
- Hematology (AREA)
- Data Mining & Analysis (AREA)
- Epidemiology (AREA)
- Primary Health Care (AREA)
- Databases & Information Systems (AREA)
- Emergency Medicine (AREA)
- Evolutionary Computation (AREA)
- Fuzzy Systems (AREA)
- Mathematical Physics (AREA)
- Computer Vision & Pattern Recognition (AREA)
- Psychiatry (AREA)
- Pulmonology (AREA)
- Measurement And Recording Of Electrical Phenomena And Electrical Characteristics Of The Living Body (AREA)
- Measurement Of The Respiration, Hearing Ability, Form, And Blood Characteristics Of Living Organisms (AREA)
Applications Claiming Priority (4)
| Application Number | Priority Date | Filing Date | Title |
|---|---|---|---|
| US201562258956P | 2015-11-23 | 2015-11-23 | |
| US201662401044P | 2016-09-28 | 2016-09-28 | |
| EP16869280.4A EP3379998A4 (de) | 2015-11-23 | 2016-11-23 | Verarbeitung physiologischer elektrischer daten für analytische beurteilungen |
| PCT/US2016/063615 WO2017091736A1 (en) | 2015-11-23 | 2016-11-23 | Processing physiological electrical data for analyte assessments |
Related Parent Applications (1)
| Application Number | Title | Priority Date | Filing Date |
|---|---|---|---|
| EP16869280.4A Division EP3379998A4 (de) | 2015-11-23 | 2016-11-23 | Verarbeitung physiologischer elektrischer daten für analytische beurteilungen |
Publications (2)
| Publication Number | Publication Date |
|---|---|
| EP4523616A2 true EP4523616A2 (de) | 2025-03-19 |
| EP4523616A3 EP4523616A3 (de) | 2025-05-21 |
Family
ID=58763741
Family Applications (2)
| Application Number | Title | Priority Date | Filing Date |
|---|---|---|---|
| EP25154819.4A Pending EP4523616A3 (de) | 2015-11-23 | 2016-11-23 | Verarbeitung physiologischer elektrischer daten für analytische beurteilungen |
| EP16869280.4A Ceased EP3379998A4 (de) | 2015-11-23 | 2016-11-23 | Verarbeitung physiologischer elektrischer daten für analytische beurteilungen |
Family Applications After (1)
| Application Number | Title | Priority Date | Filing Date |
|---|---|---|---|
| EP16869280.4A Ceased EP3379998A4 (de) | 2015-11-23 | 2016-11-23 | Verarbeitung physiologischer elektrischer daten für analytische beurteilungen |
Country Status (5)
| Country | Link |
|---|---|
| US (1) | US20180350468A1 (de) |
| EP (2) | EP4523616A3 (de) |
| JP (1) | JP7106455B2 (de) |
| CN (1) | CN110650671A (de) |
| WO (1) | WO2017091736A1 (de) |
Families Citing this family (70)
| Publication number | Priority date | Publication date | Assignee | Title |
|---|---|---|---|---|
| US8456301B2 (en) | 2007-05-08 | 2013-06-04 | Abbott Diabetes Care Inc. | Analyte monitoring system and methods |
| US7826382B2 (en) | 2008-05-30 | 2010-11-02 | Abbott Diabetes Care Inc. | Close proximity communication device and methods |
| JP5795584B2 (ja) | 2009-08-31 | 2015-10-14 | アボット ダイアベティス ケア インコーポレイテッドAbbott Diabetes Care Inc. | 医療用装置 |
| US10852069B2 (en) | 2010-05-04 | 2020-12-01 | Fractal Heatsink Technologies, LLC | System and method for maintaining efficiency of a fractal heat sink |
| WO2018049402A1 (en) * | 2016-09-12 | 2018-03-15 | Mayo Foundation For Medical Education And Research | Ecg-based analyte assessments with adjustments for variances in patient posture |
| US11103194B2 (en) | 2016-12-14 | 2021-08-31 | Alivecor, Inc. | Systems and methods of analyte measurement analysis |
| WO2018148690A1 (en) * | 2017-02-10 | 2018-08-16 | Alivecor, Inc. | Systems and methods of analyte measurement analysis |
| CN108968976B (zh) | 2017-05-31 | 2022-09-13 | 心脏起搏器股份公司 | 具有化学传感器的植入式医疗设备 |
| WO2019023093A1 (en) * | 2017-07-26 | 2019-01-31 | Cardiac Pacemakers, Inc. | SYSTEMS AND METHODS FOR POSTURE DISAMBIGULATION |
| CN107516075B (zh) * | 2017-08-03 | 2020-10-09 | 安徽华米智能科技有限公司 | 心电信号的检测方法、装置及电子设备 |
| CN109381195B (zh) | 2017-08-10 | 2023-01-10 | 心脏起搏器股份公司 | 包括电解质传感器融合的系统和方法 |
| EP4218568A1 (de) | 2017-08-18 | 2023-08-02 | Abbott Diabetes Care Inc. | Analytüberwachungssystem, das eine gemessene elektrische eigenschaft des in-vivo-analytsensors des systems als individualisierte kalibrierungsinformation speichert |
| CN109419515B (zh) | 2017-08-23 | 2023-03-24 | 心脏起搏器股份公司 | 具有分级激活的可植入化学传感器 |
| EP3456246B1 (de) * | 2017-09-19 | 2025-03-05 | Tata Consultancy Services Limited | Kaskadierter binärer klassifizierer zur identifizierung von rhythmen in einem einadrigen elektrokardiogramm (ekg)-signal |
| CN107913062B (zh) * | 2017-10-18 | 2020-12-22 | 广州视源电子科技股份有限公司 | 一种心电信号的处理方法及系统 |
| CN107981858B (zh) | 2017-11-27 | 2020-12-01 | 上海优加利健康管理有限公司 | 基于人工智能的心电图心搏自动识别分类方法 |
| CN109864746B (zh) | 2017-12-01 | 2023-09-29 | 心脏起搏器股份公司 | 用于医学装置的多模式分析物传感器 |
| US12539087B2 (en) * | 2018-01-12 | 2026-02-03 | Mayo Foundation For Medical Education And Research | ECG-based age and sex estimation |
| US20200352440A1 (en) * | 2018-01-31 | 2020-11-12 | Zakrytoe Aktsionernoe Obschestvo "Ec-Leasing" | Medical system for remote monitoring, analysis and prognosis of the patient's condition by first-lead electrocardiogram series and computer-assisted method for monitoring, analysis and prognosis of the patient's condition |
| US11058884B2 (en) * | 2018-04-26 | 2021-07-13 | West Affum Holding Corp | Wearable medical (WM) system monitoring ECG signal of ambulatory patient for heart condition |
| WO2019211308A1 (en) | 2018-05-03 | 2019-11-07 | F. Hoffmann-La Roche Ag | Visualization of biomedical predictions |
| US10686715B2 (en) | 2018-05-09 | 2020-06-16 | Biosig Technologies, Inc. | Apparatus and methods for removing a large-signal voltage offset from a biomedical signal |
| WO2019246086A1 (en) * | 2018-06-18 | 2019-12-26 | Zoll Medical Corporation | Medical device for estimating risk of patient deterioration |
| WO2020056028A1 (en) | 2018-09-14 | 2020-03-19 | Avive Solutions, Inc. | Shockable heart rhythm classifier for defibrillators |
| JP7333811B2 (ja) | 2018-10-05 | 2023-08-25 | メドトロニック,インコーポレイテッド | 心臓頻脈性不整脈の多層予測 |
| US11478201B2 (en) * | 2018-12-21 | 2022-10-25 | Cardiac Pacemakers, Inc. | Systems and methods for monitoring physiologic changes using cardiac electrogram signals |
| US12383204B2 (en) | 2018-12-26 | 2025-08-12 | Analytics For Life Inc. | Method and system for automated quantification of signal quality |
| CN110327034B (zh) * | 2019-04-15 | 2022-07-15 | 浙江工业大学 | 一种基于深度特征融合网络的心动过速心电图的筛查方法 |
| US11285313B2 (en) * | 2019-05-02 | 2022-03-29 | Nupulsecv, Inc. | Predictive QRS detection and R-to-R timing systems and methods |
| US11723577B2 (en) | 2019-05-06 | 2023-08-15 | Medtronic, Inc. | Visualization of arrhythmia detection by machine learning |
| US11475998B2 (en) | 2019-05-06 | 2022-10-18 | Medtronic, Inc. | Data preparation for artificial intelligence-based cardiac arrhythmia detection |
| US11583687B2 (en) | 2019-05-06 | 2023-02-21 | Medtronic, Inc. | Selection of probability thresholds for generating cardiac arrhythmia notifications |
| US20200352466A1 (en) * | 2019-05-06 | 2020-11-12 | Medtronic, Inc. | Arrythmia detection with feature delineation and machine learning |
| US11694804B2 (en) | 2019-05-06 | 2023-07-04 | Medtronic, Inc. | Reduced power machine learning system for arrhythmia detection |
| US11776691B2 (en) | 2019-05-06 | 2023-10-03 | Medtronic, Inc. | Machine learning based depolarization identification and arrhythmia localization visualization |
| GB201913131D0 (en) * | 2019-05-31 | 2019-10-30 | Governing Council Of The Univ Of Toronto | System and method for filtering time-varying data for physiological signal prediction |
| GB201910657D0 (en) * | 2019-07-25 | 2019-09-11 | Univ Oxford Innovation Ltd | Deep end-to-end classification of electrocardiogram data |
| WO2021034784A1 (en) | 2019-08-16 | 2021-02-25 | Poltorak Technologies, LLC | Device and method for medical diagnostics |
| US11481675B2 (en) * | 2019-08-21 | 2022-10-25 | National Taiwan University | Identity recognition system based on compressed signals and method thereof |
| CN110400619B (zh) * | 2019-08-30 | 2023-07-21 | 上海大学 | 一种基于表面肌电信号的手功能康复训练方法 |
| CN112603327B (zh) * | 2019-12-18 | 2022-03-11 | 华为技术有限公司 | 一种心电信号的检测方法、装置、终端以及存储介质 |
| CN111310572B (zh) * | 2020-01-17 | 2023-05-05 | 上海乐普云智科技股份有限公司 | 利用心搏时间序列生成心搏标签序列的处理方法和装置 |
| TWI732489B (zh) * | 2020-03-17 | 2021-07-01 | 國防醫學院 | 應用心電圖快速偵測鉀離子異常之方法及其系統 |
| US20230165505A1 (en) * | 2020-05-06 | 2023-06-01 | Koninklijke Philips N.V. | Time series data conversion for machine learning model application |
| US12239449B2 (en) * | 2020-06-10 | 2025-03-04 | Biosense Webster (Israel) Ltd. | System and method to detect stable arrhythmia heartbeat and to calculate and detect cardiac mapping annotations |
| US20210401347A1 (en) * | 2020-06-24 | 2021-12-30 | Mayo Foundation For Medical Education And Research | Machine-learning models for ecg-based troponin level detection |
| CN116133721A (zh) | 2020-07-22 | 2023-05-16 | 美敦力公司 | 对可治疗事件的检测 |
| CN111627550B (zh) * | 2020-07-28 | 2020-12-04 | 上海慰宁健康管理咨询有限公司 | 一种健康状况在线监测系统及监测方法 |
| CN111956215A (zh) * | 2020-07-29 | 2020-11-20 | 鲁东大学 | 一种低质量心电图的qrs点的检测方法 |
| US12551145B2 (en) | 2020-10-29 | 2026-02-17 | Cardiac Pacemakers, Inc. | Integrated thermo-photonic chemical sensor |
| US20240000393A1 (en) * | 2020-11-19 | 2024-01-04 | Analog Devices International Unlimited Company | Realtime ecg signal quality estimation |
| CN112545526A (zh) * | 2020-12-10 | 2021-03-26 | 青岛大爱慈康智能医疗科技有限公司 | 一种心电信号检测方法及装置 |
| CN112545501A (zh) * | 2020-12-10 | 2021-03-26 | 徐岩 | 一种血液成分浓度检测方法及装置 |
| CN113283275B (zh) * | 2020-12-28 | 2022-04-12 | 电子科技大学 | 基于opencv的机读卡自动评分系统、方法及存储介质 |
| CN112704503B (zh) * | 2021-01-15 | 2022-08-30 | 苏州大学 | 心电信号噪声处理方法 |
| KR102769730B1 (ko) * | 2021-01-18 | 2025-02-19 | 주식회사 메디컬에이아이 | 심전도를 기반으로 하는 전해질 이상 진단 시스템 |
| CN112438735B (zh) * | 2021-01-29 | 2021-06-15 | 深圳市理邦精密仪器股份有限公司 | 一种心电图p波检测方法、分析装置以及存储介质 |
| WO2022255852A1 (ko) * | 2021-06-04 | 2022-12-08 | 연세대학교 원주산학협력단 | 심전도를 통한 고칼륨 혈증 예측 알고리즘 구축 시스템 및 이를 이용한 심전도를 통한 고칼륨 혈증 예측 알고리즘 구축 방법 및 심전도를 이용한 고칼륨 혈증 예측 시스템 |
| AU2022392814A1 (en) * | 2021-11-19 | 2024-07-04 | Medtronic, Inc. | Estimation of serum potassium and/or glomerular filtration rate from electrocardiogram for management of heart failure patients |
| CN114847967B (zh) * | 2022-04-15 | 2025-08-01 | 无锡市中健科仪有限公司 | 动态心电图遗漏qrs波批量分析方法及系统 |
| CN114847962B (zh) * | 2022-04-15 | 2025-07-04 | 无锡市中健科仪有限公司 | 一种基于最优得分策略的心电图伪差分析方法 |
| AU2023280320A1 (en) * | 2022-06-01 | 2025-01-09 | Dexcom, Inc. | Systems and methods for monitoring, diagnosis, and decision support for diabetes in patients with kidney disease |
| WO2024023927A1 (ja) * | 2022-07-26 | 2024-02-01 | 日本電信電話株式会社 | 推定装置、推定方法、推定モデル生成装置、推定モデル生成方法及びプログラム |
| WO2024069863A1 (ja) * | 2022-09-29 | 2024-04-04 | 富士通株式会社 | 算出装置、算出方法、および算出プログラム |
| CN115944293B (zh) * | 2023-03-15 | 2023-05-16 | 汶上县人民医院 | 一种基于神经网络的肾脏透析用血红蛋白水平预测系统 |
| CN116942151B (zh) * | 2023-07-25 | 2024-05-14 | 迈德医疗科技(深圳)有限公司 | 一种基于小波散射融合马尔科夫角度场的血糖检测方法 |
| US20250134441A1 (en) * | 2023-10-31 | 2025-05-01 | AccurKardia, Inc. | Systems and processes for hyperkalemia detection using lead i ecg data |
| US20250210158A1 (en) * | 2023-12-22 | 2025-06-26 | Anumana, Inc. | Methods and apparatuses for synthesizing time series data and diagnostic data |
| US12558058B2 (en) * | 2024-03-07 | 2026-02-24 | GE Precision Healthcare LLC | Real-time doppler ultrasound signal processing techniques for fetal heart rate detection with supervisory error control |
| CN120221058A (zh) * | 2025-05-28 | 2025-06-27 | 浙江中医药大学 | 基于多模态知识图谱与大语言模型的中医康复诊断系统 |
Citations (1)
| Publication number | Priority date | Publication date | Assignee | Title |
|---|---|---|---|---|
| WO2015048514A1 (en) | 2013-09-27 | 2015-04-02 | Mayo Foundation For Medical Education And Research | Analyte assessment and arrhythmia risk prediction using physiological electrical data |
Family Cites Families (25)
| Publication number | Priority date | Publication date | Assignee | Title |
|---|---|---|---|---|
| US5713367A (en) * | 1994-01-26 | 1998-02-03 | Cambridge Heart, Inc. | Measuring and assessing cardiac electrical stability |
| US7039446B2 (en) * | 2001-01-26 | 2006-05-02 | Sensys Medical, Inc. | Indirect measurement of tissue analytes through tissue properties |
| AUPR343401A0 (en) * | 2001-02-28 | 2001-03-29 | Nguyen, Hung | Modelling and design for early warning systems using physiological responses |
| US20030107487A1 (en) * | 2001-12-10 | 2003-06-12 | Ronen Korman | Method and device for measuring physiological parameters at the wrist |
| US8586932B2 (en) * | 2004-11-09 | 2013-11-19 | Spectrum Dynamics Llc | System and method for radioactive emission measurement |
| US8055331B2 (en) * | 2005-05-13 | 2011-11-08 | Cardiocore Lab, Inc. | Method and apparatus for sequenced extraction from electrocardiogramic waveforms |
| US8005543B2 (en) * | 2006-05-08 | 2011-08-23 | Cardiac Pacemakers, Inc. | Heart failure management system |
| DE102006055691A1 (de) * | 2006-11-23 | 2008-05-29 | Flore, Ingo, Dr. | Medizinische Messvorrichtung |
| SE532103C2 (sv) * | 2006-12-12 | 2009-10-27 | Knut Johansen | Metod för att bestämma hälsostatus från analyter i vätskeprover |
| US8121857B2 (en) * | 2007-02-15 | 2012-02-21 | Abbott Diabetes Care Inc. | Device and method for automatic data acquisition and/or detection |
| JP2010526646A (ja) * | 2007-05-11 | 2010-08-05 | シグメッド,インコーポレーティッド | 生理学的パラメータの非侵襲的特徴決定 |
| JP5416912B2 (ja) * | 2007-06-07 | 2014-02-12 | 株式会社東芝 | データ処理装置および医用診断装置 |
| US8140154B2 (en) * | 2007-06-13 | 2012-03-20 | Zoll Medical Corporation | Wearable medical treatment device |
| CA2716522A1 (en) * | 2008-03-05 | 2009-10-15 | Singulex, Inc. | Methods and compositions for highly sensitive detection of molecules |
| EP2158838A1 (de) * | 2008-08-29 | 2010-03-03 | Gerinova AG | Nicht invasives Verfahren zur Bewertung der Glukosewertänderung im Blut eines Menschen und Vorrichtung zur Verfahrensdurchführung |
| US9402544B2 (en) * | 2009-02-03 | 2016-08-02 | Abbott Diabetes Care Inc. | Analyte sensor and apparatus for insertion of the sensor |
| US9375171B2 (en) * | 2009-04-22 | 2016-06-28 | Rodrigo E. Teixeira | Probabilistic biomedical parameter estimation apparatus and method of operation therefor |
| BRPI0902539A2 (pt) * | 2009-07-20 | 2011-04-05 | Univ Minas Gerais | dispositivo e método para identificação de arritmias cardìacas e alterações eletrolìticas a partir da análise do eletrocardiograma |
| EP2593001B1 (de) * | 2010-07-14 | 2025-01-29 | Mayo Foundation For Medical Education And Research | Nichtinvasive überwachung physiologischer störungen |
| US9161705B2 (en) * | 2010-12-07 | 2015-10-20 | The Board Of Regents Of The University Of Texas System | Method and device for early detection of heart attack |
| US9132217B2 (en) * | 2011-04-29 | 2015-09-15 | Medtronic, Inc. | Multimodal dialysis system |
| CN104755025A (zh) * | 2012-08-29 | 2015-07-01 | 悉尼科技大学 | 用于识别高血糖的方法和设备 |
| CN202909061U (zh) * | 2012-09-11 | 2013-05-01 | 伍贵富 | 体外反搏装置 |
| US8954140B2 (en) * | 2012-09-27 | 2015-02-10 | Samsung Electronics Co., Ltd. | Method and system for determining QRS complexes in electrocardiogram signals |
| CN104983415B (zh) * | 2015-06-25 | 2017-12-15 | 石家庄翰纬医疗设备有限公司 | 心拍识别的方法及装置 |
-
2016
- 2016-11-23 WO PCT/US2016/063615 patent/WO2017091736A1/en not_active Ceased
- 2016-11-23 US US15/778,405 patent/US20180350468A1/en active Pending
- 2016-11-23 CN CN201680078812.5A patent/CN110650671A/zh active Pending
- 2016-11-23 JP JP2018546403A patent/JP7106455B2/ja active Active
- 2016-11-23 EP EP25154819.4A patent/EP4523616A3/de active Pending
- 2016-11-23 EP EP16869280.4A patent/EP3379998A4/de not_active Ceased
Patent Citations (1)
| Publication number | Priority date | Publication date | Assignee | Title |
|---|---|---|---|---|
| WO2015048514A1 (en) | 2013-09-27 | 2015-04-02 | Mayo Foundation For Medical Education And Research | Analyte assessment and arrhythmia risk prediction using physiological electrical data |
Non-Patent Citations (31)
| Title |
|---|
| ASH, S. R.SINGH, B.LAVIN, P. T.STAVROS, FRASMUSSEN, H. S: "A phase 2 study on the treatment of hyperkalemia in patients with chronic kidney disease suggests that the selective potassium trap, ZS-9, is safe and efficient", KIDNEY INT, 2015 |
| BAKRIS GLPITT BWEIR MRFREEMAN MWMAYO MRGARZA DSTASIV YZAWADZKI RBERMAN LBUSHINSKY DA: "AMETHYST-DN Investigators. Effect of patiromer on serum potassium level in patients with hyperkalemia and diabetic kidney disease: The amethyst-dn randomized clinical trial", JAMA, vol. 314, 2015, pages 151 - 161 |
| CHOE, S: "Potassium channel structures", NATURE REVIEWS NEUROSCIENCE, vol. 3, 2002, pages 115 - 121, XP002959463, DOI: 10.1038/nrn727 |
| CORSI CDEBIE JNAPOLITANO CPRIORI SMORTARA DSEVERI S: "Validation of a novel method for non-invasive blood potassium quantificationfrom the ECG", COMPUTING IN CARDIOLOGY, vol. 105, 2012, pages 108 |
| DILLON JJDESIMONE CVSAPIR YSOMERS VKDUGAN JLBRUCE CJACKERMAN MJASIRVATHAM SJSTRIEMER BLBUKARTYK J: "Noninvasive potassium determination using a mathematically processed ECG: Proof of concept for a novel ''blood-less, blood test", JOURNAL OF ELECTRO CARDIOLOGY, vol. 48, 2015, pages 12 - 18 |
| DILLON JJDESIMONE CVSAPIR YSOMERS VKDUGAN JLBRUCE CJACKERMAN MJASIRVATHAM SJSTRIEMER BLBUKARTYK J: "Noninvasive potassium determination using a mathematically processed ECG: Proof of concept for a novel ''blood-less, blood test", JOURNAL OF ELECTROCARDIOLOG, vol. 48, 2015, pages 12 - 18 |
| DILLON JJDESIMONE CVSAPIR YSOMERS VKDUGAN JLBRUCE CJACKERMAN MJASIRVATHAM SJSTRIEMER BLBUKARTYK J: "Noninvasive potassium determination using a mathematically processed ECG: Proof of concept for a novel ''blood-less, blood test", JOURNAL OF ELECTROCARDIOLOGY, vol. 48, 2015, pages 12 - 18 |
| EINHORN LMZHAN MWALKER LDMOEN MFSELIGER SLWEIR MRFINK JC: "The frequency of hyperkalemia and its significance in chronic kidney disease", ARCHIVES OF INTERNAL MEDICINE, vol. 169, 2009, pages 1156 - 1162 |
| GENNARI, F. J. HYPOKALEMIA., NEW ENGLAND JOURNAL OF MEDICINE, vol. 339, 1998, pages 451 - 458 |
| GOYAL ASPERTUS JAGOSCH K: "Serum potassium levels and mortality in acute myocardial infarction", JAMA, vol. 307, 2012, pages 157 - 164 |
| GUMZ, M. L.RABINOWITZ, LWINGO, C. S: "An Integrated View of Potassium Homeostasis", NEW ENGLAND JOURNAL OF MEDICINE, vol. 373, pages 60 - 72 |
| HAMMING, R: "Numerical methods for scientists and engineers", COURIER CORPORATION, 2012 |
| HELFENBEIN EDACKERMAN MJRAUTAHARJU PMZHOU SHGREGG RELINDAUER JMMILLER DWANG JJKRESGE SSBABAEIZADEH S: "An algorithm for QT interval monitoring in neonatal intensive care units", JOURNAL OF ELECTROCARDIOLOGY, vol. 40, 2007, pages 103 - 110 |
| INGELFINGER, J. R: "A New Era for the Treatment of Hyperkalemia", NEW ENGLAND JOURNAL OF MEDICINE, vol. 372, 2015, pages 275 - 277 |
| JAIN NKOTLA SLITTLE BBWEIDEMAN RABRILAKIS ESREILLY RFBANERJEE S: "Predictors of hyperkalemia and death in patients with cardiac and renal disease", THE AMERICAN JOURNAL OF CARDIOLOGY, vol. 109, 2012, pages 1510 - 1513, XP028421115, DOI: 10.1016/j.amjcard.2012.01.367 |
| JUURLINK DNMAMDANI MMLEE DSKOPP AAUSTIN PCLAUPACIS AREDELMEIER DA: "Rates of hyperkalemia after publication of the Randomized Aldactone Evaluation Study", NEW ENGLAND JOURNAL OF MEDICINE, vol. 351, 2004, pages 543 - 551 |
| KALMAN, R. E: "A new approach to linear filtering and prediction problems", JOURNAL OF FLUIDS ENGINEERING, vol. 82, 1960, pages 35 - 45, XP008039411 |
| KANIA MRIX HFERENIEC AIZAVALA-FERNANDEZ HJANUSEK DMROCZKA TSTIX GMANIEWSKI R: "The effect of precordial lead displacement on ECG morphology", MEDICAL & BIOLOGICAL ENGINEERING & COMPUTING, vol. 52, 2014, pages 109 - 119, XP055130067, DOI: 10.1007/s11517-013-1115-9 |
| KOSIBOROD MRASMUSSEN HSLAVIN PQUNIBI WYSPINOWITZ BPACKHAM DROGER SDYANG ALERMA E: "Singh B. Effect of sodium zirconium cyclosilicate on potassium lowering for 28 days among outpatients with hyperkalemia: The harmonize randomized clinical trial", JAA1A, vol. 312, 2014, pages 2223 - 2233 |
| KOVESDY, C. P: "Management of hyperkalaemia in chronic kidney disease", NAT REV NEPHROL, vol. 10, 2014, pages 653 - 662 |
| NGUYEN UCPOTSE MREGOLI FCAPUTO MLCONTE GMURZILLI RMUZZARELLI SMOCCETTI TCAIANI EGPRINZEN FW: "An in-silico analysis of the effect of heart position and orientation on the ECG morphology and vectorcardiogram parameters in patients with heart failure and intraventricular conduction defects", JOURNAL OF ELECTROCCARDIOLOGY, 2015 |
| PACKHAM DKRASMUSSEN HSLAVIN PTEL-SHAHAWY MAROGER SDBLOCK GQUNIBI WPERGOLA P: "Singh B: Sodium Zirconium Cyclosilicate in Hyperkalemia", NEW ENGLAND JOURNAL OF MEDICINE, vol. 372, 2015, pages 222 - 231 |
| PACKHAM DKRASMUSSEN HSLAVIN PTEL-SHAHAWY MAROGER SDBLOCK GQUNIBI WPERGOLA PSINGH B: "Sodium Zirconium Cyclosilicate in Hyperkalemia", NEW ENGLAND JOURNAL OF MEDICINE, vol. 372, 2015, pages 222 - 231, XP055413209, DOI: 10.1056/NEJMoa1411487 |
| ROGER VLGO ASLLOYD-JONES DMBENJAMIN EJBERRY JDBORDEN WBBRAVATA DMDAI SFORD ESFOX CS: "Circulation", vol. 125, 2012, AMERICAN HEART ASSOCIATION, article "Heart Disease and Stroke Statistics-2012 Update: A Report From the American Heart Association" |
| ROSCIONI, S. SHEERSPINK, H. J. L: "Clinical trials: New nonabsorbable potassium-exchange resins in hyperkalaemia", NAT REV NEPHROL, vol. 11, 2015, pages 205 - 206 |
| WEINER, I. D. & WINGO, C. S.: "Hyperkalemia: a potential silent killer", NEPHROLOGY, vol. 9, 1998, pages 1535 - 1543 |
| WEINER, I. DWINGO, C. S: "Hyperkalemia: a potential silent killer", JOLIRNAL-AMERICAN SOCIETY OFF NEPHROLOGY, vol. 9, 1998, pages 1535 - 1543 |
| WILD, S.ROGLIC, G.GREEN, ASICREE, RKING, H: "Global prevalence of diabetes estimates for the year 2000 and projections for 2030", DIABETES CARE, vol. 27, 2004, pages 1047 - 1053 |
| YAN, G.-XANTZELEVITCH, C: "Cellular basis for the normal T wave and the electrocardiographic manifestations of the long-QT syndrome", CIRCULATION, vol. 98, 1998, pages 1928 - 1936 |
| ZHANG, Q.MANRIQUEZ, A. I.MÉDIGUE, C.PAPELIER, YSORINE, M: "Biomedical Engineering", vol. 53, 2006, IEEE, article "An algorithm for robust and efficient location of T-wave ends in electrocardiograms", pages: 2544 - 2552 |
| ZIDELMAL, Z.AMIROU, A.ADNANE, MBELOUCHRANI, A: "QRS detection based on wavelet coefficients", COMPUT. METHODS PROG. BIOMED, vol. 107, 2012, pages 490 - 496, XP028928957, DOI: 10.1016/j.cmpb.2011.12.004 |
Also Published As
| Publication number | Publication date |
|---|---|
| EP3379998A1 (de) | 2018-10-03 |
| JP2018538120A (ja) | 2018-12-27 |
| CN110650671A (zh) | 2020-01-03 |
| EP4523616A3 (de) | 2025-05-21 |
| US20180350468A1 (en) | 2018-12-06 |
| EP3379998A4 (de) | 2019-07-31 |
| WO2017091736A1 (en) | 2017-06-01 |
| JP7106455B2 (ja) | 2022-07-26 |
Similar Documents
| Publication | Publication Date | Title |
|---|---|---|
| EP4523616A2 (de) | Verarbeitung physiologischer elektrischer daten für analytische beurteilungen | |
| Fürbass et al. | Automatic multimodal detection for long-term seizure documentation in epilepsy | |
| US9872652B2 (en) | Method and apparatus for heart rate monitoring using an electrocardiogram sensor | |
| US20160256063A1 (en) | Analyte assessment and arrhythmia risk prediction using physiological electrical data | |
| US9974488B2 (en) | Early detection of hemodynamic decompensation using taut-string transformation | |
| Iftikhar et al. | Multiclass classifier based cardiovascular condition detection using smartphone mechanocardiography | |
| US20190298210A1 (en) | Algorithms for managing artifact and detecting cardiac events using a patient monitoring system | |
| US12484806B2 (en) | Method and system to assess disease using multi-sensor signals | |
| Tadi et al. | Comprehensive analysis of cardiogenic vibrations for automated detection of atrial fibrillation using smartphone mechanocardiograms | |
| EP3761869B1 (de) | Prädiktion von atrialer fibrillation mit herzfrequenzvariabilität | |
| Suresh et al. | End-to-end deep learning for reliable cardiac activity monitoring using seismocardiograms | |
| Grisan et al. | A supervised learning approach for the robust detection of heart beat in plethysmographic data | |
| Lee et al. | A real-time abnormal beat detection method using a template cluster for the ECG diagnosis of IoT devices | |
| Fellah Arbi et al. | Blood glucose estimation based on ECG signal | |
| JP2020506770A (ja) | 心房細動を検出するための方法及びシステム | |
| Suguna et al. | Photoplethysmogram (PPG) signal analysis for the heart rate estimation using Shannon entropy | |
| CN117729879A (zh) | 用于确定与对象的心血管系统有关的健康信息的设备、系统和方法 | |
| KR20170004549A (ko) | 동공 크기 변화율을 이용한 심장 주파수 영역의 정보 추출 방법 및 그 장치 | |
| Momynaliev et al. | Portable health monitoring devices | |
| Balaji et al. | Revisiting derivative based methods on QRS detections from an ECG signal | |
| Lim et al. | Deep learning for suppressing EMG and motion artifacts in armband ECG R-peak detection | |
| Panni et al. | Metrological Evaluation of Wearable ECG Systems: Heart Rate Estimation and PQRST Waveform Analysis | |
| Liu et al. | The differential method of phase space matrix for AF/VF discrimination application | |
| Gutiérrez-Rivas | Real-time early detection of allergic reactions based on heart rate variability | |
| Katsoupis et al. | Pulsense: An AI-Driven Cardiovascular Monitoring and Arrhythmia Detection System |
Legal Events
| Date | Code | Title | Description |
|---|---|---|---|
| PUAI | Public reference made under article 153(3) epc to a published international application that has entered the european phase |
Free format text: ORIGINAL CODE: 0009012 |
|
| STAA | Information on the status of an ep patent application or granted ep patent |
Free format text: STATUS: REQUEST FOR EXAMINATION WAS MADE |
|
| 17P | Request for examination filed |
Effective date: 20250129 |
|
| AC | Divisional application: reference to earlier application |
Ref document number: 3379998 Country of ref document: EP Kind code of ref document: P |
|
| AK | Designated contracting states |
Kind code of ref document: A2 Designated state(s): AL AT BE BG CH CY CZ DE DK EE ES FI FR GB GR HR HU IE IS IT LI LT LU LV MC MK MT NL NO PL PT RO RS SE SI SK SM TR |
|
| REG | Reference to a national code |
Ref country code: DE Ref legal event code: R079 Free format text: PREVIOUS MAIN CLASS: A61B0005028500 Ipc: A61B0005000000 |
|
| PUAL | Search report despatched |
Free format text: ORIGINAL CODE: 0009013 |
|
| AK | Designated contracting states |
Kind code of ref document: A3 Designated state(s): AL AT BE BG CH CY CZ DE DK EE ES FI FR GB GR HR HU IE IS IT LI LT LU LV MC MK MT NL NO PL PT RO RS SE SI SK SM TR |
|
| RIC1 | Information provided on ipc code assigned before grant |
Ipc: A61B 5/0285 20060101ALI20250416BHEP Ipc: A61B 5/0245 20060101ALI20250416BHEP Ipc: A61B 5/024 20060101ALI20250416BHEP Ipc: A61B 5/0205 20060101ALI20250416BHEP Ipc: A61B 5/02 20060101ALI20250416BHEP Ipc: A61B 5/00 20060101AFI20250416BHEP |
|
| STAA | Information on the status of an ep patent application or granted ep patent |
Free format text: STATUS: EXAMINATION IS IN PROGRESS |
|
| 17Q | First examination report despatched |
Effective date: 20260203 |