EP3465202B1 - Massenspektrometrieverfahren zur detektion und quantifizierung von metaboliten - Google Patents
Massenspektrometrieverfahren zur detektion und quantifizierung von metaboliten Download PDFInfo
- Publication number
- EP3465202B1 EP3465202B1 EP17807278.1A EP17807278A EP3465202B1 EP 3465202 B1 EP3465202 B1 EP 3465202B1 EP 17807278 A EP17807278 A EP 17807278A EP 3465202 B1 EP3465202 B1 EP 3465202B1
- Authority
- EP
- European Patent Office
- Prior art keywords
- analytes
- sample
- serine
- lgpc
- mop
- Prior art date
- Legal status (The legal status is an assumption and is not a legal conclusion. Google has not performed a legal analysis and makes no representation as to the accuracy of the status listed.)
- Active
Links
- 238000000034 method Methods 0.000 title claims description 129
- 238000004949 mass spectrometry Methods 0.000 title claims description 33
- 239000002207 metabolite Substances 0.000 title description 13
- 238000001514 detection method Methods 0.000 title description 4
- 150000002500 ions Chemical class 0.000 claims description 146
- BKAJNAXTPSGJCU-UHFFFAOYSA-N 4-methyl-2-oxopentanoic acid Chemical compound CC(C)CC(=O)C(O)=O BKAJNAXTPSGJCU-UHFFFAOYSA-N 0.000 claims description 133
- WHBMMWSBFZVSSR-UHFFFAOYSA-N R3HBA Natural products CC(O)CC(O)=O WHBMMWSBFZVSSR-UHFFFAOYSA-N 0.000 claims description 125
- 239000000523 sample Substances 0.000 claims description 94
- MTCFGRXMJLQNBG-UHFFFAOYSA-N Serine Natural products OCC(N)C(O)=O MTCFGRXMJLQNBG-UHFFFAOYSA-N 0.000 claims description 81
- MTCFGRXMJLQNBG-REOHCLBHSA-N (2S)-2-Amino-3-hydroxypropansäure Chemical compound OC[C@H](N)C(O)=O MTCFGRXMJLQNBG-REOHCLBHSA-N 0.000 claims description 78
- ZQPPMHVWECSIRJ-KTKRTIGZSA-N oleic acid Chemical compound CCCCCCCC\C=C/CCCCCCCC(O)=O ZQPPMHVWECSIRJ-KTKRTIGZSA-N 0.000 claims description 63
- WRIDQFICGBMAFQ-UHFFFAOYSA-N (E)-8-Octadecenoic acid Natural products CCCCCCCCCC=CCCCCCCC(O)=O WRIDQFICGBMAFQ-UHFFFAOYSA-N 0.000 claims description 62
- LQJBNNIYVWPHFW-UHFFFAOYSA-N 20:1omega9c fatty acid Natural products CCCCCCCCCCC=CCCCCCCCC(O)=O LQJBNNIYVWPHFW-UHFFFAOYSA-N 0.000 claims description 62
- QSBYPNXLFMSGKH-UHFFFAOYSA-N 9-Heptadecensaeure Natural products CCCCCCCC=CCCCCCCCC(O)=O QSBYPNXLFMSGKH-UHFFFAOYSA-N 0.000 claims description 62
- ZQPPMHVWECSIRJ-UHFFFAOYSA-N Oleic acid Natural products CCCCCCCCC=CCCCCCCCC(O)=O ZQPPMHVWECSIRJ-UHFFFAOYSA-N 0.000 claims description 62
- 239000005642 Oleic acid Substances 0.000 claims description 62
- QXJSBBXBKPUZAA-UHFFFAOYSA-N isooleic acid Natural products CCCCCCCC=CCCCCCCCCC(O)=O QXJSBBXBKPUZAA-UHFFFAOYSA-N 0.000 claims description 62
- GHOKWGTUZJEAQD-ZETCQYMHSA-N (D)-(+)-Pantothenic acid Chemical compound OCC(C)(C)[C@@H](O)C(=O)NCCC(O)=O GHOKWGTUZJEAQD-ZETCQYMHSA-N 0.000 claims description 39
- 229940014662 pantothenate Drugs 0.000 claims description 39
- 235000019161 pantothenic acid Nutrition 0.000 claims description 39
- 239000011713 pantothenic acid Substances 0.000 claims description 39
- 238000002347 injection Methods 0.000 claims description 38
- 239000007924 injection Substances 0.000 claims description 38
- 210000002381 plasma Anatomy 0.000 claims description 25
- 238000004811 liquid chromatography Methods 0.000 claims description 18
- 210000002966 serum Anatomy 0.000 claims description 10
- ZQPPMHVWECSIRJ-IGBBIXMTSA-N (z)-octadec-9-enoic acid Chemical compound [13CH3][13CH2][13CH2][13CH2][13CH2][13CH2][13CH2][13CH2]\[13CH]=[13CH]/[13CH2][13CH2][13CH2][13CH2][13CH2][13CH2][13CH2][13C](O)=O ZQPPMHVWECSIRJ-IGBBIXMTSA-N 0.000 claims description 8
- 239000012472 biological sample Substances 0.000 claims description 5
- 210000004369 blood Anatomy 0.000 claims description 5
- 239000008280 blood Substances 0.000 claims description 5
- 238000004128 high performance liquid chromatography Methods 0.000 claims description 5
- 238000001195 ultra high performance liquid chromatography Methods 0.000 claims description 3
- WHBMMWSBFZVSSR-UHFFFAOYSA-M 3-hydroxybutyrate Chemical compound CC(O)CC([O-])=O WHBMMWSBFZVSSR-UHFFFAOYSA-M 0.000 claims 5
- AFENDNXGAFYKQO-UHFFFAOYSA-N 2-hydroxybutyric acid Chemical compound CCC(O)C(O)=O AFENDNXGAFYKQO-UHFFFAOYSA-N 0.000 claims 2
- 125000002669 linoleoyl group Chemical group O=C([*])C([H])([H])C([H])([H])C([H])([H])C([H])([H])C([H])([H])C([H])([H])C([H])([H])/C([H])=C([H])\C([H])([H])/C([H])=C([H])\C([H])([H])C([H])([H])C([H])([H])C([H])([H])C([H])([H])[H] 0.000 claims 1
- 239000012071 phase Substances 0.000 description 84
- 229960001153 serine Drugs 0.000 description 77
- WEVYAHXRMPXWCK-UHFFFAOYSA-N Acetonitrile Chemical compound CC#N WEVYAHXRMPXWCK-UHFFFAOYSA-N 0.000 description 69
- AFENDNXGAFYKQO-VKHMYHEASA-N (S)-2-hydroxybutyric acid Chemical compound CC[C@H](O)C(O)=O AFENDNXGAFYKQO-VKHMYHEASA-N 0.000 description 64
- 239000001142 4-methyl-2-oxopentanoic acid Substances 0.000 description 64
- 239000012491 analyte Substances 0.000 description 55
- 238000003908 quality control method Methods 0.000 description 48
- OKKJLVBELUTLKV-UHFFFAOYSA-N Methanol Chemical compound OC OKKJLVBELUTLKV-UHFFFAOYSA-N 0.000 description 45
- LFQSCWFLJHTTHZ-UHFFFAOYSA-N Ethanol Chemical compound CCO LFQSCWFLJHTTHZ-UHFFFAOYSA-N 0.000 description 36
- 238000002552 multiple reaction monitoring Methods 0.000 description 34
- 238000000926 separation method Methods 0.000 description 32
- BDAGIHXWWSANSR-UHFFFAOYSA-N methanoic acid Natural products OC=O BDAGIHXWWSANSR-UHFFFAOYSA-N 0.000 description 30
- LQSJUQMCZHVKES-UHFFFAOYSA-N 6-iodopyrimidin-4-amine Chemical compound NC1=CC(I)=NC=N1 LQSJUQMCZHVKES-UHFFFAOYSA-N 0.000 description 28
- 239000000243 solution Substances 0.000 description 26
- XLYOFNOQVPJJNP-UHFFFAOYSA-N water Substances O XLYOFNOQVPJJNP-UHFFFAOYSA-N 0.000 description 25
- 201000009104 prediabetes syndrome Diseases 0.000 description 23
- 238000004587 chromatography analysis Methods 0.000 description 22
- -1 LGPC Chemical compound 0.000 description 21
- 238000013467 fragmentation Methods 0.000 description 18
- 238000006062 fragmentation reaction Methods 0.000 description 18
- 230000014759 maintenance of location Effects 0.000 description 18
- 208000001072 type 2 diabetes mellitus Diseases 0.000 description 17
- OSWFIVFLDKOXQC-UHFFFAOYSA-N 4-(3-methoxyphenyl)aniline Chemical compound COC1=CC=CC(C=2C=CC(N)=CC=2)=C1 OSWFIVFLDKOXQC-UHFFFAOYSA-N 0.000 description 15
- 206010018429 Glucose tolerance impaired Diseases 0.000 description 15
- 235000019253 formic acid Nutrition 0.000 description 15
- 239000007789 gas Substances 0.000 description 15
- 239000000126 substance Substances 0.000 description 15
- 238000004885 tandem mass spectrometry Methods 0.000 description 15
- 208000001280 Prediabetic State Diseases 0.000 description 14
- 239000000090 biomarker Substances 0.000 description 14
- 238000001294 liquid chromatography-tandem mass spectrometry Methods 0.000 description 14
- 238000004458 analytical method Methods 0.000 description 12
- 239000000470 constituent Substances 0.000 description 12
- NLXLAEXVIDQMFP-UHFFFAOYSA-N Ammonia chloride Chemical compound [NH4+].[Cl-] NLXLAEXVIDQMFP-UHFFFAOYSA-N 0.000 description 11
- 206010022489 Insulin Resistance Diseases 0.000 description 11
- 102000004169 proteins and genes Human genes 0.000 description 11
- 108090000623 proteins and genes Proteins 0.000 description 11
- 238000000132 electrospray ionisation Methods 0.000 description 10
- 238000010828 elution Methods 0.000 description 10
- 239000000203 mixture Substances 0.000 description 10
- 208000002705 Glucose Intolerance Diseases 0.000 description 9
- 230000007704 transition Effects 0.000 description 9
- IJGRMHOSHXDMSA-UHFFFAOYSA-N Atomic nitrogen Chemical compound N#N IJGRMHOSHXDMSA-UHFFFAOYSA-N 0.000 description 8
- 238000001360 collision-induced dissociation Methods 0.000 description 8
- 238000001819 mass spectrum Methods 0.000 description 8
- IYXPJTWIHFLGTF-FTJOPAKQSA-N CCCCC\C=C/C\C=C/CCCCCCCC(=O)OC[C@@H](OO)COP([O-])(=O)OCC[N+](C)(C)C Chemical compound CCCCC\C=C/C\C=C/CCCCCCCC(=O)OC[C@@H](OO)COP([O-])(=O)OCC[N+](C)(C)C IYXPJTWIHFLGTF-FTJOPAKQSA-N 0.000 description 7
- 238000000605 extraction Methods 0.000 description 7
- 238000004366 reverse phase liquid chromatography Methods 0.000 description 7
- MTCFGRXMJLQNBG-YDWUFEHISA-N (2s)-2-deuterio-2-(dideuterioamino)-3-hydroxypropanoic acid Chemical compound [2H]N([2H])[C@@]([2H])(CO)C(O)=O MTCFGRXMJLQNBG-YDWUFEHISA-N 0.000 description 6
- XEKOWRVHYACXOJ-UHFFFAOYSA-N Ethyl acetate Chemical compound CCOC(C)=O XEKOWRVHYACXOJ-UHFFFAOYSA-N 0.000 description 6
- 239000000284 extract Substances 0.000 description 6
- 238000005259 measurement Methods 0.000 description 6
- 229960002969 oleic acid Drugs 0.000 description 6
- 238000011084 recovery Methods 0.000 description 6
- 238000004704 ultra performance liquid chromatography Methods 0.000 description 6
- 230000005526 G1 to G0 transition Effects 0.000 description 5
- DGAQECJNVWCQMB-PUAWFVPOSA-M Ilexoside XXIX Chemical compound C[C@@H]1CC[C@@]2(CC[C@@]3(C(=CC[C@H]4[C@]3(CC[C@@H]5[C@@]4(CC[C@@H](C5(C)C)OS(=O)(=O)[O-])C)C)[C@@H]2[C@]1(C)O)C)C(=O)O[C@H]6[C@@H]([C@H]([C@@H]([C@H](O6)CO)O)O)O.[Na+] DGAQECJNVWCQMB-PUAWFVPOSA-M 0.000 description 5
- 238000004364 calculation method Methods 0.000 description 5
- 238000011088 calibration curve Methods 0.000 description 5
- 230000003247 decreasing effect Effects 0.000 description 5
- 230000004761 fibrosis Effects 0.000 description 5
- 229910052757 nitrogen Inorganic materials 0.000 description 5
- 229910052708 sodium Inorganic materials 0.000 description 5
- 239000011734 sodium Substances 0.000 description 5
- 241000599985 Beijerinckia mobilis Species 0.000 description 4
- 206010016654 Fibrosis Diseases 0.000 description 4
- 241000282414 Homo sapiens Species 0.000 description 4
- 238000003556 assay Methods 0.000 description 4
- 238000000065 atmospheric pressure chemical ionisation Methods 0.000 description 4
- 238000005119 centrifugation Methods 0.000 description 4
- 238000004807 desolvation Methods 0.000 description 4
- 208000037265 diseases, disorders, signs and symptoms Diseases 0.000 description 4
- 208000035475 disorder Diseases 0.000 description 4
- 239000003480 eluent Substances 0.000 description 4
- 238000011067 equilibration Methods 0.000 description 4
- 238000000816 matrix-assisted laser desorption--ionisation Methods 0.000 description 4
- 238000012544 monitoring process Methods 0.000 description 4
- 239000006199 nebulizer Substances 0.000 description 4
- 208000008338 non-alcoholic fatty liver disease Diseases 0.000 description 4
- 206010053219 non-alcoholic steatohepatitis Diseases 0.000 description 4
- 238000002360 preparation method Methods 0.000 description 4
- 230000008569 process Effects 0.000 description 4
- 239000002904 solvent Substances 0.000 description 4
- 230000001629 suppression Effects 0.000 description 4
- 238000012360 testing method Methods 0.000 description 4
- WQZGKKKJIJFFOK-GASJEMHNSA-N Glucose Natural products OC[C@H]1OC(O)[C@H](O)[C@@H](O)[C@@H]1O WQZGKKKJIJFFOK-GASJEMHNSA-N 0.000 description 3
- 235000019270 ammonium chloride Nutrition 0.000 description 3
- 238000013375 chromatographic separation Methods 0.000 description 3
- 238000003745 diagnosis Methods 0.000 description 3
- 235000014113 dietary fatty acids Nutrition 0.000 description 3
- 238000001962 electrophoresis Methods 0.000 description 3
- 229930195729 fatty acid Natural products 0.000 description 3
- 239000000194 fatty acid Substances 0.000 description 3
- 150000004665 fatty acids Chemical class 0.000 description 3
- 238000007429 general method Methods 0.000 description 3
- 239000008103 glucose Substances 0.000 description 3
- 230000003993 interaction Effects 0.000 description 3
- 150000002632 lipids Chemical class 0.000 description 3
- 239000007788 liquid Substances 0.000 description 3
- 238000004895 liquid chromatography mass spectrometry Methods 0.000 description 3
- 239000000463 material Substances 0.000 description 3
- 239000000047 product Substances 0.000 description 3
- 238000012421 spiking Methods 0.000 description 3
- 239000006228 supernatant Substances 0.000 description 3
- 239000003643 water by type Substances 0.000 description 3
- MTCFGRXMJLQNBG-RBXBQAPRSA-N (2s)-2-amino-2,3,3-trideuterio-3-hydroxypropanoic acid Chemical compound [2H]C([2H])(O)[C@]([2H])(N)C(O)=O MTCFGRXMJLQNBG-RBXBQAPRSA-N 0.000 description 2
- MTCFGRXMJLQNBG-GCCOVPGMSA-N (2s)-2-amino-3-hydroxypropanoic acid Chemical compound O[13CH2][13C@H](N)[13C](O)=O MTCFGRXMJLQNBG-GCCOVPGMSA-N 0.000 description 2
- XKRFYHLGVUSROY-UHFFFAOYSA-N Argon Chemical compound [Ar] XKRFYHLGVUSROY-UHFFFAOYSA-N 0.000 description 2
- BPYKTIZUTYGOLE-IFADSCNNSA-N Bilirubin Chemical compound N1C(=O)C(C)=C(C=C)\C1=C\C1=C(C)C(CCC(O)=O)=C(CC2=C(C(C)=C(\C=C/3C(=C(C=C)C(=O)N\3)C)N2)CCC(O)=O)N1 BPYKTIZUTYGOLE-IFADSCNNSA-N 0.000 description 2
- 238000010989 Bland-Altman Methods 0.000 description 2
- 208000024172 Cardiovascular disease Diseases 0.000 description 2
- 102000001554 Hemoglobins Human genes 0.000 description 2
- 108010054147 Hemoglobins Proteins 0.000 description 2
- KFZMGEQAYNKOFK-UHFFFAOYSA-N Isopropanol Chemical compound CC(C)O KFZMGEQAYNKOFK-UHFFFAOYSA-N 0.000 description 2
- MTCFGRXMJLQNBG-VMIGTVKRSA-N N[13CH]([13CH2]O)[13C](=O)O Chemical compound N[13CH]([13CH2]O)[13C](=O)O MTCFGRXMJLQNBG-VMIGTVKRSA-N 0.000 description 2
- 239000002253 acid Substances 0.000 description 2
- BFNBIHQBYMNNAN-UHFFFAOYSA-N ammonium sulfate Chemical compound N.N.OS(O)(=O)=O BFNBIHQBYMNNAN-UHFFFAOYSA-N 0.000 description 2
- 229910052921 ammonium sulfate Inorganic materials 0.000 description 2
- 235000011130 ammonium sulphate Nutrition 0.000 description 2
- 239000012620 biological material Substances 0.000 description 2
- FAPWYRCQGJNNSJ-UBKPKTQASA-L calcium D-pantothenic acid Chemical compound [Ca+2].OCC(C)(C)[C@@H](O)C(=O)NCCC([O-])=O.OCC(C)(C)[C@@H](O)C(=O)NCCC([O-])=O FAPWYRCQGJNNSJ-UBKPKTQASA-L 0.000 description 2
- 210000004027 cell Anatomy 0.000 description 2
- 230000001413 cellular effect Effects 0.000 description 2
- 210000001175 cerebrospinal fluid Anatomy 0.000 description 2
- 230000008859 change Effects 0.000 description 2
- 239000003153 chemical reaction reagent Substances 0.000 description 2
- 230000000694 effects Effects 0.000 description 2
- 238000002474 experimental method Methods 0.000 description 2
- 238000001914 filtration Methods 0.000 description 2
- 239000012530 fluid Substances 0.000 description 2
- 238000002013 hydrophilic interaction chromatography Methods 0.000 description 2
- 230000005764 inhibitory process Effects 0.000 description 2
- 208000019423 liver disease Diseases 0.000 description 2
- 239000003550 marker Substances 0.000 description 2
- 230000007246 mechanism Effects 0.000 description 2
- 238000007410 oral glucose tolerance test Methods 0.000 description 2
- 238000012856 packing Methods 0.000 description 2
- 239000002245 particle Substances 0.000 description 2
- 230000001376 precipitating effect Effects 0.000 description 2
- 238000000611 regression analysis Methods 0.000 description 2
- 230000000717 retained effect Effects 0.000 description 2
- 230000035945 sensitivity Effects 0.000 description 2
- 238000002553 single reaction monitoring Methods 0.000 description 2
- 150000003384 small molecules Chemical class 0.000 description 2
- 239000007787 solid Substances 0.000 description 2
- 239000012086 standard solution Substances 0.000 description 2
- 210000001519 tissue Anatomy 0.000 description 2
- MTCFGRXMJLQNBG-XFJCSJJYSA-N (2s)-2-amino-3,3-dideuterio-3-hydroxypropanoic acid Chemical compound [2H]C([2H])(O)[C@H](N)C(O)=O MTCFGRXMJLQNBG-XFJCSJJYSA-N 0.000 description 1
- ZQPPMHVWECSIRJ-MSKGDGSWSA-N (Z)-11,11-dideuteriooctadec-9-enoic acid Chemical compound C(CCCCCCC\C=C/C(CCCCCCC)([2H])[2H])(=O)O ZQPPMHVWECSIRJ-MSKGDGSWSA-N 0.000 description 1
- ZQPPMHVWECSIRJ-FGFBQCSHSA-N (z)-9,10-dideuteriooctadec-9-enoic acid Chemical compound CCCCCCCCC(/[2H])=C(/[2H])CCCCCCCC(O)=O ZQPPMHVWECSIRJ-FGFBQCSHSA-N 0.000 description 1
- WHBMMWSBFZVSSR-YGABEOBRSA-N 2,2,3,4-tetradeuterio-3-hydroxybutanoic acid Chemical compound OC(C(C(=O)O)([2H])[2H])(C[2H])[2H] WHBMMWSBFZVSSR-YGABEOBRSA-N 0.000 description 1
- AFENDNXGAFYKQO-UHVFUKFASA-N 2,3,3-trideuterio-2-hydroxybutanoic acid Chemical compound [2H]C([2H])(C)C([2H])(O)C(O)=O AFENDNXGAFYKQO-UHVFUKFASA-N 0.000 description 1
- PAWQVTBBRAZDMG-UHFFFAOYSA-N 2-(3-bromo-2-fluorophenyl)acetic acid Chemical compound OC(=O)CC1=CC=CC(Br)=C1F PAWQVTBBRAZDMG-UHFFFAOYSA-N 0.000 description 1
- MTCFGRXMJLQNBG-FUDHJZNOSA-N 2-amino-2,3,3-trideuterio-3-hydroxypropanoic acid Chemical compound [2H]C([2H])(O)C([2H])(N)C(O)=O MTCFGRXMJLQNBG-FUDHJZNOSA-N 0.000 description 1
- MTCFGRXMJLQNBG-DICFDUPASA-N 2-amino-3,3-dideuterio-3-hydroxypropanoic acid Chemical compound NC(C(O)([2H])[2H])C(=O)O MTCFGRXMJLQNBG-DICFDUPASA-N 0.000 description 1
- BKAJNAXTPSGJCU-FBYXXYQPSA-N 3,3,4-trideuterio-4-methyl-2-oxopentanoic acid Chemical compound [2H]C(C)(C)C([2H])([2H])C(=O)C(O)=O BKAJNAXTPSGJCU-FBYXXYQPSA-N 0.000 description 1
- UCMIRNVEIXFBKS-JCDJMFQYSA-N 3-azanylpropanoic acid Chemical compound [15NH2][13CH2][13CH2][13C](O)=O UCMIRNVEIXFBKS-JCDJMFQYSA-N 0.000 description 1
- SJZRECIVHVDYJC-UHFFFAOYSA-M 4-hydroxybutyrate Chemical compound OCCCC([O-])=O SJZRECIVHVDYJC-UHFFFAOYSA-M 0.000 description 1
- USFZMSVCRYTOJT-UHFFFAOYSA-N Ammonium acetate Chemical compound N.CC(O)=O USFZMSVCRYTOJT-UHFFFAOYSA-N 0.000 description 1
- 239000005695 Ammonium acetate Substances 0.000 description 1
- 108091003079 Bovine Serum Albumin Proteins 0.000 description 1
- ZQPPMHVWECSIRJ-YYZNAZSBSA-N C(C(C(C(C(C(C(C(\C(=C(/C(C(C(C(C(C(C(C([2H])([2H])[2H])([2H])[2H])([2H])[2H])([2H])[2H])([2H])[2H])([2H])[2H])([2H])[2H])([2H])[2H])\[2H])\[2H])([2H])[2H])([2H])[2H])([2H])[2H])([2H])[2H])([2H])[2H])([2H])[2H])([2H])[2H])(=O)O Chemical compound C(C(C(C(C(C(C(C(\C(=C(/C(C(C(C(C(C(C(C([2H])([2H])[2H])([2H])[2H])([2H])[2H])([2H])[2H])([2H])[2H])([2H])[2H])([2H])[2H])([2H])[2H])\[2H])\[2H])([2H])[2H])([2H])[2H])([2H])[2H])([2H])[2H])([2H])[2H])([2H])[2H])([2H])[2H])(=O)O ZQPPMHVWECSIRJ-YYZNAZSBSA-N 0.000 description 1
- 241000282693 Cercopithecidae Species 0.000 description 1
- VEXZGXHMUGYJMC-UHFFFAOYSA-M Chloride anion Chemical compound [Cl-] VEXZGXHMUGYJMC-UHFFFAOYSA-M 0.000 description 1
- HTTJABKRGRZYRN-UHFFFAOYSA-N Heparin Chemical compound OC1C(NC(=O)C)C(O)OC(COS(O)(=O)=O)C1OC1C(OS(O)(=O)=O)C(O)C(OC2C(C(OS(O)(=O)=O)C(OC3C(C(O)C(O)C(O3)C(O)=O)OS(O)(=O)=O)C(CO)O2)NS(O)(=O)=O)C(C(O)=O)O1 HTTJABKRGRZYRN-UHFFFAOYSA-N 0.000 description 1
- WHXSMMKQMYFTQS-UHFFFAOYSA-N Lithium Chemical compound [Li] WHXSMMKQMYFTQS-UHFFFAOYSA-N 0.000 description 1
- 241000124008 Mammalia Species 0.000 description 1
- 241001465754 Metazoa Species 0.000 description 1
- 241000699666 Mus <mouse, genus> Species 0.000 description 1
- MOSCXNXKSOHVSQ-LCZHFHQESA-M OC(C(=O)[O-])(C(C)([2H])[2H])[2H].[Na+] Chemical compound OC(C(=O)[O-])(C(C)([2H])[2H])[2H].[Na+] MOSCXNXKSOHVSQ-LCZHFHQESA-M 0.000 description 1
- 208000008589 Obesity Diseases 0.000 description 1
- 241000283973 Oryctolagus cuniculus Species 0.000 description 1
- 239000004743 Polypropylene Substances 0.000 description 1
- 206010060862 Prostate cancer Diseases 0.000 description 1
- 208000000236 Prostatic Neoplasms Diseases 0.000 description 1
- 241000700159 Rattus Species 0.000 description 1
- 235000019257 ammonium acetate Nutrition 0.000 description 1
- 229940043376 ammonium acetate Drugs 0.000 description 1
- SWLVFNYSXGMGBS-UHFFFAOYSA-N ammonium bromide Chemical compound [NH4+].[Br-] SWLVFNYSXGMGBS-UHFFFAOYSA-N 0.000 description 1
- VZTDIZULWFCMLS-UHFFFAOYSA-N ammonium formate Chemical compound [NH4+].[O-]C=O VZTDIZULWFCMLS-UHFFFAOYSA-N 0.000 description 1
- 229910052786 argon Inorganic materials 0.000 description 1
- 239000013060 biological fluid Substances 0.000 description 1
- 230000033228 biological regulation Effects 0.000 description 1
- 229940098773 bovine serum albumin Drugs 0.000 description 1
- 229960002079 calcium pantothenate Drugs 0.000 description 1
- 208000019425 cirrhosis of liver Diseases 0.000 description 1
- 238000004440 column chromatography Methods 0.000 description 1
- 230000000295 complement effect Effects 0.000 description 1
- 150000001875 compounds Chemical class 0.000 description 1
- 230000003111 delayed effect Effects 0.000 description 1
- MTCFGRXMJLQNBG-DTZHYFPHSA-N deuterio (2s)-2,3,3-trideuterio-3-deuteriooxy-2-(dideuterioamino)propanoate Chemical compound [2H]OC(=O)[C@@]([2H])(N([2H])[2H])C([2H])([2H])O[2H] MTCFGRXMJLQNBG-DTZHYFPHSA-N 0.000 description 1
- 206010012601 diabetes mellitus Diseases 0.000 description 1
- 235000005911 diet Nutrition 0.000 description 1
- 230000037213 diet Effects 0.000 description 1
- 238000013399 early diagnosis Methods 0.000 description 1
- 238000011156 evaluation Methods 0.000 description 1
- 239000012634 fragment Substances 0.000 description 1
- 238000004817 gas chromatography Methods 0.000 description 1
- 230000002641 glycemic effect Effects 0.000 description 1
- 239000001307 helium Substances 0.000 description 1
- 229910052734 helium Inorganic materials 0.000 description 1
- SWQJXJOGLNCZEY-UHFFFAOYSA-N helium atom Chemical compound [He] SWQJXJOGLNCZEY-UHFFFAOYSA-N 0.000 description 1
- 229960002897 heparin Drugs 0.000 description 1
- 229920000669 heparin Polymers 0.000 description 1
- 238000012203 high throughput assay Methods 0.000 description 1
- 230000001771 impaired effect Effects 0.000 description 1
- 238000001802 infusion Methods 0.000 description 1
- 230000002401 inhibitory effect Effects 0.000 description 1
- 229940028435 intralipid Drugs 0.000 description 1
- 238000005040 ion trap Methods 0.000 description 1
- 238000000752 ionisation method Methods 0.000 description 1
- 229910052744 lithium Inorganic materials 0.000 description 1
- 229920002521 macromolecule Polymers 0.000 description 1
- 239000011159 matrix material Substances 0.000 description 1
- 208000030159 metabolic disease Diseases 0.000 description 1
- 238000002156 mixing Methods 0.000 description 1
- 238000002414 normal-phase solid-phase extraction Methods 0.000 description 1
- 102000039446 nucleic acids Human genes 0.000 description 1
- 108020004707 nucleic acids Proteins 0.000 description 1
- 150000007523 nucleic acids Chemical class 0.000 description 1
- 235000016709 nutrition Nutrition 0.000 description 1
- 235000020824 obesity Nutrition 0.000 description 1
- 229940049964 oleate Drugs 0.000 description 1
- 230000003647 oxidation Effects 0.000 description 1
- 238000007254 oxidation reaction Methods 0.000 description 1
- 230000036542 oxidative stress Effects 0.000 description 1
- 230000001991 pathophysiological effect Effects 0.000 description 1
- 238000000053 physical method Methods 0.000 description 1
- 229920001155 polypropylene Polymers 0.000 description 1
- 239000002243 precursor Substances 0.000 description 1
- 238000012545 processing Methods 0.000 description 1
- 238000002540 product ion scan Methods 0.000 description 1
- 230000006916 protein interaction Effects 0.000 description 1
- 230000006920 protein precipitation Effects 0.000 description 1
- 238000000746 purification Methods 0.000 description 1
- 238000011002 quantification Methods 0.000 description 1
- 238000012216 screening Methods 0.000 description 1
- NBPUSGBJDWCHKC-UHFFFAOYSA-M sodium 3-hydroxybutyrate Chemical compound [Na+].CC(O)CC([O-])=O NBPUSGBJDWCHKC-UHFFFAOYSA-M 0.000 description 1
- NBPUSGBJDWCHKC-GRONTCIHSA-M sodium;3,4,4,4-tetradeuterio-3-hydroxybutanoate Chemical compound [Na+].[2H]C([2H])([2H])C([2H])(O)CC([O-])=O NBPUSGBJDWCHKC-GRONTCIHSA-M 0.000 description 1
- IXFAZKRLPPMQEO-NIIDSAIPSA-M sodium;5,5,5-trideuterio-4-methyl-2-oxopentanoate Chemical compound [Na+].[2H]C([2H])([2H])C(C)CC(=O)C([O-])=O IXFAZKRLPPMQEO-NIIDSAIPSA-M 0.000 description 1
- 239000007790 solid phase Substances 0.000 description 1
- 239000011550 stock solution Substances 0.000 description 1
- 230000009897 systematic effect Effects 0.000 description 1
- 210000002700 urine Anatomy 0.000 description 1
- 238000010200 validation analysis Methods 0.000 description 1
Images


Classifications
-
- G—PHYSICS
- G01—MEASURING; TESTING
- G01N—INVESTIGATING OR ANALYSING MATERIALS BY DETERMINING THEIR CHEMICAL OR PHYSICAL PROPERTIES
- G01N33/00—Investigating or analysing materials by specific methods not covered by groups G01N1/00 - G01N31/00
- G01N33/48—Biological material, e.g. blood, urine; Haemocytometers
- G01N33/50—Chemical analysis of biological material, e.g. blood, urine; Testing involving biospecific ligand binding methods; Immunological testing
- G01N33/68—Chemical analysis of biological material, e.g. blood, urine; Testing involving biospecific ligand binding methods; Immunological testing involving proteins, peptides or amino acids
- G01N33/6803—General methods of protein analysis not limited to specific proteins or families of proteins
- G01N33/6806—Determination of free amino acids
- G01N33/6812—Assays for specific amino acids
-
- G—PHYSICS
- G01—MEASURING; TESTING
- G01N—INVESTIGATING OR ANALYSING MATERIALS BY DETERMINING THEIR CHEMICAL OR PHYSICAL PROPERTIES
- G01N33/00—Investigating or analysing materials by specific methods not covered by groups G01N1/00 - G01N31/00
- G01N33/48—Biological material, e.g. blood, urine; Haemocytometers
- G01N33/50—Chemical analysis of biological material, e.g. blood, urine; Testing involving biospecific ligand binding methods; Immunological testing
- G01N33/68—Chemical analysis of biological material, e.g. blood, urine; Testing involving biospecific ligand binding methods; Immunological testing involving proteins, peptides or amino acids
- G01N33/6803—General methods of protein analysis not limited to specific proteins or families of proteins
- G01N33/6848—Methods of protein analysis involving mass spectrometry
-
- G—PHYSICS
- G01—MEASURING; TESTING
- G01N—INVESTIGATING OR ANALYSING MATERIALS BY DETERMINING THEIR CHEMICAL OR PHYSICAL PROPERTIES
- G01N30/00—Investigating or analysing materials by separation into components using adsorption, absorption or similar phenomena or using ion-exchange, e.g. chromatography or field flow fractionation
- G01N30/02—Column chromatography
- G01N30/62—Detectors specially adapted therefor
- G01N30/72—Mass spectrometers
- G01N30/7233—Mass spectrometers interfaced to liquid or supercritical fluid chromatograph
-
- G—PHYSICS
- G01—MEASURING; TESTING
- G01N—INVESTIGATING OR ANALYSING MATERIALS BY DETERMINING THEIR CHEMICAL OR PHYSICAL PROPERTIES
- G01N2560/00—Chemical aspects of mass spectrometric analysis of biological material
Definitions
- Pre-diabetes is associated with obesity and high caloric diets. Pre-diabetes may progress to type 2 diabetes but, if identified early, the progression can be delayed or prevented through lifestyle change and proper nutritional management. Thus, early diagnosis and monitoring of prediabetes is crucial to curtail the type 2 diabetes epidemic.
- Pre-diabetes is defined clinically using one or more glycemic-based criteria including the levels of fasting plasma glucose (FPG), hemoglobin A1c, and 2-hour plasma glucose measurements from an Oral Glucose Tolerance Test (OGTT). However, these criteria identify only partially overlapping groups of subjects and possibly reflect different pathophysiological states leading to type 2 diabetes.
- FPG fasting plasma glucose
- OGTT Oral Glucose Tolerance Test
- Metabolite-based tests are useful for aiding the diagnosis and assessment of metabolic disorders associated with pre-diabetes and type 2 diabetes, including determination of insulin resistance (IR) and impaired glucose tolerance (IGT).
- IR insulin resistance
- ITT impaired glucose tolerance
- metabolite biomarkers 2-hydroxybutyric acid (2-HB), 3-hydroxybutyric acid (3-HB), 4-methyl-2-oxopentanoic acid (4-MOP), 1-linoleoyl-2-hydroxy-sn-glycero-3-phosphocholine (LGPC), oleic acid, pantothenate, and serine measured in blood-based samples such as in plasma or serum have proven useful biomarkers for dysglycemia and pre-diabetes.
- the amount of one or more of the metabolite biomarkers are informative for diagnosing and monitoring pre-diabetes and for classifying subjects as having impaired glucose tolerance (IGT) and/or insulin resistance (IR).
- ITT impaired glucose tolerance
- IR insulin resistance
- an individual may be diagnosed as having pre-diabetes or a pre-diabetes-related disorder.
- an individual having pre-diabetes or a pre-diabetes-related disorder may be monitored by tracking measured levels of the pre-diabetes biomarkers.
- the seven analytes may include 2-hydroxybutyric acid (2-HB), 3-hydroxybutyric acid (3-HB), 4-methyl-2-oxopentanoic acid (4-MOP), 1-linoleoyl-2-hydroxy- sn -glycero-3-phosphocholine (LGPC), oleic acid, pantothenate, and serine.
- the metabolite assays require a small sample size and can be performed using mass spectrometry analysis methods. The methods may be useful for screening and identifying patients who may have prediabetes, yet may be asymptomatic and/or have normal FPG and hemoglobin A1c results.
- the methods described herein to quantitate analytes are more efficient than current methods. Using current methods, at least two separate injections are required to measure all seven analytes. The run time for each injection is more than two minutes. Further, measuring more analytes requires additional instruments and/or additional run time if injections are performed in sequence on the same instrument.
- the methods described herein allow for measurement of two or more, three or more, four or more, five or more, six or more, or seven analytes in a single sample injection (with the understanding that a single injection is performed on a single instrument) and having a total run time of less than 4 minutes. J. Cobb et al. J. Diabetes Sci.
- WO 2014/120449 A1 discloses biomarkers relating to insulin resistance and insulin resistance-related disorders, as well as methods for using such biomarkers as biomarkers for insulin resistance, dysglycemia, type-2 diabetes, and cardiovascular disease. Also disclosed are methods for monitoring the respective disorders or conditions of a subject, and suites of small molecule entities as biomarkers for insulin resistance, dysglycemia, type-2 diabetes, and cardiovascular disease.
- WO2016/081534 A1 discloses biomarkers of NASH, NAFLD and fibrosis and methods for diagnosis (or aiding in the diagnosis) of NAFLD, NASH and/or fibrosis. Additionally disclosed are methods of distinguishing between NAFLD and NASH, methods of classifying the stage of fibrosis, methods of determining the severity of liver disease, methods of determining the severity of liver disease or fibrosis, and methods of monitoring progression/regression of NASH, NAFLD and/or fibrosis.
- Chem, 2009, 81, 6656-6667 discloses an integrated, non-targeted ultrahigh performance liquid chromatography/electrospray ionization tandem mass spectrometry platform for the identification and relative quantification of the small-molecule complement of biological systems.
- W. E. Gall et al., PLoS ONE 2010, 5, e10883 discloses hydroxybutyrate as an early marker for both insulin resistance and impaired glucose regulation. It is disclosed that the underlying biochemical mechanisms may involve increased lipid oxidation and oxidative stress.
- US 2009/0047269 A1 discloses metabolites that are differentially present in prostate cancer and methods of inhibiting the growth of a cell by altering the level of such metabolites.
- the present invention provides a method for determining the amount of two or more analytes selected from the group consisting of 2-hydroxybutyric acid (2-HB), 3-hydroxybutyric acid (3-HB), 4-methyl-2-oxopentanoic acid (4-MOP), 1-linoleoyl-2-hydroxy-sn-glycero-3-phosphocholine (LGPC), oleic acid, and serine, in a sample by mass spectrometry in a single sample injection, wherein at least one of the two or more analytes is selected from the group consisting of 2-HB, LGPC, 3-HB, 4-MOP, and oleic acid and the second of the two or more analytes is serine.
- Methods to extract the analytes from biological samples and to chromatographically separate the analytes prior to detection by mass spectrometry are also provided.
- the one or more ions from 2-HB may comprise one or more ions comprising ions with a mass to charge ratio (m/z) of about 103.1 ⁇ 0.5, 57.1 ⁇ 0.5, 35.0 ⁇ 0.5, 44.9 ⁇ 0.5, 55.0 ⁇ 0.5, or 84.9 ⁇ 0.5.
- the one or more ions from LGPC may comprise one or more ions comprising ions with a mass to charge ratio (m/z) of about 554.3 ⁇ 0.5, 279.2 ⁇ 0.5, 34.9 ⁇ 0.5, 79.0 ⁇ 0.5, 153.0 ⁇ 0.5, 167.9 ⁇ 0.5, 224.1 ⁇ 0.5, 242.0 ⁇ 0.5, or 504.4 ⁇ 0.5.
- the one or more ions from 3-HB may comprise one or more ions comprising ions with a mass to charge ratio (m/z) of about 103.1 ⁇ 0.5, 59.1 ⁇ 0.5, or 41.1 ⁇ 0.5.
- the one or more ions from 4-MOP may comprise one or more ions comprising ions with a mass to charge ratio (m/z) of about 129.0 ⁇ 0.5 or 85.1 ⁇ 0.5.
- the one or more ions from oleic acid may comprise one or more ions comprising ions with a mass to charge ratio (m/z) of about 281.3 ⁇ 0.5, 44.7 ⁇ 0.5, 61.8 ⁇ 0.5, 79.8 ⁇ 0.5, 143.1 ⁇ 0.5, 183.0 ⁇ 0.5, 194.9 ⁇ 0.5, 206.9 ⁇ 0.5, 209.0 ⁇ 0.5, 210.1 ⁇ 0.5, 223.1 ⁇ 0.5, 237.1 ⁇ 0.5, or 251.1 ⁇ 0.5.
- m/z mass to charge ratio
- the one or more ions from pantothenate may comprise one or more ions comprising ions with a mass to charge ratio (m/z) of about 218.1 ⁇ 0.5, 88.0 ⁇ 0.5, 42.0 ⁇ 0.5, 44.0 ⁇ 0.5, 45.1 ⁇ 0.5, 59.0 ⁇ 0.5, 71.0 ⁇ 0.5, 72.0 ⁇ 0.5, 98.1 ⁇ 0.5, 98.9 ⁇ 0.5, 100.9 ⁇ 0.5, 116.0 ⁇ 0.5, 129.1 ⁇ 0.5, or 146.0 ⁇ 0.5.
- m/z mass to charge ratio
- the one or more ions from serine may comprise one or more ions comprising ions with a mass to charge ratio (m/z) of about 104.0 ⁇ 0.5, 74.0 ⁇ 0.5, 40.1 ⁇ 0.5, 42.0 ⁇ 0.5, 45.0 ⁇ 0.5, 56.0 ⁇ 0.5, or 58.1 ⁇ 0.5.
- the method includes determining the amount of a plurality of analytes, such as, for example, the amount of two or more analytes, three or more analytes, four or more analytes, five or more analytes, six or more analytes or seven analytes selected from the group consisting of 2-hydroxybutyric acid (2-HB or AHB), 3-hydroxybutyric acid (3-HB), 4-methyl-2-oxopentanoic acid (4-MOP), 1-linoleoyl-2-hydroxy- sn -glycero-3-phosphocholine (LGPC), oleic acid, and serine, wherein at least one of the two or more analytes is selected from the group consisting of 2-HB, LGPC, 3-HB, 4-MOP, and oleic acid and the second of the two or more analytes is serine, in a sample by mass spectrometry using a single injection.
- Table 10 which is located herein below (after the Examples), lists possible combinations of the 7 an
- the amount of two or more analytes are determined and at least one of the two or more analytes is selected from the group consisting of 2-HB and LGPC.
- one of the two or more analytes is 2-HB and the second of the two or more analytes is serine.
- one of the two or more analytes is LGPC and a second of the two or more analytes is serine.
- the method includes determining the amount of analytes 2-HB and oleic acid and determining the amount of serine in a sample by mass spectrometry using a single injection.
- the method includes determining the amount of analytes 2-HB and 3-HB and determining the amount of serine in a sample by mass spectrometry using a single injection.
- the method includes determining the amount of analytes 2-HB and 4-MOP and determining the amount of serine in a sample by mass spectrometry using a single injection.
- the method includes determining the amount of analytes 2-HB and serine in a sample by mass spectrometry using a single injection. In some embodiments, the method includes determining the amount of one or more additional analytes selected from the group consisting of 3-HB, 4-MOP, oleic acid, pantothenate, and LGPC in a sample by mass spectrometry using a single injection.
- the method includes determining the amount of the analytes LGPC and oleic acid and determining the amount of serine in a sample by mass spectrometry using a single injection.
- the method includes determining the amount of analytes LGPC and 3-HB and determining the amount of serine in a sample by mass spectrometry using a single injection.
- the method includes determining the amount of analytes LGPC and 4-MOP and determining the amount of serine in a sample by mass spectrometry using a single injection.
- the method includes determining the amount of analytes LGPC and serine in a sample by mass spectrometry using a single injection. In some embodiments, the method includes determining the amount of one or more additional analytes selected from the group consisting of 3-HB, 4-MOP, 2-HB, pantothenate, and oleic acid in a sample by mass spectrometry using a single injection.
- the method comprises measuring the amount of a plurality of analytes having differences in polarity in a single injection using a separation step followed by MS detection.
- serine differs in polarity from 2-HB, 3-HB, 4-MOP, LGPC, and oleic acid.
- a submicron UPLC column and reversed phase chromatography conditions may be used to allow for measuring the amount of serine in combination with one or more analytes selected from the group consisting of 2-HB, 3-HB, 4-MOP, LGPC, and oleic acid, in a single injection.
- the sample may be a plasma sample or a serum sample.
- the sample may be collected using EDTA-plasma tubes or lithium heparin plasma tubes.
- the sample volume may be 10 ⁇ l to 200 ⁇ l.
- the sample volume may be 10 ⁇ l, 15, 20, 25, 30, 40, 50 ⁇ l, 60, 70, 80, 90, 100, 120, 140, 160, 180 or 200 ⁇ l or any other volume between 10 and 200 ⁇ l.
- the method comprises measuring a plurality of analytes while also obtaining separation of the critical pair 4-MOP and 3-MOP (see Figure 8A , retention time of 1.09 and 1.04 minutes, respectively).
- the method run time is less than 3 minutes.
- the method run time is about 2 minutes. In a further example, the method run time is about 2.21 minutes.
- one or more separately detectable internal standards is provided in the sample, the amount of which is also determined in the sample.
- the amount of ions generated from an analyte of interest may be related to the presence of amount of analyte of interest in the sample by comparison to one or more internal standards.
- the amount of an analyte in a sample may be determined by comparison of the amount of one or more analyte ions detected by mass spectrometry to the amount of one or more standard ions detected by mass spectrometry in an external reference standard.
- exemplary external reference standards may comprise blank plasma or serum spiked with a known amount of one or more of the above-described internal standards and/or analytes of interest.
- a counter ion may be used to achieve the desired ionization state for MS analysis.
- a counter ion may be used to change the polarity of the ionization of LGPC for MS analysis in negative ionization mode.
- Exemplary counter ions may include ammonium chloride, ammonium acetate, ammonium formate, ammonium bromide, ammonium sulfate, or ammonium nitrate. Additional, alternative counter ions may also be used.
- LGPC may be measured under positive multiple reaction monitoring (MRM) mode by implementing polarity switch on the MS instrument.
- MRM positive multiple reaction monitoring
- the concentration of formic acid in mobile phase A may be between 0.001 % and 0.1 %.
- Methods are described for measuring the amount of two or more analytes selected from the group of metabolites consisting of: 2-hydroxybutyric acid (2-HB), 3-hydroxybutyric acid (3-HB), 4-methyl-2-oxopentanoic acid (4-MOP), 1-linoleoyl-2-hydroxy-sn-glycero-3-phosphocholine (LGPC), oleic acid (oleate), and serine in a sample, wherein at least one of the two or more analytes is selected from the group consisting of 2-HB, LGPC, 3-HB, 4-MOP, and oleic acid and a second of the two or more analytes is serine.
- 2-HB 2-hydroxybutyric acid
- 3-HB 3-hydroxybutyric acid
- 4-MOP 4-methyl-2-oxopentanoic acid
- LGPC 1-linoleoyl-2-hydroxy-sn-glycero-3-phosphocholine
- oleic acid oleate
- serine serine
- Mass spectrometric methods are described for quantifying single and multiple analytes in a sample using a single injection method.
- the methods may use a liquid chromatography step such as UPLC to perform a separation (purification, enrichment) of selected analytes combined with methods of mass spectrometry, thereby providing a high-throughput assay system for quantifying a plurality of analytes in a sample that is amenable to automation.
- the methods presented herein provide advantages over current methods to measure these analytes.
- the method uses a single injection to measure one or more and up to seven analytes. Further, the method uses a single injection to measure analytes having different ionization polarities. That is, analytes that are typically measured using positive ionization mode can be measured using negative ionization mode.
- the ability to measure, in a single injection, a plurality of analytes in various combinations, including an embodiment to measure up to seven analytes reduces the time required to obtain analysis results, uses fewer resources in terms of laboratory disposables (e.g., tubes, pipette tips, reagents), laboratory instruments and human resources. These improvements lead to savings by decreasing the costs of the assays and increasing the instrument and laboratory capacity for sample analysis.
- solid phase extraction refers to a sample preparation process where components of complex mixture (i.e., mobile phase) are separated according to their physical and chemical properties using solid particle chromatographic packing material (i.e. solid phase or stationary phase).
- solid particle packing material i.e. solid phase or stationary phase.
- the solid particle packing material may be contained in a cartridge type device (e.g. a column).
- separation refers to the process of separating a complex mixture into its component molecules or metabolites.
- Common, exemplary laboratory separation techniques include electrophoresis and chromatography.
- chromatography refers to a physical method of separation in which the components (i.e., chemical constituents) to be separated are distributed between two phases, one of which is stationary (stationary phase) while the other (the mobile phase) moves in a definite direction.
- the mobile phase may be gas ("gas chromatography", “GC”) or liquid (“liquid chromatography”, “LC”). Chromatographic output data may be used in embodiments of the method described herein.
- liquid chromatography refers to a process of selective inhibition of one or more components of a fluid solution as the fluid uniformly moves through a column of a finely divided substance or through capillary passageways. The inhibition results from the distribution of the components of the mixture between one or more stationary phases and the mobile phase(s) as the mobile phase(s) move relative to the stationary phase(s).
- liquid chromatography include "Reverse phase liquid chromatography” or “RPLC”, “high performance liquid chromatography” or “HPLC”, “ultra-high performance liquid chromatography” or “UPLC” or “UHPLC”.
- retention time refers to the elapsed time in a chromatography process since the introduction of the sample into the separation device.
- the retention time of a constituent of a sample refers to the elapsed time in a chromatography process between the time of injection of the sample into the separation device and the time that the constituent of the sample elutes (e.g., exits from) the portion of the separation device that contains the stationary phase.
- retention index of a sample component refers to a number, obtained by interpolation (usually logarithmic), relating the retention time or the retention factor of the sample component to the retention times of standards eluted before and after the peak of the sample component, a mechanism that uses the separation characteristics of known standards to remove systematic error.
- separation index refers to a metric associated with chemical constituents separated by a separation technique.
- the separation index may be retention time or retention index.
- the separation index may be physical distance traveled by the chemical constituent.
- separation information and “separation data” refer to data that indicates the presence or absence of chemical constituents with respect to the separation index.
- separation data may indicate the presence of a chemical constituent having a particular mass eluting at a particular time.
- the separation data may indicate that the amount of the chemical constituent eluting over time rises, peaks, and then falls.
- a graph of the presence of the chemical constituent plotted over the separation index (e.g., time) may display a graphical peak.
- peak information and “peak data” are synonymous with the terms “separation information” and "separation data”.
- MS Mass Spectrometry
- ionizing or ionizing and fragmenting a target molecule then analyzing the ions, based on their mass/charge ratios, to produce a mass spectrum that serves as a "molecular fingerprint". Determining the mass/charge ratio of an object may be done through means of determining the wavelengths at which electromagnetic energy is absorbed by that object. There are several commonly used methods to determine the mass to charge ratio of an ion, some measuring the interaction of the ion trajectory with electromagnetic waves, others measuring the time an ion takes to travel a given distance, or a combination of both. The data from these fragment mass measurements can be searched against databases to obtain identifications of target molecules.
- operating in negative mode or “operating in negative MRM mode” or “operating in negative ionization mode” refer to those mass spectrometry methods where negative ions are generated and detected.
- operating in positive mode or “operating in positive MRM mode” or “operating in positive ionization mode” refer to those mass spectrometry methods where positive ions are generated and detected.
- mass analyzer refers to a device in a mass spectrometer that separates a mixture of ions by their mass-to-charge (“m/z”) ratios.
- m/z refers to the dimensionless quantity formed by dividing the mass number of an ion by its charge number. It has long been called the "mass-to-charge” ratio.
- the term "source” refers to a device in a mass spectrometer that ionizes a sample to be analyzed.
- ion sources include electrospray ionization (ESI), atmospheric pressure chemical ionization (APCI), heated electrospray ionization (HESI), atmospheric pressure photoionization (APPI), flame ionization detector (FID), matrix-assisted laser desorption ionization (MALDI), etc.
- detector refers to a device in a mass spectrometer that detects ions.
- the term "ion” refers to any object containing a charge, which can be formed for example by adding electrons to or removing electrons from the object.
- mass spectrum refers to a plot of data produced by a mass spectrometer, typically containing m/z values on x-axis and intensity values on y-axis.
- scan refers to a mass spectrum that is associated with a particular separation index.
- systems that use a chromatographic separation technique may generate multiple scans, each scan at a different retention time.
- run time refers to the time from sample injection to generation of the instrument data.
- the total run time includes chromatography and mass spectrometry for the sample.
- tandem MS refers to an operation in which a first MS step, called the "primary MS", is performed, followed by performance of one or more of a subsequent MS step, generically referred to as "secondary MS".
- primary MS an ion, representing one (and possibly more than one) chemical constituent, is detected and recorded during the creation of the primary mass spectrum.
- secondary MS in which the substance of interest undergoes fragmentation in order to cause the substance to break into sub-components, which are detected and recorded as a secondary mass spectrum.
- secondary MS in which the substance of interest undergoes fragmentation in order to cause the substance to break into sub-components, which are detected and recorded as a secondary mass spectrum.
- the ion of interest in the primary MS corresponds to a "parent” or precursor ion, while the ions created during the secondary MS correspond to sub-components of the parent ion and are herein referred to as "daughter” or “product” ions.
- tandem MS allows the creation of data structures that represent the parent-daughter relationship of chemical constituents in a complex mixture. This relationship may be represented by a tree-like structure illustrating the relationship of the parent and daughter ions to each other, where the daughter ions represent sub-components of the parent ion. Tandem MS may be repeated on daughter ions to determine "grand-daughter” ions, for example.
- tandem MS is not limited to two-levels of fragmentation, but is used generically to refer to multi-level MS, also referred to as "MS n ".
- MS/MS is a synonym for "MS 2 ".
- the term "daughter ion" hereinafter refers to any ion created by a secondary or higher-order (i.e., not the primary) MS.
- the "level" of one or more biomarkers means the absolute or relative amount or concentration of the biomarker measured in the sample.
- sample or “biological sample” means biological material isolated from a subject.
- the biological sample may contain any biological material suitable for detecting the desired biomarkers, and may comprise cellular and/or non-cellular material from the subject.
- the sample can be isolated from any suitable biological fluid or tissue such as, for example, blood, blood plasma (plasma), blood serum (serum), urine, cerebral spinal fluid (CSF), or tissue.
- Subject means any animal, but is preferably a mammal, such as, for example, a human, monkey, mouse, rabbit or rat.
- Sample extracts containing analytes are prepared by isolating the analytes away from the macromolecules (e.g., proteins, nucleic acids, lipids) that may be present in the sample. Some or all analytes in a sample may be bound to proteins.
- Various methods may be used to disrupt the interaction between analyte(s) and protein prior to MS analysis.
- the analytes may be extracted from a sample to produce a liquid extract, while the proteins that may be present are precipitated and removed. Proteins may be precipitated using, for example, a solution of ethyl acetate or methanol.
- an ethyl acetate or methanol solution is added to the sample, then the mixture may be spun in a centrifuge to separate the liquid supernatant, which contains the extracted analytes, from the precipitated proteins
- analytes may be released from protein without precipitating the protein.
- a formic acid solution may be added to the sample to disrupt the interaction between protein and analyte.
- ammonium sulfate, a solution of formic acid in ethanol, or a solution of formic acid in methanol may be added to the sample to disrupt ionic interactions between protein and analyte without precipitating the protein.
- the extract may be subjected to various methods including liquid chromatography, electrophoresis, filtration, centrifugation, and affinity separation as described herein to purify or enrich the amount of the selected analyte relative to one or more other components in the sample.
- QC samples may be used.
- concentration of a given analyte(s) to be used in a QC sample may be determined based on lower limit of quantitation (LLOQ) or upper limit of quantitation (ULOQ) of the given analyte(s), as detected in a sample.
- LLOQ lower limit of quantitation
- ULOQ upper limit of quantitation
- the LLOQ may be represented by the concentration of a standard (e.g., Standard A)
- the ULOQ may be represented by the concentration of a second standard (e.g., Standard H).
- the Low QC value may be set at a concentration of about 3 X LLOQ
- the Mid QC value may be at a concentration of about 25-50% of High QC
- the High QC value may be at a concentration of about 80% of the ULOQ.
- the QC target concentration levels may be chosen based on a combination of the Analytical Measurement Range (AMR) and the frequency of sample results as measured in a set of representative samples.
- AMR Analytical Measurement Range
- the analyte extract may be subjected to one or more separation methods such as electrophoresis, filtration, centrifugation, affinity separation, or chromatography.
- the separation method may comprise liquid chromatography (LC), including, for example, ultra high performance LC (UHPLC).
- UHPLC may be conducted using a reversed phase column chromatographic system, hydrophilic interaction chromatography (HILIC), or a mixed phase column chromatographic system.
- HILIC hydrophilic interaction chromatography
- the column heater for LC may be set at a temperature of from about 25°C to about 80°C.
- the column heater may be set at about 40°C, 50°C, 60°C, 70°C, etc.
- UHPLC may be conducted using a reversed phase column chromatographic system.
- the system may comprise two or more mobile phases.
- Mobile phases may be referred to as, for example, mobile phase A, mobile phase B, mobile phase A', and mobile phase B'.
- mobile phase A may comprise formic acid, water, and NH 4 Cl
- mobile phase B may comprise methanol, acetonitrile, and NH 4 Cl.
- the concentration of formic acid in mobile phase A may range from 0.001% to 0.1%.
- the composition of mobile phase A may range from 0.01:1000:0.001 to 1.0:1000:0.01 (formic acid : water : NH 4 Cl , v/v/wt).
- mobile phase A may be prepared at a volume/volume/weight (v/v/wt) ratio of 0.025:1000:0.001.
- mobile phase B may be prepared at a v/v/wt ratio of 2000:1000:0.001.
- linear gradient elution may be used for chromatography.
- the starting conditions for linear gradient elution may include the concentration of a mobile phase (e.g., mobile phase B) and/or the flow rate of a mobile phase through the column (e.g., mobile phase B).
- the starting conditions may be optimized for the separation and/or retention of one or more analytes.
- the starting conditions for the gradient may be optimized for the separation of 3-MOP and 4-MOP by starting with no more than 5% of mobile phase B and a flow rate ranging from 300 to 800 ⁇ L/min.
- the starting conditions for the gradient may also be optimized for the retention of 2-HB and 3-HB on the column by starting with no more than 5% of mobile phase B.
- the gradient conditions may also be optimized for the separation and/or retention of analytes and may vary depending on the flow rate selected. For example, with initial conditions of 5% mobile phase B and 650 ⁇ L/min flow rate, mobile phase B may be increased to 40% in 0.8 min and then to 99% in 0.01 min and maintained for 1.09 min. Mobile phase B may revert to 5% in 0.01 min for equilibration for next sample injection. The flow rate may be changed from 650 to 800 ⁇ L/min from 1.50 to 1.55 min and then back to 650 ⁇ L/min from 2.20 to 2.21 min.
- mobile phase A may comprise perfluoropentanoic acid (PFPA) and water
- mobile phase B may comprise PFPA and acetonitrile.
- the concentration of PFPA may be from about 0.01 to about 0. 500%.
- the concentration of PFPA may be about 0.05%.
- mobile phase A may be 0.05% perfluoropentanoic acid (PFPA) in water
- mobile phase B may be 0.05% PFPA in acetonitrile.
- Linear gradient elution may be used for chromatography and may be carried out with an initial condition of 1% mobile phase B held for 0.5 min.
- the proportion of mobile phase B may then be increased to 39% in 1.1 min.
- the proportion of mobile phase B may be increased to 80% in 0.2 min and then back to 1% in 0.1 min for equilibration for the next injection.
- the flow rate may be set at 800 ⁇ L/min and the total run time may be less than 3 minutes.
- mobile phase A may comprise formic acid and water
- mobile phase B may comprise acetonitrile and methanol.
- mobile phase A may contain from about 0.001 to about 0. 100% formic acid
- mobile phase B may contain any amount of acetonitrile from 0-100%.
- the concentration of mobile phase A may be about 0.0100% formic acid in water and the concentration of mobile phase B may be about 50% acetonitrile in methanol.
- Linear gradient elution may be used for chromatography and may be carried out with initial conditions of 1% mobile phase B and a flow rate was 800 ⁇ L/min.
- Mobile phase B may be maintained at 1% at 0.5 min, increased to 16% at 2.50 min, to 46% at 3.50 min, and may then be decreased to 1.0% at 3.60 min and at 4.50 min.
- Mass spectrometry is performed using a mass spectrometer that includes an ion source for ionizing the fractionated sample and creating charged molecules for further analysis.
- Ionization of the sample may be performed by, for example, electrospray ionization (ESI).
- Other ion sources may include, for example, atmospheric pressure chemical ionization (APCI), heated electrospray ionization (HESI), atmospheric pressure photoionization (APPI), flame ionization detector (FID), or matrix-assisted laser desorption ionization (MALDI).
- APCI atmospheric pressure chemical ionization
- HESI heated electrospray ionization
- APPI atmospheric pressure photoionization
- FID flame ionization detector
- MALDI matrix-assisted laser desorption ionization
- the choice of ionization method may be determined based on a number of considerations. Exemplary considerations include the analyte to be measured, type of sample, type of detector, and
- the two or more analytes are ionized in negative mode to create two or more ions.
- the analytes 2-HB, 3-HB, 4-MOP, serine, pantothenate, oleic acid, and LGPC are ionized in negative mode.
- the analytes ionized in negative mode may be analyzed in a single sample injection.
- Mass spectrometer instrument settings may be optimized for the given method and/or for the particular mass spectrometer used.
- the instrument may use various gases, for example, nitrogen, helium, argon, or zero air.
- mass spectrometry may be performed using AB Sciex QTrap 5500 mass spectrometers.
- the instrument may be operated in negative multiple reaction monitoring (MRM) mode.
- Ionspray voltage settings may range from -4kV to -5kV; in one embodiment the voltage may be set at -4.5 kV.
- the source temperature may range from about 500 °C to 600 °C; in one embodiment the source temperature may be set at 550 °C.
- the curtain gas may range from 20 to 40 or another appropriate value; in one embodiment the curtain gas may be set at 30.
- the nebulizer and desolvation gas flow rates may range from 60 to 80 or another appropriate value; in one embodiment the flow rates may be set at 70.
- the collisionally activated dissociation (CAD) gas may range from high to low. In one embodiment the CAD may be set, for example, at low. Further exemplary MS settings are described in Table 1.
- the positively or negatively charged ions may be analyzed to determine a mass-to-charge ratio.
- exemplary suitable analyzers for determining mass-to-charge ratios include quadrupole analyzers, ion trap analyzers, and time of flight analyzers.
- the ions may be detected using, for example, a selective mode or a scanning mode.
- Exemplary scanning modes include multiple reaction monitoring (MRM) and selected reaction monitoring (SRM).
- tandem MS may be accurate-mass tandem MS.
- the accurate-mass tandem mass spectrometry may use a quadrupole time-of-flight (Q-TOF) analyzer.
- Tandem MS allows the creation of data structures that represent the parent-daughter relationship of chemical constituents in a complex mixture. This relationship may be represented by a tree-like structure illustrating the relationship of the parent and daughter ions to each other, where the daughter ions represent sub-components of the parent ion.
- a primary mass spectrum may contain five distinct ions, which may be represented as five graphical peaks.
- Each ion in the primary MS may be a parent ion.
- Each parent ion may be subjected to a secondary MS that produces a mass spectrum showing the child ions for that particular parent ion.
- the parent/daughter relationship may be extended to describe the relationship between separated components (e.g., components eluting from the chromatography state) and ions detected in the primary MS, and to the relationship between the sample to be analyzed and the separated components.
- the mass spectrometer typically provides the user with an ion scan (i.e., a relative abundance of each ion with a particular mass/charge over a given range).
- Mass spectrometry data may be related to the amount of the analyte in the original sample by a number of methods.
- a calibration standard is used to generate a standard curve (calibration curve) so that the relative abundance of a given ion may be converted into an absolute amount of the original analyte.
- the calibration standard may be an external standard and a standard curve may be generated based on ions generated from those standards to calculate the quantity of one more analytes.
- the external standard may be an unlabeled analyte.
- Internal standards may be added to calibration standards and/or test samples.
- An internal standard may be used to account for loss of analytes during sample processing in order to get a more accurate value of a measured analyte in the sample.
- the ratio of analyte peak area to internal standard peak area in the levels of the calibration standards may be used to generate a calibration curve and quantitate samples.
- One or more isotopically labeled analogs of analytes for example, 2-HB-d 3 , 3-HB-d 4 , 4-MOP-ds, serine-ds, pantothenate- 13 C 3 - 15 N, oleic acid- 13 C 18 , and LGPC-d 9 may be used as internal standards.
- Suitable internal standards include, for example, sodium D-3-HB- 13 C 4 , sodium D-3-HB-2,4- 13 C 2 , sodium D-3-HB-4,4,4-d 3 , sodium(+/-)-3-HB-2,2-d 2 , sodium (+/-)-3-HB-2,4- 13 C 2 , L-serine- 13 C 3 -d 3 - 15 N, DL-serine- 13 C 3 - 15 N, L-serine- 13 C 3 , L-serine- 13 C 3 - 15 N, DL-serine-2,3,3-d 3 , L-serine-2,3,3-d 3 - 15 N, DL-serine-3,3-d 2 , L-serine-3,3-d 2 , L-serine-d 7 , oleic acid-11,11-d 2 , oleic acid-9,10-d 2 , and oleic acid-d 33 .
- the analysis data may be sent to a computer and processed using computer software.
- peak area ratios of analyte to internal standard are fitted against the concentrations of the calibration standards using a statistical regression method for quantitation.
- the statistical regression is weighted linear least squares regression. The slope and intercept calculated using the calibration curve may be used to calculate the unknown concentrations of analytes in experimental samples.
- Mass spectrometric grade (98%) formic acid and ammonium chloride (99.5%) were obtained from Sigma-Aldrich; HPLC grade methanol and water were obtained from Fisher Scientific; and HPLC grade acetonitrile and ethanol were obtained from Acros.
- a Multi-Tube Vortexer from VWR Scientific was used for mixing. Centrifugation of plates was carried out in a Sorvall ST 40R centrifuge from Thermo Scientific with a 3617 bucket rotor. Human plasma (K2-EDTA) was obtained from Bioreclamation. Intralipid, bilirubin, bovine serum albumin (fatty acid free) and perfluoropentanoic acid (PFPA) were obtained from Sigma-Aldrich.
- L-Serine, (S)-2-hydroxybutyric acid, sodium ( ⁇ )-3-hydroxybutyrate, 4-methyl-2-oxopentanoic acid, oleic acid, and oleic acid- 13 C 18 were purchased from Sigma-Aldrich; calcium D-pantothenate was obtained from MP Biochemicals; 1-linoleoyl-2-hydroxy-sn-glycero-3-phosphocholine and 1-linoleoyl-2-hydroxy- sn -glycero-3-phosphocholine- N , N , N -trimethyl-d 9 was obtained from Avanti Polar Lipids; L-serine-2,3,3-d 3 and calcium pantothenate ( ⁇ -alanine- 13 C 3 , 15 N) was obtained from Cambridge Isotope Laboratories; sodium ( ⁇ )-2-hydroxybutyrate-2,3,3-d 3 , sodium ( ⁇ )-3-hydroxybutyrate-3,4,4,4-d 4 , and sodium 4-methyl-d 3 -2
- Sample preparation was carried out in a polypropylene 96-well plate.
- 50 ⁇ L of water was transferred to the appropriate wells.
- 50 ⁇ L of plasma was transferred to the appropriate wells.
- 40 ⁇ L of the corresponding calibration spiking solutions was added. All other samples were combined with 40 ⁇ L of acetonitrile/water/ethanol mixture (1:1:2).
- a 20 ⁇ L aliquot of working internal standard (WIS) solution was added to each well except for blanks, to which was added 20 ⁇ L of acetonitrile/water/ethanol mixture (1:1:2).
- WIS working internal standard
- the WIS solution may be comprised of one or more internal standards and may comprise one or more internal standards for each of the seven analytes described herein.
- Metabolite extraction was performed by adding a solution of 1% formic acid in methanol (200 ⁇ L) to each well. The plate was capped, vortexed for 2 minutes at room temperature, and centrifuged for 5 minutes at 3000 rpm at 4 °C. An aliquot of 150 ⁇ L of the supernatant was transferred to a new plate for LC-MS/MS analysis. To assess sample recovery, QC samples were spiked with a concentration equivalent to calibration standard D, which represents the mid QC value for the given analyte.
- the calibration standards for each analyte are presented below in Table 3 of Example 1; the calibration values for standard D are presented in the column headed "D". Stock solutions, calibration spiking solutions, and internal standard solutions were stored at 4 °C.
- the QC samples were spiked with a concentration of 5.00 ⁇ g/mL 2-HB, which was equivalent to calibration standard D.
- the QC samples were spiked with a concentration of 10.00 ⁇ g/mL 3-HB, which was equivalent to calibration standard D.
- the QC samples were spiked with a concentration of 5.00 ⁇ g/mL 4-MOP, which was equivalent to calibration standard D.
- the QC samples were spiked with a concentration of 25.0 ⁇ g/mL serine, which was equivalent to calibration standard D.
- pantothenate For pantothenate, the QC samples were spiked with a concentration of 0.100 ⁇ g/mL pantothenate, which was equivalent to calibration standard D.
- the QC samples were spiked with a concentration of 100 ⁇ g/mL oleic acid, which was equivalent to calibration standard D.
- the QC samples were spiked with a concentration of 25.00 ⁇ g/mL LGPC, which was equivalent to calibration standard D.
- a WIS solution for 2-HB-d 3 was prepared in acetonitrile/water/ethanol (1:1:2) at a concentration of 40.0 ⁇ g/mL.
- a WIS solution for 3-HB-d 4 was prepared in acetonitrile/water/ethanol (1:1:2) at a concentration of 30.0 ⁇ g/mL.
- a WIS solution for 4-MOP-d 3 was prepared in acetonitrile/water/ethanol (1:1:2) at a concentration of 20.0 ⁇ g/mL.
- a WIS solution for serine-d 3 was prepared in acetonitrile/water/ethanol (1:1:2) at a concentration of 50.0 ⁇ g/mL.
- a WIS solution for pantothenate- 13 C 3 , 15 N was prepared in acetonitrile/water/ethanol (1:1:2) at a concentration of 0.700 ⁇ g/mL.
- a WIS solution for oleic acid- 13 C 18 was prepared in acetonitrile/water/ethanol (1:1:2) at a concentration of 20.0 ⁇ g/mL.
- a WIS solution for LGPC-d 9 was prepared in acetonitrile/water/ethanol (1:1:2) at a concentration of 20.0 ⁇ g/mL.
- Agilent 1290 Infinity UHPLC systems each equipped with a binary solvent pump unit, a refrigerated autosampler (set at 4 °C), and a column heater (set at 50 °C, unless otherwise indicated) were used for liquid chromatography with a reversed phase column (Waters ACQUITY UPLC ® BEH C18, 1.7 ⁇ m, 2.1x100 mm).
- Mobile phase A was formic acid/water/NH 4 Cl (0.025:1000:0.001, v/v/wt) and mobile phase B was methanol/acetonitrile/NH 4 Cl (2000:1000:0.001, v/v/wt), unless otherwise indicated.
- Mass spectrometry was performed on the samples using AB Sciex QTrap 5500 mass spectrometers.
- the instruments were operated in negative multiple reaction monitoring (MRM) mode. Ionspray voltage was set at -4.5 kV, source temperature at 550 °C, curtain gas (e.g., nitrogen) at 30, and nebulizer and desolvation gas (e.g., nitrogen) flow rates at 70, collisionally activated dissociation (CAD) gas (e.g., nitrogen) at low.
- CAD collisionally activated dissociation
- the calibration range of each analyte was determined.
- the LLOQ represents the low end of the calibration range
- the high end of the calibration range is represented by the ULOQ.
- Eight calibrators (standards A-H) were used to cover the calibration ranges.
- the final analyte concentrations in each calibrator are listed in Table 3.
- Calibration spiking solutions were prepared in acetonitrile/water/ethanol (1:1:2) at 1.25 fold of the corresponding calibration concentrations. Table 3.
- QC levels were determined based on LLOQ and ULOQ.
- Low, mid, and high level QC samples were prepared from combination of human plasma pools of appropriate analyte concentrations with fortification of analytes as necessary.
- LLOQ samples were prepared in a fatty-acid free BSA solution (50 mg/mL in PBS) at the same concentrations as standard A in Table 3 for all analytes.
- QC samples were stored at -80 °C.
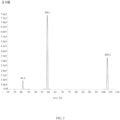
- Figures 1-7 show mass spectra resulting from fragmentation of the parent ions indicated in Table 2.
- MRM transitions that were monitored for the quantitation of 2-HB in negative ionization mode include those produced by fragmenting a parent ion having a m/z of about 103.1 ⁇ 0.5 to produce daughter ions having m/z of about 57.1 ⁇ 0.5, 35.0 ⁇ 0.5, 44.9 ⁇ 0.5, 55.0 ⁇ 0.5, 84.9 ⁇ 0.5, and 101.0 ⁇ 0.5.
- parent and daughter ion peaks generated from tandem mass spectrometric fragmentation of 2-HB are illustrated in Figure 1 .
- the daughter ion used for quantitation of 2-HB has a m/z of about 57.1 ⁇ 0.5.
- the calibration range for 2-HB was determined to be 0.500 to 40.0 ⁇ g/mL.
- MRM transitions that were monitored for the quantitation of 3-HB in negative ionization mode include those produced by fragmenting a parent ion having m/z of about 103.1 ⁇ 0.5 to produce daughter ions having m/z of about 59.1 ⁇ 0.5 and 41.1 ⁇ 0.5.
- parent and daughter ion peaks generated from tandem mass spectrometric fragmentation of 3-HB are illustrated in Figure 2 .
- the daughter ion used for quantitation of 3-HB has m/z of about 59.1 ⁇ 0.5.
- the calibration range for 3-HB was determined to be 1.00 to 80.0 ⁇ g/mL.
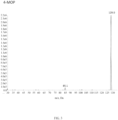
- MRM transitions that were monitored for the quantitation of 4-MOP in negative ionization mode include those produced by fragmenting a parent ion having m/z of about 129.0 ⁇ 0.5 to a daughter ion having a m/z of about 85.1 ⁇ 0.5.
- parent and daughter ion peaks generated from tandem mass spectrometric fragmentation of 4-MOP are illustrated in Figure 3 .
- the daughter ion used for quantitation of 4-MOP has a m/z of about 85.1 ⁇ 0.5.
- the calibration range for 4-MOP was determined to be 0.500 to 20.0 ⁇ g/mL.
- MRM transitions that were monitored for the quantitation of pantothenate in negative ionization mode include those produced by fragmenting a parent ion having a m/z of about 218.1 ⁇ 0.5 to produce daughter ions having m/z of about 88.0 ⁇ 0.5, 42.0 ⁇ 0.5, 44.0 ⁇ 0.5, 45.1 ⁇ 0.5, 59.0 ⁇ 0.5, 71.0 ⁇ 0.5, 72.0 ⁇ 0.5, 98.1 ⁇ 0.5, 98.9 ⁇ 0.5, 100.9 ⁇ 0.5, 116.0 ⁇ 0.5, 129.1 ⁇ 0.5, and 146.0 ⁇ 0.5.
- FIG 4 These parent and daughter ion peaks generated from tandem mass spectrometric fragmentation of pantothenate are illustrated in Figure 4 .
- the daughter ion used for quantitation of pantothenate has a m/z of about 88.0 ⁇ 0.5.
- the calibration range for pantothenate was determined to be 0.0100 to 0.800 ⁇ g/mL.
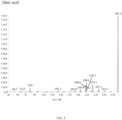
- MRM transitions that were monitored for the quantitation of oleic acid in negative ionization mode include those produced by fragmenting a parent ion having a m/z of about 281.3 ⁇ 0.5 to produce daughter ions having m/z of about 44.7 ⁇ 0.5, 61.8 ⁇ 0.5, 79.8 ⁇ 0.5, 143.1 ⁇ 0.5, 183.0 ⁇ 0.5, 194.9 ⁇ 0.5, 206.9 ⁇ 0.5, 209.0 ⁇ 0.5, 210.1 ⁇ 0.5, 223.1 ⁇ 0.5, 237.1 ⁇ 0.5, and 251.1 ⁇ 0.5.
- parent and daughter ion peaks generated from tandem mass spectrometric fragmentation of oleic acid are illustrated in Figure 5 .
- the parent to parent transition of 281.3 ⁇ 0.5 to 281.3 ⁇ 0.5 was used for quantitation of oleic acid.
- the calibration range for oleic acid was determined to be 10.0 to 400 ⁇ g/mL.
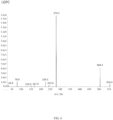
- MRM transitions that were monitored for the quantitation of LGPC in negative ionization mode include those produced by fragmenting a parent ion having a m/z of about 554.3 ⁇ 0.5 to produce daughter ions having m/z of about 279.2 ⁇ 0.5, 34.9 ⁇ 0.5, 79.0 ⁇ 0.5, 153.0 ⁇ 0.5, 167.9 ⁇ 0.5, 224.1 ⁇ 0.5, 242.0 ⁇ 0.5, and 504.4 ⁇ 0.5.
- parent and daughter ion peaks generated from tandem mass spectrometric fragmentation of LGPC are illustrated in Figure 6 . Due to the zwitterionic nature of LGPC, a counter ion was used to quantify the analyte in negative ionization mode.
- chloride was selected for use as the counter ion by including a small amount of ammonium chloride in the mobile phase and the transition of parent ion [M+Cl] - to daughter ion m/z 279 ⁇ 0.5 was selected for quantitation of LGPC.
- the calibration range for LGPC was determined to be 2.50 to 100 ⁇ g/mL.
- MRM transitions that were monitored for the quantitation of serine in negative ionization mode include those produced by fragmenting a parent ion having a m/z of about 104.0 ⁇ 0.5 to produce daughter ions having m/z of about 74.0 ⁇ 0.5, 40.1 ⁇ 0.5, 42.0 ⁇ 0.5, 45.0 ⁇ 0.5, 56.0 ⁇ 0.5, and 58.1 ⁇ 0.5.
- parent and daughter ion peaks generated from tandem mass spectrometric fragmentation of serine are illustrated in Figure 7 .
- the daughter ion used for quantitation of serine has a m/z of about 74.0 ⁇ 0.5.
- the calibration range for serine was determined to be 2.50 to 100 ⁇ g/mL.
- a plurality of daughter ions may be generated upon fragmentation of the indicated parent ions. Any one or more of these daughter ions indicated in Figures 1-7 or listed in Table 2 in the column headed "Additional Daughter Ions" may be selected to replace or augment the daughter ions used in the examples described above and in Table 2 in the column headed "Daughter Ion for Quantitation (m/z)".
- PFPA perfluoropentanoic acid
- the proportion of mobile phase B was increased to 80% (20% mobile phase A) in 0.2 min and then back to 1% (99% mobile phase A) in 0.1 min for equilibration for the next injection.
- the flow rate was 800 ⁇ L/min and the total run time was 2.21 min.
- An aliquot of 1.5 ⁇ L of the final extraction solution was injected for each sample.
- the instruments were operated in positive MRM mode with ion pairs 106.1/60.1 and 109.1/63.1 for serine and serine-d 3 , respectively.
- Ionspray voltage was set at 3.0 kV, source temperature at 550 °C, and curtain gas at 20; nebulizer and desolvation gas flow rates were set at 70, and CAD gas at high.
- Declustering potential was set at 41 V, collision energy at 45 eV, entrance potential at 10 V, and collision cell exit potential at 8 V.
- PFPA perfluoropenanoic acid
- acetonitrile 0.0500% perfluoropenanoic acid
- Linear gradient elution was carried out with an initial condition of 1% mobile phase B.
- Mobile phase B was maintained at 1% at 0.5 min, increased to 16% at 2.50 min, to 46% at 3.50 min, and was decreased to 1.0% at 3.60 min and at 4.50 min.
- the flow rate was 800 ⁇ L/min.
- the mass spectrometer was operated in positive MRM mode.
- Example 2 LC-MS/MS measurement of a plurality of analytes
- a method was developed that measured the amount of pantothenate and serine in the same injection.
- the column heater was set at 60 °C
- mobile phase A was 0.0500% perfluoropenanoic acid (PFPA) in water
- mobile phase B was 0.0500% PFPA in acetonitrile.
- Linear gradient elution was carried out with an initial condition of 1% mobile phase B.
- Mobile phase B was maintained at 1% at 0.5 min, increased to 16% at 2.50 min, to 46% at 3.50 min, and was decreased to 1.0% at 3.60 min and at 4.50 min.
- the flow rate was 800 ⁇ L/min.
- a method was developed that measured the amount of one or more, two or more, and up to all five analytes selected from 2-HB, 3-HB, 4-MOP, LGPC, and oleic acid, in a single injection with the mass spectrometer operated in positive MRM mode and negative MRM mode.
- the column heater was set at 60 °C
- mobile phase A was 0.0100% formic acid in water
- mobile phase B was acetonitrile/Methanol (1:1).
- Linear gradient elution was carried out with an initial condition of 5% mobile phase B.
- Mobile phase B was increased to 25% at 0.8 min, to 37% at 1.40 min, to 99% at 1.50 and 2.60 min, and then to 0.5% at 2.70 min.
- the flow rate was 550 ⁇ L/min.
- a single fixed aliquot of 0.5-1.0 ⁇ L of the final extraction solution was injected onto the chromatography column for each sample.
- the eluent from the chromatography column was directly and automatically introduced into the electrospray source of a mass spectrometer. Methanol was used for needle wash.
- AB Sciex QTrap 5500 mass spectrometers with Turbo V source (ESI) operated in negative MRM mode for 2-HB, 3-HB, 4-MOP, and oleic acid and in positive MRM mode for LGPC were used.
- Exemplary ions that may be monitored for the quantitation of 2-HB, 3-HB, 4-MOP, oleic acid, and LGPC are listed in Table 4.
- Another method was developed to measure the amount of one or more, two or more, and up to all five analytes selected from 2-HB, 3-HB, 4-MOP, LGPC, and oleic acid in a single injection with the mass spectrometer operated in negative MRM mode only.
- Plasma samples from 64 individuals were spiked with isotopically labeled internal standards and subjected to protein precipitation with methanol.
- an aliquot of the supernatant was injected onto an Agilent 1290/AB Sciex QTrap 5500 LC/MS/MS system equipped with a Cis reversed phase column and operated in negative MRM mode.
- the peak areas of the respective product ions were measured against the peak areas of the respective internal standard product ions.
- Exemplary ions that may be monitored for the quantitation of 2-HB, 3-HB, 4-MOP, oleic acid, and LGPC in negative MRM mode are listed in Table 2. Quantitation was performed using a weighted linear least squares regression analysis generated from fortified calibration standards prepared immediately prior to each run. The analyte levels obtained using the described method are shown in Table 5. Table 5.
- a method was developed that measured the amount of one or more, two or more, and up to all seven analytes selected from 2-HB, 3-HB, 4-MOP, LGPC, oleic acid, serine, and pantothenate, in a single injection with the mass spectrometer operated in negative MRM mode.
- Plasma samples from 73 individuals and serum samples from 30 individuals were prepared and subjected to reversed phase liquid chromatography as described above in the General Methods.
- the described reversed phase chromatography method separated a plurality of up to seven analytes with good peak shapes. Peaks for all seven analytes are shown in Figure 8A , and peaks from corresponding internal standards are shown in Figure 8B .
- MS/MS was performed on the separated samples using AB Sciex QTrap 5500 mass spectrometers.
- the instruments were operated in negative multiple reaction monitoring (MRM) mode, and the method was divided into two periods with the second period starting at 1.33 min.
- the first period detected 2-HB, 3-HB, 4-MOP, serine, and pantothenate, and the second period detected oleic acid and LGPC.
- ionspray voltage was set at -4.5 kV, source temperature at 550 °C, curtain gas at 30, and nebulizer and desolvation gas flow rates at 70, collisionally activated dissociation (CAD) gas at low.
- CAD collisionally activated dissociation
- Analyte levels were similar for plasma and serum samples. Table 6. Analyte concentrations measured (Serum samples) Analyte Concentration ( ⁇ g/ml) Sample Number 2-HB 3-HB 4-MOP LGPC oleic acid pantoth enate serine 1 6.45 11.9 4.56 6.61 61.1 0.0306 13.2 2 4.73 5.78 5.42 21.9 39.1 0.0632 12 3 2.64 0.776 3.42 14 6.63 0.0235 16.2 4 9.05 19.4 6.21 15.4 87.4 0.06 13.1 5 3.13 1.35 4.41 16 26.8 0.0484 14.4 6 3.15 1.97 3.89 19.8 27.8 0.0353 11.3 7 5.28 1.98 7.21 19.7 42.4 0.0272 11.9 8 4.52 2.56 6.45 19 32.9 0.0437 8.2 9 2.44 2.09 3.54 34.7 27.4 0.0338 13.4 10 5.61 24.4 4.04 10.2 86.2 0.144 7.2 11 7.36 25.3 4.2 21.9 94.3 0.0355 8.51 12 7.35 8.74 5.71 16.8 27.3
- the precision of the method for measuring a plurality of the seven analytes in a single injection was evaluated at three QC levels (low, mid, and high) in plasma samples. The evaluation was performed using three identical instrument systems and the precision obtained for each QC level was determined for each instrument individually and for the three instruments as a whole. Five replicates per QC level were analyzed in each run, with five runs analyzed per instrument. A total of 25 replicates per QC level were included in the inter-run CV calculations for each individual instrument and all 75 replicates included per QC level for the overall inter-run CV calculations. For overall CV calculations (all three instruments), the inter-run CVs were less than 5.8% at each QC level. The results are presented in Table 7.
- a total of 318 patient plasma samples in five batches were analyzed using the serine alone PFPA method (serine PFPA, LC-MS/MS Method 1) and the multi-analyte method. The results were compared using Bland-Altman plots as shown in Figure 9 .
- the x-axis shows the concentration of serine when measured using the serine PFPA method.
- the y-axis shows the percent difference between the multi-analyte method and serine PFPA method, calculated as (100*(multi-analyte method - Serine PFPA) / Serine PFPA).
- the difference in serine quantitation between the serine PFPA method and the multi-analyte method was less than 14%, and no sample had a serine quantitation difference greater than 22%.
- Table 10 Combinations of 2, 3, 4, 5, & 6 analytes are shown.
- the present invention encompasses combinations wherein at least one of the two or more analytes is selected from the group consisting of 2-HB, LGPC, 3-HB, 4-MOP, and oleic acid and a second of the two or more analytes is serine.
Landscapes
- Life Sciences & Earth Sciences (AREA)
- Health & Medical Sciences (AREA)
- Engineering & Computer Science (AREA)
- Molecular Biology (AREA)
- Physics & Mathematics (AREA)
- Immunology (AREA)
- Chemical & Material Sciences (AREA)
- Biomedical Technology (AREA)
- Urology & Nephrology (AREA)
- Hematology (AREA)
- General Physics & Mathematics (AREA)
- Biochemistry (AREA)
- General Health & Medical Sciences (AREA)
- Pathology (AREA)
- Analytical Chemistry (AREA)
- Bioinformatics & Computational Biology (AREA)
- Bioinformatics & Cheminformatics (AREA)
- Cell Biology (AREA)
- Food Science & Technology (AREA)
- Medicinal Chemistry (AREA)
- Microbiology (AREA)
- Biotechnology (AREA)
- Proteomics, Peptides & Aminoacids (AREA)
- Biophysics (AREA)
- Spectroscopy & Molecular Physics (AREA)
- Other Investigation Or Analysis Of Materials By Electrical Means (AREA)
Claims (13)
- Verfahren zur Bestimmung der Menge von zwei oder mehr Analyten ausgewählt aus der Gruppe bestehend aus alpha-Hydroxybutyrat (2-HB), Linoleoyl-LPC (LGPC), Ölsäure, 3-Hydroxybutyrat (3-HB), 4-Methyl-2-oxopentanoat (4-MOP) und Serin in einer Probe durch Massenspektrometrie, wobei das Verfahren umfasst:a) Unterwerfen der Probe an eine Ionisationsquelle unter Bedingungen, die geeignet sind, von jedem der zwei oder mehr Analyten ein oder mehrere durch Massenspektrometrie nachweisbare Ionen zu erzeugen, wobei die Analyten vor der Ionisation nicht derivatisiert werden;b) Messen der Menge des einen oder der mehreren Ionen von jedem der zwei oder mehr Analyten durch Massenspektrometrie; undc) Verwenden der gemessenen Menge des einen oder der mehreren Ionen, um die Menge jedes der zwei oder mehr Analyten in der Probe zu bestimmen;wobei wenigstens einer der zwei oder mehr Analyten ausgewählt ist aus der Gruppe bestehend aus 2-HB, LGPC, 3-HB, 4-MOP und Ölsäure und der zweite der zwei oder mehr Analyten Serin ist; undwobei die Menge jedes der zwei oder mehr Analyten in einer einzigen Injektion bestimmt wird undwobei das Massenspektrometer in Negativmodus betrieben wird.
- Verfahren gemäß Anspruch 1, wobei die Menge von alpha-Hydroxybutyrat (2-HB, AHB), Linoleoyl-LPC (LGPC), Ölsäure, 3-Hydroxybutyrat (3-HB), 4-Methyl-2-oxopentanoat (4-MOP), Pantothenat und Serin bestimmt wird.
- Verfahren gemäß Anspruch 1, wobei die Probe vor dem Unterwerfen an eine Ionisationsquelle durch Flüssigkeitschromatographie gereinigt worden ist.
- Verfahren gemäß Anspruch 3, wobei die Flüssigkeitschromatographie ausgewählt ist aus der Gruppe bestehend aus Hochleistungs-Flüssigkeitschromatographie, Ultrahochleistungs-Flüssigkeitschromatographie und Flüssigkeitschromatographie mit turbulenter Strömung.
- Verfahren gemäß Anspruch 1, wobei zum Bestimmen der Menge der zwei oder mehr Analyten in der Probe ein interner Standard verwendet wird.
- Verfahren gemäß Anspruch 5, wobei der interne Standard ein isotopenmarkiertes Analogon wenigstens eines der zwei oder mehr zu messenden Analyten umfasst.
- Verfahren gemäß Anspruch 6, wobei der interne Standard 2-HB-d3, 3-HB-d4, 4-MOP-d3, Serin-ds, Pantothenat-13C3-15N, Ölsäure-13C18 oder LGPC-d9 umfasst.
- Verfahren gemäß Anspruch 1, wobei die Probe eine biologische Probe umfasst.
- Verfahren gemäß Anspruch 8, wobei die Probe ausgewählt ist aus der Gruppe bestehend aus Blut, Plasma und Serum.
- Verfahren gemäß Anspruch 1, wobei einer der zwei oder mehr Analyten 2-HB ist und der zweite der zwei oder mehr Analyten Serin ist.
- Verfahren gemäß Anspruch 1, wobei einer der zwei oder mehr Analyten LGPC ist und der zweite der zwei oder mehr Analyten Serin ist.
- Verfahren gemäß Anspruch 1, wobei die Laufzeit weniger als 3 Minuten beträgt.
- Verfahren gemäß Anspruch 1, wobei die zwei oder mehr Analyten ferner Pantothenat umfassen.
Applications Claiming Priority (2)
| Application Number | Priority Date | Filing Date | Title |
|---|---|---|---|
| US201662344613P | 2016-06-02 | 2016-06-02 | |
| PCT/US2017/034605 WO2017210097A1 (en) | 2016-06-02 | 2017-05-26 | Mass spectrometry method for detection and quantitation of metabolites |
Publications (3)
| Publication Number | Publication Date |
|---|---|
| EP3465202A1 EP3465202A1 (de) | 2019-04-10 |
| EP3465202A4 EP3465202A4 (de) | 2020-02-12 |
| EP3465202B1 true EP3465202B1 (de) | 2023-07-05 |
Family
ID=60477889
Family Applications (1)
| Application Number | Title | Priority Date | Filing Date |
|---|---|---|---|
| EP17807278.1A Active EP3465202B1 (de) | 2016-06-02 | 2017-05-26 | Massenspektrometrieverfahren zur detektion und quantifizierung von metaboliten |
Country Status (8)
| Country | Link |
|---|---|
| US (1) | US11181530B2 (de) |
| EP (1) | EP3465202B1 (de) |
| CN (1) | CN109564207B (de) |
| CA (1) | CA3026049C (de) |
| DK (1) | DK3465202T3 (de) |
| ES (1) | ES2953498T3 (de) |
| MX (1) | MX2018014867A (de) |
| WO (1) | WO2017210097A1 (de) |
Families Citing this family (10)
| Publication number | Priority date | Publication date | Assignee | Title |
|---|---|---|---|---|
| CN111491629A (zh) | 2017-11-22 | 2020-08-04 | 康塞特医药品公司 | D-丝氨酸的氘化类似物及其用途 |
| WO2019135386A1 (ja) * | 2018-01-04 | 2019-07-11 | 備前化成株式会社 | 重水素化リン脂質およびその製造方法 |
| CN112136043B (zh) | 2018-04-04 | 2024-03-22 | 梅塔博隆股份有限公司 | 用于检测和定量肝功能代谢产物的质谱测定方法 |
| CN109298084A (zh) * | 2018-07-23 | 2019-02-01 | 上海市东方医院 | 用于检测血清或者血浆中油酸浓度的试剂盒及其制备方法和应用 |
| CN112739441A (zh) * | 2018-09-21 | 2021-04-30 | 沃特世科技公司 | 用于脂质定量的系统和方法 |
| CN111435132A (zh) * | 2019-01-15 | 2020-07-21 | 武汉艾迪康医学检验所有限公司 | 溶血磷脂酰胆碱检测试剂盒和检测方法 |
| WO2020242744A1 (en) * | 2019-05-31 | 2020-12-03 | Metabolon, Inc. | Mass spectrometry assay methods for detection of metabolites |
| CN111579703A (zh) * | 2020-05-18 | 2020-08-25 | 上海大学 | 基于lc-ms/ms对生物样本中胆红素的降解产物的检测分析方法 |
| US11754536B2 (en) | 2021-11-01 | 2023-09-12 | Matterworks Inc | Methods and compositions for analyte quantification |
| WO2024120994A1 (en) | 2022-12-05 | 2024-06-13 | Directsens Gmbh | Enzymatic detection of non-lactate hydroxy acids |
Family Cites Families (10)
| Publication number | Priority date | Publication date | Assignee | Title |
|---|---|---|---|---|
| US20040121305A1 (en) * | 2002-12-18 | 2004-06-24 | Wiegand Roger Charles | Generation of efficacy, toxicity and disease signatures and methods of use thereof |
| AU2008289172B2 (en) * | 2007-08-16 | 2013-01-17 | Metabolon, Inc. | Metabolomic profiling of prostate cancer |
| CN101430307B (zh) * | 2008-12-18 | 2011-07-27 | 浙江大学 | 一种同时分析氨基酸和有机酸代谢物谱的方法 |
| US8658351B2 (en) * | 2009-02-06 | 2014-02-25 | Metabolon, Inc. | Determining liver toxicity of an agent using metabolite biomarkers |
| JP5933432B2 (ja) * | 2009-06-04 | 2016-06-08 | メタノミクス ヘルス ゲーエムベーハー | 前立腺癌を診断する手段と方法 |
| CN104777314B (zh) * | 2009-08-12 | 2017-01-04 | 福满代谢组技术有限公司 | 抑郁症的生物标记物、抑郁症的生物标记物的测定方法、计算机程序及记录介质 |
| WO2014012043A1 (en) * | 2012-07-13 | 2014-01-16 | Baylor Research Institute | Urinary triaosylceramide (gb3) as a risk factor in non-fabry heart disease subjects |
| JP6404834B2 (ja) | 2013-01-31 | 2018-10-17 | メタボロン,インコーポレイテッド | インスリン抵抗性の進行に関連するバイオマーカー及びこれを使用する方法 |
| CN105021804A (zh) * | 2014-04-30 | 2015-11-04 | 湖州市中心医院 | 肺癌代谢标志物在肺癌诊断和治疗中的用途 |
| CN107002113A (zh) * | 2014-11-19 | 2017-08-01 | 梅塔博隆股份有限公司 | 脂肪肝病的生物标志物和其使用方法 |
-
2017
- 2017-05-26 CA CA3026049A patent/CA3026049C/en active Active
- 2017-05-26 US US16/305,078 patent/US11181530B2/en active Active
- 2017-05-26 ES ES17807278T patent/ES2953498T3/es active Active
- 2017-05-26 MX MX2018014867A patent/MX2018014867A/es unknown
- 2017-05-26 DK DK17807278.1T patent/DK3465202T3/da active
- 2017-05-26 WO PCT/US2017/034605 patent/WO2017210097A1/en unknown
- 2017-05-26 EP EP17807278.1A patent/EP3465202B1/de active Active
- 2017-05-26 CN CN201780047345.4A patent/CN109564207B/zh active Active
Also Published As
| Publication number | Publication date |
|---|---|
| CA3026049C (en) | 2024-04-09 |
| CA3026049A1 (en) | 2017-12-07 |
| US20200166519A1 (en) | 2020-05-28 |
| EP3465202A4 (de) | 2020-02-12 |
| CN109564207B (zh) | 2021-07-02 |
| US11181530B2 (en) | 2021-11-23 |
| EP3465202A1 (de) | 2019-04-10 |
| WO2017210097A1 (en) | 2017-12-07 |
| ES2953498T3 (es) | 2023-11-13 |
| DK3465202T3 (da) | 2023-08-21 |
| MX2018014867A (es) | 2019-03-07 |
| CN109564207A (zh) | 2019-04-02 |
Similar Documents
| Publication | Publication Date | Title |
|---|---|---|
| EP3465202B1 (de) | Massenspektrometrieverfahren zur detektion und quantifizierung von metaboliten | |
| US11061005B2 (en) | Mass spectrometry assay method for detection and quantitation of organic acid metabolites | |
| US11619636B2 (en) | Mass spectrometry assay method for detection and quantitation of kidney function metabolites | |
| Lu et al. | LC–MS-based metabonomics analysis | |
| Griffiths et al. | Mass spectrometry: from proteomics to metabolomics and lipidomics | |
| US10672600B2 (en) | Methods of detecting reverse triiodothyronine by mass spectrometry | |
| US20220050090A1 (en) | Mass spectrometry assay method for detection and quantitation of microbiota related metabolites | |
| US9177766B2 (en) | Mass spectrometric quantitation assay for metabolites of leflunomide | |
| US11536726B2 (en) | Mass spectrometry assay method for detection and quantitation of liver function metabolites | |
| Mirnaghi et al. | Challenges of analyzing different classes of metabolites by a single analytical method | |
| Lin et al. | Discovery of a biomarker for β-Thalassemia by HPLC-MS and improvement from Proton Transfer Reaction–Parallel Ion Parking | |
| Furlani et al. | Liquid chromatography-mass spectrometry for clinical metabolomics: an overview |
Legal Events
| Date | Code | Title | Description |
|---|---|---|---|
| STAA | Information on the status of an ep patent application or granted ep patent |
Free format text: STATUS: THE INTERNATIONAL PUBLICATION HAS BEEN MADE |
|
| PUAI | Public reference made under article 153(3) epc to a published international application that has entered the european phase |
Free format text: ORIGINAL CODE: 0009012 |
|
| STAA | Information on the status of an ep patent application or granted ep patent |
Free format text: STATUS: REQUEST FOR EXAMINATION WAS MADE |
|
| 17P | Request for examination filed |
Effective date: 20181221 |
|
| AK | Designated contracting states |
Kind code of ref document: A1 Designated state(s): AL AT BE BG CH CY CZ DE DK EE ES FI FR GB GR HR HU IE IS IT LI LT LU LV MC MK MT NL NO PL PT RO RS SE SI SK SM TR |
|
| AX | Request for extension of the european patent |
Extension state: BA ME |
|
| DAV | Request for validation of the european patent (deleted) | ||
| DAX | Request for extension of the european patent (deleted) | ||
| A4 | Supplementary search report drawn up and despatched |
Effective date: 20200114 |
|
| RIC1 | Information provided on ipc code assigned before grant |
Ipc: G01N 33/483 20060101AFI20200108BHEP Ipc: G01N 33/68 20060101ALI20200108BHEP Ipc: G01N 33/50 20060101ALI20200108BHEP |
|
| STAA | Information on the status of an ep patent application or granted ep patent |
Free format text: STATUS: EXAMINATION IS IN PROGRESS |
|
| 17Q | First examination report despatched |
Effective date: 20200911 |
|
| STAA | Information on the status of an ep patent application or granted ep patent |
Free format text: STATUS: EXAMINATION IS IN PROGRESS |
|
| STAA | Information on the status of an ep patent application or granted ep patent |
Free format text: STATUS: EXAMINATION IS IN PROGRESS |
|
| GRAP | Despatch of communication of intention to grant a patent |
Free format text: ORIGINAL CODE: EPIDOSNIGR1 |
|
| STAA | Information on the status of an ep patent application or granted ep patent |
Free format text: STATUS: GRANT OF PATENT IS INTENDED |
|
| INTG | Intention to grant announced |
Effective date: 20230208 |
|
| GRAS | Grant fee paid |
Free format text: ORIGINAL CODE: EPIDOSNIGR3 |
|
| GRAA | (expected) grant |
Free format text: ORIGINAL CODE: 0009210 |
|
| STAA | Information on the status of an ep patent application or granted ep patent |
Free format text: STATUS: THE PATENT HAS BEEN GRANTED |
|
| AK | Designated contracting states |
Kind code of ref document: B1 Designated state(s): AL AT BE BG CH CY CZ DE DK EE ES FI FR GB GR HR HU IE IS IT LI LT LU LV MC MK MT NL NO PL PT RO RS SE SI SK SM TR |
|
| RAP3 | Party data changed (applicant data changed or rights of an application transferred) |
Owner name: METABOLON, INC. |
|
| P01 | Opt-out of the competence of the unified patent court (upc) registered |
Effective date: 20230527 |
|
| REG | Reference to a national code |
Ref country code: CH Ref legal event code: EP |
|
| REG | Reference to a national code |
Ref country code: AT Ref legal event code: REF Ref document number: 1585298 Country of ref document: AT Kind code of ref document: T Effective date: 20230715 |
|
| REG | Reference to a national code |
Ref country code: DE Ref legal event code: R096 Ref document number: 602017071008 Country of ref document: DE |
|
| REG | Reference to a national code |
Ref country code: IE Ref legal event code: FG4D |
|
| REG | Reference to a national code |
Ref country code: DK Ref legal event code: T3 Effective date: 20230818 |
|
| REG | Reference to a national code |
Ref country code: LT Ref legal event code: MG9D |
|
| REG | Reference to a national code |
Ref country code: NL Ref legal event code: MP Effective date: 20230705 |
|
| REG | Reference to a national code |
Ref country code: ES Ref legal event code: FG2A Ref document number: 2953498 Country of ref document: ES Kind code of ref document: T3 Effective date: 20231113 |
|
| REG | Reference to a national code |
Ref country code: AT Ref legal event code: MK05 Ref document number: 1585298 Country of ref document: AT Kind code of ref document: T Effective date: 20230705 |
|
| PG25 | Lapsed in a contracting state [announced via postgrant information from national office to epo] |
Ref country code: NL Free format text: LAPSE BECAUSE OF FAILURE TO SUBMIT A TRANSLATION OF THE DESCRIPTION OR TO PAY THE FEE WITHIN THE PRESCRIBED TIME-LIMIT Effective date: 20230705 |
|
| PG25 | Lapsed in a contracting state [announced via postgrant information from national office to epo] |
Ref country code: GR Free format text: LAPSE BECAUSE OF FAILURE TO SUBMIT A TRANSLATION OF THE DESCRIPTION OR TO PAY THE FEE WITHIN THE PRESCRIBED TIME-LIMIT Effective date: 20231006 |
|
| PG25 | Lapsed in a contracting state [announced via postgrant information from national office to epo] |
Ref country code: IS Free format text: LAPSE BECAUSE OF FAILURE TO SUBMIT A TRANSLATION OF THE DESCRIPTION OR TO PAY THE FEE WITHIN THE PRESCRIBED TIME-LIMIT Effective date: 20231105 |
|
| PG25 | Lapsed in a contracting state [announced via postgrant information from national office to epo] |
Ref country code: SE Free format text: LAPSE BECAUSE OF FAILURE TO SUBMIT A TRANSLATION OF THE DESCRIPTION OR TO PAY THE FEE WITHIN THE PRESCRIBED TIME-LIMIT Effective date: 20230705 Ref country code: RS Free format text: LAPSE BECAUSE OF FAILURE TO SUBMIT A TRANSLATION OF THE DESCRIPTION OR TO PAY THE FEE WITHIN THE PRESCRIBED TIME-LIMIT Effective date: 20230705 Ref country code: PT Free format text: LAPSE BECAUSE OF FAILURE TO SUBMIT A TRANSLATION OF THE DESCRIPTION OR TO PAY THE FEE WITHIN THE PRESCRIBED TIME-LIMIT Effective date: 20231106 Ref country code: NO Free format text: LAPSE BECAUSE OF FAILURE TO SUBMIT A TRANSLATION OF THE DESCRIPTION OR TO PAY THE FEE WITHIN THE PRESCRIBED TIME-LIMIT Effective date: 20231005 Ref country code: LV Free format text: LAPSE BECAUSE OF FAILURE TO SUBMIT A TRANSLATION OF THE DESCRIPTION OR TO PAY THE FEE WITHIN THE PRESCRIBED TIME-LIMIT Effective date: 20230705 Ref country code: LT Free format text: LAPSE BECAUSE OF FAILURE TO SUBMIT A TRANSLATION OF THE DESCRIPTION OR TO PAY THE FEE WITHIN THE PRESCRIBED TIME-LIMIT Effective date: 20230705 Ref country code: IS Free format text: LAPSE BECAUSE OF FAILURE TO SUBMIT A TRANSLATION OF THE DESCRIPTION OR TO PAY THE FEE WITHIN THE PRESCRIBED TIME-LIMIT Effective date: 20231105 Ref country code: HR Free format text: LAPSE BECAUSE OF FAILURE TO SUBMIT A TRANSLATION OF THE DESCRIPTION OR TO PAY THE FEE WITHIN THE PRESCRIBED TIME-LIMIT Effective date: 20230705 Ref country code: GR Free format text: LAPSE BECAUSE OF FAILURE TO SUBMIT A TRANSLATION OF THE DESCRIPTION OR TO PAY THE FEE WITHIN THE PRESCRIBED TIME-LIMIT Effective date: 20231006 Ref country code: FI Free format text: LAPSE BECAUSE OF FAILURE TO SUBMIT A TRANSLATION OF THE DESCRIPTION OR TO PAY THE FEE WITHIN THE PRESCRIBED TIME-LIMIT Effective date: 20230705 Ref country code: AT Free format text: LAPSE BECAUSE OF FAILURE TO SUBMIT A TRANSLATION OF THE DESCRIPTION OR TO PAY THE FEE WITHIN THE PRESCRIBED TIME-LIMIT Effective date: 20230705 |
|
| PG25 | Lapsed in a contracting state [announced via postgrant information from national office to epo] |
Ref country code: PL Free format text: LAPSE BECAUSE OF FAILURE TO SUBMIT A TRANSLATION OF THE DESCRIPTION OR TO PAY THE FEE WITHIN THE PRESCRIBED TIME-LIMIT Effective date: 20230705 |
|
| REG | Reference to a national code |
Ref country code: DE Ref legal event code: R097 Ref document number: 602017071008 Country of ref document: DE |
|
| PG25 | Lapsed in a contracting state [announced via postgrant information from national office to epo] |
Ref country code: SM Free format text: LAPSE BECAUSE OF FAILURE TO SUBMIT A TRANSLATION OF THE DESCRIPTION OR TO PAY THE FEE WITHIN THE PRESCRIBED TIME-LIMIT Effective date: 20230705 Ref country code: RO Free format text: LAPSE BECAUSE OF FAILURE TO SUBMIT A TRANSLATION OF THE DESCRIPTION OR TO PAY THE FEE WITHIN THE PRESCRIBED TIME-LIMIT Effective date: 20230705 Ref country code: EE Free format text: LAPSE BECAUSE OF FAILURE TO SUBMIT A TRANSLATION OF THE DESCRIPTION OR TO PAY THE FEE WITHIN THE PRESCRIBED TIME-LIMIT Effective date: 20230705 Ref country code: CZ Free format text: LAPSE BECAUSE OF FAILURE TO SUBMIT A TRANSLATION OF THE DESCRIPTION OR TO PAY THE FEE WITHIN THE PRESCRIBED TIME-LIMIT Effective date: 20230705 Ref country code: SK Free format text: LAPSE BECAUSE OF FAILURE TO SUBMIT A TRANSLATION OF THE DESCRIPTION OR TO PAY THE FEE WITHIN THE PRESCRIBED TIME-LIMIT Effective date: 20230705 |
|
| PLBE | No opposition filed within time limit |
Free format text: ORIGINAL CODE: 0009261 |
|
| STAA | Information on the status of an ep patent application or granted ep patent |
Free format text: STATUS: NO OPPOSITION FILED WITHIN TIME LIMIT |
|
| PG25 | Lapsed in a contracting state [announced via postgrant information from national office to epo] |
Ref country code: IT Free format text: LAPSE BECAUSE OF FAILURE TO SUBMIT A TRANSLATION OF THE DESCRIPTION OR TO PAY THE FEE WITHIN THE PRESCRIBED TIME-LIMIT Effective date: 20230705 |
|
| 26N | No opposition filed |
Effective date: 20240408 |
|
| PGFP | Annual fee paid to national office [announced via postgrant information from national office to epo] |
Ref country code: IE Payment date: 20240527 Year of fee payment: 8 |
|
| PGFP | Annual fee paid to national office [announced via postgrant information from national office to epo] |
Ref country code: GB Payment date: 20240527 Year of fee payment: 8 |
|
| PGFP | Annual fee paid to national office [announced via postgrant information from national office to epo] |
Ref country code: DE Payment date: 20240530 Year of fee payment: 8 |
|
| PGFP | Annual fee paid to national office [announced via postgrant information from national office to epo] |
Ref country code: DK Payment date: 20240527 Year of fee payment: 8 |
|
| PGFP | Annual fee paid to national office [announced via postgrant information from national office to epo] |
Ref country code: CH Payment date: 20240602 Year of fee payment: 8 |
|
| PGFP | Annual fee paid to national office [announced via postgrant information from national office to epo] |
Ref country code: ES Payment date: 20240603 Year of fee payment: 8 |
|
| PG25 | Lapsed in a contracting state [announced via postgrant information from national office to epo] |
Ref country code: SI Free format text: LAPSE BECAUSE OF FAILURE TO SUBMIT A TRANSLATION OF THE DESCRIPTION OR TO PAY THE FEE WITHIN THE PRESCRIBED TIME-LIMIT Effective date: 20230705 |
|
| PGFP | Annual fee paid to national office [announced via postgrant information from national office to epo] |
Ref country code: FR Payment date: 20240527 Year of fee payment: 8 |