EP3006944A1 - Informationsverarbeitungsvorrichtung und informationsverarbeitungsverfahren - Google Patents
Informationsverarbeitungsvorrichtung und informationsverarbeitungsverfahren Download PDFInfo
- Publication number
- EP3006944A1 EP3006944A1 EP15188251.1A EP15188251A EP3006944A1 EP 3006944 A1 EP3006944 A1 EP 3006944A1 EP 15188251 A EP15188251 A EP 15188251A EP 3006944 A1 EP3006944 A1 EP 3006944A1
- Authority
- EP
- European Patent Office
- Prior art keywords
- measurement data
- history
- history relating
- log
- measurement result
- Prior art date
- Legal status (The legal status is an assumption and is not a legal conclusion. Google has not performed a legal analysis and makes no representation as to the accuracy of the status listed.)
- Withdrawn
Links
Images


Classifications
-
- G—PHYSICS
- G01—MEASURING; TESTING
- G01D—MEASURING NOT SPECIALLY ADAPTED FOR A SPECIFIC VARIABLE; ARRANGEMENTS FOR MEASURING TWO OR MORE VARIABLES NOT COVERED IN A SINGLE OTHER SUBCLASS; TARIFF METERING APPARATUS; MEASURING OR TESTING NOT OTHERWISE PROVIDED FOR
- G01D9/00—Recording measured values
- G01D9/005—Solid-state data loggers
-
- G—PHYSICS
- G01—MEASURING; TESTING
- G01N—INVESTIGATING OR ANALYSING MATERIALS BY DETERMINING THEIR CHEMICAL OR PHYSICAL PROPERTIES
- G01N23/00—Investigating or analysing materials by the use of wave or particle radiation, e.g. X-rays or neutrons, not covered by groups G01N3/00 – G01N17/00, G01N21/00 or G01N22/00
- G01N23/22—Investigating or analysing materials by the use of wave or particle radiation, e.g. X-rays or neutrons, not covered by groups G01N3/00 – G01N17/00, G01N21/00 or G01N22/00 by measuring secondary emission from the material
- G01N23/227—Measuring photoelectric effect, e.g. photoelectron emission microscopy [PEEM]
- G01N23/2273—Measuring photoelectron spectrum, e.g. electron spectroscopy for chemical analysis [ESCA] or X-ray photoelectron spectroscopy [XPS]
-
- G—PHYSICS
- G01—MEASURING; TESTING
- G01N—INVESTIGATING OR ANALYSING MATERIALS BY DETERMINING THEIR CHEMICAL OR PHYSICAL PROPERTIES
- G01N23/00—Investigating or analysing materials by the use of wave or particle radiation, e.g. X-rays or neutrons, not covered by groups G01N3/00 – G01N17/00, G01N21/00 or G01N22/00
- G01N23/22—Investigating or analysing materials by the use of wave or particle radiation, e.g. X-rays or neutrons, not covered by groups G01N3/00 – G01N17/00, G01N21/00 or G01N22/00 by measuring secondary emission from the material
- G01N23/227—Measuring photoelectric effect, e.g. photoelectron emission microscopy [PEEM]
- G01N23/2276—Measuring photoelectric effect, e.g. photoelectron emission microscopy [PEEM] using the Auger effect, e.g. Auger electron spectroscopy [AES]
-
- G—PHYSICS
- G01—MEASURING; TESTING
- G01N—INVESTIGATING OR ANALYSING MATERIALS BY DETERMINING THEIR CHEMICAL OR PHYSICAL PROPERTIES
- G01N35/00—Automatic analysis not limited to methods or materials provided for in any single one of groups G01N1/00 - G01N33/00; Handling materials therefor
- G01N35/00584—Control arrangements for automatic analysers
- G01N35/00722—Communications; Identification
- G01N2035/00891—Displaying information to the operator
- G01N2035/0091—GUI [graphical user interfaces]
Definitions
- the present invention relates to an information processing device and a data processing method that process measurement data acquired by an analyzer.
- An analyzer such as an Auger electron spectroscope (AES) is used in the field of specimen (sample) analysis in order to analyze the elements present on the surface of a specimen (e.g., JP-A-2008-20386 ).
- AES Auger electron spectroscope
- the state of the specimen (analysis target) that is analyzed using the analyzer changes with the passage of time due to electron beam irradiation, a surface treatment, and the like that are performed after the specimen has been loaded into the analyzer.
- the depth profile may be measured while etching the specimen, and depth profile analysis may then be performed. Therefore, it is useful for the user (or the manager or the client) to understand the situation before and after the measurement data was acquired when referring to the measurement data measured (acquired) by the analyzer.
- Several aspects of the invention may provide an information processing device and an information processing method that make it possible to easily understand the situation before and after measurement data was acquired.
- an information processing device that processes measurement data acquired by an analyzer, the information processing device including:
- an information processing method that processes measurement data acquired by an analyzer, the information processing method including:
- an information processing method processes measurement data acquired by an analyzer, the information processing method including:
- this embodiment makes it possible for the user to easily understand the situation (i.e., the analysis position or the state of the specimen) before and after the measurement data used to generate the measurement result image selected by the user was acquired, and also makes it possible to provide information useful for the user and the like.
- the history relating to the acquisition of the measurement data is sorted by the analysis position or the type of the operation, and the sorted history is displayed, it becomes possible for the user to easily understand the analysis position when each piece of measurement data was acquired, and the state of the specimen when each piece of measurement data was acquired, and also it becomes possible to provide information useful for the user and the like.
- FIG. 1 illustrates an example of an information processing device according to one embodiment of the invention. Note that the information processing device may have a configuration in which some of the elements (sections) illustrated in FIG. 1 are omitted.
- An information processing device 10 is a device that processes measurement data measured (acquired) by an analyzer 1.
- the analyzer 1 is an Auger electron spectroscope (i.e., a scanning electron microscope that includes an Auger electron spectrometer) is described below. Note that the invention may also be applied to a case where the analyzer 1 is an electron probe microanalyzer (EPMA), an X-ray photoelectron spectroscope (XPS or ESCA), or the like.
- EPMA electron probe microanalyzer
- XPS X-ray photoelectron spectroscope
- the information processing device 10 acquires spectral data, elemental map (Auger image) data, secondary electron image (SEM image) data, depth profile (i.e., the concentration distribution in the depth direction) data, and line profile data as the measurement data measured by the analyzer 1.
- the information processing device 10 includes a processing section 20, an operation section 30, a display section 40, and a storage section 50.
- the operation section 30 allows the user to input operation information, and outputs the input operation information to the processing section 20.
- the function of the operation section 30 may be implemented by hardware such as a keyboard, a mouse, a button, a touch panel, or a touch pad.
- the display section 40 displays an image generated by the processing section 20.
- the function of the display section 40 may be implemented by an LCD, a CRT, a touch panel (that also functions as the operation section 30), or the like.
- the storage section 50 stores a program that causes a computer to function as each section of the processing section 20, as well as various types of data, and serves as a work area for the processing section 20.
- the function of the storage section 50 may be implemented by a hard disk, a RAM, or the like.
- the storage section 50 in this embodiment stores a history relating to the acquisition of the measurement data, a history relating to the analysis position (i.e., the measurement position or the position of the specimen stage) within the analyzer 1, and a history relating to a predetermined operation performed on the specimen using the analyzer 1 (i.e., behavioral record relating to an analytical operation performed by the user) as log information 52 linked to time information.
- predetermined operation refers to an operation that can change the state of the specimen.
- predetermined operation used herein refers to an operation that effects etching (sputtering) by applying ion beams to the specimen, and the like.
- the storage section 50 also stores the measurement data measured by the analyzer 1, and a measurement result image generated from the measurement data.
- the processing section 20 (computer) performs a process that implements data processing on the measurement data, a process that displays the data processing results on the display screen of the display section 40, and the like.
- the processing section 20 performs data processing (e.g., smoothing process, differential process, arithmetic operation process, and image synthesis (blending) process) on the measurement data.
- the function of the processing section 20 may be implemented by hardware such as a processor (e.g., CPU or DSP), or a program.
- the processing section 20 includes a display control section 22.
- the display control section 22 performs a control process that displays the history relating to the acquisition of the measurement data, the history relating to the analysis position, and the history relating to the predetermined operation within a log display area on the display screen in time series based on the log information 52.
- the display control section 22 also performs a control process that displays the measurement result image (i.e., an image that visually represents the measurement data) generated based on the measurement data stored in the storage section 50 on the display screen.
- the display control section 22 performs a control process that displays a history that corresponds to the measurement data used to generate the selected measurement result image within the log display area so as to be specified (e.g., highlights the history that corresponds to the measurement data).
- the display control section 22 may perform a control process that sorts the history relating to the acquisition of the measurement data by the analysis position or the type of the predetermined operation based on the log information 52, and displays the sorted history.
- the history relating to the acquisition of the measurement data is sorted by tracing the history according to the time information included in the log information 52.
- FIG. 2 illustrates an example of the display screen (graphical user interface (GUI)) displayed on the display section 40.
- GUI graphical user interface
- a log display area LI in which the history relating to the acquisition of the measurement data, the history relating to the analysis position, and the history relating to the analytical operation are displayed in time series is displayed in the left area of a display screen DS illustrated in FIG. 2 , and a measurement result image MI generated based on the measurement data is displayed in the right area of the display screen DS.
- the information processing device 10 stores the history relating to the acquisition of the measurement data, the history relating to the analysis position, and the history relating to the analytical operation in the storage section 50 as the log information 52 linked to the time information, and displays the time-series history illustrated in FIG. 2 within the log display area LI based on the log information 52.
- position information about the specimen stage when the measurement data was acquired or the analytical operation was performed is recorded as the history relating to the analysis position.
- information e.g., a comparative image and drift during probe tracking
- a probe tracking operation or automatic probe tracking, and information about a maintenance operation (calibration) on the analyzer 1 may also be recorded as the history relating to the analytical operation.
- the degree of vacuum within the specimen chamber detected (monitored) when the measurement data was acquired may also be recorded as the log information 52.
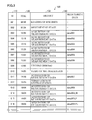
- FIG. 3 is a table illustrating an example of the log information 52.
- Log information 100 illustrated in FIG. 3 has a structure in which a history 130 (relating to the acquisition of the measurement data, the movement of the stage (change in the analysis position), an etching operation, and a neutralization operation) is linked to a time 120 (time information).
- Information 140 that represents the acquired measurement data is linked to the history relating to the acquisition of the measurement data.
- Identification information (ID) 110 is set to each history.
- FIG. 4 illustrates an example of the log display area LI generated based on the log information 100 illustrated in FIG. 3 .
- the time at which each event (i.e., the acquisition of the measurement data, the movement of the stage, or the analytical operation) occurred, and an icon that represents each event are displayed within the log display area LI.
- a thumbnail of the measurement result image (spectrum, Auger image, or SEM image) generated based on the acquired measurement data is displayed, and the name of the measurement data is also displayed.
- the etching depth is displayed corresponding to the etching operation.
- the specimen was loaded at time "06:50", the stage was moved (i.e., the analysis position was changed) at time "07:24", a spectrum "data001” was acquired at time “12:03", a plurality of SEM images "data002" to “data005" were acquired from time “13:18” to time “13:22”, a plurality of spectra “data006” were acquired at time “13:33”, an etching operation at a depth "30017 nm” was performed at time “13:55”, a neutralization operation was started at time “14:25”, an Auger image "data007” was acquired at time “14:38”, the neutralization operation was stopped at time “15:25”, and a plurality of Auger images "data008_Al”, “data008_F”, and “data008_Fe” were acquired at time “16:04".
- the pieces of measurement data "data001" to “data006” were acquired before the etching operation was performed, the pieces of measurement data “data007” to “data008_Fe” were acquired after the etching operation was performed, and the piece of measurement data "data007” was acquired while the neutralization operation was performed.
- this embodiment makes it possible to easily understand the situation before and after each piece of measurement data was acquired (i.e., the time and the situation when each piece of measurement data was measured).
- this embodiment makes it possible to provide information that is useful for a person (e.g., manager or client) other than the user (operator) who took part in the measurement to understand the grounds for the measurement data, and verify the validity of the measurement data.
- a report that includes the measurement result image MI generated based on the selected measurement data is generated.
- a report LP that includes the measurement result image MI is displayed (in an enlarged state) in the right area of the display screen DS, and thumbnails (list) of the generated report are displayed in the center area of the display screen DS.
- a history that corresponds to the measurement data used to generate the selected measurement result image MI is displayed within the log display area LI so as to be specified.
- an operation e.g., click operation
- a history that corresponds to the measurement data "data009" used to generate the measurement result image MI is displayed and highlighted (the colors of text and background are reversely displayed) within the log display area LI.
- a person e.g., manager or client
- information that represents the measurement data used to generate the measurement result image (corresponding to the information 140 included in the log information 100) is set (linked) to the measurement result image included in the report LP.
- the display control section 22 performs a control process that specifies a history (i.e., the history identification information 110 included in the log information 100) that corresponds to the measurement data used to generate the measurement result image by referring to the log information based on the information set to the selected measurement result image, and highlights the specified history that corresponds to the measurement data within the log display area LI.
- the user can sort the history relating to the acquisition of the measurement data displayed within log display area LI in time series by the analysis position or the type of the analytical operation (using the analysis position or the type of the analytical operation as a key) by performing a predetermined operation so that the sorted history is displayed.
- the history relating to the acquisition of the measurement data is displayed in time series.
- the analysis position was moved to "FIELD OF VIEW 1" after the specimen was loaded, pieces of measurement data "data11” to “data13” were acquired in a state in which the analysis position was set to "FIELD OF VIEW 1", an etching operation was performed (depth: "100 nm"), pieces of measurement data “data14” to “data16” were acquired, an etching operation was performed (depth: "500 nm”), and pieces of measurement data "data17” to “data19” were acquired.
- the analysis position was then moved to "FIELD OF VIEW 2", pieces of measurement data "data21” to “data23” were acquired in a state in which the analysis position was set to "FIELD OF VIEW 2", an etching operation was performed (depth: "100 nm”), pieces of measurement data “data24” to “data26” were acquired, an etching operation was performed (depth: "500 nm”), and pieces of measurement data "data27” to "data29” were acquired.
- the log display area LI is updated as illustrated in FIG. 7 .
- the history relating to the acquisition of the measurement data is displayed in a state in which the history is sorted by the etching depth (0 nm, 100 nm, 500 nm).
- the pieces of measurement data "data11” to “data13” and “data21” to “data23” are measurement data at the surface of the specimen
- the pieces of measurement data “data14” to “data16” and “data24” to “data26” are measurement data at a depth of 100 nm from the surface of the specimen
- the pieces of measurement data “data17” to “data19” and “data27” to “data29” are measurement data at a depth of 500 nm from the surface of the specimen.
- the user can easily understand the analysis position when each piece of measurement data was acquired, and the state of the specimen when each piece of measurement data was acquired by sorting the history relating to the acquisition of the measurement data by the analysis position or the type of the analytical operation, and displaying the sorted history. Therefore, it becomes possible to provide information useful for the user and the like.
- the history relating to the acquisition of the measurement data does not include information about the analysis position and the type of the analytical operation when each piece of measurement data was acquired.
- the display control section 22 specifies the analysis position and the type of the analytical operation when each piece of measurement data was acquired by tracing the history according to the time information (i.e., the time 120 included in the log information 100) referring to the log information 52, and performs the sorting process by the analysis position or the type of the analytical operation.
- the invention is not limited to the above embodiments. Various modifications and variations may be made of the above embodiments.
- the invention includes configurations that are substantially the same as the configurations described in connection with the above embodiments (e.g., in function, method and effect, or objective and effect).
- the invention also includes a configuration in which an unsubstantial element among the elements described in connection with the above embodiments is replaced by another element.
- the invention also includes a configuration having the same effects as those of the configurations described in connection with the above embodiments, or a configuration capable of achieving the same object as those of the configurations described in connection with the above embodiments.
- the invention further includes a configuration obtained by adding known technology to the configurations described in connection with the above embodiments.
Landscapes
- Physics & Mathematics (AREA)
- General Physics & Mathematics (AREA)
- Health & Medical Sciences (AREA)
- Life Sciences & Earth Sciences (AREA)
- Chemical & Material Sciences (AREA)
- Analytical Chemistry (AREA)
- Biochemistry (AREA)
- General Health & Medical Sciences (AREA)
- Immunology (AREA)
- Pathology (AREA)
- Spectroscopy & Molecular Physics (AREA)
- Analysing Materials By The Use Of Radiation (AREA)
Applications Claiming Priority (1)
| Application Number | Priority Date | Filing Date | Title |
|---|---|---|---|
| JP2014205615A JP6336876B2 (ja) | 2014-10-06 | 2014-10-06 | 情報処理装置、及び情報処理方法 |
Publications (1)
| Publication Number | Publication Date |
|---|---|
| EP3006944A1 true EP3006944A1 (de) | 2016-04-13 |
Family
ID=54256653
Family Applications (1)
| Application Number | Title | Priority Date | Filing Date |
|---|---|---|---|
| EP15188251.1A Withdrawn EP3006944A1 (de) | 2014-10-06 | 2015-10-02 | Informationsverarbeitungsvorrichtung und informationsverarbeitungsverfahren |
Country Status (3)
| Country | Link |
|---|---|
| US (1) | US9714850B2 (de) |
| EP (1) | EP3006944A1 (de) |
| JP (1) | JP6336876B2 (de) |
Families Citing this family (3)
| Publication number | Priority date | Publication date | Assignee | Title |
|---|---|---|---|---|
| JP6357391B2 (ja) * | 2014-09-22 | 2018-07-11 | 日本電子株式会社 | 情報処理装置、及び情報処理方法 |
| JP6790734B2 (ja) * | 2016-11-02 | 2020-11-25 | 株式会社ニコン | 装置、方法、およびプログラム |
| JP7238366B2 (ja) * | 2018-11-30 | 2023-03-14 | 株式会社島津製作所 | 分析システム |
Citations (7)
| Publication number | Priority date | Publication date | Assignee | Title |
|---|---|---|---|---|
| US20030026388A1 (en) * | 2001-08-02 | 2003-02-06 | Shouhei Numata | Data processing method and data processing apparatus |
| US20070179715A1 (en) * | 2005-09-14 | 2007-08-02 | Sysmex Corporation | Analyzer, information processing device and computer program product |
| JP2008020386A (ja) | 2006-07-14 | 2008-01-31 | Jeol Ltd | オージェ電子分光による化学状態分析法及び装置 |
| US20090132858A1 (en) * | 2007-11-12 | 2009-05-21 | Sysmex Corporation | Analyzer, analyzing system, and computer program product |
| US20100101339A1 (en) * | 2008-10-28 | 2010-04-29 | Sysmex Corporation | Sample processing apparatus and sample information display apparatus |
| US20110039349A1 (en) * | 2009-08-12 | 2011-02-17 | Yuichi Hamada | Sample testing apparatus, information management apparatus and sample testing method |
| US20120109529A1 (en) * | 2010-10-29 | 2012-05-03 | Sysmex Corporation | Sample processing apparatus and non-transitory storage medium |
Family Cites Families (8)
| Publication number | Priority date | Publication date | Assignee | Title |
|---|---|---|---|---|
| JP2003156460A (ja) * | 2001-09-10 | 2003-05-30 | Jeol Ltd | データ管理方法及びデータ管理システム |
| JP4036380B2 (ja) * | 2004-05-24 | 2008-01-23 | 株式会社リガク | 分析装置 |
| JP2010071647A (ja) * | 2008-09-16 | 2010-04-02 | Hitachi High-Technologies Corp | 自動分析装置 |
| JP5345861B2 (ja) * | 2009-01-23 | 2013-11-20 | 株式会社リガク | X線分析及び熱分析同時分析装置 |
| JP5589366B2 (ja) * | 2009-11-27 | 2014-09-17 | ソニー株式会社 | 情報処理装置、情報処理方法及びそのプログラム |
| JP5303517B2 (ja) | 2010-07-15 | 2013-10-02 | 株式会社日立ハイテクノロジーズ | 荷電粒子線装置、および欠陥観察装置、および管理サーバ |
| EP2605005A1 (de) * | 2011-12-14 | 2013-06-19 | FEI Company | Clustern von multimodalen Daten |
| US9804149B2 (en) * | 2012-10-10 | 2017-10-31 | Bio-Rad Laboratories, Inc. | Patient-based results display |
-
2014
- 2014-10-06 JP JP2014205615A patent/JP6336876B2/ja active Active
-
2015
- 2015-10-02 EP EP15188251.1A patent/EP3006944A1/de not_active Withdrawn
- 2015-10-06 US US14/875,764 patent/US9714850B2/en not_active Expired - Fee Related
Patent Citations (7)
| Publication number | Priority date | Publication date | Assignee | Title |
|---|---|---|---|---|
| US20030026388A1 (en) * | 2001-08-02 | 2003-02-06 | Shouhei Numata | Data processing method and data processing apparatus |
| US20070179715A1 (en) * | 2005-09-14 | 2007-08-02 | Sysmex Corporation | Analyzer, information processing device and computer program product |
| JP2008020386A (ja) | 2006-07-14 | 2008-01-31 | Jeol Ltd | オージェ電子分光による化学状態分析法及び装置 |
| US20090132858A1 (en) * | 2007-11-12 | 2009-05-21 | Sysmex Corporation | Analyzer, analyzing system, and computer program product |
| US20100101339A1 (en) * | 2008-10-28 | 2010-04-29 | Sysmex Corporation | Sample processing apparatus and sample information display apparatus |
| US20110039349A1 (en) * | 2009-08-12 | 2011-02-17 | Yuichi Hamada | Sample testing apparatus, information management apparatus and sample testing method |
| US20120109529A1 (en) * | 2010-10-29 | 2012-05-03 | Sysmex Corporation | Sample processing apparatus and non-transitory storage medium |
Also Published As
| Publication number | Publication date |
|---|---|
| US9714850B2 (en) | 2017-07-25 |
| US20160097659A1 (en) | 2016-04-07 |
| JP6336876B2 (ja) | 2018-06-06 |
| JP2016075559A (ja) | 2016-05-12 |
Similar Documents
| Publication | Publication Date | Title |
|---|---|---|
| Mitchell et al. | Scripting-customised microscopy tools for Digital Micrograph™ | |
| JP6007855B2 (ja) | グラフ表示処理装置 | |
| JP5348029B2 (ja) | 質量分析データ処理方法及び装置 | |
| JP2011237311A (ja) | クロマトグラフ質量分析用データ処理装置 | |
| US9714850B2 (en) | Information processing device and information processing method | |
| JP6242291B2 (ja) | 相分析装置、相分析方法、および表面分析装置 | |
| US10593072B2 (en) | Image processing apparatus, surface analyzer, and image processing method | |
| US10371675B2 (en) | Data processing device for comprehensive two-dimensional chromatograph | |
| US11408866B2 (en) | Mass spectrometric data analyzer and mass spectrometric data analyzing program | |
| WO2017002156A1 (ja) | 分析結果出力処理装置及び分析結果出力処理用プログラム | |
| WO2019229902A1 (ja) | イメージング質量分析データ処理装置 | |
| JP5020491B2 (ja) | Nmrデータの処理装置及び方法 | |
| JP6403204B2 (ja) | 質量分析データ処理装置および質量分析データ処理方法 | |
| JP5708289B2 (ja) | 質量分析データ表示装置及び質量分析データ表示プログラム | |
| JP6336881B2 (ja) | 散布図表示装置、散布図表示方法、および表面分析装置 | |
| EP4174481A1 (de) | Phasenanalysator, probenanalysator und analyseverfahren | |
| US20120265487A1 (en) | Method and Apparatus of Analyzing Sample Surface Data | |
| US10121630B2 (en) | Control device, control method, and analysis system | |
| TWI748675B (zh) | 一種遠端控制樣品處理及/或樣品分析的方法 | |
| US10269535B2 (en) | Information processing device and information processing method | |
| JP5407887B2 (ja) | X線分析用表示処理装置 | |
| JP2011141298A (ja) | Nmrデータの処理装置及び方法 | |
| JP2021196260A (ja) | イメージング質量分析装置、及びイメージング質量分析方法 | |
| US20230204607A1 (en) | Integrated viewer for multiple measurements, and program | |
| JP6876427B2 (ja) | 報告書作成装置、プログラム、情報記憶媒体、および報告書作成方法 |
Legal Events
| Date | Code | Title | Description |
|---|---|---|---|
| PUAI | Public reference made under article 153(3) epc to a published international application that has entered the european phase |
Free format text: ORIGINAL CODE: 0009012 |
|
| AK | Designated contracting states |
Kind code of ref document: A1 Designated state(s): AL AT BE BG CH CY CZ DE DK EE ES FI FR GB GR HR HU IE IS IT LI LT LU LV MC MK MT NL NO PL PT RO RS SE SI SK SM TR |
|
| AX | Request for extension of the european patent |
Extension state: BA ME |
|
| 17P | Request for examination filed |
Effective date: 20161013 |
|
| RBV | Designated contracting states (corrected) |
Designated state(s): AL AT BE BG CH CY CZ DE DK EE ES FI FR GB GR HR HU IE IS IT LI LT LU LV MC MK MT NL NO PL PT RO RS SE SI SK SM TR |
|
| 17Q | First examination report despatched |
Effective date: 20170321 |
|
| STAA | Information on the status of an ep patent application or granted ep patent |
Free format text: STATUS: THE APPLICATION IS DEEMED TO BE WITHDRAWN |
|
| 18D | Application deemed to be withdrawn |
Effective date: 20190115 |