EP2939026B1 - Analyse d'image pour pronostic de cancer du sein - Google Patents
Analyse d'image pour pronostic de cancer du sein Download PDFInfo
- Publication number
- EP2939026B1 EP2939026B1 EP13815724.3A EP13815724A EP2939026B1 EP 2939026 B1 EP2939026 B1 EP 2939026B1 EP 13815724 A EP13815724 A EP 13815724A EP 2939026 B1 EP2939026 B1 EP 2939026B1
- Authority
- EP
- European Patent Office
- Prior art keywords
- score
- heterogeneity
- her2
- breast cancer
- view
- Prior art date
- Legal status (The legal status is an assumption and is not a legal conclusion. Google has not performed a legal analysis and makes no representation as to the accuracy of the status listed.)
- Active
Links
- 208000026310 Breast neoplasm Diseases 0.000 title claims description 142
- 206010006187 Breast cancer Diseases 0.000 title claims description 141
- 238000004393 prognosis Methods 0.000 title claims description 100
- 238000010191 image analysis Methods 0.000 title description 4
- 101001012157 Homo sapiens Receptor tyrosine-protein kinase erbB-2 Proteins 0.000 claims description 163
- 102100030086 Receptor tyrosine-protein kinase erbB-2 Human genes 0.000 claims description 161
- 108010038795 estrogen receptors Proteins 0.000 claims description 153
- 238000000034 method Methods 0.000 claims description 122
- 108090000468 progesterone receptors Proteins 0.000 claims description 116
- 238000003364 immunohistochemistry Methods 0.000 claims description 104
- 239000000090 biomarker Substances 0.000 claims description 98
- 108090000623 proteins and genes Proteins 0.000 claims description 98
- 102000004169 proteins and genes Human genes 0.000 claims description 96
- 230000014509 gene expression Effects 0.000 claims description 57
- 101000611441 Solanum lycopersicum Pathogenesis-related leaf protein 6 Proteins 0.000 claims description 25
- 102000015694 estrogen receptors Human genes 0.000 claims description 17
- 102000003998 progesterone receptors Human genes 0.000 claims description 11
- 210000001165 lymph node Anatomy 0.000 claims description 5
- 102100038595 Estrogen receptor Human genes 0.000 description 137
- 102100025803 Progesterone receptor Human genes 0.000 description 106
- 210000004027 cell Anatomy 0.000 description 95
- 239000000523 sample Substances 0.000 description 94
- 210000001519 tissue Anatomy 0.000 description 81
- 210000004940 nucleus Anatomy 0.000 description 67
- 238000010186 staining Methods 0.000 description 54
- 206010028980 Neoplasm Diseases 0.000 description 39
- 238000005516 engineering process Methods 0.000 description 32
- -1 docetaxel) Chemical compound 0.000 description 27
- 210000000481 breast Anatomy 0.000 description 26
- 238000005259 measurement Methods 0.000 description 26
- 201000011510 cancer Diseases 0.000 description 22
- 238000012545 processing Methods 0.000 description 20
- 238000010586 diagram Methods 0.000 description 19
- 239000012528 membrane Substances 0.000 description 19
- 238000004458 analytical method Methods 0.000 description 17
- 238000003860 storage Methods 0.000 description 17
- 238000004364 calculation method Methods 0.000 description 15
- 238000001514 detection method Methods 0.000 description 15
- 239000003795 chemical substances by application Substances 0.000 description 14
- 238000004891 communication Methods 0.000 description 13
- 238000010606 normalization Methods 0.000 description 12
- 239000012634 fragment Substances 0.000 description 11
- 239000003550 marker Substances 0.000 description 11
- 238000011282 treatment Methods 0.000 description 11
- 239000000834 fixative Substances 0.000 description 9
- 238000006467 substitution reaction Methods 0.000 description 9
- 150000001413 amino acids Chemical class 0.000 description 8
- 230000027455 binding Effects 0.000 description 8
- 210000000170 cell membrane Anatomy 0.000 description 8
- 102000039446 nucleic acids Human genes 0.000 description 8
- 108020004707 nucleic acids Proteins 0.000 description 8
- 150000007523 nucleic acids Chemical class 0.000 description 8
- 238000002560 therapeutic procedure Methods 0.000 description 8
- 238000004422 calculation algorithm Methods 0.000 description 7
- 238000011160 research Methods 0.000 description 7
- 230000011218 segmentation Effects 0.000 description 7
- WSFSSNUMVMOOMR-UHFFFAOYSA-N Formaldehyde Chemical compound O=C WSFSSNUMVMOOMR-UHFFFAOYSA-N 0.000 description 6
- 239000000427 antigen Substances 0.000 description 6
- 108091007433 antigens Proteins 0.000 description 6
- 102000036639 antigens Human genes 0.000 description 6
- 238000003556 assay Methods 0.000 description 6
- 230000000875 corresponding effect Effects 0.000 description 6
- 210000004698 lymphocyte Anatomy 0.000 description 6
- 125000000393 L-methionino group Chemical group [H]OC(=O)[C@@]([H])(N([H])[*])C([H])([H])C(SC([H])([H])[H])([H])[H] 0.000 description 5
- 239000011230 binding agent Substances 0.000 description 5
- 230000002596 correlated effect Effects 0.000 description 5
- 239000011521 glass Substances 0.000 description 5
- 108090000765 processed proteins & peptides Proteins 0.000 description 5
- 238000011002 quantification Methods 0.000 description 5
- 238000012360 testing method Methods 0.000 description 5
- 210000004881 tumor cell Anatomy 0.000 description 5
- 101100314454 Caenorhabditis elegans tra-1 gene Proteins 0.000 description 4
- 201000009030 Carcinoma Diseases 0.000 description 4
- COLNVLDHVKWLRT-QMMMGPOBSA-N L-phenylalanine Chemical compound OC(=O)[C@@H](N)CC1=CC=CC=C1 COLNVLDHVKWLRT-QMMMGPOBSA-N 0.000 description 4
- 239000012472 biological sample Substances 0.000 description 4
- 230000006870 function Effects 0.000 description 4
- 238000003018 immunoassay Methods 0.000 description 4
- 238000007901 in situ hybridization Methods 0.000 description 4
- 239000011159 matrix material Substances 0.000 description 4
- 238000000386 microscopy Methods 0.000 description 4
- 238000012544 monitoring process Methods 0.000 description 4
- 230000002018 overexpression Effects 0.000 description 4
- 230000008569 process Effects 0.000 description 4
- 230000009870 specific binding Effects 0.000 description 4
- MTCFGRXMJLQNBG-REOHCLBHSA-N (2S)-2-Amino-3-hydroxypropansäure Chemical compound OC[C@H](N)C(O)=O MTCFGRXMJLQNBG-REOHCLBHSA-N 0.000 description 3
- 102000004190 Enzymes Human genes 0.000 description 3
- 108090000790 Enzymes Proteins 0.000 description 3
- 101150054472 HER2 gene Proteins 0.000 description 3
- 206010027476 Metastases Diseases 0.000 description 3
- 230000003321 amplification Effects 0.000 description 3
- 238000013459 approach Methods 0.000 description 3
- 230000015572 biosynthetic process Effects 0.000 description 3
- 210000003855 cell nucleus Anatomy 0.000 description 3
- 210000000349 chromosome Anatomy 0.000 description 3
- 201000010099 disease Diseases 0.000 description 3
- 208000037265 diseases, disorders, signs and symptoms Diseases 0.000 description 3
- 229940088598 enzyme Drugs 0.000 description 3
- 108700020302 erbB-2 Genes Proteins 0.000 description 3
- 238000005755 formation reaction Methods 0.000 description 3
- 210000004907 gland Anatomy 0.000 description 3
- 229940088597 hormone Drugs 0.000 description 3
- 239000005556 hormone Substances 0.000 description 3
- 238000002372 labelling Methods 0.000 description 3
- 230000003211 malignant effect Effects 0.000 description 3
- 230000009401 metastasis Effects 0.000 description 3
- 238000002493 microarray Methods 0.000 description 3
- 238000003199 nucleic acid amplification method Methods 0.000 description 3
- 230000003287 optical effect Effects 0.000 description 3
- 230000007170 pathology Effects 0.000 description 3
- 102000004196 processed proteins & peptides Human genes 0.000 description 3
- 238000007619 statistical method Methods 0.000 description 3
- 239000000758 substrate Substances 0.000 description 3
- 238000001356 surgical procedure Methods 0.000 description 3
- 230000004083 survival effect Effects 0.000 description 3
- 238000011269 treatment regimen Methods 0.000 description 3
- 239000000107 tumor biomarker Substances 0.000 description 3
- VOXZDWNPVJITMN-ZBRFXRBCSA-N 17β-estradiol Chemical compound OC1=CC=C2[C@H]3CC[C@](C)([C@H](CC4)O)[C@@H]4[C@@H]3CCC2=C1 VOXZDWNPVJITMN-ZBRFXRBCSA-N 0.000 description 2
- 238000012935 Averaging Methods 0.000 description 2
- 239000011547 Bouin solution Substances 0.000 description 2
- 101150029707 ERBB2 gene Proteins 0.000 description 2
- MPZWMIIOPAPAKE-BQBZGAKWSA-N Glu-Arg Chemical compound OC(=O)CC[C@H](N)C(=O)N[C@H](C(O)=O)CCCNC(N)=N MPZWMIIOPAPAKE-BQBZGAKWSA-N 0.000 description 2
- WZUVPPKBWHMQCE-UHFFFAOYSA-N Haematoxylin Chemical compound C12=CC(O)=C(O)C=C2CC2(O)C1C1=CC=C(O)C(O)=C1OC2 WZUVPPKBWHMQCE-UHFFFAOYSA-N 0.000 description 2
- 101000882584 Homo sapiens Estrogen receptor Proteins 0.000 description 2
- 108060003951 Immunoglobulin Proteins 0.000 description 2
- DCXYFEDJOCDNAF-REOHCLBHSA-N L-asparagine Chemical compound OC(=O)[C@@H](N)CC(N)=O DCXYFEDJOCDNAF-REOHCLBHSA-N 0.000 description 2
- 125000000510 L-tryptophano group Chemical group [H]C1=C([H])C([H])=C2N([H])C([H])=C(C([H])([H])[C@@]([H])(C(O[H])=O)N([H])[*])C2=C1[H] 0.000 description 2
- 208000000265 Lobular Carcinoma Diseases 0.000 description 2
- 239000002033 PVDF binder Substances 0.000 description 2
- 102000057297 Pepsin A Human genes 0.000 description 2
- 108090000284 Pepsin A Proteins 0.000 description 2
- RJKFOVLPORLFTN-LEKSSAKUSA-N Progesterone Chemical compound C1CC2=CC(=O)CC[C@]2(C)[C@@H]2[C@@H]1[C@@H]1CC[C@H](C(=O)C)[C@@]1(C)CC2 RJKFOVLPORLFTN-LEKSSAKUSA-N 0.000 description 2
- 102100034836 Proliferation marker protein Ki-67 Human genes 0.000 description 2
- NKANXQFJJICGDU-QPLCGJKRSA-N Tamoxifen Chemical compound C=1C=CC=CC=1C(/CC)=C(C=1C=CC(OCCN(C)C)=CC=1)/C1=CC=CC=C1 NKANXQFJJICGDU-QPLCGJKRSA-N 0.000 description 2
- 230000009471 action Effects 0.000 description 2
- 208000009956 adenocarcinoma Diseases 0.000 description 2
- 239000002246 antineoplastic agent Substances 0.000 description 2
- 230000004071 biological effect Effects 0.000 description 2
- 238000001574 biopsy Methods 0.000 description 2
- 201000003714 breast lobular carcinoma Diseases 0.000 description 2
- 230000008859 change Effects 0.000 description 2
- 229940127089 cytotoxic agent Drugs 0.000 description 2
- 208000028715 ductal breast carcinoma in situ Diseases 0.000 description 2
- 230000000694 effects Effects 0.000 description 2
- 238000000684 flow cytometry Methods 0.000 description 2
- 238000010353 genetic engineering Methods 0.000 description 2
- 230000007773 growth pattern Effects 0.000 description 2
- 229940022353 herceptin Drugs 0.000 description 2
- 230000001744 histochemical effect Effects 0.000 description 2
- 238000003384 imaging method Methods 0.000 description 2
- 102000018358 immunoglobulin Human genes 0.000 description 2
- 238000011532 immunohistochemical staining Methods 0.000 description 2
- 206010073096 invasive lobular breast carcinoma Diseases 0.000 description 2
- 239000003446 ligand Substances 0.000 description 2
- 239000000463 material Substances 0.000 description 2
- 108020004999 messenger RNA Proteins 0.000 description 2
- 238000012986 modification Methods 0.000 description 2
- 230000004048 modification Effects 0.000 description 2
- 230000000877 morphologic effect Effects 0.000 description 2
- 239000012188 paraffin wax Substances 0.000 description 2
- 230000037361 pathway Effects 0.000 description 2
- 229960002087 pertuzumab Drugs 0.000 description 2
- 229920001184 polypeptide Polymers 0.000 description 2
- 229920002981 polyvinylidene fluoride Polymers 0.000 description 2
- 238000001959 radiotherapy Methods 0.000 description 2
- 230000009467 reduction Effects 0.000 description 2
- 108020004418 ribosomal RNA Proteins 0.000 description 2
- 239000007787 solid Substances 0.000 description 2
- 238000012549 training Methods 0.000 description 2
- 238000013518 transcription Methods 0.000 description 2
- 230000035897 transcription Effects 0.000 description 2
- 229960000575 trastuzumab Drugs 0.000 description 2
- MWWSFMDVAYGXBV-MYPASOLCSA-N (7r,9s)-7-[(2r,4s,5s,6s)-4-amino-5-hydroxy-6-methyloxan-2-yl]oxy-6,9,11-trihydroxy-9-(2-hydroxyacetyl)-4-methoxy-8,10-dihydro-7h-tetracene-5,12-dione;hydrochloride Chemical compound Cl.O([C@@H]1C[C@@](O)(CC=2C(O)=C3C(=O)C=4C=CC=C(C=4C(=O)C3=C(O)C=21)OC)C(=O)CO)[C@H]1C[C@H](N)[C@H](O)[C@H](C)O1 MWWSFMDVAYGXBV-MYPASOLCSA-N 0.000 description 1
- 108091032973 (ribonucleotides)n+m Proteins 0.000 description 1
- CSAHOYQKNHGDHX-ACZMJKKPSA-N Ala-Gln-Asn Chemical compound C[C@H](N)C(=O)N[C@@H](CCC(N)=O)C(=O)N[C@@H](CC(N)=O)C(O)=O CSAHOYQKNHGDHX-ACZMJKKPSA-N 0.000 description 1
- RTZCUEHYUQZIDE-WHFBIAKZSA-N Ala-Ser-Gly Chemical compound C[C@H](N)C(=O)N[C@@H](CO)C(=O)NCC(O)=O RTZCUEHYUQZIDE-WHFBIAKZSA-N 0.000 description 1
- 108091023037 Aptamer Proteins 0.000 description 1
- 101100509468 Arabidopsis thaliana JASON gene Proteins 0.000 description 1
- 201000011057 Breast sarcoma Diseases 0.000 description 1
- 208000009458 Carcinoma in Situ Diseases 0.000 description 1
- CMSMOCZEIVJLDB-UHFFFAOYSA-N Cyclophosphamide Chemical compound ClCCN(CCCl)P1(=O)NCCCO1 CMSMOCZEIVJLDB-UHFFFAOYSA-N 0.000 description 1
- 108020004414 DNA Proteins 0.000 description 1
- 230000004568 DNA-binding Effects 0.000 description 1
- 206010061819 Disease recurrence Diseases 0.000 description 1
- 238000002965 ELISA Methods 0.000 description 1
- 102100029951 Estrogen receptor beta Human genes 0.000 description 1
- LFQSCWFLJHTTHZ-UHFFFAOYSA-N Ethanol Chemical compound CCO LFQSCWFLJHTTHZ-UHFFFAOYSA-N 0.000 description 1
- OPINTGHFESTVAX-BQBZGAKWSA-N Gln-Arg Chemical compound NC(=O)CC[C@H](N)C(=O)N[C@H](C(O)=O)CCCN=C(N)N OPINTGHFESTVAX-BQBZGAKWSA-N 0.000 description 1
- TUTIHHSZKFBMHM-WHFBIAKZSA-N Glu-Asn Chemical compound OC(=O)CC[C@H](N)C(=O)N[C@@H](CC(N)=O)C(O)=O TUTIHHSZKFBMHM-WHFBIAKZSA-N 0.000 description 1
- SXRSQZLOMIGNAQ-UHFFFAOYSA-N Glutaraldehyde Chemical compound O=CCCCC=O SXRSQZLOMIGNAQ-UHFFFAOYSA-N 0.000 description 1
- DHMQDGOQFOQNFH-UHFFFAOYSA-N Glycine Chemical compound NCC(O)=O DHMQDGOQFOQNFH-UHFFFAOYSA-N 0.000 description 1
- MDCTVRUPVLZSPG-BQBZGAKWSA-N His-Asp Chemical compound OC(=O)C[C@@H](C(O)=O)NC(=O)[C@@H](N)CC1=CNC=N1 MDCTVRUPVLZSPG-BQBZGAKWSA-N 0.000 description 1
- 101001010910 Homo sapiens Estrogen receptor beta Proteins 0.000 description 1
- 101000574060 Homo sapiens Progesterone receptor Proteins 0.000 description 1
- 101000945496 Homo sapiens Proliferation marker protein Ki-67 Proteins 0.000 description 1
- 101000738977 Homo sapiens Reverse transcriptase/ribonuclease H Proteins 0.000 description 1
- CNPNWGHRMBQHBZ-ZKWXMUAHSA-N Ile-Gln Chemical compound CC[C@H](C)[C@H](N)C(=O)N[C@H](C(O)=O)CCC(N)=O CNPNWGHRMBQHBZ-ZKWXMUAHSA-N 0.000 description 1
- 208000037396 Intraductal Noninfiltrating Carcinoma Diseases 0.000 description 1
- 206010073094 Intraductal proliferative breast lesion Diseases 0.000 description 1
- 108010020437 Ki-67 Antigen Proteins 0.000 description 1
- WHUUTDBJXJRKMK-VKHMYHEASA-N L-glutamic acid Chemical compound OC(=O)[C@@H](N)CCC(O)=O WHUUTDBJXJRKMK-VKHMYHEASA-N 0.000 description 1
- ZDXPYRJPNDTMRX-VKHMYHEASA-N L-glutamine Chemical compound OC(=O)[C@@H](N)CCC(N)=O ZDXPYRJPNDTMRX-VKHMYHEASA-N 0.000 description 1
- AYFVYJQAPQTCCC-GBXIJSLDSA-N L-threonine Chemical compound C[C@@H](O)[C@H](N)C(O)=O AYFVYJQAPQTCCC-GBXIJSLDSA-N 0.000 description 1
- 108091026898 Leader sequence (mRNA) Proteins 0.000 description 1
- NPBGTPKLVJEOBE-IUCAKERBSA-N Lys-Arg Chemical compound NCCCC[C@H](N)C(=O)N[C@H](C(O)=O)CCCNC(N)=N NPBGTPKLVJEOBE-IUCAKERBSA-N 0.000 description 1
- JPNRPAJITHRXRH-BQBZGAKWSA-N Lys-Asn Chemical compound NCCCC[C@H](N)C(=O)N[C@H](C(O)=O)CC(N)=O JPNRPAJITHRXRH-BQBZGAKWSA-N 0.000 description 1
- YKIRNDPUWONXQN-GUBZILKMSA-N Lys-Asn-Gln Chemical compound C(CCN)C[C@@H](C(=O)N[C@@H](CC(=O)N)C(=O)N[C@@H](CCC(=O)N)C(=O)O)N YKIRNDPUWONXQN-GUBZILKMSA-N 0.000 description 1
- 208000007054 Medullary Carcinoma Diseases 0.000 description 1
- MTBVQFFQMXHCPC-CIUDSAMLSA-N Met-Glu-Asp Chemical compound CSCC[C@H](N)C(=O)N[C@@H](CCC(O)=O)C(=O)N[C@@H](CC(O)=O)C(O)=O MTBVQFFQMXHCPC-CIUDSAMLSA-N 0.000 description 1
- ZDZOTLJHXYCWBA-VCVYQWHSSA-N N-debenzoyl-N-(tert-butoxycarbonyl)-10-deacetyltaxol Chemical compound O([C@H]1[C@H]2[C@@](C([C@H](O)C3=C(C)[C@@H](OC(=O)[C@H](O)[C@@H](NC(=O)OC(C)(C)C)C=4C=CC=CC=4)C[C@]1(O)C3(C)C)=O)(C)[C@@H](O)C[C@H]1OC[C@]12OC(=O)C)C(=O)C1=CC=CC=C1 ZDZOTLJHXYCWBA-VCVYQWHSSA-N 0.000 description 1
- 108020000002 NR3 subfamily Proteins 0.000 description 1
- 239000000020 Nitrocellulose Substances 0.000 description 1
- 102000007999 Nuclear Proteins Human genes 0.000 description 1
- 108010089610 Nuclear Proteins Proteins 0.000 description 1
- 108091005461 Nucleic proteins Chemical group 0.000 description 1
- 241000283973 Oryctolagus cuniculus Species 0.000 description 1
- 108090000526 Papain Proteins 0.000 description 1
- OHUXOEXBXPZKPT-STQMWFEESA-N Phe-His Chemical compound C([C@H](N)C(=O)N[C@@H](CC=1N=CNC=1)C(O)=O)C1=CC=CC=C1 OHUXOEXBXPZKPT-STQMWFEESA-N 0.000 description 1
- 208000002163 Phyllodes Tumor Diseases 0.000 description 1
- 206010071776 Phyllodes tumour Diseases 0.000 description 1
- 102000052575 Proto-Oncogene Human genes 0.000 description 1
- 108700020978 Proto-Oncogene Proteins 0.000 description 1
- 230000006819 RNA synthesis Effects 0.000 description 1
- 206010039491 Sarcoma Diseases 0.000 description 1
- 238000012300 Sequence Analysis Methods 0.000 description 1
- SSJMZMUVNKEENT-IMJSIDKUSA-N Ser-Ala Chemical compound OC(=O)[C@H](C)NC(=O)[C@@H](N)CO SSJMZMUVNKEENT-IMJSIDKUSA-N 0.000 description 1
- MOVJSUIKUNCVMG-ZLUOBGJFSA-N Ser-Cys-Ser Chemical compound C([C@@H](C(=O)N[C@@H](CS)C(=O)N[C@@H](CO)C(=O)O)N)O MOVJSUIKUNCVMG-ZLUOBGJFSA-N 0.000 description 1
- KDGARKCAKHBEDB-NKWVEPMBSA-N Ser-Gly-Pro Chemical compound C1C[C@@H](N(C1)C(=O)CNC(=O)[C@H](CO)N)C(=O)O KDGARKCAKHBEDB-NKWVEPMBSA-N 0.000 description 1
- RJHJPZQOMKCSTP-CIUDSAMLSA-N Ser-His-Asn Chemical compound [H]N[C@@H](CO)C(=O)N[C@@H](CC1=CNC=N1)C(=O)N[C@@H](CC(N)=O)C(O)=O RJHJPZQOMKCSTP-CIUDSAMLSA-N 0.000 description 1
- 102220497176 Small vasohibin-binding protein_T47D_mutation Human genes 0.000 description 1
- 108010085012 Steroid Receptors Proteins 0.000 description 1
- 229940123237 Taxane Drugs 0.000 description 1
- YBXMGKCLOPDEKA-NUMRIWBASA-N Thr-Asp-Glu Chemical compound [H]N[C@@H]([C@@H](C)O)C(=O)N[C@@H](CC(O)=O)C(=O)N[C@@H](CCC(O)=O)C(O)=O YBXMGKCLOPDEKA-NUMRIWBASA-N 0.000 description 1
- CUTPSEKWUPZFLV-WISUUJSJSA-N Thr-Cys Chemical compound C[C@@H](O)[C@H](N)C(=O)N[C@@H](CS)C(O)=O CUTPSEKWUPZFLV-WISUUJSJSA-N 0.000 description 1
- ZMYCLHFLHRVOEA-HEIBUPTGSA-N Thr-Thr-Ser Chemical compound C[C@@H](O)[C@H](N)C(=O)N[C@@H]([C@@H](C)O)C(=O)N[C@@H](CO)C(O)=O ZMYCLHFLHRVOEA-HEIBUPTGSA-N 0.000 description 1
- 102000040945 Transcription factor Human genes 0.000 description 1
- 108091023040 Transcription factor Proteins 0.000 description 1
- KBUBZAMBIVEFEI-ZFWWWQNUSA-N Trp-His Chemical compound C([C@H](NC(=O)[C@H](CC=1C2=CC=CC=C2NC=1)N)C(O)=O)C1=CNC=N1 KBUBZAMBIVEFEI-ZFWWWQNUSA-N 0.000 description 1
- SWSUXOKZKQRADK-FDARSICLSA-N Trp-Val-Ile Chemical compound CC[C@H](C)[C@@H](C(=O)O)NC(=O)[C@H](C(C)C)NC(=O)[C@H](CC1=CNC2=CC=CC=C21)N SWSUXOKZKQRADK-FDARSICLSA-N 0.000 description 1
- QJKMCQRFHJRIPU-XDTLVQLUSA-N Tyr-Ile Chemical compound CC[C@H](C)[C@@H](C(O)=O)NC(=O)[C@@H](N)CC1=CC=C(O)C=C1 QJKMCQRFHJRIPU-XDTLVQLUSA-N 0.000 description 1
- HVPPEXXUDXAPOM-MGHWNKPDSA-N Tyr-Ile-Leu Chemical compound CC(C)C[C@@H](C(O)=O)NC(=O)[C@H]([C@@H](C)CC)NC(=O)[C@@H](N)CC1=CC=C(O)C=C1 HVPPEXXUDXAPOM-MGHWNKPDSA-N 0.000 description 1
- CGWAPUBOXJWXMS-HOTGVXAUSA-N Tyr-Phe Chemical compound C([C@H](N)C(=O)N[C@@H](CC=1C=CC=CC=1)C(O)=O)C1=CC=C(O)C=C1 CGWAPUBOXJWXMS-HOTGVXAUSA-N 0.000 description 1
- LUMQYLVYUIRHHU-YJRXYDGGSA-N Tyr-Ser-Thr Chemical compound [H]N[C@@H](CC1=CC=C(O)C=C1)C(=O)N[C@@H](CO)C(=O)N[C@@H]([C@@H](C)O)C(O)=O LUMQYLVYUIRHHU-YJRXYDGGSA-N 0.000 description 1
- FZADUTOCSFDBRV-RNXOBYDBSA-N Tyr-Tyr-Trp Chemical compound C([C@H](N)C(=O)N[C@@H](CC=1C=CC(O)=CC=1)C(=O)N[C@@H](CC=1C2=CC=CC=C2NC=1)C(O)=O)C1=CC=C(O)C=C1 FZADUTOCSFDBRV-RNXOBYDBSA-N 0.000 description 1
- PAPWZOJOLKZEFR-AVGNSLFASA-N Val-Arg-Lys Chemical compound CC(C)[C@@H](C(=O)N[C@@H](CCCN=C(N)N)C(=O)N[C@@H](CCCCN)C(=O)O)N PAPWZOJOLKZEFR-AVGNSLFASA-N 0.000 description 1
- XXDVDTMEVBYRPK-XPUUQOCRSA-N Val-Gln Chemical compound CC(C)[C@H](N)C(=O)N[C@H](C(O)=O)CCC(N)=O XXDVDTMEVBYRPK-XPUUQOCRSA-N 0.000 description 1
- GVJUTBOZZBTBIG-AVGNSLFASA-N Val-Lys-Arg Chemical compound CC(C)[C@@H](C(=O)N[C@@H](CCCCN)C(=O)N[C@@H](CCCN=C(N)N)C(=O)O)N GVJUTBOZZBTBIG-AVGNSLFASA-N 0.000 description 1
- ZEBRMWPTJNHXAJ-JYJNAYRXSA-N Val-Phe-Met Chemical compound CC(C)[C@@H](C(=O)N[C@@H](CC1=CC=CC=C1)C(=O)N[C@@H](CCSC)C(=O)O)N ZEBRMWPTJNHXAJ-JYJNAYRXSA-N 0.000 description 1
- VBTFUDNTMCHPII-FKBYEOEOSA-N Val-Trp-Tyr Chemical compound CC(C)[C@H](N)C(=O)N[C@@H](Cc1c[nH]c2ccccc12)C(=O)N[C@@H](Cc1ccc(O)cc1)C(O)=O VBTFUDNTMCHPII-FKBYEOEOSA-N 0.000 description 1
- VBTFUDNTMCHPII-UHFFFAOYSA-N Val-Trp-Tyr Natural products C=1NC2=CC=CC=C2C=1CC(NC(=O)C(N)C(C)C)C(=O)NC(C(O)=O)CC1=CC=C(O)C=C1 VBTFUDNTMCHPII-UHFFFAOYSA-N 0.000 description 1
- 241000251539 Vertebrata <Metazoa> Species 0.000 description 1
- 230000004913 activation Effects 0.000 description 1
- 238000011374 additional therapy Methods 0.000 description 1
- 230000004931 aggregating effect Effects 0.000 description 1
- 238000011366 aggressive therapy Methods 0.000 description 1
- 108010086434 alanyl-seryl-glycine Proteins 0.000 description 1
- 230000001476 alcoholic effect Effects 0.000 description 1
- 210000003484 anatomy Anatomy 0.000 description 1
- 108010040443 aspartyl-aspartic acid Proteins 0.000 description 1
- 238000011888 autopsy Methods 0.000 description 1
- 238000002869 basic local alignment search tool Methods 0.000 description 1
- 230000009286 beneficial effect Effects 0.000 description 1
- 230000008901 benefit Effects 0.000 description 1
- 229960000074 biopharmaceutical Drugs 0.000 description 1
- 230000000903 blocking effect Effects 0.000 description 1
- 201000008275 breast carcinoma Diseases 0.000 description 1
- 201000005389 breast carcinoma in situ Diseases 0.000 description 1
- 230000004663 cell proliferation Effects 0.000 description 1
- 230000001413 cellular effect Effects 0.000 description 1
- 238000006243 chemical reaction Methods 0.000 description 1
- 239000005081 chemiluminescent agent Substances 0.000 description 1
- 238000002512 chemotherapy Methods 0.000 description 1
- 239000000084 colloidal system Substances 0.000 description 1
- 239000003086 colorant Substances 0.000 description 1
- 238000004883 computer application Methods 0.000 description 1
- 238000010276 construction Methods 0.000 description 1
- 239000013068 control sample Substances 0.000 description 1
- 201000011063 cribriform carcinoma Diseases 0.000 description 1
- 238000011498 curative surgery Methods 0.000 description 1
- 229960004397 cyclophosphamide Drugs 0.000 description 1
- 238000012303 cytoplasmic staining Methods 0.000 description 1
- 230000001086 cytosolic effect Effects 0.000 description 1
- 230000001419 dependent effect Effects 0.000 description 1
- SOCTUWSJJQCPFX-UHFFFAOYSA-N dichromate(2-) Chemical compound [O-][Cr](=O)(=O)O[Cr]([O-])(=O)=O SOCTUWSJJQCPFX-UHFFFAOYSA-N 0.000 description 1
- 230000004069 differentiation Effects 0.000 description 1
- 230000029087 digestion Effects 0.000 description 1
- 239000000539 dimer Substances 0.000 description 1
- 238000010494 dissociation reaction Methods 0.000 description 1
- 230000005593 dissociations Effects 0.000 description 1
- 229960003668 docetaxel Drugs 0.000 description 1
- 230000009977 dual effect Effects 0.000 description 1
- 201000007273 ductal carcinoma in situ Diseases 0.000 description 1
- YQGOJNYOYNNSMM-UHFFFAOYSA-N eosin Chemical compound [Na+].OC(=O)C1=CC=CC=C1C1=C2C=C(Br)C(=O)C(Br)=C2OC2=C(Br)C(O)=C(Br)C=C21 YQGOJNYOYNNSMM-UHFFFAOYSA-N 0.000 description 1
- 210000000981 epithelium Anatomy 0.000 description 1
- 229960005309 estradiol Drugs 0.000 description 1
- 238000011156 evaluation Methods 0.000 description 1
- 238000000799 fluorescence microscopy Methods 0.000 description 1
- 230000012010 growth Effects 0.000 description 1
- 108010092114 histidylphenylalanine Proteins 0.000 description 1
- 210000003917 human chromosome Anatomy 0.000 description 1
- 238000003703 image analysis method Methods 0.000 description 1
- 238000012744 immunostaining Methods 0.000 description 1
- 201000004933 in situ carcinoma Diseases 0.000 description 1
- 230000002779 inactivation Effects 0.000 description 1
- 230000005764 inhibitory process Effects 0.000 description 1
- 230000003834 intracellular effect Effects 0.000 description 1
- 102000027411 intracellular receptors Human genes 0.000 description 1
- 108091008582 intracellular receptors Proteins 0.000 description 1
- 208000030776 invasive breast carcinoma Diseases 0.000 description 1
- 230000001788 irregular Effects 0.000 description 1
- 230000007246 mechanism Effects 0.000 description 1
- 208000023356 medullary thyroid gland carcinoma Diseases 0.000 description 1
- 230000001394 metastastic effect Effects 0.000 description 1
- 206010061289 metastatic neoplasm Diseases 0.000 description 1
- 238000001000 micrograph Methods 0.000 description 1
- 239000000203 mixture Substances 0.000 description 1
- 238000013188 needle biopsy Methods 0.000 description 1
- 230000001613 neoplastic effect Effects 0.000 description 1
- 229920001220 nitrocellulos Polymers 0.000 description 1
- 108091008584 nuclear progesterone receptors Proteins 0.000 description 1
- 201000010198 papillary carcinoma Diseases 0.000 description 1
- 230000008506 pathogenesis Effects 0.000 description 1
- 239000013610 patient sample Substances 0.000 description 1
- 229940111202 pepsin Drugs 0.000 description 1
- 102000054765 polymorphisms of proteins Human genes 0.000 description 1
- 238000012805 post-processing Methods 0.000 description 1
- 238000002360 preparation method Methods 0.000 description 1
- 239000000186 progesterone Substances 0.000 description 1
- 229960003387 progesterone Drugs 0.000 description 1
- 230000035755 proliferation Effects 0.000 description 1
- 239000002096 quantum dot Substances 0.000 description 1
- 230000005855 radiation Effects 0.000 description 1
- 230000002285 radioactive effect Effects 0.000 description 1
- 238000003127 radioimmunoassay Methods 0.000 description 1
- 238000013390 scatchard method Methods 0.000 description 1
- 238000002864 sequence alignment Methods 0.000 description 1
- 238000002798 spectrophotometry method Methods 0.000 description 1
- 238000010972 statistical evaluation Methods 0.000 description 1
- 102000005969 steroid hormone receptors Human genes 0.000 description 1
- 210000002536 stromal cell Anatomy 0.000 description 1
- 229960001603 tamoxifen Drugs 0.000 description 1
- DKPFODGZWDEEBT-QFIAKTPHSA-N taxane Chemical class C([C@]1(C)CCC[C@@H](C)[C@H]1C1)C[C@H]2[C@H](C)CC[C@@H]1C2(C)C DKPFODGZWDEEBT-QFIAKTPHSA-N 0.000 description 1
- 210000000779 thoracic wall Anatomy 0.000 description 1
- 230000001131 transforming effect Effects 0.000 description 1
- 108010029384 tryptophyl-histidine Proteins 0.000 description 1
- 201000007423 tubular adenocarcinoma Diseases 0.000 description 1
- 239000000439 tumor marker Substances 0.000 description 1
- 238000010200 validation analysis Methods 0.000 description 1
- 238000001262 western blot Methods 0.000 description 1
Images


Classifications
-
- G—PHYSICS
- G16—INFORMATION AND COMMUNICATION TECHNOLOGY [ICT] SPECIALLY ADAPTED FOR SPECIFIC APPLICATION FIELDS
- G16H—HEALTHCARE INFORMATICS, i.e. INFORMATION AND COMMUNICATION TECHNOLOGY [ICT] SPECIALLY ADAPTED FOR THE HANDLING OR PROCESSING OF MEDICAL OR HEALTHCARE DATA
- G16H50/00—ICT specially adapted for medical diagnosis, medical simulation or medical data mining; ICT specially adapted for detecting, monitoring or modelling epidemics or pandemics
- G16H50/30—ICT specially adapted for medical diagnosis, medical simulation or medical data mining; ICT specially adapted for detecting, monitoring or modelling epidemics or pandemics for calculating health indices; for individual health risk assessment
-
- G—PHYSICS
- G01—MEASURING; TESTING
- G01N—INVESTIGATING OR ANALYSING MATERIALS BY DETERMINING THEIR CHEMICAL OR PHYSICAL PROPERTIES
- G01N33/00—Investigating or analysing materials by specific methods not covered by groups G01N1/00 - G01N31/00
- G01N33/48—Biological material, e.g. blood, urine; Haemocytometers
- G01N33/50—Chemical analysis of biological material, e.g. blood, urine; Testing involving biospecific ligand binding methods; Immunological testing
- G01N33/53—Immunoassay; Biospecific binding assay; Materials therefor
- G01N33/574—Immunoassay; Biospecific binding assay; Materials therefor for cancer
- G01N33/57407—Specifically defined cancers
- G01N33/57415—Specifically defined cancers of breast
-
- G—PHYSICS
- G16—INFORMATION AND COMMUNICATION TECHNOLOGY [ICT] SPECIALLY ADAPTED FOR SPECIFIC APPLICATION FIELDS
- G16B—BIOINFORMATICS, i.e. INFORMATION AND COMMUNICATION TECHNOLOGY [ICT] SPECIALLY ADAPTED FOR GENETIC OR PROTEIN-RELATED DATA PROCESSING IN COMPUTATIONAL MOLECULAR BIOLOGY
- G16B30/00—ICT specially adapted for sequence analysis involving nucleotides or amino acids
-
- G—PHYSICS
- G16—INFORMATION AND COMMUNICATION TECHNOLOGY [ICT] SPECIALLY ADAPTED FOR SPECIFIC APPLICATION FIELDS
- G16H—HEALTHCARE INFORMATICS, i.e. INFORMATION AND COMMUNICATION TECHNOLOGY [ICT] SPECIALLY ADAPTED FOR THE HANDLING OR PROCESSING OF MEDICAL OR HEALTHCARE DATA
- G16H30/00—ICT specially adapted for the handling or processing of medical images
- G16H30/20—ICT specially adapted for the handling or processing of medical images for handling medical images, e.g. DICOM, HL7 or PACS
-
- G—PHYSICS
- G16—INFORMATION AND COMMUNICATION TECHNOLOGY [ICT] SPECIALLY ADAPTED FOR SPECIFIC APPLICATION FIELDS
- G16H—HEALTHCARE INFORMATICS, i.e. INFORMATION AND COMMUNICATION TECHNOLOGY [ICT] SPECIALLY ADAPTED FOR THE HANDLING OR PROCESSING OF MEDICAL OR HEALTHCARE DATA
- G16H50/00—ICT specially adapted for medical diagnosis, medical simulation or medical data mining; ICT specially adapted for detecting, monitoring or modelling epidemics or pandemics
- G16H50/20—ICT specially adapted for medical diagnosis, medical simulation or medical data mining; ICT specially adapted for detecting, monitoring or modelling epidemics or pandemics for computer-aided diagnosis, e.g. based on medical expert systems
-
- G—PHYSICS
- G01—MEASURING; TESTING
- G01N—INVESTIGATING OR ANALYSING MATERIALS BY DETERMINING THEIR CHEMICAL OR PHYSICAL PROPERTIES
- G01N2800/00—Detection or diagnosis of diseases
- G01N2800/52—Predicting or monitoring the response to treatment, e.g. for selection of therapy based on assay results in personalised medicine; Prognosis
-
- G—PHYSICS
- G01—MEASURING; TESTING
- G01N—INVESTIGATING OR ANALYSING MATERIALS BY DETERMINING THEIR CHEMICAL OR PHYSICAL PROPERTIES
- G01N2800/00—Detection or diagnosis of diseases
- G01N2800/54—Determining the risk of relapse
Definitions
- This application relates to a method for prognosing breast cancer, such as early stage breast cancer.
- Ventana Medical Systems, Inc., Cleveland Clinic, and the University of Melbourne are parties to joint research agreements governing inventions disclosed herein.
- the present application provides methods of prognosing or prognosticating breast cancer in a subject.
- the methods of the invention comprise selecting in a breast cancer sample obtained from the subject at least two different fields of view (FOVs) for each of estrogen receptor (ER), human epidermal growth factor receptor 2 (HER2), Ki-67 and progesterone receptor (PR), wherein the sample is detectably labeled with antibodies for each of ER, HER2, Ki-67 and PR; measuring ER, HER2, Ki-67 and PR protein expression in each of the selected FOV; determining an immunohistochemistry (IHC) combination score; measuring ER and PR protein heterogeneity in each of the selected FOVs; determining a protein heterogeneity score for each of ER and PR; combining the protein heterogeneity score and the IHC combination score, thereby generating an output prognosis score; and determining that the breast cancer in the subject is likely to be aggressive if the output prognosis score meets a threshold value or determining that the breast cancer in the subject is
- Digital fields of view in images of a breast cancer sample from a subject detectably labeled with antibodies for a biomarker can be received and processed to measure protein heterogeneity for the biomarker.
- Heterogeneity measurements can be combined with an immunohistochemistry combination score to generate a breast cancer recurrence prognosis score.
- Such a score can provide more information than the immunohistochemistry combination score standing alone.
- a digital pathologist workflow can be supported to facilitate field of view selection on images.
- Dates of GenBank Accession Nos. referred to herein are the sequences available at least as early as December 28, 2012.
- Antibody Immunoglobulin molecules and immunologically active portions of immunoglobulin molecules, that is, molecules that contain an antigen binding site that specifically binds (immunoreacts with) an antigen (such as ER, PR, Ki-67 or HER2).
- antigen such as ER, PR, Ki-67 or HER2.
- Exemplary antibodies include monoclonal, polyclonal, and humanized antibodies.
- a naturally occurring antibody includes four polypeptide chains, two heavy (H) chains and two light (L) chains interconnected by disulfide bonds.
- the term antibody also includes recombinant antibodies produced by expression of a nucleic acid that encodes one or more antibody chains in a cell (for example see U.S. Patent No. 4,745,055 ; U.S. Patent No. 4,444,487 ; WO 88/03565 ; EP 256,654 ; EP 120,694 ; EP 125,023 ; Faoulkner et al., Nature 298:286, 1982 ; Morrison, J. Immunol. 123:793, 1979 ; Morrison et al., Ann Rev. Immunol 2:239, 1984 ).
- antibody also includes an antigen binding fragment of a naturally occurring or recombinant antibody.
- binding fragments encompassed within the term antibody include Fab, (Fab') 2 , Fv, and single-chain Fv (scFv).
- Fab is the fragment that contains a monovalent antigen-binding fragment of an antibody molecule produced by digestion of whole antibody with the enzyme papain to yield an intact light chain and a portion of one heavy chain or equivalently by genetic engineering.
- Fab' is the fragment of an antibody molecule obtained by treating whole antibody with pepsin, followed by reduction, to yield an intact light chain and a portion of the heavy chain; two Fab' fragments are obtained per antibody molecule.
- (Fab') 2 is the fragment of the antibody obtained by treating whole antibody with the enzyme pepsin without subsequent reduction or equivalently by genetic engineering.
- F(Ab') 2 is a dimer of two FAb' fragments held together by disulfide bonds.
- Fv is a genetically engineered fragment containing the variable region of the light chain and the variable region of the heavy chain expressed as two chains.
- Single chain antibody (“SCA”) is a genetically engineered molecule containing the variable region of the light chain, the variable region of the heavy chain, linked by a suitable polypeptide linker as a genetically fused single chain molecule. Methods of making these fragments are routine in the art.
- Binding affinity Affinity of an antibody for an antigen, such as the affinity of an antibody for an ER, PR, Ki-67 or HER2 peptide.
- Methods of determining antibody affinity include calculation by a modification of the Scatchard method described by Frankel et al., Mol. Immunol., 16:101-106, 1979 , measurement by an antigen/antibody dissociation rate, or by a competition radioimmunoassay.
- a high binding affinity can be at least about 1 x 10 -8 M, at least about 1.5 x 10 -8 , at least about 2.0 x 10 -8 , at least about 2.5 x 10- 8 , at least about 3.0 x 10 -8 , at least about 3.5 x 10 -8 , at least about 4.0 x 10 -8 , at least about 4.5 x 10 -8 , or at least about 5.0 x 10 -8 M.
- Breast cancer Includes any tumor of the breast, such as tumors at, near, or inclusive of epithelial (carcinoma) or stromal (sarcoma) breast tissue.
- Ductal carcinoma in situ (DCIS) is a non-invasive neoplastic condition of the ducts.
- Lobular carcinoma is not an invasive disease but is an indicator that a carcinoma may develop.
- Infiltrating (malignant) carcinoma of the breast can be divided into stages (I, IIA, IIB, IIIA, IIIB, and IV). See, for example, Bonadonna et al., (eds), Textbook of Breast Cancer: A clinical Guide the Therapy, 3rd; London, Tayloy & Francis, 2006 .
- DCIS is sometimes called Stage 0 breast cancer because it is not invasive.
- Exemplary invasive breast carcinomas include carcinoma NOS (not otherwise specified), lobular carcinoma, tubular/cribriform carcinoma, mucinous (colloid) carcinoma, medullary carcinoma, papillary carcinoma, and metaplastic carcinoma.
- An exemplary breast sarcoma is phyllodes tumor.
- An early stage breast cancer is one that is stage I or II.
- a breast tissue sample for example, that is ER positive, lymph node negative, and, in some examples, HER2 negative may also be characterized as early stage breast cancer.
- Exemplary therapies for breast cancer include surgery (e.g., removal of some or all of the tumor), hormone blocking therapy (e.g., tamoxifen), radiation, cyclophosphamide plus doxorubicin (Adriamycin), taxane (e.g., docetaxel), and monoclonal antibodies such as trastuzumab (Herceptin) or pertuzumab, or combinations thereof.
- hormone blocking therapy e.g., tamoxifen
- radiation cyclophosphamide plus doxorubicin (Adriamycin), taxane (e.g., docetaxel)
- monoclonal antibodies such as trastuzumab (Herceptin) or pertuzumab, or combinations thereof.
- Control A sample or standard used for comparison with an experimental or test sample (such as a breast sample).
- the control is a normal sample obtained from a healthy patient (or plurality of patients), such as a normal breast sample or plurality of samples.
- the control is a non-tumor tissue sample obtained from a patient diagnosed with breast cancer, such as normal breast tissue.
- the control is a known early stage breast cancer sample (or plurality of samples), such as a sample known to be ER+, PR+, Ki-67+, and HER2-.
- control is a historical control or standard reference value or range of values (such as a previously tested control sample(s), such as a known breast cancer, normal breast sample, benign breast sample, epithelium, or stroma).
- control is a standard value representing the average value (or average range of values) obtained from a plurality of patient samples, such as known normal breast samples or known early breast cancer samples.
- Control samples can be used for staining control. Such an approach can be relevant to identifying the signal-to-noise ratio of the sample.
- an antibody can be applied to a microscope slide or other surface containing a biological sample, thereby permitting detection of proteins in the sample that are specifically recognized by the antibody.
- Detect To determine if an agent is present or absent, and can include determining a pattern. In some examples this can further include quantification. For example, use of an antibody specific for a particular protein (e.g., Ki-67, ER, PR, or HER2) permits detection of the protein in a sample, such as a sample containing breast cancer tissue. In particular examples, an emission signal from a detectable label (such as an increase in the signal if the target is present) is detected.
- a detectable label such as an increase in the signal if the target is present
- Detection can be in bulk, so that a macroscopic number of molecules can be observed simultaneously. Detection can also include identification of signals from single molecules using microscopy and such techniques as total internal reflection to reduce background noise.
- Estrogen receptor A member of the nuclear hormone family of intracellular receptors is activated by 17 ⁇ -estradiol. Estrogen receptors are overexpressed in around 70% of breast cancer cases, referred to as "ER positive" (ER+).
- H-Score An indication of protein expression that weights strongly stained cells more heavily than weakly stained cells.
- an H-score can indicate the percentage of cells staining weakly ( e . g ., 1+) plus two times the percentage of cells staining moderately ( e . g ., 2+) plus three times the percentage of cells staining strongly ( e.g., 3+) (for example see Cuzick et al., J. Clin. Oncol. 29:4273-8, 2011 , incorporated herein by reference) (also see www.pathogenesys.com/html/semiquantitative_ihc.html). Exemplary H-score calculation techniques are described herein.
- Heterogeneity score An indication of the amount of protein expression heterogeneity of a biomarker in a sample, such as ER, HER2, Ki-67, or PR staining in a breast cancer sample.
- the heterogeneity score provides a measure of how different one FOV is from another FOV, for the same marker.
- HER2 Human epidermal growth factor receptor 2
- ErbB protein family which is a proto-oncogene located at the long arm of human chromosome 17(17q11.2-q12).
- HER2 positive HER2+ patients can receive the monoclonal antibody trastuzumab (Herceptin) as a therapy for breast cancer, and in some examples is used in combination with the monoclonal antibody Pertuzumab.
- trastuzumab Herceptin
- Overexpression of HER2 in breast cancer has been associated with increased disease recurrence and a worse prognosis.
- Immunohistochemistry (IHC) combination score A prognostic score based on a number of IHC markers, wherein the number of markers is greater than one.
- IHC4 is one such score based on four measured IHC markers, namely ER, HER2, Ki-67, and PR in a breast cancer sample (for example see Cuzick et al., J. Clin. Oncol. 29:4273-8, 2011 , and Barton et al., Br. J. Cancer 1-6, April 24, 2012 , both herein incorporated by reference).
- IHC combination scores e.g., IHC3, IHC5, or the like.
- Ki-67 A nuclear protein associated with cellular proliferation and ribosomal RNA transcription. Inactivation of antigen Ki-67 leads to inhibition of ribosomal RNA synthesis. Ki-67 is used, for example, as a marker of proliferation.
- Label An agent capable of detection, for example by spectrophotometry, flow cytometry, or microscopy (such as light microscopy).
- one or more labels can be attached to an antibody, thereby permitting detection of the target protein.
- Exemplary labels include radioactive isotopes, fluorophores, ligands, chemiluminescent agents, enzymes, and combinations thereof.
- the label is a quantum dot.
- Normal cells or tissue Non-tumor, non-malignant cells and tissue.
- Output Prognosis Score The result of combining and weighting IHC combination ( e . g ., IHC4) scores and heterogeneity scores for a subject, from which breast cancer prognosis can be determined.
- Progesterone receptor An intracellular steroid receptor that specifically binds progesterone. Progesterone receptors are overexpressed in some breast cancer cases, referred to as "PR positive" (PR+).
- Prognose The process of determining the likely outcome of a subject having a disease (e . g ., early stage breast cancer) in the absence of additional therapy.
- the disclosed methods allow for prognosis of a more aggressive form of an early stage breast cancer if an output prognosis score above a threshold is detected.
- prognosis of a less aggressive form of an early stage breast cancer is prognosed if an output prognosis score below a threshold is detected.
- the prognosis can relate to predicting future events, such as life expectancy ( e .
- Quantify To express as a numerical amount, whether an actual amount or a relative amount.
- Sample A biological specimen that may contain, for example, genomic DNA, RNA (e . g ., mRNA), protein, or combinations thereof, obtained from a subject. Examples include, but are not limited to, fine needle aspirate, tissue biopsy, surgical specimen, and autopsy material. In one example, a sample includes breast tissue, such as that obtained during a needle biopsy, lumpectomy, or mastectomy.
- a cancer such as breast cancer
- breast cancer can be staged to describe the extent or severity of a cancer based on the extent of the original (primary) tumor and the extent of spread in the body.
- Breast cancer can be staged according to the TNM system (see the AJCC Staging Manual), where T describes the size of the tumor and whether it has invaded nearby tissue, N describes any lymph nodes that are involved, and M describes metastasis (spread of cancer from one body part to another).
- Stage 0 - Carcinoma in situ does not involve axillary lymph nodes (N); Stage IIA - T 2-5 cm, N negative, or T ⁇ 2 cm and N positive; Stage IIB - T > 5 cm, N negative, or T 2-5 cm and N positive ( ⁇ 4 axillary nodes); Stage IIIA - T > 5 cm, N positive, or T 2-5 cm with 4 or more axillary nodes; Stage IIIB - T has penetrated chest wall or skin, and may have spread to ⁇ 10 axillary N; Stage IIIC - T has > 10 axillary N, 1 or more supraclavicular or infraclavicular N, or internal mammary N; and Stage IV - Distant metastasis (M).
- Subject Living multi-cellular vertebrate organisms, a category that includes human and non-human mammals, such as veterinary subjects.
- a subject is one who had or is suspected of having had breast cancer, such as an early stage breast cancer.
- Target molecule A biomolecule whose detection or measurement is desired, such as a breast cancer marker.
- target molecules include ER, PR, Ki-67 and HER2.
- a phrase that is used to describe any environment that permits the desired activity includes contacting an antibody with a breast cancer sample sufficient to allow detection of one or more target molecules (e . g ., ER, PR, HER2, Ki-67) in the sample and can include quantification of one or more target molecules in the sample.
- target molecules e . g ., ER, PR, HER2, Ki-67
- FIG. 1 is a block diagram of an exemplary system for carrying out the technologies described herein.
- an image acquisition device 10 such as a slide scanner (e.g., iScan Coreo of Ventana Medical Systems, Inc. or the like) is operable to accept a slide 5 prepared as described herein and generate an image of the slide 5 for analysis as described herein.
- a slide scanner e.g., iScan Coreo of Ventana Medical Systems, Inc. or the like
- a slide scanner e.g., iScan Coreo of Ventana Medical Systems, Inc. or the like
- a plurality of slides is used as described herein.
- the computing system 20 can include one or more input devices 23, one or more displays 24, and one or more computers 21, which can execute an image processing application or platform as described herein.
- Data such as scanned images, can be stored, for example, remotely at a server 12 and/or within a computer 21.
- Image acquisition can be separately from (e.g., in a different system, by a different actor, or the like) image processing.
- a cloud-based or software-as-a-service scenario can be implemented, in which the image processing application 22 resides partially or wholly outside the computer 21 (e.g., at the server 12 or one or more other servers).
- breast cancers for example, early stage breast cancers
- an immunohistochemistry (IHC) combination score such as an IHC4
- a heterogeneity score e.g., a score that is more aggressive or more likely to recur
- an output prognosis score is below a threshold value indicates that the breast cancer is less aggressive and less likely to recur.
- the output prognosis may be beneficial in determining an appropriate therapy (e . g ., choosing between monitoring, a mastectomy, lumpectomy, or a lumpectomy combined with chemotherapy).
- the breast cancer is known to be estrogen receptor positive (ER+), progesterone receptor positive (PR+), and human epidermal growth factor receptor 2 negative (HER2-) or human epidermal growth factor receptor 2 positive (HER2+).
- the methods can be used to determine the likely aggressiveness of the cancer, or the likelihood that the cancer will recur, for example the likelihood that the cancer will recur within 5 years.
- Technologies herein can generate an IHC combination score and a heterogeneity score based on indicated fields of view on images of one or more slides having breast cancer tissue taken from a subject. The scores can then be combined to generate a prognosis score as described herein. Various intermediary calculations and/or scores can be generated before arriving at the IHC combination score or heterogeneity score as described herein.
- a breast cancer tissue sample is taken from a subject.
- the breast cancer sample is an early stage breast cancer sample, such as one that is HER2 negative (e.g., IHC staining less than 2+ as described herein) and/or FISH amplified, ER positive, and/or lymph node negative.
- a HER2 negative sample can be one that (1) shows some IHC staining, such as staining that is less than 2+ or an H-score of ⁇ 1, or (2) is amplified as indicated by FISH analysis, but is one a clinician or a pathologist would conclude was HER2 negative anyway.
- the sample may, alternatively, be HER2 positive.
- ISH in situ hybridization
- CISH chromogenic in situ hybridization
- DISH dual color chromogenic in situ hybridization
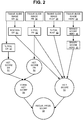
- FIG. 2 is a block diagram showing how images 32, 34, 36, and 38 of slides stained for different proteins are used to generate a breast cancer recurrence prognosis score 58.
- a tissue microarray approach as described herein can be employed, resulting in fewer slides.
- a single slide can include a plurality of different tissue sections, which can each be analyzed for a different protein.
- a single tissue section can be analyzed for a plurality of proteins.
- a sample for example a tissue block, is divided into sections, for example, four sections, which may or may not be adjacent or serial sections from the sample.
- Agents specific for the biomarkers of interest for example, probes or stains, are applied to each section.
- an agent specific for the estrogen receptor ER is applied to one section, an agent specific for the PR applied to another section, and the like.
- exemplary agents include antibodies and aptamers.
- the sample can be detectably labeled with antibodies specific for each of ER, HER2, Ki-67, and PR.
- Images 32, 24, 36, and 38 of the sample sections are then acquired as described herein. From the images 32, 34, 36, and 38, an H-score for ER 41, a percent positivity for PR 42, a percent positivity for Ki-67 43, and a binned score for HER2 44 are calculated.
- the binned score 44 can be converted into a binary score (e.g., 0 or 1) 45.
- the scores are then combined as described herein to generate an IHC4 score 55.
- the heterogeneity score for ER 51 relies on a percent positivity determination for ER 47, and the heterogeneity score for PR 52 relies on a percent positivity determination for PR 42.
- the heterogeneity scores 51 and 52 can be combined as described herein to generate a combined heterogeneity score 54.
- the IHC4 score 55 and the combined heterogeneity score 54 can then be combined to generate a breast cancer recurrence prognosis score 58.
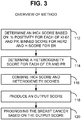
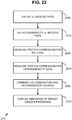
- FIG. 3 provides an overview of an exemplary method.
- the method includes determining an IHC4 score via measured expression for each of ER, Ki-67, PR, and HER2 112, for example by determining or measuring a percent positivity for each of PR and Ki-67, a binned score for HER2 (for example on a typical 0 to 3 scale to represent the intensity, wherein 0 is assigned to negative staining, 3 being assigned to very intensely stained samples), and an H-score for ER.
- the method also includes determining a heterogeneity score for at least ER and PR, and in some examples also Ki-67 and HER2 114.
- the resulting IHC4 score 112 and heterogeneity score 114 are combined 116 to produce an output prognosis score 118. Based on the output prognosis score, the breast cancer is prognosed 120.
- each slide is scanned, and a digital image is generated of each slide using any of the systems described herein.
- An IHC combination score is generated by a computer-implemented method based on the slides, and a heterogeneity score is generated for each slide (or section of the slide being analyzed, such as a region containing a tissue section for ER analysis).
- the IHC combination score is referred to as the "IHC4 score," as four biomarkers are utilized to capture information.
- the IHC4 score can be combined with the heterogeneity scores as described herein to generate a breast cancer recurrence prognosis score.
- the method includes selecting, in the image of each of the tissue section on one or more slides from the breast cancer sample that has been labeled with an agent (such as an antibody), at least two different fields of view (FOV) for each of an ER tissue section slide image, a HER2 tissue section slide image, a Ki-67 tissue section slide image, and a PR tissue section slide image.
- an agent such as an antibody
- FOV fields of view
- three (3) FOVs are selected, for each slide or section, to compute the IHC4 score. Tumorous regions are chosen as fields of view.
- FIG. 4A shows an exemplary set of slide images 180 and annotations by which fields of view (FOV) 181A, 181B, and 181C are selected (e.g., by a pathologist) on respective of the slide images for calculating an IHC combination score.
- FOV fields of view
- the annotations can be independent with no relation between fields of view from one biomarker to the other.
- the fields of view are rectangular. However, as described herein, other techniques can be used (e.g., the fields of view can be other known shapes or irregular shapes).
- the field of view is an area of interest, such as an anatomic region of interest ( e . g ., gland).
- the field of view is a whole slide or whole tissue section.
- an IHC combination score is calculated.
- the fields of view can be taken together (e . g ., combined and/or considered collectively) for a particular biomarker.
- H-score, percent positivity, and HER2 binned score can be based on respective sets of fields of view taken together (e.g., the H-score for ER is based on the cells observed in the fields of view).
- Other techniques are possible (e.g., averaging scores, voting for a score, or the like).
- ER 10 is scaled to a 0 - 10 range by dividing the H-score by 30 as shown in the formula.
- nuclei that are stained positive are differentiated from the nuclei that are stained negatively (e . g ., not stained) in each field of view.
- the percent positively is determined manually ( e . g ., without the use of a digital image, with the use of image analysis, or various other image analysis methods.
- nuclei are detected and classified as positively stained nuclei or negatively stained nuclei via the nuclei identification techniques described herein.
- negatively stained cells can be differentiated from, for example, lymphocytes and stromal tissue. Such a technique can be superior to using a universal color threshold.
- the H-score (which reflects the intensity of the stained cells and the number of stained cells for an individual slide) for the ER slide (or tissue section) is calculated, for example. Such a score can be based on the FOVs taken together collectively. In exemplary embodiments, a numerical scale (e.g., 0-300) is used for the H-score. For cells (e.g., in the fields of view) that have been positively stained, the intensity is determined. Such intensity can be determined via an algorithm, compared to a threshold, and assigned a bin number. Such a bin number can be for example, 0, 1, 2, or 3. As a result, there will be a count of nuclei ( i.e. , cells) in each bin. The bin counts can be used to calculate the H-score.
- the intermediate step of binning the nuclei can be re-used later when calculating a heterogeneity score.
- the positive (e.g., brown) intensities e.g., 1, 2, and 3 can be aggregated to determine an overall positively stained nucleus count as needed (e.g., for the heterogeneity score for ER).
- the calculation of the binary score for HER2 can include determining the binned score (which is related to the completeness of the cell membrane staining and the intensity of stained cell membrane) for the HER2 slide (e.g., based on the fields of view).
- the binned score for the combined FOVs will be a 0, 1, 2, or 3 as described herein. 0 or 1 are considered negative (0 for the binary score), and 2 or 3 are considered positive (1 for the binary score).
- a binary score is calculated for HER2.
- scores for the FOVs can be combined (e.g., averaged, average and rounded, or the like) to determine an overall score for HER2.
- the IHC4 score can then be determined by utilizing the percent positivity, H-score, and binary score described above.
- ER, HER2, Ki-67 and PR protein expression can be detected or measured in each of the selected FOVs to assist in making these determinations.
- protein expression can be examined or measured to determine or measure a percent positivity for each of Ki-67 and PR, a binned stain intensity score for HER2, and an H-score for ER.
- an immunohistochemistry (IHC) combination score can be determined or calculated according to the formula above.
- heterogeneity for example protein expression heterogeneity
- biomarkers e . g ., ER, PER, HER2, and Ki67
- Heterogeneity determinations add prognostic value to the already existing value of the IHC combination ( e . g ., IHC4) score.
- heterogeneity for example, regional heterogeneity is determined for each biomarker ( e . g ., ER, PER, HER2, and Ki67).
- FIG. 4B an exemplary set of slide images 185 showing annotations by which fields of view 186A, 186B, and 186C are selected (e.g., by a pathologist) on respective of the slide images for calculating a heterogeneity score.
- the annotations can be independent with no relation between fields of view from one biomarker to the other.
- a different set of annotations can be used for heterogeneity than those used for the IHC combination score.
- there can be partial overlap between the FOV used for the IHC combination score and the FOV used for the heterogeneity scores e.g., a field of view can be shared between them for a biomarker).
- the heterogeneity is determined for a slide (or tissue section) to measure how different the various tumorous regions are from a reference, for example, each other.
- a pathologist selects a number of fields of view for a slide (or tissue section).
- the pathologist selects three fields of view, each including tumorous regions with, for example, different percent positivities.
- VM variability metric
- PP(FS) is the percent positivity for each FOV
- FS e.g., the fields of view of a digital image of a tissue sample that has been contacted with an agent specific for ER probe, an agent specific for PR, or the like.
- a heterogeneity score for each of ER and PR is determined or calculated.
- the output prognosis score is a factor or percentage (P1) times the IHC combination score plus a factor or percentage (P2) of a combined heterogeneity score, where P1 and P2 are greater than 0.
- the resulting output prognosis score if used to determine the prognosis of the patient having the breast cancer.
- the method can prognosticate that the breast cancer in the subject is likely to be aggressive or recur ( e . g ., within 5 years) if the output prognosis score is above a certain threshold or that the breast cancer in the subject is unlikely to be aggressive or recur if the output prognosis score is below the threshold.
- the method can include obtaining a digitized image of the breast cancer sample (for example one that is on one or more microscope slides) that is detectably labeled for each of ER, HER2, Ki-67 and PR. For example, one or more digitized images can be obtained for each of ER, HER2, Ki-67 and PR.
- the method further includes selecting a subject prognosed as having a higher likelihood of recurrence, for example selecting the patient for more aggressive therapy.
- FIG. 5 provides further details on a particular embodiment of a method in accordance with the technology.
- the method can also include acquiring or obtaining images (such as a digital image) of the breast cancer sample stained to detect ER, HER2, Ki-67, and PR 108.
- images such as a digital image
- At least two FOV for each of ER, HER2, Ki-67, and PR are selected 110, for example selected and marked on a digital image.
- the number of FOVs selected may vary (e.g., there may be 2, 3, 4, 5, 6, 7, 8, 9 or 10 FOVs).
- the method includes detecting or measuring ER, HER2, Ki-67, and PR expression in each FOV 111.
- an IHC (e.g., IHC4) score is determined via the expression for each of ER, Ki-67, PR, and Her2 112, for example by determining or measuring a percent positivity for each of PR, and Ki-67, a binary score based on a binned score for HER2 (for example on a typical 0 to 3 scale to represent the intensity, wherein 0 is assigned to negative staining, 3 being assigned to very intensely staining samples), and an H-score for ER.
- the method also includes detecting or measuring protein heterogeneity for each of ER and PR, and in some examples also Ki-67 and HER2 113.
- a heterogeneity score for at least ER and PR, and in some examples also Ki-67 and HER2 is determined 114.
- the resulting IHC4 score 112 and heterogeneity score 114 are combined to produce an output prognosis score 118.
- the breast cancer is prognosed 120.
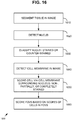
- FIG. 6 provides details on an exemplary method for obtaining or acquiring the IHC images of the breast tissue sample that is analyzed using the methods provided herein.
- Methods of obtaining and staining samples are routine in the art.
- the method can include obtaining the breast tissue from a patient 210, for example from a breast biopsy.
- the resulting tissue is then fixed and embedded 212, for example using formalin and paraffin.
- the fixed and embedded tissue can then be sliced or sectioned and mounted onto a substrate 214, for example mounted onto one or more glass microscope slides.
- one slide includes a plurality of tissue sections, such as at least 2 or at least 4 sections.
- tissue sections can then be incubated with appropriate antibodies (or other specific binding agents) to label ER, HER2, Ki-67, and PR proteins.
- appropriate antibodies or other specific binding agents
- at least one breast tissue section can be labeled with an ER-specific antibody
- another breast tissue section can be labeled with a HER2 specific antibody
- another breast tissue section can be labeled with a PR specific antibody
- another breast tissue section can be labeled with a Ki-67 specific antibody 216.
- a single tissue section can be labeled with more than one antibody (or other specific binding agent), as long as such labeled proteins are distinguishable, for example by using differently labeled-secondary antibodies.
- one or more images of the breast tissue section labeled with the ER-specific antibody can be obtained, one or more images of the breast tissue section labeled with the HER2-specific antibody can be obtained, one or more images of the breast tissue section labeled with the PR-specific antibody can be obtained, and one or more images of the breast tissue section labeled with the Ki-67-specific antibody can be obtained 218.
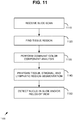
- FIG. 7 provides details on parameters that can be measured or determined when detecting protein expression in each FOV. Such values can be used to calculate the IHC (e.g., IHC4) score.
- the method includes detecting or measuring ER, HER2, Ki-67, and PR expression in each FOV 111.
- detecting protein expression in each FOV can include determining or measuring a percent positivity for each of PR, and Ki-67 410, determining or measuring a binned score for HER2 412 as described herein, and determining or measuring an H-score for ER 414.
- the scores can be combined into an immunohistochemistry score as described herein. Combining can comprise converting the binned score for HER2 into a binary score for HER2.
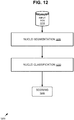
- FIG. 8 provides details on parameters that can be measured or determined when measuring protein heterogeneity in each FOV. Such values can be used to calculate the heterogeneity score.
- the method can include detecting or measuring protein heterogeneity for each of ER, HER2, Ki-67, and PR 113.
- detecting protein heterogeneity can include determining or measuring the variability of percent positivity in each FOV and normalizing the values, for at least ER and PR (and in some examples also Ki-67) 510.
- measuring protein heterogeneity for HER2 can include determining or measuring the binned score for each FOV for HER2 and variation between binned scores 512 ( e.g., using the binned score determined in 412 above, but incorporating at least one other FOV).
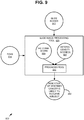
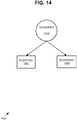
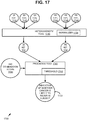
- FIG. 9 is a block diagram of an exemplary system 900 implementing the breast cancer prognosis technologies described herein.
- a slide image processing tool 920 can accept a plurality of slide images 912 and a plurality of fields of view 914 as input.
- the tool 920 outputs an indication 990 of whether cancer is likely to recur in the subject. As described herein, such an indication 990 can be based on an output prognosis score.
- the slides can depict protein expression for respective biomarkers in a breast cancer sample from a subject ( e . g ., detectably labeled with antibodies for the biomarkers as described herein).
- the tool 920 can provide user interfaces for receiving selections of the fields of view (FOV) 914 or such functionality can be provided by another tool or component.
- FOV fields of view
- the IHC combination score can be calculated (e.g., by the tool 920 or another tool or component) based on the slide images and fields of view within the slide images.
- the tool 920 is operable to calculate one or more heterogeneity scores 927 based on the slide images and fields of view within the slide images as described herein.
- the slide image processing tool 920 can include a prognosis tool 930 that accepts a calculated IHC combination score and the one or more heterogeneity scores 927 as input and outputs an indication 990 of whether cancer is more aggressive, and thus more likely to recur in the subject.
- system 900 can be more complicated, with additional functionality, more complex inputs, and the like.
- additional functionality can compute the IHC combination score, the heterogeneity score(s), or both, or such scores can be provided by other software.
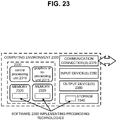
- the system 900 and any of the other systems described herein can be implemented in conjunction with any of the hardware components described herein, such as the computing systems described below ( e . g ., processing units, memory, and the like).
- the inputs, outputs, and tools can be stored in one or more computer-readable storage media or computer-readable storage devices.
- the technologies described herein can be generic to the specifics of operating systems or hardware and can be applied in any variety of environments to take advantage of the described features.
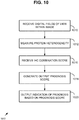
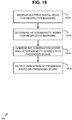
- FIG. 10 is a flowchart of an exemplary computer-implemented method 1000 implementing the breast cancer prognosis technologies described herein and can be implemented, for example, in the system shown in FIG. 9 .
- the method can be performed on one or more slide input images that are received for processing.
- a slide image depicting a breast cancer sample from a subject detectably labeled with antibodies for a biomarker as described herein can be used.
- a plurality of digital fields of view are received within an image.
- an indication of a field of view can be received via selections of displayed images ( e . g ., by tracing an outline on the image for a field of view) or an indication of a boundary within an image.
- protein heterogeneity is measured among the digital fields of view as described herein (e . g ., interregional heterogeneity is determined for the fields of view for a given slide image).
- protein expression for a biomarker can be measured for the respective fields of view, and the measurements compared for variability as described herein.
- heterogeneity can be measured for a plurality of biomarkers ( e . g ., as a heterogeneity score).
- One or more of ER, PR, and the like e.g., Ki-67, HER2, or the like) can be used.
- a second plurality of digital fields of view within a displayed image depicting a breast cancer sample from the subject detectably labeled with antibodies for a second biomarker can be received.
- Protein heterogeneity for the second biomarker can be measured (e.g., as a separate heterogeneity score from the first).
- an IHC combination score for the subject is received. Any of the IHC combination scores described herein can be supported.
- the IHC combination score can be for the same sample used for the heterogeneity analysis, or a different sample from the same subject can be used.
- an output prognosis score is generated based at least on the measured protein heterogeneity for the biomarker among the plurality of digital fields of view and the immunohistochemistry combination score for the subject.
- an IHC combination score and one or more heterogeneity scores for respective biomarkers can be generated and used to calculate an output prognosis score.
- an indication of prognosis (e.g., indication 990 of whether cancer is more aggressive and thus likely to recur in the subject) is output.
- an indication of prognosis e.g., indication 990 of whether cancer is more aggressive and thus likely to recur in the subject
- thresholds as described herein can be used to select between or among categories of prognosis indications; indicate a yes or no result; or the like.
- the method 1000 and any of the other computer-implemented methods described herein can be performed by computer-executable instructions (e . g ., causing a computing system to perform the method) stored in one or more computer-readable media (e . g ., storage or other tangible media) or stored in one or more computer-readable storage devices.
- computer-executable instructions e . g ., causing a computing system to perform the method
- computer-readable media e . g ., storage or other tangible media
- a field of view can be received as a stored indication of an area (e.g., a set of pixels, a boundary, or the like) within an image or as an annotation (e . g ., drawing, tracing, or the like) by a computer system operated by a pathologist with reference to (e.g., on) an image (e.g., which is then stored for later use).
- an area e.g., a set of pixels, a boundary, or the like
- an annotation e.g ., drawing, tracing, or the like
- annotation can be performed by a separate tool or software or incorporated into the tool or software that performs heterogeneity analysis.
- an immunohistochemistry combination score can be combined with a heterogeneity score to yield a breast cancer recurrence prognosis score.
- the IHC e.g., IHC4
- another immunohistochemistry combination score combining two or more biomarkers, for example, HER2, ER, PR, Ki-67, or the like can be used.
- Such a score can be determined via the fields of view indicated by a pathologist as described herein.
- Heterogeneity can be analyzed for the biomarkers used to generate the IHC combination score as described herein and combined with the IHC combination score to result in an output prognosis score.
- an image can be a digital image depicting a breast cancer sample from a subject detectably labeled with antibodies for a particular biomarker.
- an image depicts a section of such a sample. Different sections can be used for different biomarkers.
- the technologies can support a plurality of images for respective of the biomarkers.
- Implementations can support multiple biomarkers in a single image (e.g., in a multiplex scenario).
- an image When stored, an image can be represented as image data, pixels or voxels having, for example, color values, intensity values, or both.
- Image pixel or voxels can be processed as described herein. For example, fields of view within the images can be analyzed to quantify protein expression within the field of view for a given biomarker.
- a digital field of view can be an area within an image or an indication of such an area and is sometimes simply called a "field of view" herein.
- Such fields of view can comprise regions of interest as indicated by a pathologist.
- slides can be compared to other slides, so the field of view can be the entire slide.
- the field of view is typically smaller than the entire digital image, it typically corresponds to an area that is smaller than the entire section being imaged.
- a digital field of view can be stored as a separate image or indicated by a boundary (e . g ., originally drawn by a pathologist and stored electronically) with reference to a reference image (e.g., the image from which the field of view was derived).
- a boundary e.g ., originally drawn by a pathologist and stored electronically
- digital fields of view are contiguous regions of pixels or voxels within the image as selected by a pathologist according to an appropriate protocol.
- Any arbitrary shape e.g., rectangular, non-rectangular, square, elliptical, circular, traced shape, or the like
- area of interest can be supported, and tools can be provided for selecting particular shapes (e.g., a tracing tool, an ellipse tool, a circle tool, a square tool, a rectangle tool, or the like).
- a field of view can comprise an anatomical structure of interest (such as a gland).
- a reference to the digital field of view can be used instead of the actual field of view data itself.
- fields of view can be selected according to a protocol appropriate for the purpose.
- a protocol appropriate for the purpose.
- the protocol specifies that selected fields (e.g., 2, 3, 4, 5, 6, 7, or the like) be tumor regions and be representative ( e . g ., similar looking) of protein expression of the biomarker within tumor tissue.
- the protocol specifies that fields ( e.g., 2, 3, 4, 5, 6, 7, or the like) representing different ( e . g ., heterogeneous) levels of protein expression of the biomarker within tumor tissue are to be selected.
- a single field can be used for both purposes ( e . g ., one of the heterogeneous fields is also used in an IHC combination score).
- a user interface presented to the selecting user (e.g., a pathologist) can indicate for what purpose the fields of view are being selected and also provide guidance regarding the protocol as appropriate.
- protein heterogeneity refers to the spatial variation of histochemical and molecular staining patterns, such as the staining patterns for breast cancer biomarkers ER, HER2, Ki-67 and PR in a breast cancer sample and is sometimes called simply "heterogeneity" herein.
- heterogeneity increases with the variability of level of biomarkers at different locations within a single sample.
- Heterogeneity can be an indicator of the spatial variation of tumor aggressiveness and/or growth patterns that can be correlated with an aggregated clinical phenotype (e.g., a tumor likely to recur).
- the methods of the invention involve measuring ER and PR protein heterogeneity as set forth in the appended claims. Examples or embodiments that exceed the claimed scope constitute disclosure useful for understanding the invention. It is shown herein that biological heterogeneity of ER and PR protein expression is correlated with the unpredictable recurrence of a fraction of early stage breast cancer patients.
- Heterogeneity can be measured by a variability metric measuring how different the protein expression levels among fields of view for the same biomarker are (e.g., the variability of protein expression measurements within fields of view for a single biomarker).
- a variability metric measuring how different the protein expression levels among fields of view for the same biomarker are (e.g., the variability of protein expression measurements within fields of view for a single biomarker).
- interregional e. g ., inter-FOV
- a quantitative measure of interregional heterogeneity (e . g ., heterogeneity among the fields of view) can be calculated based on a deviation ( e . g ., standard deviation or other moment of the distribution) of protein expression measurement, PE (e.g., percent positivity), in the different fields of view for a given biomarker (e.g., ER, PR, Ki-67, or the like).
- PE protein expression measurement
- Such a measurement can quantify how far apart (e.g., the spread of distribution) protein expression measurements are.
- S average slide score
- a substitute value e.g., 5%
- Normalization can be achieved by dividing the observed deviation by the average slide score.
- a sum of bin differences between permutations of the fields of view can be used as a measurement of heterogeneity. Heterogeneity can thus be calculated by aggregating binned score differences for different fields of view for the marker.
- a single field of view has a single binned score. If all the binned scores are equal, the score is 0.
- normalization can be done according to the biomarker involved.
- spatial protein heterogeneity can be measured.
- Such heterogeneity can be categorized as geographical, regional, inter-glandular, intra-glandular, or the like.
- geographic heterogeneity can be measured by measuring variation in protein expression at a geographic level: two separate tissue blocks more than a threshold distance (e.g., 2 inches) apart.
- Regional heterogeneity can be measured by measuring variation in protein expression at a regional level: in the same tissue section, for example, between 0.25 and 2 inches apart, and different fields of view, for example, at least distance of a 4x objective apart. Fields of view as described herein can be used to measure such regional heterogeneity.
- Inter-glandular heterogeneity can be measured by measuring variation in protein expression at an inter-glandular level: for example, less than 0.25 inches apart and within a 4x objective.
- Intra-glandular heterogeneity can be measured by measuring variation in protein expression at an intra-glandular level: for example, the formations in a 20x objective for regional and inter-glandular categories.
- variability metrics other than standard deviation, ⁇
- inter-regional differences in protein expression measurements or a maximum thereof e . g ., when more than two fields of view
- PE protein expression
- VM adj VM ⁇ MIN ABS PE FS 1 ⁇ PE FS 2 , ABS PE FS 1 ⁇ PE FS 3 , ABS PE FS 2 ⁇ PE FS 3 Further variations are possible.
- normalization can be applied to heterogeneity scores (e.g., a heterogeneity score for a biomarker). For example, normalization can be achieved by dividing the observed deviation by the average slide score (e.g., for the measured biomarker) as described above.
- Further normalization can be achieved based on the given biomarker involved. For example, based on historical observation of the heterogeneity of protein expression for a given biomarker, a coefficient or other normalization technique can be used.
- a per-biomarker normalization factor, ⁇ can account for differences in impact that heterogeneity of a specific biomarker has on the prognosis score. As data for heterogeneity analysis is seen, such per-biomarker normalization factors can be adapted.
- ⁇ was 1.0 for ER and PR, and 0.75 for Ki-67.
- Such a factor can be determined via statistical methods to determine appropriate weightings for the biomarker(s) involved ( e . g ., to separate patients into prognosis categories based on the resulting prognosis score).
- protein expression for a given biomarker can be quantified by measuring a degree to which the protein is expressed (e . g ., in a field of view or collectively in fields of view). With reference to stained cells in a field of view, protein expression can be expressed as a percent of the cells in the field of view that are positive stained.
- a count of the positive stained cells can be determined, a count of the negative stained cells can be determined, and based on the two, the protein expression can be calculated. Because the quantification indicates the percent of cells that are positive stained, such a measurement is sometimes called "percent positivity" for a field of view (e.g., for a given biomarker).
- a binned score as described herein can be used to measure protein expression (e . g ., for HER2).
- percent positivity for a given field of view can be determined via any number of techniques.
- the technologies described herein can make use of current and future-developed techniques for determining percent positivity.
- Some such techniques count cell nuclei of positive stained cells and count cell nuclei of negative stained cells.
- Such a technology can filter out stromal and lymphocyte regions of the field of view. If desired, information from an entire slide can be used when counting nuclei.
- protein heterogeneity can be determined by determining percent positivity measurements for respective fields of view for an image associated with a biomarker, where the percent positivity measurements indicate a percent of cells in the respective fields of view that are positive stained for the biomarker. The percent positivity measurements can then be compared as described herein (e.g., to generate a variability metric).
- a percent positivity determination can include determining intensity of staining and determining a count of nuclei for a plurality of bins (e.g., 0, 1, 2, 3). Those nuclei in bin 0 can be considered negative, and the others can be aggregated as the positively stained cells. Having such bin information can be useful for other purposes, such as calculating an H-score or the like.
- FIG. 11 is a flowchart of an exemplary computer-implemented method 1100 for identifying nuclei in a slide.
- the method 1100 can use information on the slide outside of the fields of view for the analysis.
- a slide scan of a breast tissue section stained as described herein is received.
- Such a scan can be performed at a first magnification (e . g ., 20x, 40x, or the like) and/or resolution.
- the tissue region of the slide is identified.
- the slide scan can be separated into glass background and tissue region.
- Such analysis can be performed at a second magnification (e . g ., 1x, 2x, or the like) and/or resolution.
- a dominant color component analysis may be performed on the tissue region.
- dominant colors can be extracted from the tissue region in the slide.
- Such analysis can be performed at a third magnification (e.g., 5x or the like) and/or resolution.
- segmentation may be performed to segment the tissue region into different labeled regions using color and texture features from multiple magnifications.
- the nuclei in the slide and/or fields of view are detected and counted (e.g., according to whether they are positive or negative stained). Scoring can thus be achieved.
- nuclei can be identified using any technique using color differentiation (e . g ., between positive brown and negative blue) and shape (e . g ., morphological analysis) of candidate nuclei.
- color differentiation e . g ., between positive brown and negative blue
- shape e . g ., morphological analysis
- morphological post-processing can filter out stromal cells and stray blobs.
- FIG. 12 is a block diagram of an exemplary system 1200 for field-of-view scoring.
- an input field-of-view 1210 is shown.
- such analysis can be performed for multiple fields of view, one or more tiles of the slide, the entire slide, or any other input image.
- Nuclei segmentation (e . g ., identification of nuclei in an image) 1220 can be performed to identify nuclei in the FOV. Any number of techniques can be used to identify the nuclei.
- Nuclei classification 1230 can then be performed to classify the identified nuclei. Again, any number of techniques can be used to so classify the nuclei as positive or negative stained.
- scoring is performed on the classified nuclei, resulting in percent positivity for the biomarker. By identifying nuclei, corresponding cells are identified. Scoring can be performed for a particular field of view, even if the analysis is performed on areas outside of the field of view.
- FIG. 13 is a block diagram of another exemplary system 1300 for field-of-view scoring.
- an input field-of-view 1310 is shown.
- such analysis can be performed for multiple fields of view, one or more tiles of the slide, the entire slide, or any other input image.
- Nuclei segmentation (e . g ., identification of nuclei in an image) 1320 can be performed.
- seed detection for the input image is performed to locate seeds processed by the system.
- a seed is a point that lies within a candidate nucleus and serves as a starting point for localizing cell nuclei. Seed detection can use techniques such as operating on a gradient image using a kernel based voting procedure.
- Foreground segmentation is performed at 1324.
- a foreground mask associated with nuclei regions can be computed.
- Blob segmentation is performed at 1326. Foreground segmentation and blob segmentation can make use of global intensity variations from image to image.
- a blob-like representation for each nucleus can be extracted.
- Nuclei classification 1330 can be performed.
- feature construction is performed.
- classification is performed, with reference to a model 1334 from training. Such a model can be specific to the biomarker involved.
- scoring is performed, resulting in a percent positivity for the biomarker. By identifying nuclei, corresponding cells are identified. Scoring can be performed for a particular field of view, even if the analysis is performed on areas outside of the field of view.
- FIG. 14 is a block diagram of an exemplary classifier 1400 for determining true positive stained nuclei.
- candidate nuclei e . g ., incoming candidates
- a classifier 1410 which separates into two classes: positives 1451 and negatives 1452. It is possible that some incoming candidates do not classify as either, are filtered out in advance, or the like.
- the classifier can determine negatives 1452 to be those cells ( e . g ., associated with nuclei) that are determined to be cells that are not stained.
- Some candidates e . g ., stromal tissue, lymphocytes, etc.
- the classifier can use features such as color features (e . g ., mean, variance, and the like), tissue background color and context, shape ( e.g., size, eccentricity, elongation), morphology, cell density, and the like.
- color features e . g ., mean, variance, and the like
- shape e.g., size, eccentricity, elongation
- morphology e.g., cell density, and the like.
- FIG. 15 is a block diagram of an exemplary multi-stage linear binary classifier 1500 for determining true positive stained nuclei.
- candidate nuclei e . g ., incoming blobs
- a classifier 1510 which separates into two preliminary classes:
- a classifier 1520 separates incoming candidates into stroma 1554 and negatives and lymphocytes.
- Another classifier 1530 separates incoming candidates into negatives 1552 and lymphocytes 1553.
- Still another classifier 1540 separates incoming candidates into brown (true positives) 1551 and faint brown junk blobs 1555.
- the count of true positives 1551 and negatives 1552 can be used for determining percent positivity for a field of view.
- the classifiers can use features such as color features (e.g., mean, variance, and the like), tissue background color and context, blob shape (e.g., size, eccentricity, elongation), morphology, cell density, and the like.
- color features e.g., mean, variance, and the like
- tissue background color and context e.g., tissue background color and context
- blob shape e.g., size, eccentricity, elongation
- morphology e.g., cell density, and the like.
- a binned score can be generated for the HER2 biomarker.
- the fields of view for HER2 can be considered collectively ( e . g ., analysis can be performed on the digital fields of view collectively).
- a binned score can be generated for respective fields of view within an image of a tissue slide for the HER2 biomarker. In practice, such a score determines the completeness of staining for the cell membrane surrounding a nucleus.
- a binned score can comprise a single number ( e . g ., 0, 1, 2, or 3) for HER2 ( e.g., either for the FOVs collectively or respective FOVs) determined as described herein.
- FIG. 16 is a flowchart of an exemplary method 1600 of determining a binned HER2 score and can be used in any of the examples herein in which a binned HER2 score is used. Such a score can be generated collectively for fields of view or for separate fields of view as described herein.
- the method 1600 can be performed for a given image of a slide prepared and annotated as described herein for HER2.
- tissue in the image is segmented. For example, stromal and non-stromal areas can be determined.
- the nuclei can be detected as described herein, in, for example, the non-stromal ( e . g ., gland) regions.
- nuclei are classified as stained or counter stained.
- the stained cell membrane in the image (e . g ., whole image, FOVs, or the like) is detected.
- cells are scored by associating respective nuclei with the stained membrane around them. Based on presence of stained membrane surrounding the nuclei, a cell is classified into one of the following types: non-stained (e . g ., no stained membrane found around the nucleus), partially stained ( e .g., the nuclei of the cell is partially surrounded by the stained membrane), completely stained ( e . g ., the nucleus is completely surrounded by the stained membrane).
- Parameters can be used as thresholds for determining partial and completely stained. If desired, such parameters can be adjusted by a user ( e.g., a percentage surrounding required to qualify as partial, a percentage surrounding required to qualify as complete). For example, cells with more than a threshold amount of ( e.g., 90%) surrounding stained membrane can be determined to be "completely" stained.
- a cell can be assigned a staining completeness indicator (e . g ., indicating whether staining is complete or not, the degree of completeness, or the like) and a staining intensity value based on pixel intensity for the stain ( e . g ., brown) color component (e . g ., ranging from 0 to a maximum value, such as 100, 255, or the like).
- staining completeness indicator e . g ., indicating whether staining is complete or not, the degree of completeness, or the like
- a staining intensity value based on pixel intensity for the stain ( e . g ., brown) color component ( e . g ., ranging from 0 to a maximum value, such as 100, 255, or the like).
- staining completeness indicators and staining intensity values can be determined for a plurality of cells appearing in the digital fields of view for HER2.
- staining completeness indicators and staining intensity values can then be analyzed via the conditions as described herein.
- the intensity of staining of cell membrane surrounding respective of the nuclei can be determined.
- the fields of view are scored based on scores of cells in the field of view. For example, the following conditions can be used (e.g., if the field of view qualifies for a higher score, processing need not be done for the lower scores): Condition Assign Score Responsive to determining percentage of completely stained cells > a threshold ( e.g., 30%) 3+ Responsive to determining (The percentage of completely stained cells > a threshold ( e .
- membrane median intensity can be compared with a strong intensity threshold. It can also be determined, for a plurality of nuclei appearing in digital fields of view for HER2, whether cell membrane surrounding the nuclei are completely stained.
- the field of view binned scoring for HER2 can thus be achieved. If a binary score is desired, the intermediate step of determining binned score can be omitted or combined into the process.
- positive staining e . g ., of cell membrane
- an average brownness on the membrane can be determined by the luminance scalar value (e.g., 0 -255), which can be computed from the RGB pixel values of the membrane region.
- RGB values can be converted to luminance value (L) via an RGB to L*a*b* conversion technique.
- the L value can be converted from a 0 to 100 scale to a 0 to 255 scale.
- An average brownness for a cell can be calculated by averaging L over the membrane pixels.
- the average brownness can be used as the median intensity (e.g., of cell membrane) as described above.
- nuclei can be classified for purposes of calculating the binned HER2 score.
- cells can be classified as stained and counter stained, based on saturation, intensity, and red and blue color information in each cell from the image. Saturation and intensity information can be used to distinguish dark gray cells so they can be classified as stained instead of non-stained.
- each nuclei can be classified as stained or non-stained based on the percentage of the stained pixels within each nucleus. For example, the following rules can be used:
- the nuclei objects can then be filtered based on size.
- the HER2 Gene Copy # was determined as an average of three lots of PATHWAY HER-2 4 in 1 control slides determined using PathVysion® HER2 Probe.
- an H-score can be calculated from a field of view or fields of view collectively via automated techniques. For example, nuclei can be identified, and then cells ( e . g ., corresponding to the nuclei) can be categorized ( e . g ., binned) into four bins: 0, 1 (weakly stained), 2 (moderately stained), or 3 (strongly stained). Such a technique can be achieved by determining the average brownness of a cell or clump of cells (e.g., blob).
- the average brownness can be compared against thresholds to determine whether a cell is not stained (0), staining weakly (1+), staining moderately (2+), or staining strongly (3+).
- the counts of the cells in the bins can be maintained, and at the conclusion of the counting, an H-score can be calculated based on the percentage of cells in each bin as described herein.
- the H-score can be calculated by summing, for the bins, the product of the percentage (e.g., percentage of cell count, such as the number of cells in a bin divided by the total number of cells) of cells in a bin by the respective intensity level associated with the bin.
- the percentage e.g., percentage of cell count, such as the number of cells in a bin divided by the total number of cells
- the H-score will range from 0-300.
- the intensity level associated with a bin can be the numerical portion of an intensity designator ( e . g ., 2+ is treated as 2).
- a breast cancer recurrence prognosis score can be generated based on an IHC combination score and heterogeneity scores for one or more biomarkers. Such a prognosis score is sometimes simply called an "output prognosis score.”
- the score can be generated by combining the IHC combination scores and heterogeneity scores.
- the heterogeneity scores can be added, multiplied, or otherwise combined and then operations (e . g ., square root, exponent, coefficients, etc.) applied to form a heterogeneity component to the score.
- the immunohistochemistry combination score can likewise be adjusted ( e . g ., square root, exponent, coefficients, etc.) to form an immunohistochemistry combination component to the score.
- the two components can then be combined ( e . g ., added, multiplied, or the like).
- F IHC ⁇ IHC 4 + F Het ⁇ Het ER + Het PR
- F IHC an immunohistochemistry combination coefficient
- F Het is a heterogeneity coefficient
- Het ER is a heterogeneity score for ER
- Het PR is a heterogeneity score for PR.
- the technologies can support adjustment of the coefficients as desired. For example, statistical analysis can indicate appropriate coefficients that can change in light of accumulated data (e.g., to divide patients into categories as described herein).
- an indication of prognosis can comprise an output prognosis score itself, a category (e.g., red, yellow, green) based on thresholds, or the like.
- the indication can be of a form that indicates whether or not (or how likely) cancer is predicted to recur, based on the inputs.
- the indication of breast cancer recurrence can be chosen ( e . g ., from a plurality of categories) based on one or more stored thresholds for the breast cancer recurrence prognosis score. For example, if the score meets a threshold, a first indication can be chosen ( e . g ., recurrence prognosis); if the score does not meet the threshold, a second indication can be chosen ( e . g ., non-recurrence prognosis).
- Such categories can comprise a time component as well (e . g ., expected to recur within 5 years) or the like.
- Multiple indications can be supported ( e . g ., one category for whether cancer is expected to recur within 1 year, another category for whether cancer is expected to recur within 5 years, and the like).
- the technologies can be implemented on a standalone basis, the technologies described herein can be implemented in a multi-function digital pathology platform that aids users in analysis of slide image data.
- the technologies can be integrated into the Virtuoso image management software of Ventana Medical Systems, Inc., or comparable solutions.
- Such a platform can serve as a front end for the technologies.
- Slide images and information collected about them (e.g., fields of view) via the digital pathology platform can be used as inputs to the technologies described herein.
- Such a platform can allow pathologists the flexibility to work on cases, specimens, and images in any desired order.
- Slide images can be annotated, and a variety of other functionality can be made available.
- the platform can be implemented in a thin-client (e . g ., software as a service, cloud computing, or the like) scenario as desired.
- a thin-client e . g ., software as a service, cloud computing, or the like
- FIG. 17 is a block diagram of an exemplary system 1700 including a heterogeneity tool 1720 implementing the breast cancer prognosis technologies described herein.
- a heterogeneity tool 1720 accepts a plurality of digital fields of view 1711A-N, 1714A-N for respective biomarkers as input and, with the assistance of an optional normalizer 1725, outputs heterogeneity scores 1731, 1734 for respective of the biomarkers.
- FIG. 9 The features of FIG. 9 can be intermingled or incorporated as desired.
- a prognosis tool 1740 accepts the heterogeneity scores 1731, 1734 and IHC combination score 1750 as input and, with reference to a prognosis threshold 1745, outputs an indication 1790 of whether cancer is likely to recur in the subject.
- FIG. 18 is a flowchart of an exemplary computer-implemented method 1800 implementing the breast cancer prognosis technologies described herein via determining a heterogeneity score for respective biomarkers and can be implemented, for example, in the system shown in FIG. 17 .
- a plurality of digital fields of view are received for respective biomarkers.
- a heterogeneity score for respective of the biomarkers is determined.
- an IHC combination score and the heterogeneity scores are combined into a prognosis score.
- an indication of the prognosis (e . g ., an indication 1790 of whether cancer is likely to recur in the subject) is output based on the prognosis score.
- a computer-implemented method can calculate an immunohistochemistry combination score for a subject by receiving respective pluralities of digital fields of view within respective images depicting a breast cancer sample detectably labeled with respective biomarker antibodies (e . g ., for a plurality of biomarkers as described herein).
- the percent positivity for a plurality of the biomarkers can be determined as described herein.
- the immunohistochemistry combination score can be calculated.
- Such calculation can comprise combining the percent positivity for one biomarker with the percent positivity for a second biomarker.
- An immunohistochemistry combination score can then be output.
- the biomarkers can comprise HER2, and calculating the IHC combination score can comprise calculating a HER2 score ( e . g ., binned, binary, or the like) as described herein.
- the biomarkers ER and PR are used for determining regional heterogeneity.
- the heterogeneity of different combinations of biomarkers can be calculated and combined with an IHC combination score to generate a prognosis score.
- Biomarkers that can be used can include combinations of one or more of the biomarkers used as part of the IHC combination score (e.g., ER, PR, Ki-67 and HER2). Any of the other examples herein can be modified accordingly ( e . g ., to obtain fields of view, calculate heterogeneity scores, or the like).
- biomarkers can be measured in a multiplex scenario.
- a single tissue section can be labeled with more than one antibody (such as two antibodies specific for two different biomarkers, etc.), as long as such labeled proteins are distinguishable, for example by using differently labeled-secondary antibodies.
- tissue microarray techniques can be applied to accomplish tissue staining.
- a plurality of tissue samples can be applied to a single substrate, and a plurality of staining agents (e . g ., labeling antibodies) can be applied to the samples ( e . g ., a different agent per tissue sample).
- staining agents e . g ., labeling antibodies
- the techniques described herein can then be used to determine one or more scores as described herein ( e . g ., based on images of the detectably labeled tissue samples).
- thresholds can be derived by statistical evaluation. For example cut-points can be determined using training and testing to validate an optimal cut-point that best defines high versus low risk patients.
- FIG. 19 is a block diagram of an exemplary system 1900 including a difference engine 1940 for calculating a heterogeneity score for a biomarker.
- the features of FIG. 9 and/or FIG. 17 can be incorporated or intermingled as desired.
- a field of view image analyzer 1920 accepts digital fields of view 1711A-N (e.g., for a single biomarker) as input and outputs percent positivity measurements 1931A-N for respective of the fields of view.
- the difference engine 1940 accepts the percent positivity measurements 1931A-N as input and, with assistance of an optional normalizer 1945, outputs a heterogeneity score 1731 for the biomarker.
- FIG. 20 is a flowchart of an exemplary computer-implemented method 2000 for calculating a heterogeneity score for use in the breast cancer prognosis technologies described herein and can be implemented, for example, in the system shown in FIG. 19 .
- a plurality of digital fields of view for a given biomarker are received.
- Such an image can depict a breast cancer sample from a subject detectably labeled with antibodies for a biomarker as described herein.
- protein expression for the biomarker in the digital fields of view is measured. For example, percent positivity measurements for respective of the biomarkers are received or determined.
- heterogeneity of the measured protein expression for the biomarker is measured among the plurality of digital fields of view. For example, a heterogeneity score is calculated as the variability between the percent positivity measurements appearing in the different fields of view ( e . g ., for a single biomarker).
- the heterogeneity score (e . g ., preliminary heterogeneity score or variability metric) can be normalized as described herein to adjust the heterogeneity score.
- the heterogeneity score is output for the biomarker ( e . g ., for use in the technologies described herein).
- FIG. 21 is a screenshot of an exemplary user interface 2100 for indicating digital fields of view within an image.
- a user interface can take the form of a window, screen, pane, or the like presented to a user for accepting input (e.g., indications of fields of view on a displayed slide image).
- a pathologist has selected three fields of view 2120A, 2120B, and 2120C on a displayed slide for a particular biomarker (e.g., ER) for heterogeneity purposes.
- a biomarker e.g., ER
- Independent fields of view can be selected for different biomarkers.
- Further independent fields of view can be selected for heterogeneity purposes and immunohistochemistry combination score purposes.
- FIG. 22 is a flowchart of an exemplary digital pathologist workflow computer-implemented method 2200.
- a digital pathologist workflow can be supported to facilitate field of view selection on ( e . g ., within) images.
- a plurality of fields of view for the IHC combination score are received within a plurality of slide (or tissue) images displayed for determining the IHC combination score.
- a user interface can comprise a plurality of slide (or tissue) images depicting a breast cancer sample from a subject detectably labeled with antibodies for each of ER, HER2, Ki-67, and PR.
- Receiving the plurality of fields of view for the IHC combination score can comprise receiving a plurality of fields of view for each of ER, HER2, Ki-67, and PR.
- a series of slides (or tissue sections) can be presented, and the pathologist can indicate a plurality of fields on the respective slides ( e .
- Such an indication can be accomplished by receiving annotations ( e . g ., drawn areas) on a displayed image.
- a plurality of fields of view for a heterogeneity score are received within a plurality of slide (or tissue) images displayed for determining the heterogeneity score.
- a user interface can comprise a plurality of slide (or tissue) images depicting a breast cancer sample from the subject detectably labeled with antibodies for each of ER and PR.
- Receiving the plurality of fields of view for the IHC combination score can comprise receiving a plurality of fields of view biomarkers, such as for each of ER and PR. Such receiving can be accomplished by receiving annotations ( e . g ., drawn or identified areas) on a displayed image.
- protein expression values for the fields of view for the IHC combination score are measured, and an IHC combination score is calculated therefrom.
- protein expression values for the fields of view for the heterogeneity score are measured, and a heterogeneity score is calculated therefrom.
- One or more other heterogeneity scores for respective other biomarkers can be similarly obtained.
- the IHC combination score and the one or more heterogeneity scores are combined into a breast cancer recurrence prognosis score.
- an indication of breast cancer recurrence prognosis based on the breast cancer recurrence prognosis score is displayed ( e . g ., for consideration by a viewing pathologist).
- fields of view for an IHC combination score can be selected to be representative of the entire slide.
- a user interface presented to the pathologist can so indicate.
- fields of view for a heterogeneity score can be selected to be representative of a region on the slide (e.g., and thus chosen to emphasize differences between regions).
- a user interface presented to the pathologist can so indicate.
- Methods of obtaining a biological sample from a subject are known in the art.
- methods of obtaining breast tissue or breast cells are routine.
- a sample from a tumor that contains cellular material can be obtained by surgical excision of all or part of the tumor, by collecting a fine needle aspirate from the tumor, as well as other methods known in the art.
- Samples may be fresh or processed post-collection.
- processed samples may be fixed (e.g., formalin-fixed) and/or wax- (e.g., paraffin-) embedded.
- Fixatives for mounted cell and tissue preparations are well known in the art and include, without limitation, 95% alcoholic Bouin's fixative; 95% alcohol fixative; B5 fixative, Bouin's fixative, formalin fixative, Karnovsky's fixative (glutaraldehyde), Hartman's fixative, Hollande's fixative, Orth's solution (dichromate fixative), and Zenker's fixative (see, e.g., Carson, Histotechology: A Self - Instructional Text , Chicago:ASCP Press, 1997).
- the sample can be a fixed, wax-embedded breast cancer tissue sample, such as a fixed, wax-embedded early breast cancer tissue sample.
- the sample is a breast tissue section stained with hematoxylin and eosin (H&E).
- the sample is a breast tissue section labeled with primary antibodies specific for ER, HER2, Ki-67 and PR, which may be labeled directly or indirectly ( e . g ., with a labeled secondary antibody), which in some examples is further stained with H&E.
- the sample (or a fraction thereof) is present on a solid support.
- Solid supports bear the biological sample and permit the convenient detection of components (e . g ., proteins) in the sample.
- Exemplary supports or substrates include microscope slides (e . g ., glass microscope slides or plastic microscope slides), coverslips ( e . g ., glass coverslips or plastic coverslips), tissue culture dishes, multi-well plates, membranes ( e . g ., nitrocellulose or polyvinylidene fluoride (PVDF)) or BIACORETM chips.
- Estrogen Receptor (OMIM: 133430)
- ER The human estrogen receptor (ER or ESR) has two different forms, referred to as ⁇ (ESR1) and ⁇ (ESR2).
- ESR human estrogen receptor
- ER ⁇ is the form found in breast cancer cells.
- ER ⁇ sequences are publicly available, for example from GenBank® ( e . g ., accession numbers NP_001116214.1, NP_001116213.1, and P03372.2 (proteins), and NM_000125.3, NM_001122741.1, and NM_178850.2 (nucleic acids)).
- the estrogen receptor is a ligand-activated transcription factor composed of several domains important for hormone binding, DNA binding, and activation of transcription. Alternative splicing results in several ESR1 mRNA transcripts, which differ primarily in their 5' untranslated regions.
- Antibodies for detecting ER expression are publicly available, such as from Santa Cruz Biotechnology (Santa Cruz, CA), Thermo Scientific Pierce Antibodies (Rockford, IL), GeneTex (Irvine, CA), ARP American Research Products, Ventana Medical Systems, Inc. (Tucson, AZ) or Abcam (Cambridge, MA), for example Cat. Nos. sc-71064, sc-73562, and sc-7207 from Santa Cruz Biotechnology, MA1-310 from Pierce Antibodies, 790-4325 (clone SP1) from Ventana, or ab2746, ab27614, or ab37438 from Abcam.
- HER2 Human epidermal growth factor receptor 2 (OMIM 164870)
- the human HER2 gene is located on chromosome 17 (17q21-q22).
- HER2 sequences are publicly available, for example from GenBank® ( e . g ., accession numbers NP_001005862.1, P04626.1, and NP_004439.2 (proteins) and NM_001005862.1 and NM_001982.3 (nucleic acids)).
- Amplification or over-expression of HER2 plays a role in the pathogenesis and progression of certain aggressive types of breast cancer and is an important biomarker and target of therapy for the disease.
- Antibodies for measuring HER2 expression are publicly available, such as from Santa Cruz Biotechnology (Santa Cruz, CA), Thermo Scientific Pierce Antibodies (Rockford, IL), GeneTex (Irvine, CA), ARP American Research Products, Ventana Medical Systems, Inc. (Tucson, AZ) or Abcam (Cambridge, MA), for example Cat. Nos. 790-2991 (clone 4B5) from Ventana, sc-08, sc-81528, and sc-136294 from Santa Cruz Biotechnology, and ab2428, ab16901 or ab36728 from Abcam.
- Ki-67 gene is located on chromosome 10. Ki-67 sequences are publicly available, for example from GenBank® (e . g ., accession numbers NP_001139438.1, P46013.2 and NP_002408.3 (proteins) and NM_001040058.1 and NM_001145966.1 (nucleic acids)).
- Ki-67 is a marker that can be used to determine the growth fraction of a given cell population.
- the fraction of Ki-67-positive tumor cells (the Ki-67 labeling index) is often correlated with the clinical course of cancer, such as breast cancer.
- Ki-67 can be used to prognose patient survival and tumor recurrence.
- Antibodies for measuring Ki-67 expression are publicly available, such as from Santa Cruz Biotechnology (Santa Cruz, CA), Thermo Scientific Pierce Antibodies (Rockford, IL), GeneTex (Irvine, CA), ARP American Research Products, Ventana Medical Systems, Inc. (Tucson, AZ) or Abcam (Cambridge, MA), for example Cat. Nos. 790-4286 (clone 30-9) from Ventana, sc-101861 (clone MIB-1), sc-15402, and sc-23900 from Santa Cruz Biotechnology, and ab15580, ab16667 or ab8191 from Abcam.
- the human PR gene (also known as nuclear receptor subfamily 3, group C, member 3, NR3C3) is located on chromosome 11q22.
- PR sequences are publicly available, for example from GenBank® ( e . g ., accession numbers NP_000917.3, AAA60081.1, and AAS00096.1 (proteins) and NM_001202474.1and NM_000926.4 (nucleic acids)).
- Amplification or over-expression of PR has been shown in some breast cancers.
- Antibodies for measuring PR expression are publicly available, such as from Santa Cruz Biotechnology (Santa Cruz, CA), Thermo Scientific Pierce Antibodies (Rockford, IL), GeneTex (Irvine, CA), ARP American Research Products, Ventana Medical Systems, Inc. (Tucson, AZ) or Abcam (Cambridge, MA), for example Cat. Nos. 790-2223 (clone IE2) from Ventana, sc-810, sc-811, and sc-539 from Santa Cruz Biotechnology, and ab2765, ab2764 or ab68195 from Abcam.
- ER, HER2, Ki-67 and PR publicly available sequences provided herein, one skilled in the art will appreciate that variants of such sequences may be present in a particular subject. For example, polymorphisms for a particular gene or protein may be present. In addition, a sequence may vary between different organisms. In particular examples, a variant sequence retains the biological activity of its corresponding native sequence.
- a ER, HER2, Ki-67 or PR sequence present in a particular subject may can have conservative amino acid changes (such as, very highly conserved substitutions, highly conserved substitutions or conserved substitutions), such as 1 to 5 or 1 to 10 conservative amino acid substitutions. Exemplary conservative amino acid substitutions are shown in Table 1.
- an ER, HER2, Ki-67 or PR sequence is a sequence variant of a native ER, HER2, Ki-67 or PR sequence, respectively, such as a nucleic acid or protein sequence that has at least 99%, at least 98%, at least 95%, at least 92%, at least 90%, at least 85%, at least 80%, at least 75%, at least 70%, at least 65%, or at least 60% sequence identity to the sequences set forth in a GenBank® accession number referred to herein, wherein the resulting variant retains ER, HER2, Ki-67 or PR biological activity.
- Sequence identity is a phrase commonly used to describe the similarity between two amino acid sequences (or between two nucleic acid sequences). Sequence identity typically is expressed in terms of percentage identity; the higher the percentage, the more similar the two sequences.
- NCBI National Center for Biotechnology Information
- BLASTTM Basic Local Alignment Search Tool
- NCBI National Center for Biotechnology Information
- NCBI Bethesda, MD
- sequence-analysis programs blastp, blastn, blastx, tblastn and tblastx A description of how to determine sequence identity using this program is available on the Internet under the help section for BLASTTM.
- a sample obtained from the subject is analyzed to determine if it contains detectable levels of ER, HER2, Ki-67 and PR protein, such as a breast cancer sample.
- the sample can be analyzed to detect or measure the presence of ER, HER2, Ki-67 and PR proteins in the sample, for example a qualitative or quantitative measurement.
- the expression patterns of ER, HER2, Ki-67 and PR proteins can also be used to determine the heterogeneity of the protein expression.
- immunoassays are used to detect the presence of ER, HER2, Ki-67 and PR proteins in the sample.
- immunoassays include the use of one or more specific binding agents (such as antibodies) that can substantially only bind to the target peptide, such as ER, HER2, Ki-67 and PR.
- binding agents can include a detectable label (such as a radiolabel, fluorophore or enzyme), that permits detection of the binding to the protein.
- Exemplary immunoassays that can be used include, but are not limited to: Western blotting, ELISA, fluorescence microscopy, and flow cytometry. A particular immunoassay is immunohistochemistry.
- the specific binding agent is an antibody, such as a polyclonal or monoclonal antibody, or fragment thereof.
- the antibody is a humanized antibody.
- the antibody is a chimeric antibody.
- the antibody can include a detectable label to permit detection and in some cases quantification of the target protein/antibody complex. In other examples, the antibody is detected with an appropriate labeled secondary antibody.
- the antibodies for ER, PR, HER2 and Ki-67 are obtained from Ventana Medical Systems, Inc. (Tuscon, AZ). However, one skilled in the art will appreciate that other antibodies that can be used in the methods and kits provided herein are commercially available from other sources, such as: Novus Biologicals (Littleton, CO), Santa Cruz biotechnology, Inc. (Santa Cruz, CA), Abcam (Cambridge, MA), and Invitrogen (Carlsbad, CA).
- the presence of detectable signal above background or control levels indicates the presence of a target peptide (e.g., ER, HER2, Ki-67 and PR protein) in the sample.
- a target peptide e.g., ER, HER2, Ki-67 and PR protein
- the value obtained for the test breast cancer sample can be compared to a reference value, such as a reference value representing a value or range of values expected.
- the reference is a sample possessing a known or expected amount of ER, HER2, Ki-67 and PR protein.
- a breast cancer sample is obtained, and processed for IHC.
- the sample can be fixed and embedded, for example with formalin and paraffin.
- the sample can then be mounted on a support, such as a glass microscope slide.
- the sample can be microtomed into a series of thin sections, and the sections mounted onto one or more microscope slides.
- a single slide includes multiple tissue sections. Different sections of the breast cancer sample can then be individually labeled with antibodies specific for ER, HER2, Ki-67 or PR protein. That is, one section can be labeled with ER-specific antibodies, and another section can be labeled with HER2-specific antibodies, and so on.
- a single section of the breast cancer sample can be labeled with antibodies specific for two or more of ER, HER2, Ki-67 or PR protein. That is, one section can be labeled with ER-specific antibodies and with HER2-specific antibodies, and the antibodies distinguish by using different labels (wherein each label is specific for ER, HER2, Ki-67 or PR).
- the BenchMark ULTRA from Ventana Medical Systems, Inc. can be used to stain and process the slides.
- the slides containing the labeled sample are scanned and digitized, for example using the iScan Coreo (Ventana).
- Ventana the iScan Coreo
- ER, HER2, Ki-67 and PR protein which are detectably labeled in the sample
- at least one digital image can be obtained.
- two or more fields of view (FOV) for each protein are selected and annotated, for example by a pathologist.
- a breast cancer sample with detectably labeled ER, HER2, Ki-67 and PR for example one or more slides, such as 1, 2, 3 or 4 slides
- the breast cancer sample can be labeled with primary antibodies specific for each of ER, HER2, Ki-67 and PR, and appropriately labeled secondary antibodies (such as those labeled with a fluorophore or enzyme, such as DIG).
- the ultraView Red ISH DIG detection Kit is used as per the manufacturer's instructions (Ventana Medical Systems, Inc., Catalog # 760-505).
- One or more digital images of one or more slides containing the labeled breast cancer sample can be obtained, for example using microscope image scanning software.
- the one or more slides containing the one or more labeled breast cancer samples (or a digital image thereof) is evaluated for its overall staining, for example by a pathologist. For example, regions of heterogeneity in the staining can be detected for each of ER, HER2, Ki-67 and PR.
- At least one FOV having regional heterogeneity is selected (such as at least 2, at least 3, at least 4, or at least 5 different FOV areas of regional heterogeneity on the slide, such as 2, 3, 4, 5, 6, 7, 8, 9, or 10 FOVs), along with at least two other FOV that are similar to one another (such as at least 3, at least 4, or at least 5 different FOV areas on the slide that are similar to one another, such as 2, 3, 4, 5, 6, 7, 8, 9, or 10 FOVs).
- fewer FOV can be selected, such as at least 2, at least 3, at least 4, or at least 5 different FOV on the slide, such as 2, 3, 4 or 5 FOV on the slide.
- the percent positivity is determined for each FOV selected for PR and Ki-67 protein. Thus, if four FOV are selected for PR, then % positivity is determined for each of the four FOV. To calculate the % positivity, the total number of tumor cells in the FOV as well as the total number of tumor cells stained in the FOV ( e.g ., that are PR+) is determined. The % positivity is the total number of tumor cells stained in the FOV divided by the total number of tumor cells in the FOV. The % positivity for each FOV for a particular marker ( e.g ., PR) is averaged, resulting in a % positivity for PR and Ki-67.
- a particular marker e.g ., PR
- a binned score (on a sale of 0-3) is determined. For example, for each FOV, a binned score between 0 and 3 can be assigned to the staining based on evaluation of the FOV.
- a four-point scale can be used to describe the immunostaining of membrane surrounding a nucleus for HER2, as follows: 0, negative; 1, weak positivity; 2, moderate positivity; and 3+, strong positivity, for example as shown in Table 2. Cytoplasmic staining may still be present, but such staining need not be included in the determination.
- a binary score (0 or 1) can be determined for HER2 (e.g., based on individual FOVs or the FOVs collectively), wherein a positive result (1) corresponds to a staining score of 2 or 3, and a negative result (0) corresponds to a staining score of 0 or 1. Greater or less resolution can be used. For example a system using 0, 1, 2, and 3 can be used.
- the score for HER2 can be represented as a binned score (e.g ., 0, 1, 2, or 3) or as a binary value ( e.g ., 0 or 1) ( e.g ., the binary value is determined based on the binned score).
- an H-score is determined (e.g ., for the individual FOVs or the FOVs collectively).
- the H-score for ER is the percentage of cells showing weak staining, added to two times the percentage of cells staining moderately, added to three times the percentage of cells staining intensely, that is divided by 30 to arrive at a variable between 0-10 (ER 10 ).
- An H-score of more than 1 is positive.
- the percentage of cells staining positive for PR e.g ., capped at 10% was divided by 10 to obtain a variable between 0 and 10 (PR 10 ).
- an imaging algorithm can extract digital information from the slide (such as a breast cancer sample labeled to detect ER, HER2, Ki-67 or PR protein), transforming the digital image into score components (e.g ., measurements of % positivity, binned (or binary) score, and H-score).
- score components e.g ., measurements of % positivity, binned (or binary) score, and H-score.
- Heterogeneity refers to the spatial variation of histochemical and molecular staining patterns, such as the staining patterns for breast cancer biomarkers ER, HER2, Ki-67 and PR in a breast cancer sample. Heterogeneity can be an indicator of the spatial variation of tumor aggressiveness and/or growth patterns that can be correlated with an aggregated clinical phenotype (e.g ., a tumor likely to recur). It is shown herein that biological heterogeneity of ER, PR, HER2 and Ki-67 protein expression is correlated with the unpredictable recurrence of a fraction of early stage breast cancer patients.
- the method includes quantifying the regional heterogeneity in the sample for each of the four markers, which is computed from the scores from the selected FOV. Thus, for each marker, a quantitative measure of regional heterogeneity is determined. If the marker is homogenous or not detectable (e.g ., HER2-), then that value will fall out of the heterogeneity score calculation.
- Two or more fields of view (FOV) for each protein ER, HER2, Ki-67 and PR protein
- the FOV selected can be the same or different from the FOV selected to calculate the IHC4 score.
- a plurality of FOVs are selected, for example, 2, 3, 4, 5, 6, 7, 8, 9 or 10 FOVs.
- more FOVs may be selected, such as at least one FOV having regional heterogeneity (such as at least 2, at least 3, at least 4, or at least 5 different FOV areas of regional heterogeneity on the slide, such as 2, 3, 4, 5, 6, 7, 8, 9, or 10 FOVs), along with at least two other FOVs that are similar to one another (such as at least 3, at least 4, or at least 5 different FOV areas on the slide that are similar to one another, such as 2, 3, 4, 5, 6, 7, 8, 9, or 10 FOVs).
- fewer FOVs may be selected, such as at least 2, at least 3, at least 4, or at least 5 different FOVs on the slide, such as 2, 3, 4 or 5 FOVs on the
- FOVs it may be desirable to select additional FOVs to conclusively establish (e.g., confirm or prove) that regional heterogeneity is not present. However, if it is conclusively apparent that there is no regional heterogeneity, selecting additional FOVs may unnecessarily expend resources; therefore, fewer FOVs may be selected.
- FOVs with different % positivity are selected, as these areas indicate heterogeneity, for example regional heterogeneity.
- a heterogeneity score is determined for each of ER, Ki-67, HER2 and PR protein.
- HER2 is not determined (or the value falls out as there is no heterogeneity for HER2), for example if the sample is HER2 negative.
- Ki-67 is not determined (or the value falls out as there is no heterogeneity for Ki-67).
- the heterogeneity score is calculated as follows.
- the variability of percent positivity scores are calculated from heterogeneous regions in the selected FOV.
- a variability metric (VM) for each marker can be determined, wherein the VM is an indication of how different one selected FOV is from another FOV for the same protein. There are many ways this can be calculated, such as determining a standard deviation.
- Table 3 Types of heterogeneity Generic ER protein PR protein Ki67 protein HER2 protein HER2 gene Geographic 2 separate blocks, > 2 in apart Diffuse - focal Not applicable n.a. n.a. n.a.
- the output prognosis score is calculated from the IHC combination score and the heterogeneity score described above.
- the IHC combination score and the combined heterogeneity score are entered into a statistical analysis method (e.g., Cox proportional hazards model), to maximize the combined predictive capabilities of both measures.
- a statistical analysis method e.g., Cox proportional hazards model
- the model can be used to determine the progression-free survival (PFS) as outcome, such as a 1-, 3- or 5-year PFS or otherwise separate patients into categories.
- PFS progression-free survival
- the output prognosis score either is a high risk score (which indicates that early stage breast cancer is likely to recur, for example within 5 years, such as a local recurrence or a distant metastasis) or a low risk score (which indicates that early stage breast cancer is not likely to recur).
- the assay results (such as the output prognosis score), findings, prognosis, predictions and/or treatment recommendations are typically recorded and communicated to technicians, physicians and/or patients, for example.
- computers will be used to communicate such information to interested parties, such as, patients and/or the attending physicians.
- the therapy administered to a subject can be modified.
- a prognosis, prediction and/or treatment recommendation based on the output value is communicated to interested parties as soon as possible after the assay is completed and the prognosis is generated.
- the results and/or related information may be communicated to the subject by the subject's treating physician.
- the results may be communicated directly to interested parties by any means of communication, including writing, such as by providing a written report, electronic forms of communication, such as email, or telephone. Communication may be facilitated by use of a suitably programmed computer, such as in case of email communications.
- the communication containing results of a prognostic test and/or conclusions drawn from and/or treatment recommendations based on the test may be generated and delivered automatically to interested parties using a combination of computer hardware and software which will be familiar to artisans skilled in telecommunications.
- a healthcare-oriented communications system is described in U.S. Pat. No. 6,283,761 ; however, the present disclosure is not limited to methods which utilize this particular communications system.
- all or some of the method steps, including prognosis of breast cancer, and communicating of assay results or prognosis, may be carried out in diverse ( e.g ., foreign) jurisdictions.
- the disclosed methods can further include selecting subjects for treatment for breast cancer, for example if the sample is prognosed as an early stage breast cancer likely to recur.
- the disclosed methods can further include selecting subjects for no treatment (for example just monitoring), if the sample is diagnosed as an early stage breast cancer not likely to recur.
- one or more of the following operations may be performed depending on the patient's prognosis: a) prescribing a treatment regimen for the subject if the subject's determined prognosis is that the early stage breast cancer is likely to recur (such as treatment with one or more radiotherapies and/or chemotherapeutic agents, additional surgery, more frequent monitoring, or combinations thereof); b) not prescribing a treatment regimen for the subject if the subject's determined prognosis is that the early stage breast cancer is not likely to recur; c) recommending to administer a treatment (such as treatment with one or more radiotherapies and/or recommending to administer chemotherapeutic agents, additional surgery, or combinations thereof) to the subject if the subject's determined prognosis is that the early stage breast cancer is likely to recur; and d) recommending not to administer a treatment regimen to the subject if the subject's determined prognosis is that the early stage breast cancer is not likely to recur
- score components can refer to measurement of gene expression (e.g ., percent positivity or the like), H-score, binned score, binary score, or the like for one or more biomarkers.
- the resulting components can represent plural biomarkers.
- the slides can be digitized and automated image analysis algorithms can compute the percent positivity, binned score (e.g ., and convert to binary score) and H-Score for the fields (FOVs) selected by the pathologist.
- the pathologist annotates specific regions to quantify the inter-region intensity and regional heterogeneity. Using the automated image analysis for each region, positive and negative stained cell counts, percent positivity, and binned score (0, 1+, 2+, 3+) are computed.
- heterogeneity metrics based on these regional scores can be used.
- the heterogeneity score is based on the negative and positive (1+, 2+ and 3+) cell counts in the FOVs selected by the pathologist.
- the heterogeneity score captures the variation of scores within the selected FOVs.
- the score is a normalized function of the standard deviation of the scores from different FOVs.
- the chosen normalization parameter is marker-dependent, reflecting the fact that in general inter-region percent positivity score have higher variability for higher overall slide positivity score.
- FIG. 23 illustrates a generalized example of a suitable computing system 2300 in which several of the described innovations may be implemented.
- the computing system 2300 is not intended to suggest any limitation as to scope of use or functionality, as the innovations may be implemented in diverse general-purpose or special-purpose computing systems.
- Computing systems as described herein can be used to implement automated functionality (e.g ., processes, actions, and the like are performed by a computing system as described herein).
- the computing system 2300 includes one or more processing units 2310, 2315 and memory 2320, 2325.
- this basic configuration 2330 is included within a dashed line.
- the processing units 2310, 2315 execute computer-executable instructions.
- a processing unit can be a general-purpose central processing unit (CPU), processor in an application-specific integrated circuit (ASIC) or any other type of processor.
- ASIC application-specific integrated circuit
- FIG. 23 shows a central processing unit 2310 as well as a graphics processing unit or co-processing unit 2315.
- the tangible memory 2320, 2325 may be volatile memory (e.g ., registers, cache, RAM), nonvolatile memory (e.g., ROM, EEPROM, flash memory, etc.), or some combination of the two, accessible by the processing unit(s).
- volatile memory e.g ., registers, cache, RAM
- nonvolatile memory e.g., ROM, EEPROM, flash memory, etc.
- the memory 2320, 2325 stores software 2380 implementing one or more innovations described herein, in the form of computer-executable instructions suitable for execution by the processing unit(s).
- a computing system may have additional features.
- the computing system 2300 includes storage 2340, one or more input devices 2350, one or more output devices 2360, and one or more communication connections 2370.
- An interconnection mechanism such as a bus, controller, or network interconnects the components of the computing system 2300.
- operating system software provides an operating environment for other software executing in the computing system 2300, and coordinates activities of the components of the computing system 2300.
- the tangible storage 2340 may be removable or non-removable, and includes magnetic disks, magnetic tapes or cassettes, CD-ROMs, DVDs, or any other medium which can be used to store information in a non-transitory way and which can be accessed within the computing system 2300.
- the storage 2340 stores instructions for the software 2380 implementing one or more innovations described herein.
- the input device(s) 2350 may be a touch input device such as a keyboard, mouse, pen, or trackball, a voice input device, a scanning device, or another device that provides input to the computing system 2300.
- the input device(s) 2350 may be a camera, video card, TV tuner card, or similar device that accepts video input in analog or digital form, or a CD-ROM or CD-RW that reads video samples into the computing system 2300.
- the output device(s) 2360 may be a display, printer, speaker, CD-writer, or another device that provides output from the computing system 2300.
- the communication connection(s) 2370 enable communication over a communication medium to another computing entity.
- the communication medium conveys information such as computer-executable instructions, audio or video input or output, or other data in a modulated data signal.
- a modulated data signal is a signal that has one or more of its characteristics set or changed in such a manner as to encode information in the signal.
- communication media can use an electrical, optical, RF, or other carrier.
- Computer-readable media are any available tangible media that can be accessed within a computing environment.
- Computer-readable media include memory 2320, 2325, storage 2340, and combinations of any of the above.
- program modules include routines, programs, libraries, objects, classes, components, data structures, etc. that perform particular tasks or implement particular abstract data types.
- the functionality of the program modules may be combined or split between program modules as desired in various embodiments.
- Computer-executable instructions for program modules may be executed within a local or distributed computing system.
- system and “device” are used interchangeably herein. Unless the context clearly indicates otherwise, neither term implies any limitation on a type of computing system or computing device. In general, a computing system or computing device can be local or distributed, and can include any combination of special-purpose hardware and/or general-purpose hardware with software implementing the functionality described herein.
- Any of the computer-readable media herein can be non-transitory (e.g ., memory, magnetic storage, optical storage, or the like).
- Any of the storing actions described herein can be implemented by storing in one or more computer-readable media (e.g ., computer-readable storage media or other tangible media).
- computer-readable media e.g ., computer-readable storage media or other tangible media.
- Any of the things described as stored can be stored in one or more computer-readable media (e.g ., computer-readable storage media or other tangible media).
- computer-readable media e.g ., computer-readable storage media or other tangible media.
- Any of the methods described herein can be implemented by computer-executable instructions in ( e.g ., encoded on) one or more computer-readable media (e.g ., computer-readable storage media or other tangible media). Such instructions can cause a computer to perform the method.
- computer-executable instructions e.g ., encoded on
- computer-readable media e.g ., computer-readable storage media or other tangible media.
- Such instructions can cause a computer to perform the method.
- the technologies described herein can be implemented in a variety of programming languages.
- Any of the methods described herein can be implemented by computer-executable instructions stored in one or more computer-readable storage devices (e.g ., memory, magnetic storage, optical storage, or the like). Such instructions can cause a computer to perform the method.
- computer-executable instructions stored in one or more computer-readable storage devices (e.g ., memory, magnetic storage, optical storage, or the like). Such instructions can cause a computer to perform the method.
- This example describes methods used to predict early stage breast cancer recurrence risk.
- each of the heterogeneity measures and the IHC4 score were modeled using the cox proportional hazards model, which models time to distant recurrence.
- the three heterogeneity measures were very similar, thus the first heterogeneity measure for each of the four assays was used.
- the IHC4 score was modeled with each of the heterogeneity scores separately (using the cox model).
- the PR heterogeneity score measure was the most useful for determining time to distant recurrence, with ER adding some predictive power.
- Heterogeneity score square root(HET PR +HET ER ).
- the resulting HET score and the IHC4 score were entered into a cox proportional hazards model which takes the two linear variables and finds the best linear combination of the two to predict time to distant recurrence.
- this method accurately classified a breast cancer sample as one that is more (progression) or less (no progression) aggressive.
- the cases shown in FIG. 24 are the same cases used to create the algorithm.
Landscapes
- Health & Medical Sciences (AREA)
- Engineering & Computer Science (AREA)
- Life Sciences & Earth Sciences (AREA)
- Medical Informatics (AREA)
- General Health & Medical Sciences (AREA)
- Biomedical Technology (AREA)
- Public Health (AREA)
- Immunology (AREA)
- Chemical & Material Sciences (AREA)
- Physics & Mathematics (AREA)
- Pathology (AREA)
- Primary Health Care (AREA)
- Epidemiology (AREA)
- Urology & Nephrology (AREA)
- Hematology (AREA)
- Molecular Biology (AREA)
- Analytical Chemistry (AREA)
- Biotechnology (AREA)
- Databases & Information Systems (AREA)
- Data Mining & Analysis (AREA)
- Medicinal Chemistry (AREA)
- Food Science & Technology (AREA)
- Cell Biology (AREA)
- Microbiology (AREA)
- Biochemistry (AREA)
- Hospice & Palliative Care (AREA)
- Oncology (AREA)
- General Physics & Mathematics (AREA)
- Biophysics (AREA)
- Radiology & Medical Imaging (AREA)
- Nuclear Medicine, Radiotherapy & Molecular Imaging (AREA)
- Theoretical Computer Science (AREA)
- Spectroscopy & Molecular Physics (AREA)
- Evolutionary Biology (AREA)
- Bioinformatics & Computational Biology (AREA)
- Bioinformatics & Cheminformatics (AREA)
- Proteomics, Peptides & Aminoacids (AREA)
- Investigating Or Analysing Biological Materials (AREA)
- Investigating Or Analysing Materials By Optical Means (AREA)
Claims (14)
- Procédé pour pronostiquer le cancer du sein chez un sujet, comprenant : la sélection dans un échantillon de cancer du sein obtenu à partir du sujet d'au moins deux champs de vision différents (CDV) pour chacun parmi un récepteur des oestrogènes (ER), le récepteur 2 du facteur de croissance épidermique humain (HER2), Ki-67 et un récepteur de la progestérone (PR), dans lequel l'échantillon est marqué de façon détectable par des anticorps pour chacun des ER, HER2, Ki-67 et PR ;
la mesure de l'expression de protéines d'ER, d'HER2, de Ki-67 et de PR dans chacun des CDV sélectionnés ;
la détermination d'un score combiné IHC4 d'immunohistochimie (IHC), le score combiné d'immunohistochimie étant un score pronostic basé sur lesdits quatre marqueurs mesurés ;
la mesure de l'hétérogénéité des protéines d'ER et de PR dans chacun des CDV sélectionnés ;
la détermination d'un score d'hétérogénéité des protéines pour chaque ER et PR, le score d'hétérogénéité des protéines étant une indication du niveau d'hétérogénéité de l'expression des protéines d'un biomarqueur particulier dans différents CDV ;
la combinaison des scores d'hétérogénéité des protéines et du score combiné IHC, générant ainsi un score pronostic produit ; et
la détermination du fait que le cancer du sein chez le sujet est susceptible d'être agressif si le score de pronostic produit correspond à une valeur seuil ou la détermination du fait que le cancer du sein chez le sujet est peu susceptible d'être agressif si le score de pronostic produit ne correspond pas à la valeur seuil. - Procédé selon la revendication 1, dans lequel l'échantillon de cancer du sein est un échantillon de cancer du sein de stade précoce.
- Procédé selon la revendication 2, dans lequel l'échantillon de cancer du sein de stade précoce est HER2-négatif, ER-positif et sans envahissement des ganglions lymphatiques.
- Procédé selon l'une quelconque des revendications 1 à 3, dans lequel le procédé détermine un risque sur 5 ans de récurrence du cancer du sein.
- Procédé selon l'une quelconque des revendications 1 à 4, comprenant en outre l'obtention d'une image numérisée de l'échantillon de cancer du sein qui est marqué de façon détectable pour chacun des ER, HER2, Ki-67 et PR.
- Procédé selon l'une quelconque des revendications 1 à 5, dans lequel la mesure de l'expression des protéines d'ER, d'HER2, de Ki-67 et de PR comprend la détermination :du pourcentage de positivité pour chacun des ER, Ki-67 et PR ;du score regroupé d'HER2 ;du score H pour l'ER.
- Procédé selon l'une quelconque des revendications 1 à 6, dans lequel la détermination d'un score combiné d'IHC comprend l'utilisation de la formule IHC4 = 94,7 x {-0,100 ERio - 0,079 PRio + 0,586 HER2 + 0,240 In (1 + 10 x Ki67)}, dans lequel ERio est le score H pour ER, dans lequel PRio est un score du pourcentage de positivité ajusté pour PR, dans lequel HER2 est le score regroupé pour HER2, et Ki67 est le pourcentage de positivité pour Ki-67.
- Procédé selon l'une quelconque des revendications 1 à 7, dans lequel la mesure de l'hétérogénéité des protéines d'ER, de HER2, de Ki-67 et de PR comprend la détermination d'une mesure de variabilité (VM) pour chacun des ER, HER2, Ki-67 et PR, dans lequel VM = STD(PP(FSi), PP(FS2), ...PP(FSN)), et PP (FS) est un pourcentage de positivité pour chaque champ de vision, FS.
- Procédé selon l'une quelconque des revendications 1 à 8, dans lequel la détermination d'un score d'hétérogénéité des protéines pour chacun des ER et PR comprend l'utilisation de la formule

- Procédé selon l'une quelconque des revendications 1 à 9, dans lequel la détermination d'un score d'hétérogénéité de protéines pour HER2 comprend l'utilisation de la formule

- Procédé selon l'une quelconque des revendications 1 à 10, dans lequel la génération d'un score de pronostic produit comprend l'utilisation de la formule :

- Procédé selon l'une quelconque des revendications 1 à 11, dans lequel :le coefficient combiné d'immunohistochimie égale 0,03114 ; etle coefficient d'hétérogénéité égale 1,95119.
- Procédé selon l'une quelconque des revendications 1 à 12, dans lequel une ou plusieurs des étapes sont réalisées par un ordinateur programmé de façon appropriée.
- Procédé selon l'une quelconque des revendications 1 à 13, dans lequel la sélection dans un échantillon de cancer du sein d'au moins deux CDV différents est réalisée par un pathologiste.
Applications Claiming Priority (2)
| Application Number | Priority Date | Filing Date | Title |
|---|---|---|---|
| US201261747148P | 2012-12-28 | 2012-12-28 | |
| PCT/EP2013/077295 WO2014102130A1 (fr) | 2012-12-28 | 2013-12-19 | Analyse d'image pour pronostic de cancer du sein |
Publications (2)
| Publication Number | Publication Date |
|---|---|
| EP2939026A1 EP2939026A1 (fr) | 2015-11-04 |
| EP2939026B1 true EP2939026B1 (fr) | 2017-07-05 |
Family
ID=49917058
Family Applications (1)
| Application Number | Title | Priority Date | Filing Date |
|---|---|---|---|
| EP13815724.3A Active EP2939026B1 (fr) | 2012-12-28 | 2013-12-19 | Analyse d'image pour pronostic de cancer du sein |
Country Status (8)
| Country | Link |
|---|---|
| US (2) | US11211167B2 (fr) |
| EP (1) | EP2939026B1 (fr) |
| JP (1) | JP6405319B2 (fr) |
| AU (1) | AU2013369439B2 (fr) |
| CA (1) | CA2890964C (fr) |
| DK (1) | DK2939026T3 (fr) |
| ES (1) | ES2639559T3 (fr) |
| WO (1) | WO2014102130A1 (fr) |
Families Citing this family (36)
| Publication number | Priority date | Publication date | Assignee | Title |
|---|---|---|---|---|
| JP6822765B2 (ja) * | 2013-03-06 | 2021-01-27 | オプティカル バイオシステムズ ホールディング インコーポレイテッド | 分子イメージングおよび関連する方法 |
| WO2015189264A1 (fr) * | 2014-06-10 | 2015-12-17 | Ventana Medical Systems, Inc. | Prédiction d'une récurrence du cancer du sein directement à partir de caractéristiques d'image calculées à partir de lames de tissu d'immunohistopathologie numérisées |
| WO2016087592A1 (fr) | 2014-12-03 | 2016-06-09 | Ventana Medical Systems, Inc. | Systèmes et méthodes de pronostic de cancer à un stade précoce |
| US10672505B2 (en) | 2015-06-03 | 2020-06-02 | General Electric Company | Biological data annotation and visualization |
| US9953133B2 (en) | 2015-06-03 | 2018-04-24 | General Electric Company | Biological data annotation and visualization |
| US9613254B1 (en) | 2015-09-30 | 2017-04-04 | General Electric Company | Quantitative in situ characterization of heterogeneity in biological samples |
| US20170234874A1 (en) * | 2015-10-07 | 2017-08-17 | Clearbridge Biophotonics Pte Ltd. | Integrated visual morphology and cell protein expression using resonance-light scattering |
| CN110678934A (zh) * | 2017-06-02 | 2020-01-10 | 皇家飞利浦有限公司 | 医学图像中的病变的定量方面 |
| CN107271671A (zh) * | 2017-06-05 | 2017-10-20 | 龚畅 | 一种预测er(+)乳腺癌新辅助化疗效果的试剂盒和系统 |
| US10586376B2 (en) * | 2017-06-13 | 2020-03-10 | Optrascan, Inc. | Automated method of predicting efficacy of immunotherapy approaches |
| RU2664671C1 (ru) * | 2017-07-28 | 2018-08-21 | Федеральное государственное бюджетное учреждение "Национальный медицинский исследовательский центр онкологии имени Н.Н. Петрова" Министерства здравоохранения Российской Федерации | Способ прогноза рака молочной железы |
| EP3721406B1 (fr) | 2017-12-05 | 2024-01-24 | Ventana Medical Systems, Inc. | Procédé de calcul d'hétérogénéité spatiale et entre marqueurs de tumeur |
| US11568657B2 (en) | 2017-12-06 | 2023-01-31 | Ventana Medical Systems, Inc. | Method of storing and retrieving digital pathology analysis results |
| JP7197584B2 (ja) | 2017-12-06 | 2022-12-27 | ベンタナ メディカル システムズ, インコーポレイテッド | デジタル病理学分析結果の格納および読み出し方法 |
| JP7250793B2 (ja) | 2017-12-07 | 2023-04-03 | ベンタナ メディカル システムズ, インコーポレイテッド | 生体画像における連帯的細胞および領域分類のための深層学習システムならびに方法 |
| WO2019121564A2 (fr) | 2017-12-24 | 2019-06-27 | Ventana Medical Systems, Inc. | Approche de pathologie computationnelle pour une analyse rétrospective d'études d'essais cliniques reposant sur le diagnostic d'accompagnement basés sur des tissus |
| US11621058B2 (en) * | 2018-02-08 | 2023-04-04 | Ohio State Innovation Foundation | Synthetic IHC-stained digital sides generated using artificial neural networks |
| EP3776337A1 (fr) | 2018-04-13 | 2021-02-17 | Ventana Medical Systems, Inc. | Systèmes d'estimation de forme de cellule |
| JP2021531790A (ja) | 2018-07-27 | 2021-11-25 | ベンタナ メディカル システムズ, インコーポレイテッド | 自動化された原位置ハイブリッド形成分析のためのシステム |
| US11587667B2 (en) | 2018-08-31 | 2023-02-21 | Ventana Medical Systems, Inc. | Contextually adaptive digital pathology interface |
| EP3867803A1 (fr) | 2018-10-15 | 2021-08-25 | Ventana Medical Systems, Inc. | Systèmes et procédés de classification de cellules |
| EP3897360A4 (fr) * | 2018-12-19 | 2022-03-16 | University of Pittsburgh - of the Commonwealth System of Higher Education | Plateforme d'analyse spatiale de pathologie à systèmes de calcul pour données d'imagerie cellulaires et infracellulaires à paramètres multiples in situ ou in vitro |
| JP7227389B2 (ja) | 2019-02-13 | 2023-02-21 | ベンタナ メディカル システムズ, インコーポレイテッド | マルチチャネル画像における自己蛍光の寄与を算出するシステムおよび方法 |
| JPWO2020166469A1 (ja) * | 2019-02-15 | 2021-12-16 | コニカミノルタ株式会社 | 情報提供方法、情報提供装置及びプログラム |
| US11726757B2 (en) * | 2019-08-14 | 2023-08-15 | Nvidia Corporation | Processor for performing dynamic programming according to an instruction, and a method for configuring a processor for dynamic programming via an instruction |
| JP2022546430A (ja) | 2019-08-28 | 2022-11-04 | ベンタナ メディカル システムズ, インコーポレイテッド | 振動分光法によるバイオマーカー発現の無標識評価 |
| BR112022003451A2 (pt) * | 2019-09-09 | 2022-05-24 | Paige Ai Inc | Sistemas e métodos para processamento de imagens de lâminas para inferir biomarcadores |
| CN110853022B (zh) | 2019-11-14 | 2020-11-06 | 腾讯科技(深圳)有限公司 | 病理切片图像的处理方法、装置、系统及存储介质 |
| WO2021146705A1 (fr) | 2020-01-19 | 2021-07-22 | Ventana Medical Systems, Inc. | Segmentation non tumorale pour prendre en charge une détection et une analyse de tumeur |
| JP2023512560A (ja) | 2020-02-11 | 2023-03-27 | ヴェンタナ メディカル システムズ, インク. | 機械学習アルゴリズムを訓練し、患者のプライバシーを維持するための連合学習システム |
| WO2021183769A1 (fr) * | 2020-03-11 | 2021-09-16 | Biosyntagma, Inc. | Procédé de prédiction d'état pathologique, de réponse thérapeutique et de résultats par des biomarqueurs spatiaux |
| CN115552534A (zh) * | 2020-03-18 | 2022-12-30 | 赛诺菲 | 用于预测表达水平的系统和方法 |
| DE102020211271A1 (de) * | 2020-09-08 | 2022-03-10 | Siemens Healthcare Gmbh | Erzeugung eines Biomarkers quantifizierend eine räumliche Homogenität einer medizinischen Parameterkarte |
| CN112801939B (zh) * | 2020-12-31 | 2022-07-22 | 杭州迪英加科技有限公司 | 一种用于提高病理图像ki67指标准确性的方法 |
| WO2022264545A1 (fr) * | 2021-06-17 | 2022-12-22 | コニカミノルタ株式会社 | Procédé de quantification et procédé de marquage |
| WO2024035612A1 (fr) * | 2022-08-08 | 2024-02-15 | Ventana Medical Systems, Inc. | Système et procédé de quantification de lames pathologiques numérisées |
Family Cites Families (12)
| Publication number | Priority date | Publication date | Assignee | Title |
|---|---|---|---|---|
| US4444487A (en) | 1979-07-02 | 1984-04-24 | Xerox Corporation | Multiple-flash fuser |
| GB8308235D0 (en) | 1983-03-25 | 1983-05-05 | Celltech Ltd | Polypeptides |
| US4816567A (en) | 1983-04-08 | 1989-03-28 | Genentech, Inc. | Recombinant immunoglobin preparations |
| US4745055A (en) | 1985-05-07 | 1988-05-17 | California Biotechnology Inc. | Fused protein for enzyme immunoassay system |
| ATE143052T1 (de) | 1986-07-07 | 1996-10-15 | Centocor Inc | Chimärisches murine-mensch-immunoglobulin, spezifisch für tumorassoziertes 17-1a antigen |
| GB8626412D0 (en) | 1986-11-05 | 1986-12-03 | Clark M R | Antibodies |
| US6283761B1 (en) | 1992-09-08 | 2001-09-04 | Raymond Anthony Joao | Apparatus and method for processing and/or for providing healthcare information and/or healthcare-related information |
| GB0229734D0 (en) | 2002-12-23 | 2003-01-29 | Qinetiq Ltd | Grading oestrogen and progesterone receptors expression |
| US20050136549A1 (en) * | 2003-10-30 | 2005-06-23 | Bioimagene, Inc. | Method and system for automatically determining diagnostic saliency of digital images |
| US8787651B2 (en) * | 2010-09-28 | 2014-07-22 | Flagship Biosciences, LLC | Methods for feature analysis on consecutive tissue sections |
| US9286672B2 (en) * | 2012-01-10 | 2016-03-15 | Rutgers, The State University Of New Jersey | Integrated multivariate image-based method for disease outcome predicition |
| JP2013200287A (ja) * | 2012-03-26 | 2013-10-03 | Kawasaki Gakuen | Ki−67インデックス算定二重染色法を用いた陽性率測定方法 |
-
2013
- 2013-12-19 EP EP13815724.3A patent/EP2939026B1/fr active Active
- 2013-12-19 ES ES13815724.3T patent/ES2639559T3/es active Active
- 2013-12-19 JP JP2015550033A patent/JP6405319B2/ja active Active
- 2013-12-19 CA CA2890964A patent/CA2890964C/fr active Active
- 2013-12-19 DK DK13815724.3T patent/DK2939026T3/en active
- 2013-12-19 US US14/653,831 patent/US11211167B2/en active Active
- 2013-12-19 AU AU2013369439A patent/AU2013369439B2/en active Active
- 2013-12-19 WO PCT/EP2013/077295 patent/WO2014102130A1/fr active Application Filing
-
2021
- 2021-10-28 US US17/512,812 patent/US20220051804A1/en active Pending
Non-Patent Citations (1)
| Title |
|---|
| None * |
Also Published As
| Publication number | Publication date |
|---|---|
| DK2939026T3 (en) | 2017-09-11 |
| CA2890964A1 (fr) | 2014-07-03 |
| AU2013369439A1 (en) | 2015-05-28 |
| WO2014102130A1 (fr) | 2014-07-03 |
| US11211167B2 (en) | 2021-12-28 |
| JP6405319B2 (ja) | 2018-10-17 |
| AU2013369439B2 (en) | 2019-01-17 |
| ES2639559T3 (es) | 2017-10-27 |
| US20150347702A1 (en) | 2015-12-03 |
| JP2016503167A (ja) | 2016-02-01 |
| EP2939026A1 (fr) | 2015-11-04 |
| US20220051804A1 (en) | 2022-02-17 |
| CA2890964C (fr) | 2023-07-25 |
Similar Documents
| Publication | Publication Date | Title |
|---|---|---|
| US20220051804A1 (en) | Image Analysis for Breast Cancer Prognosis | |
| Zhong et al. | A comparison of visual assessment and automated digital image analysis of Ki67 labeling index in breast cancer | |
| Lloyd et al. | Using image analysis as a tool for assessment of prognostic and predictive biomarkers for breast cancer: How reliable is it? | |
| Choudhury et al. | A robust automated measure of average antibody staining in immunohistochemistry images | |
| Cuzick et al. | Prognostic value of a combined estrogen receptor, progesterone receptor, Ki-67, and human epidermal growth factor receptor 2 immunohistochemical score and comparison with the Genomic Health recurrence score in early breast cancer | |
| Brügmann et al. | Digital image analysis of membrane connectivity is a robust measure of HER2 immunostains | |
| Niikura et al. | Prognostic significance of the Ki67 scoring categories in breast cancer subgroups | |
| Holten-Rossing et al. | Optimizing HER2 assessment in breast cancer: application of automated image analysis | |
| Varga et al. | Standardization for Ki-67 assessment in moderately differentiated breast cancer. A retrospective analysis of the SAKK 28/12 study | |
| WO2019020556A1 (fr) | Méthodes et systèmes d'évaluation d'infiltrat de cellules immunitaires dans des échantillons de tumeurs | |
| JP2018504674A (ja) | 早期癌予知のための計算病理学システム及び方法 | |
| Sun et al. | Quantum dot-based immunofluorescent imaging of Ki67 and identification of prognostic value in HER2-positive (non-luminal) breast cancer | |
| Yamazaki et al. | Comparison of the methods for measuring the Ki-67 labeling index in adrenocortical carcinoma: manual versus digital image analysis | |
| CN112789684A (zh) | 用于预测对pd-1轴导向疗法的应答的方法和系统 | |
| Feng et al. | Low Ki67/high ATM protein expression in malignant tumors predicts favorable prognosis in a retrospective study of early stage hormone receptor positive breast cancer | |
| Kim et al. | Risk factors associated with discordant Ki-67 levels between preoperative biopsy and postoperative surgical specimens in breast cancers | |
| Qi et al. | Concordance of the 21-gene assay between core needle biopsy and resection specimens in early breast cancer patients | |
| Cho et al. | The long-term prognostic performance of Ki-67 in primary operable breast cancer and evaluation of its optimal cutoff value | |
| Chao et al. | Assessment of HER2 status using immunohistochemistry (IHC) and fluorescence in situ hybridization (FISH) techniques in mucinous epithelial ovarian cancer: A comprehensive comparison between ToGA biopsy method and ToGA surgical specimen method | |
| Boyraz et al. | Discerning subsets of breast cancer with very low and absent HER2 protein expression | |
| Sode et al. | Digital image analysis and assisted reading of the HER2 score display reduced concordance: pitfalls in the categorisation of HER2‐low breast cancer | |
| Fischer et al. | Multiplex imaging of breast cancer lymph node metastases identifies prognostic single-cell populations independent of clinical classifiers | |
| Miller et al. | Objective analysis of cancer stem cell marker expression using immunohistochemistry | |
| Jing et al. | Validity and reliability of Ki-67 assessment in oestrogen receptor positive breast cancer | |
| Singh et al. | Analytical validation of quantitative immunohistochemical assays of tumor infiltrating lymphocyte biomarkers |
Legal Events
| Date | Code | Title | Description |
|---|---|---|---|
| PUAI | Public reference made under article 153(3) epc to a published international application that has entered the european phase |
Free format text: ORIGINAL CODE: 0009012 |
|
| 17P | Request for examination filed |
Effective date: 20150728 |
|
| AK | Designated contracting states |
Kind code of ref document: A1 Designated state(s): AL AT BE BG CH CY CZ DE DK EE ES FI FR GB GR HR HU IE IS IT LI LT LU LV MC MK MT NL NO PL PT RO RS SE SI SK SM TR |
|
| AX | Request for extension of the european patent |
Extension state: BA ME |
|
| RIN1 | Information on inventor provided before grant (corrected) |
Inventor name: TUBBS, RAYMOND Inventor name: WARING, PAUL MICHAEL Inventor name: SINGH, SHALINI Inventor name: WICK, NIKOLAUS Inventor name: SERTEL, OLCAY Inventor name: CHUKKA, SRINIVAS Inventor name: SARKAR, ANINDYA Inventor name: SCHEMP, CRYSTAL |
|
| DAX | Request for extension of the european patent (deleted) | ||
| 17Q | First examination report despatched |
Effective date: 20160825 |
|
| GRAJ | Information related to disapproval of communication of intention to grant by the applicant or resumption of examination proceedings by the epo deleted |
Free format text: ORIGINAL CODE: EPIDOSDIGR1 |
|
| GRAP | Despatch of communication of intention to grant a patent |
Free format text: ORIGINAL CODE: EPIDOSNIGR1 |
|
| GRAP | Despatch of communication of intention to grant a patent |
Free format text: ORIGINAL CODE: EPIDOSNIGR1 |
|
| INTG | Intention to grant announced |
Effective date: 20170222 |
|
| GRAS | Grant fee paid |
Free format text: ORIGINAL CODE: EPIDOSNIGR3 |
|
| GRAA | (expected) grant |
Free format text: ORIGINAL CODE: 0009210 |
|
| AK | Designated contracting states |
Kind code of ref document: B1 Designated state(s): AL AT BE BG CH CY CZ DE DK EE ES FI FR GB GR HR HU IE IS IT LI LT LU LV MC MK MT NL NO PL PT RO RS SE SI SK SM TR |
|
| REG | Reference to a national code |
Ref country code: GB Ref legal event code: FG4D |
|
| REG | Reference to a national code |
Ref country code: CH Ref legal event code: EP |
|
| REG | Reference to a national code |
Ref country code: AT Ref legal event code: REF Ref document number: 906959 Country of ref document: AT Kind code of ref document: T Effective date: 20170715 |
|
| REG | Reference to a national code |
Ref country code: IE Ref legal event code: FG4D |
|
| REG | Reference to a national code |
Ref country code: DE Ref legal event code: R096 Ref document number: 602013023203 Country of ref document: DE |
|
| REG | Reference to a national code |
Ref country code: DK Ref legal event code: T3 Effective date: 20170905 |
|
| REG | Reference to a national code |
Ref country code: CH Ref legal event code: NV Representative=s name: LATSCHA SCHOELLHORN PARTNER AG, CH |
|
| REG | Reference to a national code |
Ref country code: ES Ref legal event code: FG2A Ref document number: 2639559 Country of ref document: ES Kind code of ref document: T3 Effective date: 20171027 |
|
| REG | Reference to a national code |
Ref country code: NL Ref legal event code: MP Effective date: 20170705 |
|
| REG | Reference to a national code |
Ref country code: AT Ref legal event code: MK05 Ref document number: 906959 Country of ref document: AT Kind code of ref document: T Effective date: 20170705 |
|
| REG | Reference to a national code |
Ref country code: FR Ref legal event code: PLFP Year of fee payment: 5 |
|
| REG | Reference to a national code |
Ref country code: LT Ref legal event code: MG4D |
|
| PG25 | Lapsed in a contracting state [announced via postgrant information from national office to epo] |
Ref country code: AT Free format text: LAPSE BECAUSE OF FAILURE TO SUBMIT A TRANSLATION OF THE DESCRIPTION OR TO PAY THE FEE WITHIN THE PRESCRIBED TIME-LIMIT Effective date: 20170705 Ref country code: HR Free format text: LAPSE BECAUSE OF FAILURE TO SUBMIT A TRANSLATION OF THE DESCRIPTION OR TO PAY THE FEE WITHIN THE PRESCRIBED TIME-LIMIT Effective date: 20170705 Ref country code: FI Free format text: LAPSE BECAUSE OF FAILURE TO SUBMIT A TRANSLATION OF THE DESCRIPTION OR TO PAY THE FEE WITHIN THE PRESCRIBED TIME-LIMIT Effective date: 20170705 Ref country code: NL Free format text: LAPSE BECAUSE OF FAILURE TO SUBMIT A TRANSLATION OF THE DESCRIPTION OR TO PAY THE FEE WITHIN THE PRESCRIBED TIME-LIMIT Effective date: 20170705 Ref country code: SE Free format text: LAPSE BECAUSE OF FAILURE TO SUBMIT A TRANSLATION OF THE DESCRIPTION OR TO PAY THE FEE WITHIN THE PRESCRIBED TIME-LIMIT Effective date: 20170705 Ref country code: LT Free format text: LAPSE BECAUSE OF FAILURE TO SUBMIT A TRANSLATION OF THE DESCRIPTION OR TO PAY THE FEE WITHIN THE PRESCRIBED TIME-LIMIT Effective date: 20170705 Ref country code: NO Free format text: LAPSE BECAUSE OF FAILURE TO SUBMIT A TRANSLATION OF THE DESCRIPTION OR TO PAY THE FEE WITHIN THE PRESCRIBED TIME-LIMIT Effective date: 20171005 |
|
| PG25 | Lapsed in a contracting state [announced via postgrant information from national office to epo] |
Ref country code: RS Free format text: LAPSE BECAUSE OF FAILURE TO SUBMIT A TRANSLATION OF THE DESCRIPTION OR TO PAY THE FEE WITHIN THE PRESCRIBED TIME-LIMIT Effective date: 20170705 Ref country code: BG Free format text: LAPSE BECAUSE OF FAILURE TO SUBMIT A TRANSLATION OF THE DESCRIPTION OR TO PAY THE FEE WITHIN THE PRESCRIBED TIME-LIMIT Effective date: 20171005 Ref country code: PL Free format text: LAPSE BECAUSE OF FAILURE TO SUBMIT A TRANSLATION OF THE DESCRIPTION OR TO PAY THE FEE WITHIN THE PRESCRIBED TIME-LIMIT Effective date: 20170705 Ref country code: GR Free format text: LAPSE BECAUSE OF FAILURE TO SUBMIT A TRANSLATION OF THE DESCRIPTION OR TO PAY THE FEE WITHIN THE PRESCRIBED TIME-LIMIT Effective date: 20171006 Ref country code: IS Free format text: LAPSE BECAUSE OF FAILURE TO SUBMIT A TRANSLATION OF THE DESCRIPTION OR TO PAY THE FEE WITHIN THE PRESCRIBED TIME-LIMIT Effective date: 20171105 Ref country code: LV Free format text: LAPSE BECAUSE OF FAILURE TO SUBMIT A TRANSLATION OF THE DESCRIPTION OR TO PAY THE FEE WITHIN THE PRESCRIBED TIME-LIMIT Effective date: 20170705 |
|
| REG | Reference to a national code |
Ref country code: DE Ref legal event code: R097 Ref document number: 602013023203 Country of ref document: DE |
|
| PG25 | Lapsed in a contracting state [announced via postgrant information from national office to epo] |
Ref country code: CZ Free format text: LAPSE BECAUSE OF FAILURE TO SUBMIT A TRANSLATION OF THE DESCRIPTION OR TO PAY THE FEE WITHIN THE PRESCRIBED TIME-LIMIT Effective date: 20170705 Ref country code: RO Free format text: LAPSE BECAUSE OF FAILURE TO SUBMIT A TRANSLATION OF THE DESCRIPTION OR TO PAY THE FEE WITHIN THE PRESCRIBED TIME-LIMIT Effective date: 20170705 |
|
| PLBE | No opposition filed within time limit |
Free format text: ORIGINAL CODE: 0009261 |
|
| STAA | Information on the status of an ep patent application or granted ep patent |
Free format text: STATUS: NO OPPOSITION FILED WITHIN TIME LIMIT |
|
| PG25 | Lapsed in a contracting state [announced via postgrant information from national office to epo] |
Ref country code: EE Free format text: LAPSE BECAUSE OF FAILURE TO SUBMIT A TRANSLATION OF THE DESCRIPTION OR TO PAY THE FEE WITHIN THE PRESCRIBED TIME-LIMIT Effective date: 20170705 Ref country code: SM Free format text: LAPSE BECAUSE OF FAILURE TO SUBMIT A TRANSLATION OF THE DESCRIPTION OR TO PAY THE FEE WITHIN THE PRESCRIBED TIME-LIMIT Effective date: 20170705 Ref country code: SK Free format text: LAPSE BECAUSE OF FAILURE TO SUBMIT A TRANSLATION OF THE DESCRIPTION OR TO PAY THE FEE WITHIN THE PRESCRIBED TIME-LIMIT Effective date: 20170705 |
|
| 26N | No opposition filed |
Effective date: 20180406 |
|
| PG25 | Lapsed in a contracting state [announced via postgrant information from national office to epo] |
Ref country code: SI Free format text: LAPSE BECAUSE OF FAILURE TO SUBMIT A TRANSLATION OF THE DESCRIPTION OR TO PAY THE FEE WITHIN THE PRESCRIBED TIME-LIMIT Effective date: 20170705 |
|
| REG | Reference to a national code |
Ref country code: IE Ref legal event code: MM4A |
|
| PG25 | Lapsed in a contracting state [announced via postgrant information from national office to epo] |
Ref country code: LU Free format text: LAPSE BECAUSE OF NON-PAYMENT OF DUE FEES Effective date: 20171219 Ref country code: MT Free format text: LAPSE BECAUSE OF NON-PAYMENT OF DUE FEES Effective date: 20171219 |
|
| REG | Reference to a national code |
Ref country code: BE Ref legal event code: MM Effective date: 20171231 |
|
| PG25 | Lapsed in a contracting state [announced via postgrant information from national office to epo] |
Ref country code: IE Free format text: LAPSE BECAUSE OF NON-PAYMENT OF DUE FEES Effective date: 20171219 |
|
| REG | Reference to a national code |
Ref country code: CH Ref legal event code: PCAR Free format text: NEW ADDRESS: GRELLINGERSTRASSE 60, 4052 BASEL (CH) |
|
| PG25 | Lapsed in a contracting state [announced via postgrant information from national office to epo] |
Ref country code: BE Free format text: LAPSE BECAUSE OF NON-PAYMENT OF DUE FEES Effective date: 20171231 |
|
| PG25 | Lapsed in a contracting state [announced via postgrant information from national office to epo] |
Ref country code: MC Free format text: LAPSE BECAUSE OF FAILURE TO SUBMIT A TRANSLATION OF THE DESCRIPTION OR TO PAY THE FEE WITHIN THE PRESCRIBED TIME-LIMIT Effective date: 20170705 Ref country code: HU Free format text: LAPSE BECAUSE OF FAILURE TO SUBMIT A TRANSLATION OF THE DESCRIPTION OR TO PAY THE FEE WITHIN THE PRESCRIBED TIME-LIMIT; INVALID AB INITIO Effective date: 20131219 |
|
| PG25 | Lapsed in a contracting state [announced via postgrant information from national office to epo] |
Ref country code: CY Free format text: LAPSE BECAUSE OF FAILURE TO SUBMIT A TRANSLATION OF THE DESCRIPTION OR TO PAY THE FEE WITHIN THE PRESCRIBED TIME-LIMIT Effective date: 20170705 |
|
| PG25 | Lapsed in a contracting state [announced via postgrant information from national office to epo] |
Ref country code: MK Free format text: LAPSE BECAUSE OF FAILURE TO SUBMIT A TRANSLATION OF THE DESCRIPTION OR TO PAY THE FEE WITHIN THE PRESCRIBED TIME-LIMIT Effective date: 20170705 |
|
| PG25 | Lapsed in a contracting state [announced via postgrant information from national office to epo] |
Ref country code: TR Free format text: LAPSE BECAUSE OF FAILURE TO SUBMIT A TRANSLATION OF THE DESCRIPTION OR TO PAY THE FEE WITHIN THE PRESCRIBED TIME-LIMIT Effective date: 20170705 |
|
| PG25 | Lapsed in a contracting state [announced via postgrant information from national office to epo] |
Ref country code: PT Free format text: LAPSE BECAUSE OF FAILURE TO SUBMIT A TRANSLATION OF THE DESCRIPTION OR TO PAY THE FEE WITHIN THE PRESCRIBED TIME-LIMIT Effective date: 20170705 |
|
| PG25 | Lapsed in a contracting state [announced via postgrant information from national office to epo] |
Ref country code: AL Free format text: LAPSE BECAUSE OF FAILURE TO SUBMIT A TRANSLATION OF THE DESCRIPTION OR TO PAY THE FEE WITHIN THE PRESCRIBED TIME-LIMIT Effective date: 20170705 |
|
| PGFP | Annual fee paid to national office [announced via postgrant information from national office to epo] |
Ref country code: IT Payment date: 20221221 Year of fee payment: 10 |
|
| PGFP | Annual fee paid to national office [announced via postgrant information from national office to epo] |
Ref country code: GB Payment date: 20231121 Year of fee payment: 11 |
|
| PGFP | Annual fee paid to national office [announced via postgrant information from national office to epo] |
Ref country code: FR Payment date: 20231122 Year of fee payment: 11 Ref country code: DK Payment date: 20231121 Year of fee payment: 11 Ref country code: DE Payment date: 20231121 Year of fee payment: 11 |
|
| PGFP | Annual fee paid to national office [announced via postgrant information from national office to epo] |
Ref country code: ES Payment date: 20240102 Year of fee payment: 11 |
|
| PGFP | Annual fee paid to national office [announced via postgrant information from national office to epo] |
Ref country code: CH Payment date: 20240101 Year of fee payment: 11 |