EP2244086B1 - Analyse optischer Daten mit Hilfe von Histogrammen - Google Patents
Analyse optischer Daten mit Hilfe von Histogrammen Download PDFInfo
- Publication number
- EP2244086B1 EP2244086B1 EP10008491.2A EP10008491A EP2244086B1 EP 2244086 B1 EP2244086 B1 EP 2244086B1 EP 10008491 A EP10008491 A EP 10008491A EP 2244086 B1 EP2244086 B1 EP 2244086B1
- Authority
- EP
- European Patent Office
- Prior art keywords
- detection area
- area
- sample
- analyte
- wetted
- Prior art date
- Legal status (The legal status is an assumption and is not a legal conclusion. Google has not performed a legal analysis and makes no representation as to the accuracy of the status listed.)
- Expired - Lifetime
Links
Images

Classifications
-
- G—PHYSICS
- G06—COMPUTING OR CALCULATING; COUNTING
- G06T—IMAGE DATA PROCESSING OR GENERATION, IN GENERAL
- G06T7/00—Image analysis
- G06T7/0002—Inspection of images, e.g. flaw detection
- G06T7/0012—Biomedical image inspection
-
- G—PHYSICS
- G01—MEASURING; TESTING
- G01N—INVESTIGATING OR ANALYSING MATERIALS BY DETERMINING THEIR CHEMICAL OR PHYSICAL PROPERTIES
- G01N21/00—Investigating or analysing materials by the use of optical means, i.e. using sub-millimetre waves, infrared, visible or ultraviolet light
- G01N21/84—Systems specially adapted for particular applications
- G01N21/8483—Investigating reagent band
-
- G—PHYSICS
- G06—COMPUTING OR CALCULATING; COUNTING
- G06T—IMAGE DATA PROCESSING OR GENERATION, IN GENERAL
- G06T7/00—Image analysis
- G06T7/40—Analysis of texture
- G06T7/41—Analysis of texture based on statistical description of texture
-
- G—PHYSICS
- G06—COMPUTING OR CALCULATING; COUNTING
- G06T—IMAGE DATA PROCESSING OR GENERATION, IN GENERAL
- G06T2207/00—Indexing scheme for image analysis or image enhancement
- G06T2207/10—Image acquisition modality
- G06T2207/10056—Microscopic image
-
- G—PHYSICS
- G06—COMPUTING OR CALCULATING; COUNTING
- G06T—IMAGE DATA PROCESSING OR GENERATION, IN GENERAL
- G06T2207/00—Indexing scheme for image analysis or image enhancement
- G06T2207/30—Subject of image; Context of image processing
- G06T2207/30004—Biomedical image processing
- G06T2207/30024—Cell structures in vitro; Tissue sections in vitro
Definitions
- the invention lies in the field of the optical analysis of small sample volumes, such as occur, for example, in the diagnosis of blood samples.
- test elements wetted with blood are analyzed.
- These handheld devices are of great importance, for example, in the diagnosis of diabetes.
- the measurement in these devices is mainly carried out electrochemically or optically.
- the sample is illuminated with light and the reflected light is detected in order to determine the analyte concentration.
- test elements such as test strips are used, which are wetted with the sample such as blood or interstitial fluid.
- the sample then reacts with the reagents that are applied to this test element. This can lead to a color change which can then be detected.
- a capture molecule is immobilized on the test field surface and a reaction with the analyte is optically detected.
- the frequency of light intensities at different locations is determined here.
- a threshold value is set that only takes into account measured values for evaluation that are above a certain intensity. In this way, signals from the unresponsive background can be distinguished from useful signals. Since an immunological reaction takes place here too, which must take into account non-specifically bound marker molecules, the application of the sample is necessary both to areas with capture molecules and to areas without capture molecules.
- US 6847451 The patent application US 6847451 describes a method for the optical determination of an analyte in a liquid on a test field.
- the analyte reacts with an enzyme on the test field and a dye is formed which is detected optically.
- this Patent solves the problem that too small a sample amount does not wet the entire test field and leads to incorrect results in the case of integral evaluation. This is avoided by a spatially resolved measurement in which only test areas are evaluated whose intensity exceeds a threshold value.
- a disadvantage of this method is the integration over a large area of the test field, which can be inhomogeneous in itself. Since small concentrations are also to be measured, the threshold value must not be set too low.
- the object of the invention is to provide a simple and efficient method for identifying defective test elements.
- the invention discloses a method for quality control of a detection area of a test element according to claim 1.
- a system for determining the concentration of an analyte in a liquid is described herein, with an illumination or detection unit for detecting light intensities which are emitted from partial areas of a detection area of a test element. Furthermore, an evaluation unit is described which determines a frequency distribution for the detected light intensities, the frequency distribution having at least a first maximum caused by unwetted partial areas or at least one reference area and a second maximum caused by wetted partial areas and selecting at least one light intensity based on the frequency distribution and the concentration of the analyte with small sample volumes is determined from the at least one selected light intensity.
- Liquids are primarily physiological fluids such as blood (venous or capillary), blood components, interstitial fluid, plasma, serum, urine or saliva, but are not restricted to them.
- blood venous or capillary
- interstitial fluid plasma, serum, urine or saliva
- blood is primarily used as a sample. This is to be seen as an example for the term liquid and is not to be understood as restrictive.
- Blood samples are primarily required for self-tests by patients who have to regularly examine a blood parameter, such as in the case of diabetics.
- a blood parameter such as in the case of diabetics.
- the puncture depth is chosen as low as possible. Little blood is obtained in this process.
- the analytical methods must be able to precisely measure ever smaller blood volumes.
- the system described here is therefore even suitable for the analysis of sample volumes below 100 nl.
- a preferred volume range is between 1 and 500 nl, a particularly preferred volume range is between 10 and 100 nl.
- larger volumes can also be measured.
- the amount of sample to be analyzed can still be below 1 nl.
- a system is described that enables very small sample volumes to be analyzed regardless of their applied shape. This is done with the help of frequency determinations of light intensities of the reacted areas on the detection area in the form of a histogram.
- the intensities of the wetted areas correlate with the concentration of the analyte in the sample.
- a distinction is made between 256 intensities. This number of intensity levels is sufficient to achieve a sufficient Achieve precision / resolution to determine the concentration of the analyte.
- the amount of data can be kept so small that it can be processed using small data carriers either in an evaluation unit in the detector itself or in an evaluation unit separate from the detector.
- systems from the prior art which further process all intensity values to evaluate the spatially resolved measurements, in the system described here for calculating the concentration of the analyte, preferably only certain frequencies and the intensities associated therewith are used.
- the frequency distribution of the intensities on the detection area can be determined.
- the sub-areas of the detection area have very similar intensities or the gray values determined from them.
- intensities of partial areas can be determined before or after application of the sample, which are detected by a reference area.
- This reference area can be part of the detection area or outside the detection area. No reaction takes place in or on this reference area, regardless of whether the reference area is wetted by the sample or not.
- the unwetted partial areas or the reference area can be recognized by a first maximum, which has a narrow distribution of intensities or gray levels around the maximum.
- a maximum of the frequencies is characterized in that the curve which reproduces the frequencies has a slope of zero at the point of the maximum.
- An unused test element ideally has intensities in a small intensity range in its detection area. If this is the case, it can be assumed that only a few or no defects can be found in the detection area. This is the prerequisite for an error-free measurement of a sample. If a significant number of intensities lie outside of this small “normal” intensity interval, it can be assumed that an error-free measurement is not possible with this test element. This can be used as a quality control to exclude faulty test elements from the measurement.
- the test element darkens in the detected wavelength range at the wetted areas of the detection area. This means a reduction in intensity in the wetted areas.
- the reagent On the detection area, there is a corresponding number of test fields which have a similar intensity. A redistribution of frequencies of the intensities due to the discoloration of the detection area can be seen in the histogram. An accumulation of gray values takes place at a lower intensity. A second maximum can be seen in the histogram, which originates from the wetted partial areas. When the detection area is completely wetted, all gray values of the first maximum are shifted to a different gray value. The more homogeneously the reagent or the sample is distributed, the narrower the distribution around the mean intensity value of the shifted intensity values of the wetted areas.
- This distribution of the intensity frequencies before and after application of the sample to the detection area can be used to determine the analyte.
- the differences in intensity of the maximum values in the frequency distribution before and after wetting of the detection area are used to determine the concentration of the analyte.
- a further preferred embodiment is the evaluation on the basis of the speeds of the change in the frequencies of the emitted light intensities after the detection area has been wetted.
- a multivariate analysis can be carried out primarily for the temporal consideration of the change in frequencies, but also for the other evaluation methods.
- Another possibility for determining the analyte concentration is to determine the gradient of the intensity curve between the lowest intensity and the most frequent intensity of the wetted area. For example, the intensity that has the greatest frequency of an intensity interval or gray value can be used to determine the analyte.
- Another possibility for determining the concentration of the analyte can be carried out on the basis of intensities which exceed a frequency threshold value. This frequency threshold ensures that the area is used for the evaluation that has the most homogeneous discoloration of the wetted area.
- the system also has the option of quality control based on the frequency distribution.
- the distribution of the intensities is small with ideal distribution of the reagent on the test element.
- the broader this intensity distribution the more inhomogeneous the reaction took place.
- the inhomogeneity of the reaction depends both on the distribution of the reagent in or on the detection area and on the spread of the drop on the detection area.
- this drop can have an edge area of different sizes on the detection area.
- the reaction of the blood in this edge area with the reagents in or on the detection area can behave differently than in the center of the sample drop.
- an intensity frequency of the unwetted detection area of the test element is determined. This can be done before applying a test drop or afterwards, depending on whether the detection area is completely wetted or not.
- the method includes the detection of light intensities of the light emitted from at least a partial area of the detection area. These light intensities are evaluated on the basis of their frequencies as described above.
- an instrument which has a detection unit for the detection of light intensities which are emitted from subregions of a detection area of a test element and an evaluation unit which determines the concentration of the analyte on the basis of frequencies of light intensities of the light emitted from the subregions
- the detection unit may contain a CMOS detector, the pixel of which is connected to at least one A / D converter.
- the evaluation unit can be connected to a display unit, or the display unit can be integrated into the evaluation unit.
- the detection unit and evaluation unit are integrated on a chip. This offers the advantage that the instrument can be strongly integrated and thus set up in a space-saving manner. Since the memory requirement for the evaluation is very small due to the reduced amount of data, the power requirement of such an integrated element is also significantly lower than with conventional instruments.
- test elements can be used as they are from the documents EP-A 0 885 591 , EP-B 0 535 480 and EP-B 0 477 322 are known.
- the test element contains a detection area. This detection area preferably contains all of the reagents and, if appropriate, auxiliaries necessary for the detection reaction of the target analyte in the sample.
- the detection element can also contain only parts or none of the reagents or auxiliaries.
- reagents and auxiliaries such as are used, for. B.
- EP-A 0 885 591 , EP-B 0 535 480 and EP-B 0 477 322 are described.
- enzymes, enzyme substrates, indicators, buffer salts, inert fillers and the like can be contained in the detection element.
- the detection element can be built up from one or more layers and optionally contain an inert carrier, preferably on the side of the test element which is not brought into contact with the sample.
- the detection reaction leads to an observable change in color (which can also lie outside the visible range), which in this context is either a change in a color, the emergence of a color or the disappearance of color, must be ensured that the carrier allows a visual or optical observation of the detection reaction by suitable measures.
- the carrier material of the detection element itself can be transparent, for example a transparent plastic film, such as for example polycarbonate film, or it can have a transparent recess on the detection side.
- Test elements such as those in the patent application can be used in the preferred reflection measurement WO 99/29429 are described. These contain a pigment layer (preferably TiO 2 ) in the detection layer.
- the dye formed particularly preferably absorbs light at a wavelength of 660 nm.
- test element can be used which is used to analyze very small sample volumes.
- This test element can be present in a system, the sample application taking place through the system.
- the sample is preferably transported through the system to the test element and the application is transferred from a sample collection point to the test element. With this transfer, the sample drop on the test element assumes a certain shape as long as a sufficient amount of sample is reached. With the help of the histogram evaluation, this sample drop can be evaluated regardless of its shape.
- the detection area can be illuminated by one or more light sources.
- the detection area can be illuminated homogeneously or only in partial areas. If only one light source is used, homogeneous illumination of the detection area can be improved by using a frosted glass or other scattering units.
- An alternative to illuminating the detection area with at least one light source is to use the ambient light (sunlight or artificial lighting) to illuminate the detection area. Since the ambient light is multispectral, a filter can be used between the test element and the detector to detect only a certain wavelength range.
- the system for sequential lighting of the test element can be provided with different lighting units.
- a simple laser diode combined with a reflector that can be adjusted by micromechanics can serve as the light source.
- the light beam can scan the test element without gaps.
- a laser array can be used, preferably a VCSEL array (Vertical Cavity Surface Emitting Laser). Each laser in the array can be addressed individually.
- the VCSELs offer the advantage that the light is emitted with little beam divergence. These laser structures have a beam divergence of about 5-8 °. In this way, not only a small area needs to be irradiated, the amount of light on this area is also very high.
- a laser diode array Another possibility is a laser diode array.
- the light can be coupled into an image guide which guides the excitation light to the test element or the light is focused on the different areas of the test element by means of a microlens array which is arranged between the LED array and the test element.
- An OLED chessboard Organic Light Emmitting Diodes
- an illumination LED and a detector can be arranged directly adjacent. By arranging several such lighting / detector units, a large area can be illuminated over a large area or sequentially and the reflection can be detected. Since both the illumination and the detection are arranged at a similar angle to the test element, this arrangement is preferably suitable for fluorescence measurement, since the excitation light and the light emitted by the detection area can be easily separated from one another by means of filters.
- the lighting unit can consist of a monochrome or multispectral, coherent or incoherent radiation source.
- the radiation from the lighting unit is used to penetrate the detection area, also referred to as the sample location, in order to measure the analyte directly or the color reaction of a reagent with the analyte.
- the lighting unit preferably consists of one or more LEDs whose light at the sample location either ensures a specially selected spatial intensity distribution or homogeneous illumination.
- the lighting can be designed to be focused. The focus is then shifted towards the depth dimension.
- the excitation can take place via a multispectral LED array.
- Coherent excitation with laser diodes for example in the blue / ultraviolet spectral range, in particular in fluorimetry, is also conceivable.
- light with a wavelength of approximately 660 nm is used. This can be implemented through the choice of the light source or through the installation of imaging units such as filters that are only translucent for a defined wavelength range.
- An imaging unit can be installed between the lighting unit and the detection area.
- This imaging unit consists of imaging optical elements such as lenses, mirrors, diaphragms, prisms, light-guiding or holographic elements. This ensures that the detection area is illuminated.
- Another imaging unit is used to project the irradiated specimen onto the detection unit.
- This imaging unit also consists of imaging optical elements such as lenses, mirrors, prisms, diaphragms, light-guiding or holographic elements.
- a micro-optical lens array can be used in which each individual element has delimited spatial areas of the test element Depicts individual elements of the detection unit. When using a multispectral light source, it makes sense to attach a filter in front of the detector or in front of the test element.
- Detection units for use as described herein, can consist of a flat or line-shaped element, which enables the spatially as well as the time-resolved measurement of the scattered radiation that is imaged by the detection area.
- This element is preferably a two-dimensional CMOS array, a CCD array or a cell-shaped diode array in which the spatially resolved image of the detection area is carried out by means of a scanning process.
- a simple photodiode without spatial resolution can often be sufficient. This can be used, for example, in combination with spatially resolved irradiation of the detection area.
- the detection unit converts the amount of light incident on an optically sensitive surface of the detector into an electrical signal. This electrical signal can be forwarded directly to the evaluation unit and further processed there.
- the optically sensitive area is subdivided into sub-areas, which are also referred to as pixels.
- a CMOS detector is used, which can have more than 1 million pixels.
- a preferred range is between 100 and 100,000 pixels and a particularly preferred range is between 1000 and 10,000 pixels.
- These pixels are preferably arranged in a square or rectangular shape and form a two-dimensional array.
- the array consists of at least one row and at least one column. The number of lines and the number of columns can differ from one another. Depending on the geometry of the object to be detected, the array can also assume a round or oval shape.
- a preferred arrangement of the pixels is an array of 256 by 256 pixels.
- an ND converter can be attached to each pixel.
- each row or each column of the array is connected to an ND converter.
- the signals can be read out in columns or lines.
- the CMOS detector can be integrated on a chip together with the at least one ND converter. This chip can be a silicon chip known from the prior art, as in " CMOS image sensors "by D. Scheffler and J. Seijnaeve in Laser + Photonik; May 2005; pp. 32-35 described.
- the signals received by the detection unit are forwarded to an evaluation unit.
- This evaluation unit can be integrated in the detection unit or can be present separately from it.
- the evaluation unit can in turn be connected to a display unit or the display unit can be integrated into the evaluation unit.
- the electrical signals from each pixel of the detection unit are counted in the evaluation unit. If the signals have not already been converted into digital values in the detection unit, this can be done in the evaluation unit.
- the signals can also be amplified. The level of the individual signal corresponds to an intensity of the light that was recorded by individual pixels.
- the maximum signal that can be received by the detector is set equal to a gray value of 255. If the detector does not receive any light, the signal corresponds to gray value 0. All intensities that lie between the maximum gray value 255 and the minimum gray value ⁇ are divided into 254 gray levels.
- a histogram evaluation is described here which can determine the concentration of an analyte on the basis of frequencies of light intensities, converted into gray values, of the light emitted by the partial areas.
- the detection area of the test element can first be measured without a sample. A frequency distribution is used determined from gray values. If the unwetted test element has few or no imperfections, there is a narrow distribution of frequencies around a most common gray value in the histogram.
- the detection area When the sample is applied to the detection area, at least part of the detection area is wetted with sample liquid. In this at least one sub-area, a reaction between the analyte in the sample and the reagent on the detection area can take place. This can result in a change in an optical property (such as a change in color) of the reagent.
- the wetted partial area is darkened. This darkening is due to the release of a dye when the analyte reacts with the detection reagent. The released dye absorbs the light radiated onto the detection area, as a result of which less light is reflected at the detection area and thus detected. This darkening leads to a change in the gray values of these sub-areas.
- the concentration of the analyte can be determined on the basis of the change in the frequency distributions before and after wetting at least part of the detection area.
- the gray value shift is referenced.
- the at least one gray value for calculating the analyte concentration can be freely selected.
- One gray value is sufficient to determine the concentration of the analyte, but several can also be selected.
- the relationship of the selected gray value (s) to the analyte concentration to be analyzed should be known. This relationship is known as referencing.
- the referencing can take place either on a gray value shift of the at least one selected gray value in relation to an unwetted partial area or in relation to a reference area.
- the gray value shift that is to say the difference between the selected gray value of the sample to be analyzed and the gray value of the unwetted partial area or the reference area.
- This gray value shift or difference is compared with gray value shifts for different, known glucose concentrations. From this comparison, conclusions can be drawn immediately about the glucose concentration in the sample. To have a reproducible relationship between the selected To ensure gray value of the sample to be determined and the gray value of the referencing system, care should be taken that this selected gray value is representative of the glucose concentration.
- An example of a representative gray value, the wetted subareas, is the gray value with a maximum frequency.
- this gray value shift from the measured values is to determine the distance between the maximum values of the frequencies before and after wetting.
- one of the at least one gray values can be used which have a certain percentage, for example 50, 60, 70 or 80% of the frequency of the maximum frequency.
- the mean values from several gray values with a certain frequency can also be used.
- the evaluation of the detection area can take place after the reaction has taken place completely.
- an end point of the reaction should be determined. This can be done by observing the rates of change in frequencies during the reaction process. It can be specified that the reaction is completed when a speed threshold value for the rate of change is undershot. At this point in time, it can be assumed that the reaction has proceeded by more than, for example, 95%.
- frequency distribution to determine the concentration of the analyte is to determine the gray value at which the gradient of the intensity curve between the lowest intensity and the most frequent intensity is greatest. Frequencies that reach a certain percentage (e.g. 50%) of the maximum gradient can also be used here.
- the concentration of the analyte can be determined on the basis of gray values that exceed a frequency threshold value.
- the selection of gray values with a sufficient frequency avoids evaluating areas which have insufficient homogeneity of the sample and / or reagent.
- An example of an area with inhomogeneous sample distribution is the edge area of the wetted areas of the detection area.
- the frequency threshold value can be selected so that the edge area is not included in the analysis.
- only gray values should be used that are representative of the wetted area.
- this frequency threshold value is also in the non-wetted area can be exceeded, a gray level threshold value must be used for the gray level to delimit the gray values of the wetted detection area.
- a gray level threshold value For the determination of the analyte, it is preferred to use only frequencies of gray values which are below the gray level threshold value. Furthermore, the frequencies of the wetted area can be above the frequency threshold value an average frequency can be determined, which is used to evaluate the concentration.
- Another possibility is the evaluation on the basis of the speed of the change in the frequencies of the emitted light intensities after wetting the detection area.
- a temporal observation of the change in the frequency distribution after wetting of the detection area is necessary.
- the intensity of the partial areas is determined at predetermined time intervals before and / or after the detection area is wetted and the frequency distribution of the gray value can be calculated from the intensities.
- the change in the frequency distribution of the gray values takes place faster the more analyte is in the sample.
- This different speed of dye formation depending on the analyte concentration can be used to determine the concentration on the basis of the speed at which the detection area is darkened. The speed of the darkening is reflected in the speed of the frequency shift.
- Another possibility for determining the concentration of the analyte can take place on the basis of at least some of the frequencies which have a lower intensity than the maximum value of the second maximum, caused by the wetted subregions.
- This at least one gray value selected to determine the concentration can be compared with a corresponding reference system and conclusions can be drawn about the concentration of the analyte therefrom.
- the frequency distribution can also be used to determine whether the detection area has been sufficiently wetted. For this purpose, it is determined whether a sufficient number of pixels has experienced a gray value shift. If a certain number of all shifted intensities is exceeded, sufficient wetting of the detection area can be determined.
- the end point of the reaction can be determined by determining the change in the frequency distribution over time after the sample has been applied. If the frequency distribution changes over a certain period of time only within a certain range, it can be assumed that the reaction is complete. This time interval can be in the range of minutes, but in a preferred embodiment is within 1-10 seconds. The interval in which the frequency distribution may still change is a few percent and should not exceed 5%.
- An alternative way of determining the analyte concentration is to track the frequency distribution of intensities or gray values over time after wetting the detection area.
- multivariate evaluation methods can be used, as they are known in the prior art. For example, it is possible to evaluate the histograms at different points in time of the reaction taking place with the aid of the “Partial Least Square” (PLS) method or the “Principle component regression” (PCR) method, as described in FIG Publication by H. Martens and T. Naes, "multivariate calibration", ISBN 0471909793 are described. Other statistical methods can also be used for this purpose.
- PLS Partial Least Square
- PCR Principal component regression
- the frequency distribution of intensities can still be used for quality control.
- edge effects in the form of an edge area can play a decisive role and affect the measurement result.
- the histogram shows the edge area between the intensity accumulations around the frequency maximum of the unwetted and wetted part of the detection area. Since the edge area is characterized by an inhomogeneous distribution of the sample on the detection area, it can include a range of gray values of different widths depending on the analyte concentration in the sample.
- test elements which have a detection area which contains several layers.
- One of the layers is designed to prevent large components of the sample, such as red blood cells in a blood sample, from further penetration.
- the light is reflected differently from this layer in the edge area than from the opposite side of the detection area.
- the detection area is measured from the side opposite the blood application. In contrast, with the transmission measurement detected on the blood application side.
- test element In order to carry out an optimal evaluation of a detection area of a test element, a quality control is carried out according to the invention before the test element is used.
- the test element is measured spatially resolved before wetting with the aid of the detection unit.
- a quality criterion according to the invention is the number of intensities within a predetermined intensity interval.
- the frequency component of the intensities that lie within the specified interval must exceed an interval threshold value so that the test element can be released for use. For example, if less than 90% of the measured intensities are found in this interval, then the test element can be excluded from use, since it is to be feared that the measurement results will be disturbed by irregularities in the detection area.
- the width of the intensity interval depends on the properties of the detection area.
- the unsuitability of the test element can be indicated to the patient by the system by means of a warning signal, such as an acoustic or optical signal.
- a second possibility of checking the quality of the detection area is to alternatively or additionally compare the intensity - or the gray value - that belongs to the average or maximum frequency with a quality threshold value. If the gray value, which corresponds to the mean or maximum frequency, is below the quality threshold value, it can be assumed that the test element in the detection area is soiled and should therefore not be used for use.
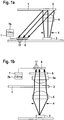
- FIG. 1 a a system is shown which contains a test element (1) with a detection area (2) which is irradiated by a light source (3).
- Imaging units such as lenses and / or diaphragms, can be attached between the light source (3) and the test element (1).
- both a diaphragm (4) and a lens (5) are arranged between the light source and the detection area (2) of the test element (1) in order to illuminate the detection area (2) as homogeneously as possible.
- the light emitted from the detection area (2) is captured by a detector (6).
- This detector (6) should contain at least 10 pixels (17) in order to be able to detect the detection area (2) in a spatially resolved manner.
- the signals from the detector (6) are evaluated in an evaluation unit (7) which is connected to the detector (6).
- a preferred detector is a CMOS detector which includes at least one ND converter to convert the analog electrical signals into digital signals. These digital signals can be forwarded to the evaluation unit (7) in order to be subjected to the various evaluations there.
- the calculated measured values can be displayed on a display unit (7b) that is connected to or integrated into the evaluation unit.
- a detector (6) which has a converter in a range from 8 to 12 bits. The measuring range is determined with the help of the detector (6) divided into 256 gray values between its zero value and its maximum value.
- the evaluation unit (7) is designed to count the frequencies of the 256 gray values. These frequencies can be plotted in a histogram (10) against the intensity intervals, which are also referred to as gray values (11). Each intensity interval is assigned to a gray value.
- FIG. 1b a system for transmission measurement is presented.
- the test element (1) with its detection area (2) is located here between the light source (3) and the detector (6).
- imaging units can be used both between the test element (1) and the light source (3) and between the test element (1) and the detector (6).
- the detector (6) is also capable of spatially resolved measurement, which is why it has a large number of pixels (17).
- the detector (6) is in turn connected to an evaluation unit (7).
- a display unit (7b) is in turn connected to or integrated into the evaluation unit (7).
- This transmission arrangement can preferably be used for fluorine essence measurements.
- a filter (8) which blocks the excitation light is provided between the test element (1) and the detector (6).
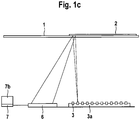
- Figure 1c represents a system for spatially resolved illumination of the detection area (2).
- a light source (3) is used which illuminates only a partial area of the detection area (2). If only one light source (3) is used, the light is focused on different partial areas of the detection area (2) via a reflector (not shown here).
- various light sources (3) which, as shown here, are arranged in an array (3a), are directed onto the detection area (2). In this way, at least a partial area of the detection area (2) can be illuminated sequentially or at the same time. If the detection area (2) is illuminated sequentially, which is also referred to as scanning, a single photodiode can be used as a detector (6).
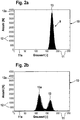
- FIG 2a the gray value distribution (9) of an unwetted test element (1) is shown.
- the representation takes place in the form of a histogram (10), the gray values (11) (256 in the example shown) being plotted on the X axis (11a), while the number of detected gray values (12) is plotted on the Y axis ( 12a) is reproduced.
- the gray values (11) are between 0 and 200, the most frequent gray value of the unwetted detection area being 173. This is from the maximum (13) of the gray value histogram (10) in Figure 2a evident.
- Figure 2b shows a darkening of the detection area (2) after application of a test drop. Since the detection area (2) was only partially wetted, in this case slightly more than half of the partial areas, the histogram (10) has two maxima (13) and (13a) of gray values (11). Because of this darkening, the intensity of the light that is emitted by the wetted sub-areas decreases and the pixels of the detector that measure these sub-areas detect a lower signal. This leads to lower gray values in the histogram (10). The smaller part of the pixels, which corresponds to the unwetted area, still has a gray value (11) of approx. 173, while a larger part of the pixels now has a mean gray value (11) of 115.
- the difference between the mean gray value (11) of the unwetted area of the detection area (2) and the gray value (11) of the darker area after wetting depends on the discoloration of the detection area (2) and thus on the glucose concentration. In this way, conclusions can be drawn directly about the glucose concentration from the change in the gray values (11).
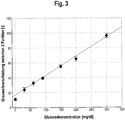
- a typical reference curve (15) is shown, as is required for calculating the concentration of the analyte (in this example glucose) in a sample by means of the histogram analysis described.
- liquid samples with a known concentration are examined using one of the methods described above. For example, a shift in the frequency of the gray values (called ⁇ GW) (16) assigned to the maxima (13) and (13a) of a glucose concentration.
- ⁇ GW shift in the frequency of the gray values
- This can be used to illustrate how the shift in the frequencies of the gray values (16) can be converted into a concentration. A large shift in frequencies (16) corresponds to a high analyte concentration and vice versa.
- the ⁇ GW value is determined in the evaluation unit (7) with the aid of the intensities of the wetted detection area (2) measured by the detector (6). This is carried out using the same procedure as for determining the reference curve (15). Since the reference curve (15) is stored in the evaluation unit (7), the analyte concentration can be read off there immediately.
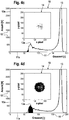
- FIGs 4a to 4e the relationship between the gray value distribution in the histogram (10) and the associated wetted areas is shown.
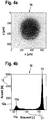
- Figure 4a shows a black-and-white representation of a drop (14) which has been applied to the detection area (2).
- the detection area has an extension of approx. 650 * 650 ⁇ m.
- Figure 4b the associated histogram (10) is shown, which shows the gray values (11) of the entire detection area (2). It can be seen here that the largest part of the detection area (2) is still unwetted, which is why the larger maximum (13) of gray values (11) is still around 173. Another maximum (13a) is at a gray value (11) of approx. 65.
- gray values (11) which are around this maximum (13a), that is to say are above the frequency threshold value in this gray value range can be seen in the drop illustration (14) in FIG Figure 4d that these pixels belong to the inner area of the drop. These pixels are distributed very homogeneously over the core of the drop. Adjacent to this homogeneous area in the histogram (10), there are few pixels that have a very low gray value, as in Figure 4a shown in the drop representation (14). These points are also in the center of the sample drop.
- the edge area of the drop is shown. The gray values (11) of this edge area lie between the gray values (11) of the unwetted and the homogeneously wetted area.
- Figure 4f the pixels of the unwetted part of the detection area (2) are shown. Since only part of the detection area (2) is wetted in this example, the frequency of the gray values (11) around the maximum value is very high.
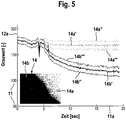
- FIG. 5 shows a time course of the gray value distribution during the wetting process.
- the time is plotted on the X-axis (11a) against the gray values (11) on the Y-axis (12a).
- the detection area (2) is not wetted and has a gray value (11) of approximately 173.
- the gray value (11) briefly decreases due to the darkening of the detector (6) and then continues from gray value (11) at approx. 173 in two different directions.
- the unwetted part (14a) of the section of a partially wetted detection area (2) shown in the image (14) remains at the gray value (11) of 173.
- the most frequently measured gray values of the unwetted part are shown in the curve (14a '). All gray values (11) of the unwetted area (14a) lie between the curves (14a ") and (14a '"'). A similar distribution of the gray values (11) is around the maximum frequency of the gray values (11) of the wetted area (14b). The largest part of the wetted sub-areas of the detection area (2) lies on the curve (14b). Also in the wetted sub-area (14b) there are pixels that have a lower gray value (11) or a higher gray value (11) than the pixels of the curve (14b '). This gray value range is limited by the curves (14b ") towards small gray values and by the curve (14b"') towards larger gray values.
- This curve shows that the reaction in the detection area is complete at the point in time of approx. 15 seconds.
- the course of the curve (14b ') can be used to determine the analyte if the curve courses are known for different concentrations of the analyte.
- the speed of the frequency change can be used to determine the completion of the reaction.
- a speed threshold value for falling below the speed of the frequency change can be defined. If the speed falls below the threshold value, this point in time can be used to start the analysis of the analyte, if necessary.
Landscapes
- Engineering & Computer Science (AREA)
- Physics & Mathematics (AREA)
- Health & Medical Sciences (AREA)
- General Physics & Mathematics (AREA)
- General Health & Medical Sciences (AREA)
- Life Sciences & Earth Sciences (AREA)
- Theoretical Computer Science (AREA)
- Computer Vision & Pattern Recognition (AREA)
- Radiology & Medical Imaging (AREA)
- Biochemistry (AREA)
- Nuclear Medicine, Radiotherapy & Molecular Imaging (AREA)
- Medical Informatics (AREA)
- Molecular Biology (AREA)
- Chemical & Material Sciences (AREA)
- Analytical Chemistry (AREA)
- Quality & Reliability (AREA)
- Immunology (AREA)
- Pathology (AREA)
- Probability & Statistics with Applications (AREA)
- Investigating Or Analysing Materials By The Use Of Chemical Reactions (AREA)
- Investigating Or Analysing Biological Materials (AREA)
- Investigating Or Analysing Materials By Optical Means (AREA)
- Investigating, Analyzing Materials By Fluorescence Or Luminescence (AREA)
Priority Applications (3)
| Application Number | Priority Date | Filing Date | Title |
|---|---|---|---|
| ES10008491T ES2883201T3 (es) | 2006-04-08 | 2006-04-08 | Análisis de datos ópticos con la ayuda de histogramas |
| PL10008491T PL2244086T3 (pl) | 2006-04-08 | 2006-04-08 | Analiza danych optycznych za pomocą histogramów |
| EP10008491.2A EP2244086B1 (de) | 2006-04-08 | 2006-04-08 | Analyse optischer Daten mit Hilfe von Histogrammen |
Applications Claiming Priority (2)
| Application Number | Priority Date | Filing Date | Title |
|---|---|---|---|
| EP10008491.2A EP2244086B1 (de) | 2006-04-08 | 2006-04-08 | Analyse optischer Daten mit Hilfe von Histogrammen |
| EP06007461.4A EP1843148B1 (de) | 2006-04-08 | 2006-04-08 | Analyse optischer daten mit hilfe von histogrammen |
Related Parent Applications (3)
| Application Number | Title | Priority Date | Filing Date |
|---|---|---|---|
| EP06007461.4A Division EP1843148B1 (de) | 2006-04-08 | 2006-04-08 | Analyse optischer daten mit hilfe von histogrammen |
| EP06007461.4A Division-Into EP1843148B1 (de) | 2006-04-08 | 2006-04-08 | Analyse optischer daten mit hilfe von histogrammen |
| EP06007461.4 Division | 2006-04-08 |
Publications (3)
| Publication Number | Publication Date |
|---|---|
| EP2244086A2 EP2244086A2 (de) | 2010-10-27 |
| EP2244086A3 EP2244086A3 (de) | 2011-12-07 |
| EP2244086B1 true EP2244086B1 (de) | 2021-06-09 |
Family
ID=36928299
Family Applications (2)
| Application Number | Title | Priority Date | Filing Date |
|---|---|---|---|
| EP10008491.2A Expired - Lifetime EP2244086B1 (de) | 2006-04-08 | 2006-04-08 | Analyse optischer Daten mit Hilfe von Histogrammen |
| EP06007461.4A Expired - Lifetime EP1843148B1 (de) | 2006-04-08 | 2006-04-08 | Analyse optischer daten mit hilfe von histogrammen |
Family Applications After (1)
| Application Number | Title | Priority Date | Filing Date |
|---|---|---|---|
| EP06007461.4A Expired - Lifetime EP1843148B1 (de) | 2006-04-08 | 2006-04-08 | Analyse optischer daten mit hilfe von histogrammen |
Country Status (8)
| Country | Link |
|---|---|
| US (1) | US7889329B2 (pl) |
| EP (2) | EP2244086B1 (pl) |
| JP (1) | JP5159760B2 (pl) |
| CN (1) | CN101421608B (pl) |
| CA (2) | CA2771025C (pl) |
| ES (2) | ES2883201T3 (pl) |
| PL (2) | PL2244086T3 (pl) |
| WO (1) | WO2007115732A1 (pl) |
Families Citing this family (20)
| Publication number | Priority date | Publication date | Assignee | Title |
|---|---|---|---|---|
| US8401290B2 (en) * | 2008-07-24 | 2013-03-19 | Libredigital, Inc. | Method and system for processing to enhance digital images |
| PL2310980T3 (pl) | 2008-08-04 | 2013-08-30 | Hoffmann La Roche | Sposób kodowania do kodowania artykułów medycznych |
| EP2151686A1 (de) | 2008-08-04 | 2010-02-10 | Roche Diagnostics GmbH | Analysesystem mit Codierungserkennung |
| TWI384427B (zh) * | 2009-04-29 | 2013-02-01 | Utechzone Co Ltd | Background establishment method and device |
| EP2306178A1 (de) * | 2009-09-30 | 2011-04-06 | Roche Diagnostics GmbH | Verfahren zum Steuern einer photometrischen Messeinheit eines Messgeräts zur Gewinnung und Untersuchung einer Körperflüssigkeitsprobe sowie Messsystem |
| US20110245637A1 (en) * | 2010-03-31 | 2011-10-06 | Nellcor Puritan Bennett Llc | Ambient light use in physiological sensors |
| EP2596339B1 (de) | 2010-07-20 | 2017-08-23 | F. Hoffmann-La Roche AG | Vorrichtung zum nachweis eines analyten in einer körperflüssigkeit |
| US8409866B2 (en) * | 2010-10-21 | 2013-04-02 | Nokia Corporation | Apparatus and associated methods |
| GB201120862D0 (en) * | 2011-12-05 | 2012-01-18 | Airbus Operations Ltd | A wingtip fin of an aircraft |
| US20130171028A1 (en) * | 2011-12-28 | 2013-07-04 | Bayer Healthcare Llc | Analyte monitor |
| EP2864765B1 (en) | 2012-06-22 | 2021-04-28 | Roche Diabetes Care GmbH | Method and device for detecting an analyte in a body fluid |
| CN104641235B (zh) * | 2012-07-24 | 2017-10-03 | Fio公司 | 免疫检测快速诊断测试通用分析装置、系统、方法及计算机可读介质 |
| EP2994536B1 (en) | 2013-05-08 | 2017-06-14 | Roche Diabetes Care GmbH | Stabilization of enzymes by nicotinic acid |
| CN108463708B (zh) | 2015-11-06 | 2021-10-08 | 密歇根大学董事会 | 基于微滴的微流体流变仪系统 |
| CN205941340U (zh) * | 2016-01-25 | 2017-02-08 | 苑高强 | 一种物质鉴别仪及物联网 |
| CN107037206B (zh) * | 2017-03-31 | 2019-03-05 | 深圳市在田翊方科技有限公司 | 一种时间分辨荧光免疫层析法 |
| PL3477270T3 (pl) * | 2017-10-25 | 2021-12-13 | F. Hoffmann-La Roche Ag | Sposoby i urządzenia do wykonywania pomiaru analitycznego w oparciu o reakcję tworzenia barwy |
| EP3527972B8 (en) | 2018-02-19 | 2025-07-09 | Roche Diabetes Care GmbH | Method and devices for performing an analytical measurement |
| US11668652B2 (en) * | 2019-01-14 | 2023-06-06 | Uvic Industry Partnerships Inc. | Optical fiber-based sensor for determining the concentration of fluoride in water |
| CN115115852B (zh) * | 2022-06-02 | 2025-07-18 | 中海石油(中国)有限公司天津分公司 | 一种基于壁心荧光图像灰度值的地面原油粘度预测方法 |
Family Cites Families (40)
| Publication number | Priority date | Publication date | Assignee | Title |
|---|---|---|---|---|
| US4097845A (en) * | 1976-11-01 | 1978-06-27 | Rush-Presbyterian-St. Luke's Medical Center | Method of and an apparatus for automatic classification of red blood cells |
| US4453266A (en) * | 1980-04-21 | 1984-06-05 | Rush-Presbyterian-St. Luke's Medical Center | Method and apparatus for measuring mean cell volume of red blood cells |
| JPS60100032A (ja) * | 1983-11-04 | 1985-06-03 | Nireko:Kk | 焼結鉱等の顕微鏡画像における自動定量測定方法 |
| US4873633A (en) * | 1985-10-18 | 1989-10-10 | Cetus Corporation | User controlled off-center light absorbance reading adjuster in a liquid handling and reaction system |
| JPS62134559A (ja) * | 1985-12-07 | 1987-06-17 | Japan Spectroscopic Co | 血液細胞自動分析方法および装置 |
| AU597485B2 (en) * | 1987-04-22 | 1990-05-31 | John Lysaght (Australia) Limited | Non-contact determination of the position of a rectilinear feature of an article |
| US5030554A (en) * | 1987-12-04 | 1991-07-09 | Coulter Corporation | Conservative whole blood sample preparation technique |
| DE4012216A1 (de) | 1990-04-14 | 1991-10-17 | Boehringer Mannheim Gmbh | Testtraeger fuer die analyse von fluessigkeiten |
| DE69233262T2 (de) * | 1991-02-27 | 2004-09-30 | Roche Diagnostics Corp., Indianapolis | Vorrichtung und Verfahren zur Analyse von Körperflüssigkeiten |
| DE4132743A1 (de) | 1991-10-02 | 1993-04-08 | Boehringer Mannheim Gmbh | Testtraeger fuer die analyse von fluessigkeiten |
| JP2575270B2 (ja) * | 1992-11-10 | 1997-01-22 | 浜松ホトニクス株式会社 | 核酸の塩基配列決定方法、単一分子検出方法、その装置及び試料の作成方法 |
| US5396260A (en) * | 1992-12-22 | 1995-03-07 | The Center For Innovative Technology | Video instrumentation for the analysis of mineral content in ores and coal |
| TW239881B (pl) * | 1992-12-22 | 1995-02-01 | Sienna Biotech Inc | |
| ES2150985T3 (es) | 1993-02-26 | 2000-12-16 | E Y Lab Inc | Procedimiento y sistema de analisis optico de muestras. |
| US5408535A (en) * | 1993-09-07 | 1995-04-18 | Miles Inc. | Video test strip reader and method for evaluating test strips |
| FR2713779B1 (fr) * | 1993-12-10 | 1996-03-08 | Lorraine Laminage | Procédé automatique d'analyse macérale et de détermination du pouvoir réflecteur de la vitrinite dans les charbons. |
| JP3562847B2 (ja) * | 1994-11-15 | 2004-09-08 | 謙 石原 | ヘモグロビン濃度測定装置 |
| JP2707426B2 (ja) * | 1995-03-31 | 1998-01-28 | 名古屋電機工業株式会社 | 路面状態検出装置 |
| US5691204A (en) * | 1995-04-21 | 1997-11-25 | Abbott Laboratories | Compositions and methods for the rapid analysis of reticulocytes |
| JPH08299310A (ja) * | 1995-05-02 | 1996-11-19 | Toa Medical Electronics Co Ltd | 非侵襲血液分析装置およびその方法 |
| DE19611347A1 (de) | 1996-03-22 | 1997-09-25 | Boehringer Mannheim Gmbh | System zur quantitativen ortsaufgelösten Auswertung von Testelementen |
| FI111217B (fi) | 1997-06-19 | 2003-06-30 | Nokia Corp | Laite näytteiden ottamiseksi |
| DE19753847A1 (de) | 1997-12-04 | 1999-06-10 | Roche Diagnostics Gmbh | Analytisches Testelement mit Kapillarkanal |
| US20030153023A1 (en) | 1999-05-13 | 2003-08-14 | Starzl Timothy W. | Enumeration method of analyte detection |
| CA2640578A1 (en) * | 1998-05-14 | 1999-11-18 | Luminex Corporation | Multi-analyte diagnostic system and computer implemented process for same |
| WO2000078998A1 (en) * | 1999-06-18 | 2000-12-28 | Polymer Technology Systems, Inc. | Apparatus and method for determining substances contained in a body fluid |
| CA2406133A1 (en) * | 2000-04-17 | 2001-10-25 | Rashid Bashir | Biosensor and related method |
| US7756305B2 (en) * | 2002-01-23 | 2010-07-13 | The Regents Of The University Of California | Fast 3D cytometry for information in tissue engineering |
| JP2003287532A (ja) * | 2002-03-28 | 2003-10-10 | Fuji Photo Film Co Ltd | 血液検査ユニット |
| US6847451B2 (en) | 2002-05-01 | 2005-01-25 | Lifescan, Inc. | Apparatuses and methods for analyte concentration determination |
| JP2004144672A (ja) * | 2002-10-25 | 2004-05-20 | Advance Co Ltd | 発色情報に基づく成分分析方法及び成分分析装置 |
| US8574895B2 (en) * | 2002-12-30 | 2013-11-05 | Sanofi-Aventis Deutschland Gmbh | Method and apparatus using optical techniques to measure analyte levels |
| US7522762B2 (en) * | 2003-04-16 | 2009-04-21 | Inverness Medical-Biostar, Inc. | Detection, resolution, and identification of arrayed elements |
| JP2004325358A (ja) * | 2003-04-25 | 2004-11-18 | Nakayama:Kk | 鋳鉄成分比率測定装置及びその測定方法 |
| WO2004102481A1 (ja) * | 2003-05-15 | 2004-11-25 | Fujitsu Limited | 生体情報検出装置 |
| US7239394B2 (en) * | 2003-06-04 | 2007-07-03 | Inverness Medical Switzerland Gmbh | Early determination of assay results |
| US7265351B2 (en) * | 2003-12-02 | 2007-09-04 | Mpb Communications Inc. | Method and apparatus for non-contact and rapid determination of liquid content |
| CA2562241A1 (en) * | 2004-04-16 | 2005-12-08 | University Of Massachusetts | Detection and quantification of intracellular pathogens |
| US7887750B2 (en) * | 2004-05-05 | 2011-02-15 | Bayer Healthcare Llc | Analytical systems, devices, and cartridges therefor |
| EP1843147A1 (de) * | 2006-04-08 | 2007-10-10 | Roche Diagnostics GmbH | Ortsaufgelöste Analyse optischer Daten eines Testelementes |
-
2006
- 2006-04-08 PL PL10008491T patent/PL2244086T3/pl unknown
- 2006-04-08 PL PL06007461.4T patent/PL1843148T3/pl unknown
- 2006-04-08 ES ES10008491T patent/ES2883201T3/es not_active Expired - Lifetime
- 2006-04-08 ES ES06007461T patent/ES2929039T3/es not_active Expired - Lifetime
- 2006-04-08 EP EP10008491.2A patent/EP2244086B1/de not_active Expired - Lifetime
- 2006-04-08 EP EP06007461.4A patent/EP1843148B1/de not_active Expired - Lifetime
-
2007
- 2007-04-03 JP JP2009503474A patent/JP5159760B2/ja active Active
- 2007-04-03 CA CA2771025A patent/CA2771025C/en active Active
- 2007-04-03 CA CA2648147A patent/CA2648147C/en active Active
- 2007-04-03 WO PCT/EP2007/002968 patent/WO2007115732A1/de not_active Ceased
- 2007-04-03 CN CN200780012727XA patent/CN101421608B/zh not_active Expired - Fee Related
-
2008
- 2008-10-08 US US12/247,393 patent/US7889329B2/en active Active
Non-Patent Citations (1)
| Title |
|---|
| D. SCHEFFLER; J. SEIJNAEVE: "CMOS-Büdsensoren", LASER + PHOTONIK, May 2005 (2005-05-01), pages 32 - 35 * |
Also Published As
| Publication number | Publication date |
|---|---|
| CA2648147A1 (en) | 2007-10-18 |
| CN101421608B (zh) | 2011-10-19 |
| WO2007115732A1 (de) | 2007-10-18 |
| CA2648147C (en) | 2012-06-12 |
| CN101421608A (zh) | 2009-04-29 |
| PL2244086T3 (pl) | 2021-11-22 |
| EP2244086A3 (de) | 2011-12-07 |
| CA2771025C (en) | 2016-02-16 |
| ES2929039T3 (es) | 2022-11-24 |
| EP1843148A1 (de) | 2007-10-10 |
| EP1843148B1 (de) | 2022-08-31 |
| US20090116015A1 (en) | 2009-05-07 |
| EP2244086A2 (de) | 2010-10-27 |
| PL1843148T3 (pl) | 2022-11-21 |
| HK1131431A1 (en) | 2010-01-22 |
| JP5159760B2 (ja) | 2013-03-13 |
| ES2883201T3 (es) | 2021-12-07 |
| JP2009533654A (ja) | 2009-09-17 |
| US7889329B2 (en) | 2011-02-15 |
| CA2771025A1 (en) | 2007-10-18 |
Similar Documents
| Publication | Publication Date | Title |
|---|---|---|
| WO2007115732A1 (de) | Analyse optischer daten mit hilfe von histogrammen | |
| EP1936362B1 (de) | Testelement mit Referenzierung | |
| EP1117989B1 (de) | Verfahren zur photometrischen auswertung von testelementen | |
| DE60035174T2 (de) | Invasives verfahren zur in vivo analytvermessung | |
| EP3260846B1 (de) | Vorrichtung zum nachweis eines analyten in einer körperflüssigkeit | |
| EP1241979B1 (de) | Verfahren und vorrichtung zur bestimmung der örtlichen verteilung einer messgrösse | |
| EP0876596B1 (de) | Verfahren und vorrichtung zur bestimmung eines analyten in einer streuenden matrix | |
| EP2316023B1 (de) | Analysesystem mit Codierungserkennung | |
| EP0819943A2 (de) | Analysesystem mit Mitteln zur Erkennung von Unterdosierungen | |
| DE10163775A1 (de) | Analysensystem zur Bestimmung einer Analytkonzentration unter Berücksichtigung von proben- und analytunabhängigen Lichtintensitätsänderungen | |
| WO2008014890A1 (de) | Verfahren der glukosekonzentration in pulsierendem blut | |
| DE102006025714B4 (de) | Vorrichtung und Verfahren zum Unterscheiden unter Lateralflussuntersuchungs-Testindikatoren | |
| DE19628562A1 (de) | Analysesystem mit Mitteln zur Erkennung von Unterdosierungen | |
| DE4314835A1 (de) | Verfahren und Vorrichtung zur Analyse von Glucose in einer biologischen Matrix | |
| EP1843147A1 (de) | Ortsaufgelöste Analyse optischer Daten eines Testelementes | |
| EP2502054B1 (de) | Verfahren und vorrichtung zur untersuchung einer körperflüssigkeit | |
| DE19519051B4 (de) | Verfahren und Vorrichtung zur polarimetrischen Bestimmung der Blutzuckerkonzentration | |
| DE19630160A1 (de) | Analysesystem mit Mitteln zur Erkennung von Unterdosierungen | |
| DE112021007066T5 (de) | Lateral-Flow-Testvorrichtung | |
| DE102007054309A1 (de) | Optische Anordnung zur Erhöhung der Wechselwirkungslänge in stark steuernder Matrix | |
| HK1131431B (en) | Analysis of optical data with the aid of histograms | |
| DE19704411A1 (de) | Verfahren und Vorrichtung zur Bestimmung eines Analyten in einer Probe | |
| EP1890133A2 (de) | Verfahren zum Untersuchen einer Probe einer Flüssigkeit |
Legal Events
| Date | Code | Title | Description |
|---|---|---|---|
| PUAI | Public reference made under article 153(3) epc to a published international application that has entered the european phase |
Free format text: ORIGINAL CODE: 0009012 |
|
| AC | Divisional application: reference to earlier application |
Ref document number: 1843148 Country of ref document: EP Kind code of ref document: P |
|
| AK | Designated contracting states |
Kind code of ref document: A2 Designated state(s): AT BE BG CH CY CZ DE DK EE ES FI FR GB GR HU IE IS IT LI LT LU LV MC NL PL PT RO SE SI SK TR |
|
| AX | Request for extension of the european patent |
Extension state: AL BA HR MK YU |
|
| PUAL | Search report despatched |
Free format text: ORIGINAL CODE: 0009013 |
|
| AK | Designated contracting states |
Kind code of ref document: A3 Designated state(s): AT BE BG CH CY CZ DE DK EE ES FI FR GB GR HU IE IS IT LI LT LU LV MC NL PL PT RO SE SI SK TR |
|
| AX | Request for extension of the european patent |
Extension state: AL BA HR MK YU |
|
| RIC1 | Information provided on ipc code assigned before grant |
Ipc: G06T 7/00 20060101ALI20111028BHEP Ipc: G01N 21/86 20060101AFI20111028BHEP |
|
| 17P | Request for examination filed |
Effective date: 20120608 |
|
| 17Q | First examination report despatched |
Effective date: 20140527 |
|
| RAP1 | Party data changed (applicant data changed or rights of an application transferred) |
Owner name: ROCHE DIABETES CARE GMBH Owner name: F.HOFFMANN-LA ROCHE AG |
|
| STAA | Information on the status of an ep patent application or granted ep patent |
Free format text: STATUS: EXAMINATION IS IN PROGRESS |
|
| REG | Reference to a national code |
Ref country code: DE Ref legal event code: R079 Ref document number: 502006016469 Country of ref document: DE Free format text: PREVIOUS MAIN CLASS: G01N0021860000 Ipc: G01N0021840000 |
|
| RIC1 | Information provided on ipc code assigned before grant |
Ipc: G01N 21/84 20060101AFI20201007BHEP Ipc: G06T 7/00 20170101ALI20201007BHEP Ipc: G06T 7/41 20170101ALI20201007BHEP |
|
| GRAP | Despatch of communication of intention to grant a patent |
Free format text: ORIGINAL CODE: EPIDOSNIGR1 |
|
| STAA | Information on the status of an ep patent application or granted ep patent |
Free format text: STATUS: GRANT OF PATENT IS INTENDED |
|
| INTG | Intention to grant announced |
Effective date: 20201118 |
|
| GRAJ | Information related to disapproval of communication of intention to grant by the applicant or resumption of examination proceedings by the epo deleted |
Free format text: ORIGINAL CODE: EPIDOSDIGR1 |
|
| STAA | Information on the status of an ep patent application or granted ep patent |
Free format text: STATUS: EXAMINATION IS IN PROGRESS |
|
| INTC | Intention to grant announced (deleted) | ||
| GRAP | Despatch of communication of intention to grant a patent |
Free format text: ORIGINAL CODE: EPIDOSNIGR1 |
|
| STAA | Information on the status of an ep patent application or granted ep patent |
Free format text: STATUS: GRANT OF PATENT IS INTENDED |
|
| GRAS | Grant fee paid |
Free format text: ORIGINAL CODE: EPIDOSNIGR3 |
|
| INTG | Intention to grant announced |
Effective date: 20210413 |
|
| RIN1 | Information on inventor provided before grant (corrected) |
Inventor name: KOCHERSCHEIDT, GERRIT Inventor name: ASFOUR, JEAN-MICHEL Inventor name: HAAR, HANS-PETER Inventor name: PETRICH, WOLFGANG |
|
| GRAA | (expected) grant |
Free format text: ORIGINAL CODE: 0009210 |
|
| STAA | Information on the status of an ep patent application or granted ep patent |
Free format text: STATUS: THE PATENT HAS BEEN GRANTED |
|
| AC | Divisional application: reference to earlier application |
Ref document number: 1843148 Country of ref document: EP Kind code of ref document: P |
|
| AK | Designated contracting states |
Kind code of ref document: B1 Designated state(s): AT BE BG CH CY CZ DE DK EE ES FI FR GB GR HU IE IS IT LI LT LU LV MC NL PL PT RO SE SI SK TR |
|
| REG | Reference to a national code |
Ref country code: GB Ref legal event code: FG4D Free format text: NOT ENGLISH |
|
| REG | Reference to a national code |
Ref country code: AT Ref legal event code: REF Ref document number: 1400922 Country of ref document: AT Kind code of ref document: T Effective date: 20210615 Ref country code: CH Ref legal event code: EP |
|
| REG | Reference to a national code |
Ref country code: DE Ref legal event code: R096 Ref document number: 502006016469 Country of ref document: DE |
|
| REG | Reference to a national code |
Ref country code: IE Ref legal event code: FG4D Free format text: LANGUAGE OF EP DOCUMENT: GERMAN |
|
| REG | Reference to a national code |
Ref country code: NL Ref legal event code: FP |
|
| REG | Reference to a national code |
Ref country code: LT Ref legal event code: MG9D |
|
| PG25 | Lapsed in a contracting state [announced via postgrant information from national office to epo] |
Ref country code: FI Free format text: LAPSE BECAUSE OF FAILURE TO SUBMIT A TRANSLATION OF THE DESCRIPTION OR TO PAY THE FEE WITHIN THE PRESCRIBED TIME-LIMIT Effective date: 20210609 Ref country code: LT Free format text: LAPSE BECAUSE OF FAILURE TO SUBMIT A TRANSLATION OF THE DESCRIPTION OR TO PAY THE FEE WITHIN THE PRESCRIBED TIME-LIMIT Effective date: 20210609 Ref country code: BG Free format text: LAPSE BECAUSE OF FAILURE TO SUBMIT A TRANSLATION OF THE DESCRIPTION OR TO PAY THE FEE WITHIN THE PRESCRIBED TIME-LIMIT Effective date: 20210909 |
|
| PG25 | Lapsed in a contracting state [announced via postgrant information from national office to epo] |
Ref country code: SE Free format text: LAPSE BECAUSE OF FAILURE TO SUBMIT A TRANSLATION OF THE DESCRIPTION OR TO PAY THE FEE WITHIN THE PRESCRIBED TIME-LIMIT Effective date: 20210609 Ref country code: GR Free format text: LAPSE BECAUSE OF FAILURE TO SUBMIT A TRANSLATION OF THE DESCRIPTION OR TO PAY THE FEE WITHIN THE PRESCRIBED TIME-LIMIT Effective date: 20210910 Ref country code: LV Free format text: LAPSE BECAUSE OF FAILURE TO SUBMIT A TRANSLATION OF THE DESCRIPTION OR TO PAY THE FEE WITHIN THE PRESCRIBED TIME-LIMIT Effective date: 20210609 |
|
| REG | Reference to a national code |
Ref country code: ES Ref legal event code: FG2A Ref document number: 2883201 Country of ref document: ES Kind code of ref document: T3 Effective date: 20211207 |
|
| PG25 | Lapsed in a contracting state [announced via postgrant information from national office to epo] |
Ref country code: RO Free format text: LAPSE BECAUSE OF FAILURE TO SUBMIT A TRANSLATION OF THE DESCRIPTION OR TO PAY THE FEE WITHIN THE PRESCRIBED TIME-LIMIT Effective date: 20210609 Ref country code: PT Free format text: LAPSE BECAUSE OF FAILURE TO SUBMIT A TRANSLATION OF THE DESCRIPTION OR TO PAY THE FEE WITHIN THE PRESCRIBED TIME-LIMIT Effective date: 20211011 Ref country code: SK Free format text: LAPSE BECAUSE OF FAILURE TO SUBMIT A TRANSLATION OF THE DESCRIPTION OR TO PAY THE FEE WITHIN THE PRESCRIBED TIME-LIMIT Effective date: 20210609 Ref country code: CZ Free format text: LAPSE BECAUSE OF FAILURE TO SUBMIT A TRANSLATION OF THE DESCRIPTION OR TO PAY THE FEE WITHIN THE PRESCRIBED TIME-LIMIT Effective date: 20210609 Ref country code: EE Free format text: LAPSE BECAUSE OF FAILURE TO SUBMIT A TRANSLATION OF THE DESCRIPTION OR TO PAY THE FEE WITHIN THE PRESCRIBED TIME-LIMIT Effective date: 20210609 |
|
| REG | Reference to a national code |
Ref country code: DE Ref legal event code: R097 Ref document number: 502006016469 Country of ref document: DE |
|
| PLBE | No opposition filed within time limit |
Free format text: ORIGINAL CODE: 0009261 |
|
| STAA | Information on the status of an ep patent application or granted ep patent |
Free format text: STATUS: NO OPPOSITION FILED WITHIN TIME LIMIT |
|
| PG25 | Lapsed in a contracting state [announced via postgrant information from national office to epo] |
Ref country code: DK Free format text: LAPSE BECAUSE OF FAILURE TO SUBMIT A TRANSLATION OF THE DESCRIPTION OR TO PAY THE FEE WITHIN THE PRESCRIBED TIME-LIMIT Effective date: 20210609 |
|
| 26N | No opposition filed |
Effective date: 20220310 |
|
| REG | Reference to a national code |
Ref country code: CH Ref legal event code: PL |
|
| REG | Reference to a national code |
Ref country code: BE Ref legal event code: MM Effective date: 20220430 |
|
| PG25 | Lapsed in a contracting state [announced via postgrant information from national office to epo] |
Ref country code: MC Free format text: LAPSE BECAUSE OF FAILURE TO SUBMIT A TRANSLATION OF THE DESCRIPTION OR TO PAY THE FEE WITHIN THE PRESCRIBED TIME-LIMIT Effective date: 20210609 Ref country code: LU Free format text: LAPSE BECAUSE OF NON-PAYMENT OF DUE FEES Effective date: 20220408 Ref country code: LI Free format text: LAPSE BECAUSE OF NON-PAYMENT OF DUE FEES Effective date: 20220430 Ref country code: CH Free format text: LAPSE BECAUSE OF NON-PAYMENT OF DUE FEES Effective date: 20220430 |
|
| PG25 | Lapsed in a contracting state [announced via postgrant information from national office to epo] |
Ref country code: BE Free format text: LAPSE BECAUSE OF NON-PAYMENT OF DUE FEES Effective date: 20220430 |
|
| PG25 | Lapsed in a contracting state [announced via postgrant information from national office to epo] |
Ref country code: IE Free format text: LAPSE BECAUSE OF NON-PAYMENT OF DUE FEES Effective date: 20220408 |
|
| REG | Reference to a national code |
Ref country code: AT Ref legal event code: MM01 Ref document number: 1400922 Country of ref document: AT Kind code of ref document: T Effective date: 20220408 |
|
| PG25 | Lapsed in a contracting state [announced via postgrant information from national office to epo] |
Ref country code: AT Free format text: LAPSE BECAUSE OF NON-PAYMENT OF DUE FEES Effective date: 20220408 |
|
| PG25 | Lapsed in a contracting state [announced via postgrant information from national office to epo] |
Ref country code: HU Free format text: LAPSE BECAUSE OF FAILURE TO SUBMIT A TRANSLATION OF THE DESCRIPTION OR TO PAY THE FEE WITHIN THE PRESCRIBED TIME-LIMIT; INVALID AB INITIO Effective date: 20060408 |
|
| PGFP | Annual fee paid to national office [announced via postgrant information from national office to epo] |
Ref country code: NL Payment date: 20240320 Year of fee payment: 19 |
|
| PG25 | Lapsed in a contracting state [announced via postgrant information from national office to epo] |
Ref country code: CY Free format text: LAPSE BECAUSE OF FAILURE TO SUBMIT A TRANSLATION OF THE DESCRIPTION OR TO PAY THE FEE WITHIN THE PRESCRIBED TIME-LIMIT Effective date: 20210609 |
|
| PGFP | Annual fee paid to national office [announced via postgrant information from national office to epo] |
Ref country code: GB Payment date: 20240320 Year of fee payment: 19 |
|
| PGFP | Annual fee paid to national office [announced via postgrant information from national office to epo] |
Ref country code: PL Payment date: 20240325 Year of fee payment: 19 Ref country code: IT Payment date: 20240320 Year of fee payment: 19 Ref country code: FR Payment date: 20240320 Year of fee payment: 19 |
|
| PG25 | Lapsed in a contracting state [announced via postgrant information from national office to epo] |
Ref country code: TR Free format text: LAPSE BECAUSE OF FAILURE TO SUBMIT A TRANSLATION OF THE DESCRIPTION OR TO PAY THE FEE WITHIN THE PRESCRIBED TIME-LIMIT Effective date: 20210609 |
|
| PGFP | Annual fee paid to national office [announced via postgrant information from national office to epo] |
Ref country code: DE Payment date: 20240320 Year of fee payment: 19 |
|
| PGFP | Annual fee paid to national office [announced via postgrant information from national office to epo] |
Ref country code: ES Payment date: 20240502 Year of fee payment: 19 |
|
| REG | Reference to a national code |
Ref country code: DE Ref legal event code: R119 Ref document number: 502006016469 Country of ref document: DE |
|
| REG | Reference to a national code |
Ref country code: NL Ref legal event code: MM Effective date: 20250501 |
|
| GBPC | Gb: european patent ceased through non-payment of renewal fee |
Effective date: 20250408 |
|
| PG25 | Lapsed in a contracting state [announced via postgrant information from national office to epo] |
Ref country code: DE Free format text: LAPSE BECAUSE OF NON-PAYMENT OF DUE FEES Effective date: 20251104 |
|
| PG25 | Lapsed in a contracting state [announced via postgrant information from national office to epo] |
Ref country code: GB Free format text: LAPSE BECAUSE OF NON-PAYMENT OF DUE FEES Effective date: 20250408 |
|
| PG25 | Lapsed in a contracting state [announced via postgrant information from national office to epo] |
Ref country code: NL Free format text: LAPSE BECAUSE OF NON-PAYMENT OF DUE FEES Effective date: 20250501 Ref country code: FR Free format text: LAPSE BECAUSE OF NON-PAYMENT OF DUE FEES Effective date: 20250430 |
|
| PG25 | Lapsed in a contracting state [announced via postgrant information from national office to epo] |
Ref country code: IT Free format text: LAPSE BECAUSE OF NON-PAYMENT OF DUE FEES Effective date: 20250408 |
|
| PG25 | Lapsed in a contracting state [announced via postgrant information from national office to epo] |
Ref country code: PL Free format text: LAPSE BECAUSE OF NON-PAYMENT OF DUE FEES Effective date: 20250408 |
|
| REG | Reference to a national code |
Ref country code: ES Ref legal event code: FD2A Effective date: 20260528 |
|
| PG25 | Lapsed in a contracting state [announced via postgrant information from national office to epo] |
Ref country code: ES Free format text: LAPSE BECAUSE OF NON-PAYMENT OF DUE FEES Effective date: 20250409 |