EP1686515A1 - Unternehmens-bewertungseinrichtung und unternehmens-bewertungsprogramm - Google Patents
Unternehmens-bewertungseinrichtung und unternehmens-bewertungsprogramm Download PDFInfo
- Publication number
- EP1686515A1 EP1686515A1 EP04722964A EP04722964A EP1686515A1 EP 1686515 A1 EP1686515 A1 EP 1686515A1 EP 04722964 A EP04722964 A EP 04722964A EP 04722964 A EP04722964 A EP 04722964A EP 1686515 A1 EP1686515 A1 EP 1686515A1
- Authority
- EP
- European Patent Office
- Prior art keywords
- technical
- per
- enterprise
- field
- inventions
- Prior art date
- Legal status (The legal status is an assumption and is not a legal conclusion. Google has not performed a legal analysis and makes no representation as to the accuracy of the status listed.)
- Withdrawn
Links
Images


Classifications
-
- G—PHYSICS
- G06—COMPUTING OR CALCULATING; COUNTING
- G06Q—INFORMATION AND COMMUNICATION TECHNOLOGY [ICT] SPECIALLY ADAPTED FOR ADMINISTRATIVE, COMMERCIAL, FINANCIAL, MANAGERIAL OR SUPERVISORY PURPOSES; SYSTEMS OR METHODS SPECIALLY ADAPTED FOR ADMINISTRATIVE, COMMERCIAL, FINANCIAL, MANAGERIAL OR SUPERVISORY PURPOSES, NOT OTHERWISE PROVIDED FOR
- G06Q10/00—Administration; Management
- G06Q10/10—Office automation; Time management
-
- G—PHYSICS
- G06—COMPUTING OR CALCULATING; COUNTING
- G06Q—INFORMATION AND COMMUNICATION TECHNOLOGY [ICT] SPECIALLY ADAPTED FOR ADMINISTRATIVE, COMMERCIAL, FINANCIAL, MANAGERIAL OR SUPERVISORY PURPOSES; SYSTEMS OR METHODS SPECIALLY ADAPTED FOR ADMINISTRATIVE, COMMERCIAL, FINANCIAL, MANAGERIAL OR SUPERVISORY PURPOSES, NOT OTHERWISE PROVIDED FOR
- G06Q50/00—Information and communication technology [ICT] specially adapted for implementation of business processes of specific business sectors, e.g. utilities or tourism
- G06Q50/10—Services
- G06Q50/18—Legal services
- G06Q50/184—Intellectual property management
-
- G—PHYSICS
- G06—COMPUTING OR CALCULATING; COUNTING
- G06Q—INFORMATION AND COMMUNICATION TECHNOLOGY [ICT] SPECIALLY ADAPTED FOR ADMINISTRATIVE, COMMERCIAL, FINANCIAL, MANAGERIAL OR SUPERVISORY PURPOSES; SYSTEMS OR METHODS SPECIALLY ADAPTED FOR ADMINISTRATIVE, COMMERCIAL, FINANCIAL, MANAGERIAL OR SUPERVISORY PURPOSES, NOT OTHERWISE PROVIDED FOR
- G06Q10/00—Administration; Management
- G06Q10/06—Resources, workflows, human or project management; Enterprise or organisation planning; Enterprise or organisation modelling
- G06Q10/063—Operations research, analysis or management
Definitions
- the present invention relates to enterprise value evaluation and the judgment thereof.
- Japanese Patent Laid-Open Publication No. 2001-76042 describes a technique of comprehending the asset value of currently remaining patents by depreciating registered patents and the related sales volume and profits. Moreover, with respect to the evaluation of the value of each patent, an intellectual property evaluation device in which the input ranking of evaluation conducted by one's own company and evaluation conducted by other companies is evaluated as the contribution is known.
- the intellectual property evaluation device described in Japanese Patent Laid-Qpen Publication No. 2001-76042 is to evaluate the intellectual property such as patents one by one each year, and there is a drawback in that it is not possible to judge the enterprise value.
- the total market value is determined by the stock prices in the market. Thus, whether the current stock price and the value of intangible assets calculated based on the stockholders' equity in the book are valid is an extremely important element for investors in the decision-making of stock trading. Enterprises are hoping to increase their value of intangible assets and thereby increase their enterprise value by procuring funds and continuing technical developments. Therefore, increasing the value of intangible assets will be positioned as an important issue in the management strategy for enterprises.
- intangible assets are constituted from various invisible assets such as intellectual property rights including industrial property rights (patents, trademarks and so on) and copyrights, as well as brands and know-how. Thus, it is not easy to evaluate the value of intangible assets.
- an object of the present invention is to provide an enterprise evaluation device and enterprise evaluation program that evaluates an enterprise value more articulately by analyzing the business strategy, research and development strategy and intellectual property strategy of an enterprise based on technical documents such as patent information, and combining this with management-finance information.
- Another object of the present invention is to provide an enterprise evaluation device capable of presenting, with a numerical value, bar graph or index, whether the invention or technical strength in a predetermined technical field is in an oligopolistic state or a competitive state.
- Still another object of the present invention is to provide an enterprise evaluation device capable of concurrently displaying whether the number of inventions in a predetermined technical field is in an oligopolistic state of a specific enterprise, and to what degree the enterprise to be researched owns the technical share in this technical field.
- yet another object of the present invention is to provide an enterprise evaluation device capable of presenting an index, with a numerical value, wording or figure, enabling the judgment on whether the technical strength in a predetermined enterprise is diversified in the respective technical fields, or whether the technical strength is concentrated on a single technical field.
- yet another object of the present invention is to provide an enterprise evaluation device capable of presenting an index, with a numerical value, wording or figure, representing the comprehensive strength of the technical development strength viewed from inventions, and representing the strength of the competitive position relating to inventions.
- yet another object of the present invention is to provide an enterprise evaluation device capable of presenting an representing the comprehensive strength of the technical development strength viewed from inventions and the strength of the competitive position relating to inventions in a state where comparative assessment can be conducted among enterprises.
- yet another object of the present invention is to provide an enterprise evaluation device capable of comparing the competitive position relating to inventions equally for enterprises having a broad technical field and enterprises having a narrow technical field.
- yet another object of the present invention is to provide an enterprise evaluation device capable of evaluating the competitive position of technology viewed from inventions upon giving consideration to the growth rate of the overall enterprise.
- yet another object of the present invention is to provide an enterprise evaluation device capable of accurately judging the condition of the enterprise by concurrently presenting the technical strength and management-finance information to the user.
- the enterprise evaluation device of the present invention includes:
- the enterprise evaluation device of the present invention includes:
- the enterprise evaluation device of the present invention includes:
- the enterprise evaluation device of the present invention includes:
- the enterprise evaluation device of the present invention includes:
- the enterprise evaluation device of the present invention includes:
- the enterprise evaluation device of the present invention includes:
- the enterprise evaluation device of the present invention includes:
- the enterprise evaluation device of the present invention includes:
- the enterprise evaluation device of the present invention uses in the threshold an average value or standard deviation of the enterprise competitive position scores of all enterprises.
- the enterprise evaluation device of the present invention includes:
- the enterprise evaluation device of the present invention includes:
- the enterprise evaluation device of the present invention uses in the threshold an average value or standard deviation of the standardized enterprise competitive position scores of all enterprises.
- the enterprise evaluation device of the present invention includes:
- the enterprise evaluation device of the present invention includes:
- the enterprise evaluation device of the present invention uses in the threshold an average value or standard deviation of the enterprise competitive position indexes of all enterprises.
- the enterprise evaluation device of the present invention includes:
- the enterprise evaluation device of the present invention includes:
- the enterprise evaluation device of the present invention uses in the threshold an average value or standard deviation of the standardized enterprise competitive position indexes of all enterprises.
- the enterprise evaluation device of the present invention classifies the technical field by IPC sections, IPC classes, IPC sub-classes, IPC main groups, IPC sub-groups, F terms, FI, facets or keywords contained in the technical documents.
- the enterprise evaluation device of the present invention uses, as the technical documents, publications of registered patents, unexamined patent applications, registered utility models, unexamined utility model applications, published translations of PCT international applications, domestic re-publications of PCT international applications, foreign publications, published appeal and trial decisions, transitional information or journals of technical disclosure.
- the enterprise evaluation device of the present invention uses, as the number of inventions among the total number of inventions per technical field or number of inventions per enterprise and per technical field, the number of patent or utility model applications, number of claims filed, number of registrations, number of claims registered, number of examination requests, number of claims requested for examination, number of decisions of registration, number of claims decided to be registered, number of decisions of rejection, number of claims decided to be rejected, number of demands for trial, number of claims demanded for trial or the ratios thereof.
- the enterprise evaluation device of the present invention includes:
- the enterprise evaluation device of the present invention includes:
- the enterprise evaluation device of the present invention includes:
- the enterprise evaluation device of the present invention includes:
- the enterprise evaluation device of the present invention uses, as the management-finance information, the sales volume, sales profit, operating profit, sales profit ratio, operating profit ratio, total market value to total assets ratio, total market value to stockholders' equity ratio, total market value to sales volume ratio, total market value to gross operating profit ratio, total market value to operating profit ratio, gross operating profit to total assets ratio, gross operating profit to stockholders' equity ratio, operating profit to total assets ratio, operating profit to stockholders' equity ratio, operating profit to total assets ratio, operating profit to stockholders' equity ratio, stockholders' equity ratio, balance of total market value and stockholders' equity, R&D cost, R&D cost to sales volume ratio, R&D cost to gross operating profit ratio, gross operating profit ratio, gross operating profit or other financial information of the enterprise.
- the enterprise evaluation device includes:
- the enterprise evaluation device of the present invention includes:
- the enterprise evaluation device of the present invention includes:
- the enterprise evaluation device of the present invention includes:
- the enterprise evaluation device of the present invention includes:
- the enterprise evaluation device of the present invention includes:
- the enterprise evaluation device of the present invention includes:
- the enterprise evaluation device of the present invention includes:
- the enterprise evaluation device of the present invention includes:
- the enterprise evaluation device of the present invention includes:
- the enterprise evaluation device of the present invention includes:
- the enterprise evaluation device of the present invention includes:
- the enterprise evaluation device of the present invention includes:
- the enterprise evaluation device of the present invention includes:
- the enterprise evaluation device of the present invention includes:
- the enterprise evaluation device of the present invention classifies the technical field by IPC sections, IPC classes, IPC sub-classes, IPC main groups, IPC sub-groups, F terms, FI, facets or keywords contained in the technical, documents. Therefore, it is possible to calculate the oligopolistic state or diversified state of inventions and competitive position by using published patent documents and present the same to a user.
- the enterprise evaluation device of the present invention uses, as the technical documents, publications of registered patents, unexamined patent applications, registered utility models, unexamined utility model applications, published translations of PCT international applications, domestic re-publications of PCT international applications, foreign publications, published appeal and trial decisions, transitional information or journals of technical disclosure. Therefore, it is possible to calculate the oligopolistic state or diversified state of inventions and competitive position by using published patent documents and present the same to a user.
- the enterprise evaluation device of the present invention uses, as the number of inventions among the total number of inventions per technical field or number of inventions per enterprise and per technical field, the number of patent or utility model applications, number of claims filed, number of registrations, number of claims registered, number of examination requests, number of claims requested for examination, number of decisions of registration, number of claims decided to be registered, number of decisions of rejection, number of claims decided to be rejected, number of demands for trial, number of claims demanded for trial or the ratios thereof. Therefore, it is possible to calculate the oligopolistic state or diversified state of inventions and competitive position by using published patent documents and present the same to a user.
- the enterprise evaluation device of the present invention includes:
- the enterprise evaluation device of the present invention includes:
- the enterprise evaluation device of the present invention includes:
- the enterprise evaluation device of the present invention includes:
- the enterprise evaluation device of the present invention uses, as the management-finance information, the sales volume, sales profit, operating profit, sales profit ratio, operating profit ratio, total market value to total assets ratio, total market value to stockholders' equity ratio, total market value to sales volume ratio, total market value to gross operating profit ratio, total market value to operating profit ratio, gross operating profit to total assets ratio, gross operating profit to stockholders' equity ratio, operating profit to total assets ratio, operating profit to stockholders' equity ratio, stockholders' equity ratio, balance of total market value and stockholders' equity, R&D cost, R&D cost to sales volume ratio, R&D cost to gross operating profit ratio, gross operating profit ratio, gross operating profit or other financial information of the enterprise. Therefore, it is possible to accurately judge the condition of an enterprise by combining the technical strength and management-finance information relating to the invention.
- FIG. 1 is a diagram showing the overall configuration of an enterprise evaluation system according to the present invention.
- the enterprise value evaluation system is configured from a database 20 recording various types of information such as management-finance information, technical documents (in addition to patent information, numerical value information relating to utility models and technical journals), market value information (numerical value information of the market value), threshold for determining the validity of the enterprise value, determination of the validity and category based on such threshold; an enterprise evaluation device 30 for inputting various types of information such as management-finance information, technical document and market value information and outputting the judgment results of the validity of the enterprise value; and a communication network 10 such as the Internet or dedicated communication line for communicably connecting the enterprise evaluation device 30 and database 20.
- a communication network 10 such as the Internet or dedicated communication line for communicably connecting the enterprise evaluation device 30 and database 20.
- the database 20 may be provided inside the enterprise evaluation device 30.
- FIG. 2 is a signal processing system block diagram of an enterprise evaluation device 30 according to the present invention.
- the information transmission-reception unit of the enterprise evaluation device 30 is provided with a transmission-reception means 365 (including the functions of a management-finance information acquisition means, technical document acquisition means, market value information acquisition means, various threshold acquisition means and output means) for transmitting and receiving information to and from another telecommunications device via the communication network 364 such as a public line or telecommunications network.
- a transmission-reception means 365 including the functions of a management-finance information acquisition means, technical document acquisition means, market value information acquisition means, various threshold acquisition means and output means for transmitting and receiving information to and from another telecommunications device via the communication network 364 such as a public line or telecommunications network.
- the enterprise evaluation device 30 is also provided with an input interface 371 for acquiring various types of information input by the user via the input means 370 and transmitting this to the information processing means described later, and outputting display commands to an LCD or the like based on instructions from the information processing means, a display means 372 for displaying information such as images or texts, graphs or charts, a display interface 373 (including the function of an output means) for outputting image signals for display to the display means 372 based on the command from the information processing means, and a printer interface 374 for outputting information such as images or texts, graphs or charts to a printer 32 or the like.
- the input means 370 includes input devices such as a keyboard, mouse, tablet and the like.
- the enterprise evaluation device 30 is also provided with a recording medium mounting unit 378 for detachably mounting a recording medium 377, and a recording medium interface 379 (including the functions of a management-finance information acquisition means, technical document acquisition means, market value information acquisition means, various threshold acquisition means and output means) for recording and reading various types of information in and from the recording medium 377.
- the recording medium 377 is a detachable recording medium in a magnetic recording format or optical recording format as represented by semiconductors such as a memory card, MO, magnetic disk and so on.
- the enterprise evaluation device 30 is also provided with an information processing means 380 for controlling the overall enterprise evaluation device 30, and a memory 381 configured from a ROM recording programs to be executed by the information processing means 380 and various constants, or a RAM which is a recording means to become the working area upon the information processing means 380 executing processing.
- the information processing means 380 is able to realize the various functions of a management-finance information acquisition means, technical document acquisition means, market value information acquisition means, various threshold acquisition means, output means, total number of inventions per technical field extraction means, total number of inventions per enterprise extraction means, number of inventions per technical field and per enterprise extraction means, oligopoly score per technical field calculation means, oligopoly score per enterprise calculation means, oligopolistic state per technical field judgment means, display data generation means, diversification per enterprise categorizing means, oligopoly-emphasized score per technical field calculation means, enterprise competitive position score calculation means, standardized enterprise competitive position score calculation means, enterprise competitive position score categorizing means, standardized enterprise competitive position score categorizing means, rate of increase of inventions acquisition means, excess growth rate calculation means, enterprise competitive position index calculation means, standardized enterprise competitive position index calculation means, enterprise competitive position index categorizing means and standardized enterprise competitive position index categorizing means.
- a plurality of increase of inventions acquisition means instead of the information processing means 380 performing all the for
- the enterprise evaluation device 30 is also provided with a recording means 384 such as a hard disk recording various types of information; for example, various constants relating to the processing of the enterprise evaluation device 30, attribute information upon communicably connecting to a telecommunications device on a network, connection information such as a URL (Uniform Resource Locators), gateway information, DNS (Domain Name System), management-finance information relating to the management of the enterprise, technical documents relating to patents, market value information, threshold for determining the enterprise value and determination results of validity based on such threshold; recording means interface 385 (including the functions as a management-finance information acquisition means, technical document acquisition means, market value information acquisition means, various threshold acquisition means and output means) for reading information recorded in the recording means 384 and performing the process of writing information to the recording means 384; and a calendar clock 390 for clocking the time.
- a recording means 384 such as a hard disk recording various types of information; for example, various constants relating to the processing of the enterprise evaluation device 30, attribute information upon communic
- the respective peripheral circuits of the information processing means 380, display interface 373, memory 381, recording means interface 385 and calendar clock 390 in the enterprise evaluation device 30 are connected to a bus 399, and the respective peripheral circuits can be controlled based on the processing program to be executed by the information processing means 380.
- various databases of the management-finance information, technical documents and market value information may be stored in the recording means 384, provided by the storage medium 377 such as a CD-ROM, CD-RW, DVD or MO, or acquired from another telecommunications device (database 20 or the like) via the communication network 364.
- the enterprise evaluation device 30 can be realized by using various types of computers such as a personal computer or workstation. Moreover, computers may be connected via a network to share and implement the functions.
- the management-finance information acquisition means of the transmission-reception means 365, recording means interface 375, recording medium interface 379 and information processing means 380 are capable of acquiring management-finance information in a period to be researched from a management-finance information database (database 20, recording means 384, recording medium 377 or the like) recording information showing the size of the enterprise to be researched or management-finance information such as the finance information of the enterprise.
- a management-finance information database database 20, recording means 384, recording medium 377 or the like
- the technical document acquisition means of the transmission-reception means 365, recording means interface 375, recording medium interface 379 and information processing means 380 are capable of acquiring technical documents in an enterprise to be researched, technical field to be researched or period to be researched from a technical document database (database 20, recording means 384, recording medium 377 or the like) recording technical documents or technical journals relating to applications of patents or utility models which have been filed, or registered patents or utility models owned by the enterprise to be researched.
- the technical document acquisition means is capable of acquiring technical documents such as publications of unexamined patent applications or registered patents from a technical document database.
- the market value information acquisition means of the transmission-reception means 365, recording means interface 375, recording medium interface 379 and information processing means 380 are capable of acquiring market value information in a period to be researched from a market value information database (database 20, recording means 384, recording medium 377 or the like) recording market value information such as the rank of stock price, rank of brand value or hidden assets of the enterprise to be researched.
- a market value information database database 20, recording means 384, recording medium 377 or the like
- the total number of inventions per technical field extraction means of the information processing means 380 is capable of classifying the acquired technical documents into respective technical fields such as IPC sub-classes and keywords, and extracting the total number of inventions per technical field such as total number of patent applications per technical field or total number of claims filed per technical field.
- the number of inventions per technical field and per enterprise extraction means of the information processing means 380 is capable of classifying the acquired technical documents into respective enterprises such as applicants and respective technical fields such as IPC sub-classes and keywords, and extracting the number of inventions per enterprise and per technical field such as the number of patent applications per enterprise and per technical field or number of claims filed per enterprise and per technical field.
- the oligopoly score per technical field calculation means of the information processing means 380 is capable of calculating the number-of-inventions share per technical field and per enterprise by dividing the number of inventions per enterprise and per technical field by the total number of inventions per technical field, and accumulating the number-of-inventions share per technical field and per enterprise powered by ka (wherein ka > 1) for each enterprise having at least one invention in a predetermined technical field, thereby calculating an oligopoly score per technical field.
- the output means of the transmission-reception means 365, recording means interface 375, recording medium interface 379, printer interface 374 and information processing means 380 is capable of outputting the oligopoly score per technical field, oligopoly-emphasized score per technical field, oligopoly score per enterprise, index showing the oligopolistic state or competitive state, enterprise competitive position score, standardized enterprise competitive position score, enterprise competitive position index, standardized enterprise competitive position index, and other display data to the display means, printing means, recording medium, or another telecommunications device via a communication line.
- the oligopolistic state per technical field judgment means of the information processing means 380 and the like is capable of comparing a predetermined threshold and the calculated oligopoly score per technical field, and judging whether the number of inventions in the predetermined technical field is in an oligopolistic state of a specific enterprise, or a competitive state of numerous enterprises.
- the display data generation means of the information processing means 380 and the like is capable of generating display data for displaying the indication of the oligopoly score per technical field in a numerical value or a bar graph and the judgment result of whether number of inventions in the predetermined technical field is in an oligopolistic state of a specific enterprise within the same frame or at an adjacent position.
- the total number of inventions per enterprise extraction means of the information processing means 380 and the like is capable of classifying the acquired technical documents into respective enterprises such as applicants, and extracting the total number of inventions per technical field such as the total number of patent applications per enterprise or total number of claims filed per enterprise.
- the oligopoly score per enterprise calculation means of the information processing means 380 and the like is capable of calculating the number-of-inventions share per enterprise and per technical field by dividing the number of inventions per enterprise and per technical field by the total number of inventions per enterprise, and accumulating the number of inventions per enterprise and per technical field powered by kb (wherein kb > 0) for each technical field having at least one invention in a predetermined enterprise, thereby calculating an oligopoly score per enterprise.
- the diversification per enterprise categorizing means of the information processing means 380 and the like is capable of comparing a predetermined threshold and the calculated oligopoly score per enterprise, and categorizing whether the number of inventions in a predetermined enterprise is concentrated in a specific technical field or diversified in numerous technical fields through representation with a figure or wording.
- the diversification index calculation means of the information processing means 380 and the like is capable of calculating a diversification index by subtracting the oligopoly score per enterprise from 1, or a diversification index by subtracting the oligopoly score per enterprise from 1 and multiplying 100 thereto.
- the oligopoly-emphasized score per technical field calculation means of the information processing means 380 and the like is capable of calculating the oligopoly-emphasized score per technical field by multiplying the number-of-inventions share per technical field and per enterprise and the oligopoly score per technical field.
- the enterprise competitive position score calculation means of the information processing means 380 and the like is capable of accumulating the oligopoly-emphasized score per technical field for each technical field having at least one invention in a predetermined enterprise, thereby calculating the enterprise competitive position score.
- the enterprise competitive position score categorizing means of the information processing means 380 and the like is capable of comparing a predetermined threshold and the calculated enterprise competitive position score, and categorizing the competitive position of a predetermined enterprise relating to inventions through representation with a figure or wording.
- the display data generation means of the information processing means 380 and the like is capable of generating display data categorized by the figure or wording.
- the standardized enterprise competitive position score calculation means of the information processing means 380 and the like is capable of calculating the standardized enterprise competitive position score through dividing the enterprise competitive position score by the number of technical fields.
- the standardized enterprise competitive position score categorizing means of the information processing means 380 and the like is capable of comparing a predetermined threshold and the calculated standardized enterprise competitive position score, and categorizing the competitive position of a predetermined enterprise relating to inventions through representation with a figure or wording.
- the rate of increase of inventions acquisition means of the information processing means 380 and the like is capable of acquiring the rate of increase in number of inventions in a predetermined enterprise and the rate of increase in number of inventions in all enterprises based on date information of the acquired technical document.
- the excess growth rate calculation means of the information processing means 380 and the like is capable of calculating the excess growth rate of a predetermined enterprise by subtracting the rate of increase in number of inventions in all enterprises from the rate of increase in number of inventions in the predetermined enterprise.
- the enterprise competitive position index calculation means of the information processing means 380 and the like is capable of calculating the enterprise competitive position index by multiplying the enterprise competitive position score to a value obtained by adding 1 to the excess growth rate.
- the enterprise competitive position index categorizing means of the information processing means 380 and the like is capable of comparing a predetermined threshold and the calculated enterprise competitive position index, and categorizing the competitive position of a predetermined enterprise relating to inventions through representation with a figure or wording.
- the standardized enterprise competitive position index calculation means of the information processing means 380 and the like is capable of for calculating the standardized enterprise competitive position index by dividing the competitive position index per enterprise by the number of technical fields.
- the standardized enterprise competitive position index categorizing means of the information processing means 380 and the like is capable of comparing a predetermined threshold and the calculated standardized enterprise competitive position score, and categorizing the competitive position of a predetermined enterprise relating to inventions through representation with a figure or wording.
- FIG. 3 is a chart representing an example of an example of management-finance information recorded in the recording means of the database 20 or the like.
- management-finance information includes information showing the size of the company, information showing the financial information of the company, and combined information of the company calculated by combining the various types of information of the company.
- the data of management-finance information the annual security report of the company to be researched, and information acquired from commercial databases provided by newspaper publishers and research institutes may be used.
- Information showing the size of the company includes the number of employees, number of officers, capital, number of plants, number of offices, ground floor area, total floor area, ownership ratio of premises, ownership ratio of building, number of employees (consolidated basis), number of officers (consolidated basis), capital (consolidated basis), number of plants (consolidated basis), number of offices (consolidated basis), ground floor area (consolidated basis), total floor area (consolidated basis), ownership ratio of premises (consolidated basis) or ownership ratio of building (consolidated basis).
- the financial information of the company includes the sales volume, sales profit, operating profit, sales profit ratio, operating profit ratio, total market value to total assets ratio, total market value to stockholders' equity ratio, total market value to sales volume ratio, total market value to gross operating profit ratio, total market value to operating profit ratio, gross operating profit to total assets ratio, gross operating profit to stockholders' equity ratio, operating profit to total assets ratio, operating profit to stockholders' equity ratio, balance of total market value and stockholders' equity, R&D cost, R&D cost to sales volume ratio, R&D cost to gross operating profit ratio, gross operating profit ratio, R&D cost to operating profit ratio or gross operating profit.
- finance information of the company includes total assets, tangible fixed assets, amount of capital investment, depreciation costs, patent royalty income, financial assets (liquid assets and liquid liabilities), interests paid, discounts, long-term prime rate (long-term borrowirig rate), short-term prime rate, interest on bonds, 10-year government bond yield ratio, personnel costs (including officers' compensation and labor costs), welfare expenses, capital stock, total number of outstanding shares, stock price (Nikkei Stock Average) or taxes and public charges.
- the combined information of the company includes the sales volume per employee, R&D cost per employee, sales profit per employee, operating profit per employee, gross operating profit per employee and so on.
- the sales profit is the gross margin sought by subtracting the manufacturing cost from the sales volume. Nevertheless, some R&D cost are included in manufacturing costs, whereas others are included in general administrative expenses. Thus, strictly speaking, the gross operating profit cannot be called a profit index positioned between the sales profit and operating profit.
- the relationship of the gross operating profit and other profit indexes can be represented with the formula indicated below.
- the value of the "R&D cost to gross operating profit ratio" is not for comparing the relative merits or quality of companies. This index will differ considerably depending on the business line and size of the company, and the situation of the management strategy and operating revenue of the respective companies. Therefore, this index may be used as a reference index for performing the relative comparison among companies of the same size in the same line of business.
- the "gross operating profit ratio” is sought by dividing the "gross operating profit” by the "sales volume”. Therefore, this index is a provisional estimate of the ratio accounting for in the sales volume of the gross profit generated from the main business; that is, the manufacture and sale activities excluding the research and development activities. This index is considered to be positioned roughly between the sales profit ratio (sales ratio of the gross margin generated from manufacture activities) and operating profit ratio (sales ratio of profits generated from main business including research and development activities).
- the average years required for registration is now explained.
- the "years required for registration” means the number of years required from the filing until the registration as a patent via examination.
- the “average years required for registration (based on the registered year)” is a calculation of the average value of the years required from the filing to the registration of the respective patents, based on the registered year, during the period subject to registration statistics.
- the “average years required for registration (based on the filed year)” is the calculation of the average value of the years required from the filing to the registration of the respective patents, based on the filed year, that were registered after the beginning of the period subject to registration statistics and by the end of the period subject to registration statistics among those filed before the end of the period subject to filing statistics.
- FIGS. 4A and 4B are diagrams showing an example of a technical document recorded in a recording means of the database 20 or the like.
- technical documents contain patent documents such as filing information and registration information of patents and utility models.
- patent documents such as filing information and registration information of patents and utility models.
- data of technical documents for instance, the Industrial Property Digital Library database of the Japanese Patent Office, information relating to patents and utility models acquired from CD-ROM gazettes or other technical journals may be used.
- Application information of the present invention includes, for instance, per enterprise, the following: the filing date, application number, title of the invention, inventors, applicants, scope of claims, abstract, IPC, FI, F Term, agents, publication date, publication number, existence of request for examination, date of request for examination, priority date, priority number, date of publication of translations of PCT international application, number for publication of translations of PCT international application, date of domestic re-publication of PCT international application, number for domestic re-publication of PCT international application, international filing date, international application number, international publication date, international publication number, designated country, number of filings, number of examinations requested, number of filings based on IPC, number of filings based on keywords, number of claims filed, years spent on examination requests, number of inventors, number of applicants (number of joint applications), number of domestic priority-claiming applications, number of domestic priority bases claimed in applications, number of priority bases from foreign countries, number of applications in which an exception to loss of novelty is requested, number of applications in which examination is requested before laid-open
- registration information of the present invention includes, for example, per enterprise, the following: the registration date, issue date of registration, registration number, scheduled day of expiration of right, date of publication of examined application, publication number of examined application, annual maintenance fee payment status, number of final decisions for rejection, date of final decision for rejection, number of claims decided to be finally rejected, number of appeals against final decision for rejection, number of abandoned/withdrawn applications after request for examination, number of abandoned/withdrawn claims after request for examination, number of invalidation trials, appeal/trial number, date of decision to appeal/trial, number of claims demanded for invalidation trial, number of appeals to dismissals of amendment or trials for correction, number of oppositions, number of claims demanded for opposition, inventors of registered patent, number of inventors of registered patent, applicants of registered patent, references cited, number of registrations, number of claims registered, number of expired patents after registration, years spent from application to registration, patent registration rate, patent allowance rate, years spent from request for examination to registration, number of applications in which preferential examination is conducted, number of rejections issued, number of
- the present invention provides several indexes that will become a criterion for investors, banks, engineers and others to search for enterprises with ingenious technical strength and a promising future among a plurality of enterprises, to search for enterprises with competitive edge, or to judge whether inventions in a predetermined technical field are in a competitive state or an oligopolistic state.
- patent applications or the number of inventions such as the number of claims in an application are extracted for the respective technical fields such as IPC sub-classes and keywords.
- the present invention is not limited thereto, and, as the number of inventions, the number of patent or utility model registrations, number of claims registered, number of examination requests, number of claims requested for examination, number of final decisions for registration, number of claims decided to be registered, number of final decisions for rejection, number of claims decided to be rejected, number of demands for trial, number of claims demanded for trial and so on may also be used according to the intended purpose.
- a value combining two or more number of inventions, for instance, may also be used according to the intended purpose.
- IPC sub-classes are used as the technical field of the invention.
- technical information is not limited to IPC sub-classes, and the classifications of IPC sections, classes, sub-classes, main groups, sub groups, F terms, FI, facets, keywords contained in the patent documents may also be used according to the intended purpose.
- annual classification such as the filing date or registration date of patent applications may be used, classification in the number of years from filing to registration, classification in the number of years from examination request to registration, and classification in the retention period of registered patents may also be used.
- FIG. 5 is a diagram showing a display example for displaying the top technical fields (H05K, H01L%) with the largest number of inventions in a predetermined enterprise (Enterprise BI) of a specific year (2003), number-of-inventions share (ratio) of the predetermined enterprise (Enterprise BI) in the number of inventions of all enterprises in such technical field, and oligopoly information showing whether the number of inventions in a predetermined technical field is in a competitive state among the respective enterprises or in an oligopolistic state.
- a predetermined enterprise Enterprise BI
- ratio number-of-inventions share
- FIG. 5 shows period information representing the year of an invention used in the calculation, technical fields such as IPC sub-classes to which the invention belongs, number of claims per enterprise and per technical field and number of claims per enterprise and per technical field of a patent of a predetermined technical field in a predetermined enterprise, number of claims per enterprise and per technical field (number of claims per enterprise and per technical field share (ratio)) among the total number of claims per enterprise, number of applications per enterprise and per technical field (number of applications per enterprise and per technical field share (ratio)) among the total number of applications per enterprise, total number of claims per enterprise, and the number of classifications of the technical field.
- technical fields such as IPC sub-classes to which the invention belongs
- number of claims per enterprise and per technical field number of claims per enterprise and per technical field share (ratio)) among the total number of claims per enterprise, number of applications per enterprise
- FIG. 5 also shows the number of claims per enterprise and per technical field ratio (number-of-claims share per technical field and per enterprise) among the total number of claims per technical field and per enterprise, and oligopoly information showing whether the number of inventions is in a competitive state or in an oligopolistic state in light of the number of claims per technical field and per enterprise of the respective enterprises in such technical field.
- Formula 1 shows the calculating formula for calculating the ratio of number of claims per enterprise and per technical field (number of claims share per enterprise and per technical field) among the total number of claims per enterprise.
- Number-of-claims share per enterprise and per technical field ( % ) ⁇ ( number of claims per enterprise and per technical field ) / ( total number of claims per enterprise ) ⁇ ⁇ 100
- the calculating formula is shown below for calculating the ratio of number of applications per enterprise and per technical field (number of applications share per enterprise and per technical field) among the total number of applications per enterprise.
- Number ⁇ of ⁇ applications share per enterprise and per technical field ( % ) ⁇ ( number of applications per enterprise and per technical field ) / ( total number of applications per enterprise ) ⁇ ⁇ 100
- Formula 3 below.
- a percentage indication is enabled by multiplying 100 at the end, the ratio may be calculated without multiplying 100.
- the calculating formula is shown below for calculating the ratio of number of claims per enterprise and per technical field (number-of-claims share per technical field and per enterprise) among the total number of claims per technical field.
- Oligopoly information showing whether the number of inventions in a predetermined technical field is in a competitive state among all enterprises or in an oligopolistic state, for instance, can be determined and displayed by substituting Formula 5 to the following calculating formula of the SEI score per technical field (oligopoly score per technical field)
- the competitive state of an invention in a predetermined technical field can be categorized as follows.
- the HHI index is an abbreviation of the Hirschman-Herfindahl Index and is an index referred to as the "Herfindahl Index”.
- the HHI index is a method for measuring the degree of oligopoly or dispersion in an arbitrary product market, and is sought with the total value obtained by squaring the share of an enterprise participating in that market.
- HHI index 10,000, and the value will be lower when the competition is severe.
- a threshold is provided for judging the oligopolistic state or competitive state. And, when the applied HHI index of the number-of-inventions share exceeds the threshold, this is judged to be an oligopolistic state, and if it is less than the threshold, this is judged to be a competitive state.
- the threshold of the applied HHI index based on the number-of-inventions share is empirically set to 1000, the threshold is not limited to 1000. Further, the number-of-inventions share per technical field and per enterprise of each enterprise participating in the market is not limited to being squared, and a value of the cube or more may also be used according to the intended purpose.
- the predetermined enterprise is not in an advantageous state in this technical field given the present circumstances. Accordingly, it is possible to presume that the predetermined enterprise should consider withdrawing to a new and different core area with a possibility of securing competitive advantage.
- the enterprise evaluation device 30 performs processing for reading the name of IPC sub-classes and the number of claims regarding the publications of unexamined patent applications of all enterprises filed within a predetermined period.
- the enterprise evaluation device 30 tabulates the number of claims and number of applications per all IPC sub-classes given to all the read publications of unexamined patent applications, and displays the number of applications per enterprise and per technical field and the number of claims per enterprise and per technical field and the number of top classifications thereof.
- the number of claims per enterprise and per technical field, number of claims per enterprise and per technical field share, number of applications per enterprise and per technical field and number of applications per enterprise and per technical field share are calculated regarding the top 5 predetermined technical fields (IPC sub-classes) for each predetermined period (i.e., for each year), and displayed on the left half of the diagram.
- the increase or decrease when compared to the calculated results of the previous year (i.e. comparison with the same term of the previous year) is displayed with ⁇ or ⁇ on the right side of the number of claims per enterprise and per technical field, number of claims per enterprise and per technical field share, number of applications per enterprise and per technical field and number of applications per enterprise and per technical field share.
- the right side of the application portfolio analysis shown in FIG. 5 shows the number-of-inventions share per technical field and per enterprise (number-of-claims share per technical field and per enterprise in the example shown in FIG. 5) and the ranking of such number-of-inventions share per technical field and per enterprise, as well as the oligopolistic state of such technical field (IPC sub-class) in the respective predetermined technical fields (respective IPC sub-classes).
- This oligopolistic state is an index for judging whether the number of inventions in a predetermined technical field is in an oligopolistic state of a specific enterprise, or in a competitive state among numerous enterprises by comparing the predetermined threshold and the calculated oligopoly score per technical field.
- the oligopolistic state is shown in text
- the number-of-claims share per technical field and per enterprise is shown with a bar graph and numerical value
- the judgment result of whether the number of inventions is in an oligopolistic state or a competitive state is displayed at a position in the same frame of adjacent thereto.
- FIG. 5 shows that the number of claims per enterprise and per technical field (one form of the number of inventions per enterprise and per technical field) of a predetermined enterprise (Enterprise BI) in the year 2003 is 2,526 claims, and that the number of classifications of the IPC sub-classes (one form of the technical field) is 51 classifications.
- Enterprise BI has a number-of-inventions share per technical field and per enterprise in H01L of 0.40%, and is ranked 33rd, and has a number-of-claims share per technical field and per enterprise of G02B of 0.40%, and is ranked 42nd. Therefore, it can be acknowledged that Enterprise BI is under a very severe condition in terms of technical competition in these technical fields.
- the number-of-claims share per technical field and per enterprise among the number of inventions in all enterprises is 2.70%, and is ranked 11th. Therefore, the market share of inventions by other companies is high, and it is possible to determine that this technical field is in an oligopolistic state of other enterprises other than Enterprise BI. And, it is possible to judge that Enterprise BI is under a very severe condition in terms of technical competition in this technical field.
- the technical competitive position of an enterprise that cannot be known only with the number of inventions such as the number of patent applications per enterprise and per technical field or number of claims per enterprise and per technical field is analyzed upon giving consideration to technical fields such as IPC sub-classes.
- the status such as the share or oligopoly information of the respective enterprises in that technical field, or the competitive state of the technical field itself, the positioning relating to the technical development of the respective enterprises can be comprehended from many angles.
- the patent diversification index represents the degree of concentration or diversification of the technical development in a predetermined technical field by using the ratio of the number of inventions per enterprise and per technical field (number of claims per enterprise and per technical field) per technical field (per IPC sub-class) among the total number of claims per enterprise of each year (each period).
- the patent diversification index is referred to as a PDI (Patent Diversification Index) below, and this is calculated in the following order together with the SEI index per enterprise and per technical field (emphasized ratio of per enterprise and per technical field share).
- the calculating formula is shown below for calculating the emphasized ratio of number-of-inventions share per enterprise and per technical field.
- ⁇ k b ⁇ ( number of inventions per enterprise and per technical field ) / ( total number of inventions per enterprise ) ⁇ k b provided,
- the calculating formula is shown below for defining the patent diversification index PDI (Patent Diversification Index), which is one form of a diversification index.
- PDI Patent Diversification Index
- 100 is multiplied to a value obtained by subtracting 1 from the oligopoly score per enterprise to calculate the diversification index, and displayed in a value that is sensuously similar to a percentage indication. Nevertheless, a value obtained by subtracting the oligopoly score per enterprise from 1 without multiplying 100 may also be defined and displayed as the diversification index.
- Formula 10 By using Formula 10 to calculate the patent diversification index (PDI), it will be possible to show the degree of diversification of inventions in a predetermined enterprise. 100 is multiplied at the end for setting the acquirable scope of the patent diversification index to be 0 to 100, thereby realizing an easy-to-read numerical value as a value close to a percentage indication.
- the total of the power of the number of claims per enterprise and per technical field share itself may be multiplied by 100 in order to calculate the SEI score per enterprise.
- the calculated index may be expressed as a monopolization index or oligopolistic index.
- a round number or the multiples thereof may be multiplied.
- the SEI score per technical field illustrated in Formula 6 showed a state (oligopolistic state) where a specific enterprise is monopolizing the inventions in a predetermined technical field the larger the value, and showed a state (dispersed state) where numerous enterprises are creating inventions in a predetermined technical field the smaller the value.
- a patent diversification index (PDI)
- the SEI score per enterprise is subtracted from 1 and then multiplied by 100, the closer this value is to 100, it means that the inventions of that enterprise are diversified across various technical fields. Further, the closer this value is to 0, it means that the inventions of that enterprise are concentrated in a specific technical field.
- the power index kb 2 as the power index kb
- the difference in shares among the respective technical fields can be represented larger.
- a power that is smaller than 1 is used as the power index kb
- the difference among the respective technical fields can be represented smaller. This can be suitably employed in a case where it is not preferable if the difference in shares among the respective technical fields is so small that it is difficult to see, but when comparing technical fields that have a significant difference in shares from the beginning. Therefore, the power index may be suitably changed according to the target of research or intended purpose.
- the patent diversification index may be calculated based on the foregoing calculating formula and compared with a predetermined threshold so as to categorize the degree of diversification using a figure or wording for representing whether the number of inventions in a predetermined enterprise is concentrated in a specific technical field, or diversified in numerous technical fields.
- the patent diversification index (PDI) shown in Formula 10 is calculated based on the number of inventions per enterprise and per technical field, but this may also be calculated based on the number of claims per enterprise and per technical field or number of applications per enterprise and per technical field.
- the primary classification of IPC sub-classes given to publications of unexamined patent applications may be used.
- the secondary classification of the IPC sub-classes may be jointly used.
- 0.5 cases of primary classification and 0.5 cases of secondary classification may be tabulated equally, or, as a different weighting in the primary classification and secondary classification of IPC, for instance, 0.7 cases of primary classification and 0.3 cases of secondary classification may be used for calculation. Similar weighting may be performed in the calculation of other indexes pertaining to the present invention.
- FIG. 6 and FIG. 7 show trial calculation examples of a patent diversification index (PDI).
- PDI patent diversification index
- Calculation 1 shown in FIG. 6 is a calculation example of calculating the patent diversification index (PDI) of Enterprise A in which the number of inventions per technical field is concentrated in the IPC sub-class of "H01J".
- PDI patent diversification index
- the number of inventions per enterprise and per technical field and the total thereof are used to calculate the number-of-inventions share per enterprise and per technical field.
- a power index is use to power this number-of-inventions share per enterprise and per technical field, this is subtracted from 1 and then multiplied by 100 in order to calculate and display the patent diversification index (PDI) showing the degree of concentration or diversification of the technical development field of a predetermined enterprise.
- PDI patent diversification index
- the user will be able to easily know the degree of concentration or diversification of the technical development field of a predetermined enterprise. And, by comparing this with the patent diversification index of other enterprises calculated with the same calculation method, it will be possible to compare the degree of concentration or diversification of a predetermined technical development field.
- PDI patent diversification index
- FIG. 6 shows the result of operation based on the number of inventions for 1 year, and the operation of the moving average is not conducted. And, since a normally employed method may be used for the calculation of such moving average, the explanation thereof is omitted.
- Calculation 2 shown in FIG. 7 is a calculation example of calculating the patent diversification index (PDI) of Enterprise B in which the number of inventions per technical field is evenly diversified.
- PDI patent diversification index
- FIG. 8 is a diagram showing a classification example of diversification based on the value of the patent diversification index (PDI).
- PDI patent diversification index
- the patent diversification index (PDI), as described above, is used for showing the degree of concentration or diversification of the technical development field of a predetermined enterprise. Therefore, instead of simply displaying a numerical value as the patent diversification index, by converting this into evaluation information according to the numerical value of the patent diversification index and displaying the category thereof, it will be possible to notify the user of the degree of concentration or diversification of the technical development field in an easy-to-understand manner.
- the degree of concentration or diversification of the technical development field is categorized as a "super generalized type" when the patent diversification index (PDI) value is 96 or more, categorized as a "generalized type” when the value is 90 or more and less than 96, categorized as a "balanced type” when the value is 76 or more and less than 90, categorized as a "concentrated type” when the value is 50 or more and less than 76, and categorized as a "super concentrated type” when the value is less than 50.
- PDI patent diversification index
- the categories shown in FIG. 8 are mere examples, and when the perspective of the power index (kb value) or patent diversification index is changed, categories that are different from the categories shown in FIG. 8 may be used. However, when calculating the patent diversification index based on the number of claims and IPC sub-classes, the classifications shown in FIG. 8 are considered to be suitable in consideration of the calculation result of all enterprises.
- the calculation of the SEI score per technical field and patent competitive position index representing the degree of technical development competitive position viewed from the number of inventions For this calculation, the ratio of the number of inventions per enterprise and per technical field (number of claims per enterprise and per technical field) of the respective enterprises among the total number of inventions per technical field (total number of claims per technical field) of each year (each period) is used.
- the patent competitive position index is referred to as a PCPI (Patent Competitive Position Index) below, and is calculated in the following order together with the SEI score per technical field.
- PCPI Patent Competitive Position Index
- the patent competitive position index (PCPI) is one form of index contained in the enterprise competitive position index.
- FIG. 11 shows the calculation example of the number-of-inventions share per technical field and per enterprise in the technical field of (H01L) calculated with Formula 11.
- FIG. 12 shows the calculation example of the number-of-inventions share per technical field and per enterprise in the technical field of (G06F).
- k a ⁇ ( number of inventions per enterprise and per technical field )
- ⁇ n 1 N ( number of inventions per technical field and per n enterprise ( enterprise ) ) ⁇ k a provided,
- FIG. 11 shows the calculation example of the SEI index per technical field and per enterprise in the technical field of (H01L) calculated with Formula 12. Further, FIG. 12 shows the calculation example of the SEI index per technical field and per enterprise in the technical field of (G06F).
- PCPIA patent competitive position index A
- Patent competitive position index B SEI score per technical field
- PCPIB patent competitive position index B
- the degree of technical development competitive position viewed from the patent applications can be measured by using the competitive state (SEI score per technical field representing the oligopoly state or competitive state) of the respective IPC sub-classes sought from the SEI index per technical field (enterprise) and using the per technical field and per-enterprise share of the respective enterprises.
- the respective enterprises are assessing the technology to be personally developed and filed with a watchful eye on the filing trend of other enterprises.
- enterprises holding a large share of inventions are able to inhibit the entry of other enterprises. Nevertheless, even if a certain enterprises is ranked 1st in the share of a certain IPC sub-class, in a severe technical development competitive state, the position of such enterprise is not firmly established.
- the SEI score per technical field of the respective participating enterprises is calculated in order to view the marketability.
- the SEI score per technical field is sought based on the total by powering the shares of the respective enterprises with ka, and the closer such numerical value is to 1.00, it could be said that such IPC sub-class is in an oligopolistic state.
- the number-of-claims share per technical field and per enterprise (number-of-inventions share per technical field and per enterprise) of an enterprise classified by IPC sub-classes is calculated and the value thereof is considered to be the positioning of that enterprise.
- the number-of-claims share per technical field and per enterprise (number-of-inventions share per technical field and per enterprise) of the respective enterprises according to the technical classification of the IPC sub-classes, comparison in the same technical classification will be possible without being influenced by the scope of the number of claims filed per enterprise and per technical field in the business category.
- the secondary classification may be jointly used to tabulate 0.5 cases of primary classification and 0.5 cases of secondary classification, or, as a different weighting in the primary classification and secondary classification, for instance, 0.7 cases of primary classification and 0.3 cases of secondary classification may be calculated.
- FIG. 11 shows the calculation example of the SEI score per technical field and per enterprise in the technical field of (H01L) calculated with Formula 14. Further, FIG. 12 shows the calculation example of the SEI score per technical field and per enterprise in the technical field of (G06F).
- PCPI SEI score per technical field and per enterprise index
- Patent competitive position index D (PCPID) to be used upon calculating the patent competitive position index (PCPI) is defined as follows.
- FIG. 13 shows the calculation example of the patent competitive position index D (PCPID) calculated with Formula 15.
- PCPI patent competitive position index
- FIG. 14 is a diagram showing a calculation example of the excess growth rate calculated based on Formula 16.
- the patent competitive position index is one form of an index contained in the enterprise competitive position index.
- the patent competitive position index is an index that measured the degree of technical development competitive position viewed from inventions such as patent applications by using the competitive state (oligopolistic state or competitive state) of the respective IPC sub-classes sought from the SEI index per technical field and per enterprise, per-technical field and per-enterprise share of the respective enterprises, and excess growth rate (rate of increase in the number of claims of the respective enterprises).
- the patent competitive position index upon calculating the patent competitive position index, it is possible to judge the competitive position by adding the degree of growth or diminution of enterprises as a result of weighting the excess growth rate. As described above, by weighting the excess growth rate, the higher the rate of increase of the number of claims filed, it is possible to largely calculate the value of the patent competitive position index. Therefore, the larger the value of the patent competitive position index is calculated, the comprehensive strength of the technical development strength viewed from the inventions filed by the relevant enterprise will be strong.
- FIG. 11 and FIG. 12 show examples of calculating the number-of-inventions share per technical field and per enterprise, SEI index per technical field and per enterprise (patent competitive position index A), patent competitive position index B (PCPIB) and SEI score per technical field and per enterprise (emphasized PCPI or oligopoly-emphasized score per technical field) regarding the respective enterprises in a predetermined technical field.
- SEI index per technical field and per enterprise pattern competitive position index A
- PCPIB patent competitive position index B
- SEI score per technical field and per enterprise emphasized PCPI or oligopoly-emphasized score per technical field
- FIG. 13 is a diagram where the values of the SEI score per technical field and per enterprise (emphasized PCPI or oligopoly-emphasized score per technical field) of each enterprise calculated based on the respective technical fields are collectively indicated in a chart.
- PCPID patent competitive position index D
- FIG. 14 is a chart showing the rate of increase in the number of claims filed by the respective enterprises (one form of average rate of increase in the number of inventions of the most recent 3 years), average value of the rate of increase in the number of claims of all enterprises (average rate of increase in the number of inventions of all enterprises in the most recent 3 years, and the excess growth rate calculated based on Formula 16.
- the average rate of increase in the number of claims filed by Enterprise A in the most recent 3 years is 5.0%, and the average rate of increase in the number of claims filed by all enterprises in the most recent 3 years is 2.3%.
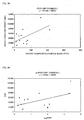
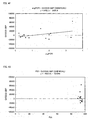
- FIG. 15 is a chart showing the patent competitive position index D (PCPID), and the patent competitive position index (PCPI) calculated based on the excess growth rate.
- FIG. 16 shows the distribution of the calculation result when representing the patent competitive position index (PCPI) value on the horizontal axis with a logarithm, and representing the number of enterprises on the vertical axis.
- PCPI patent competitive position index
- the distribution of the patent competitive position index (PCPI) will be of a distribution status that is similar to normal distribution.
- the positioning of the respective enterprises in the distribution among all enterprises is ranked according to the patent competitive position index (PCPI) value sought above.
- FIG. 16 showed an example of representing the patent competitive position index (PCPI) on the horizontal axis with a logarithm
- the present invention is not limited to such display of logarithm, and an ordinary distribution may be employed.
- the patent competitive position index (PCPI) the patent competitive position score, standardized patent competitive position score, enterprise competitive position index, standardized enterprise competitive position index and standardized patent competitive position index (avgPCPI) may also be represented on the horizontal axis with a logarithm, and all enterprises may be represented on the vertical axis.
- FIG. 17 is a diagram showing the category example of the ranking according to the patent competitive position index (PCPI).
- PCPI patent competitive position index
- the competitive position of a predetermined enterprise relating to inventions is categorized in 5 rankings according to the nature of the normal distribution of the competitive position in accordance with the average value X and standard deviation a of the patent competitive position index (PCPI).
- FIG. 17 showed an example of ranking the patent competitive position index (PCPI), as with the patent competitive position index (PCPI), the patent competitive position score, standardized patent competitive position score, enterprise competitive position index, standardized enterprise competitive position index and standardized patent competitive position index (avgPCPI) can also be ranked.
- FIG. 18 is a chart showing relation of the star ranking representing the competitive position category of the predetermined enterprise relating to inventions with the number of stars, and the type category name representing the competitive position relating to inventions as the type of enterprise.
- the competitive position relating to inventions can be represented in an easy-to-view manner. Further, the competitive position relating to inventions among a plurality of enterprises can be notified, in an easy-to-understand manner, to a user who is not too familiar with the number of patent applications or number of claims of a patent application, or the classification of IPC sub-classes.
- PCPI patent competitive position index
- the scope of categorization is not limited to (X + ⁇ ) using the standard deviation, and may be categorized based on the distribution upon utilizing the accumulation of experience of the categorizing person.
- FIG. 18 showed an example where star ranking categorization and type categorization are performed regarding the patent competitive position index (PCPI), as with the patent competitive position index (PCPI), the patent competitive position score, standardized patent competitive position score, enterprise competitive position index, standardized enterprise competitive position index and standardized patent competitive position index (avgPCPI) can also be subject to the star ranking categorization and type categorization.
- PCPI patent competitive position index
- avgPCPI standardized patent competitive position score
- avgPCPI standardized patent competitive position index
- PCPI patent competitive position index
- the standardized patent competitive position index (avgPCPI), which is an index showing the degree of competitive position per IPC sub-class (per technical field), is explained.
- This standardized patent competitive position index (avgPCPI) is calculated by dividing the patent competitive position index (PCPI) by the number of sub-classes (number of technical fields) in which the respective enterprises have filed applications.
- the standardized patent competitive position index (avgPCPI) is one form of index contained in the standardized enterprise competitive position index.
- the standardized patent competitive position index is referred to as the avgPCPI (average Patent Competitive Position Index) below.
- the patent competitive position index is the total of the competitive position in a technical field (e.g., IPC sub-class) in which the respective enterprises have filed applications.
- a technical field e.g., IPC sub-class
- the numerical value of the patent competitive position index (PCPI) will increase. Therefore, this tends to work favorably for major enterprises with a long history.
- the calculated patent competitive position index is divided by the number of technical fields (e.g., number of IPC sub-class classifications) in which the respective enterprises have filed applications for standardization, and the standardized patent competitive position index (avgPCPI) thereby enables the judgment of the competitive position per technical field (per IPC sub-class).
- the secondary classification of the IPC sub-classes may be jointly used with the primary classification.
- 0.5 cases of primary classification and 0.5 cases of secondary classification may be tabulated equally, or, as a different weighting in the primary classification and secondary classification of IPC, for instance, 0.7 cases of primary classification and 0.3 cases of secondary classification may be used to calculate the number of IPC sub-classes.
- Standardized patent competitive position index ( avgPCPI ) ( patent competitive position index ( PCPI ) ) / ( number of technical fields )
- Number of technical fields Number of IPC sub ⁇ classes in a 3 ⁇ year average
- the standardized patent competitive position index (avgPCPI) may be calculated with the IPC sub-classes for that year only or an average of several years.
- a logarithm axis was adopted here.
- the present invention is not limited to a logarithm, and the distribution may be calculated with the standardized patent competitive position index (avgPCPI) axis as a normal linear axis.
- FIG. 19 and FIG. 20 are display examples collectively displaying the patent diversification index (PDI), patent competitive position index (PCPI) and standardized patent competitive position index (avgPCPI) of Enterprise A and Enterprise B.
- PDI patent diversification index
- PCPI patent competitive position index
- avgPCPI standardized patent competitive position index
- the patent diversification index (PDI) category is disposed on the horizontal axis of the chart
- the patent competitive position index (PCPI) category or standardized patent competitive position index (avgPCPI) category is disposed on the vertical axis.
- the patent diversification index (PDI) category on the horizontal axis is classified as a "generalized type”
- the patent competitive position index (PCPI) category on the vertical axis is classified as a "Player” (position marked with the black circle in FIG. 20).
- the standardized patent competitive position index (avgPCPI) is reduced to "Byplayer” (position marked with a star in FIG. 20).
- the ranking and category in a chart format by representing the one axis as the patent competitive position index (PCPI) and the other axis as the standardized patent competitive position index (avgPCPI).
- PCPI patent competitive position index
- avgPCPI standardized patent competitive position index
- FIG. 21 is a chart showing the patent competitive position index (PCPI) and ranking, standardized patent competitive position index (avgPCPI) and ranking, and type of category based on the diversification index (PDI) of each enterprise in a predetermined technical field represented in descending order from the highest numerical value of the patent competitive position index (PCPI).
- PCPI patent competitive position index
- avgPCPI standardized patent competitive position index
- PDI diversification index
- FIG. 22 is a chart showing the same contents as FIG. 21 in descending order from the highest numerical value of the standardized patent competitive position index (avgPCPI).
- the enterprises are listed in the order of the numerical value of the patent competitive position index (PCPI), and in FIG. 22, the enterprises are listed in the order of the standardized patent competitive position index (avgPCPI).
- PCPI patent competitive position index
- avgPCPI standardized patent competitive position index
- Enterprise MI being able to file patent applications in the technical fields of numerous IPC sub-classes means that the enterprise has that much accumulation of technology and knowledge. Further, Enterprise MI is also ranked 9th in the numerical value of the standardized patent competitive position index (avgPCPI), and most likely also has characteristic technology.
- avgPCPI patent competitive position index
- Enterprise MI is an enterprise with a long tradition, the numerous years of business operation created the accumulation of technology, and has a dominant technical patent competitive position.
- Enterprise TS is classified as a "concentrated type" in the category based on patent diversification index (PDI), ranked 2nd in the patent competitive position index (PCPI) ranking, and ranked 1st in the standardized patent competitive position index (avgPCPI) ranking.
- PDI patent diversification index
- PCPI patent competitive position index
- avgPCPI standardized patent competitive position index
- FIG. 23 is a flowchart upon operating and outputting the index relating to the technical development strength such as the diversification index (PDI), patent competitive position index (PCPI), and standardized patent competitive position index (avgPCPI) when determining the enterprise value.
- PDI diversification index
- PCPI patent competitive position index
- avgPCPI standardized patent competitive position index
- the information processing means 380 receives the input of a display command of a screen for selecting an enterprise from a user via the input means 370 such as a keyboard and the bus 399, reads the display data upon selecting the enterprise from the recording means 384 based on such command, converts this into a display image signal, and outputs such signal to the display interface 373.
- the display interface 373 that acquired the display data from the information processing means 380 converts and outputs the display data corresponding to the display means 372.
- the display means 372 displays a screen based on the display data input from the display interface 373 and notifies the user.
- the user while viewing the company selection screen displayed on the display means 372, inputs the information for specifying one or more enterprises to be researched via the input means 370.
- the information to be input may be the enterprise name, enterprise code, or an enterprise may be selected from the enterprise selection screen.
- Information for specifying the enterprise input by the user via the input means 370 is read by the information processing means 380 via the bus 399.
- the information processing means 380 When appropriate enterprise specifying information is input to the information processing means 380, the information processing means 380 reads the display data of the display menu for selecting the type of index to evaluate the enterprise value from the recording means 384, converts this into a display image signal, outputs such signal to the display interface 373, and, for example, displays the enterprise value evaluation menu shown in FIG. 24 on the display means 372.
- the user selects a desired index from the selection menu of "business, profit, market value” or "R&D, patent", or "patent portfolio”.
- the user is selecting the item of "(PAP) patent application portfolio analysis” belonging to the field of "patent portfolio”, and selecting, from a pulldown menu, the "(PDI) patent diversification index” which is one index showing the degree of concentration or diversification of the technical development field of a specified index as the type of index to be calculated.
- the mark of the selected item is changed from a white square to a black square.
- the information processing means 380 sets a flag for deciding the operation formula for calculating the index, displays a selection mark at the portion of the index selected by the user, and notifies the user of the set information.
- the information processing means 380 When the user wishes to calculate the index based on the number of claims of a patent application, the user selects "(PA) patent application index" from the selection menu of "R&D patent". Then, the information processing means 380 outputs a command for displaying on the display 372 the pulldown menu indicating the items relating to the "(PA) patent application index” shown in FIG. 26. The user selects a desired parameter of the number of inventions from the pulldown menu displayed on the display means 372. In the example shown in FIG. 26, a case is shown where the "number of claims filed", which is an item required for the target of calculation, is selected.
- the information processing means 380 sets a flag for deciding the parameter of the index to be calculated, displays a selection mark at the portion of the index selected by the user, and notifies the user of the set information.
- the user When the user wishes to conduct a research upon mutually associating the indexes of inventions and the business, profit or market value information of a predetermined enterprise, the user selects "(C) profit related index” from the selection menu of "business, profit, market value”. Then, the information processing means 380 outputs a command for displaying on the display means 372 the pulldown menu indicating the items relating to the "(C) profit related index” shown in FIG. 27. The user selects a desired profit index from the pulldown menu displayed on the display means 372. In the example shown in FIG. 28, a case where the "GBP" (gross operating profit) is selected is shown.
- GBP gross operating profit
- the information processing means 380 sets a flag for deciding the operation formula for calculating the index, displays a selection mark at the portion of the index selected by the user, and notifies the user of the set information.
- the information processing means 380 reads the display data of the display screen for setting the input conditions upon evaluating the enterprise value from the recording means 384, converts this into a display image signal, and outputs such signal to the display interface 373, and, for example, displays on the display means 372 the enterprise value evaluation input condition setting screen shown in FIG. 29.
- the user while viewing the enterprise value evaluation input condition setting screen displayed on the display means 372, selects and inputs the desired conditions for evaluating the enterprise value.
- the user selects the conditions of "target document” and "reading of data” upon calculating the index for judging the enterprise value.
- the user is selecting "unexamined patent applications” and “registered patents” as the conditions of the "target document”.
- the user is selecting "Internal DB1" as the condition of "reading of data”.
- the information processing means 380 sets a flag of the items input by the user regarding the conditions of the "target document” and “reading of data”, displays a selection mark at the portion of the index selected by the user, and notifies the user of the set information.
- the information processing means 380 When the user selects the "set” button and the input regarding the conditions of the "target document” and “reading of data” is completed, the information processing means 380 subsequently reads the display data of the enterprise value evaluation input condition setting screen show in FIG. 30 from the recording means 384, and outputs a command for displaying this on the display means 372 via the display interface 373.
- the user while viewing the enterprise value evaluation input condition setting screen displayed on the display means 372, selects a desired enterprise to be evaluated. In the example shown in FIG. 30, the user is selecting "electrical equipment industry” among the “industries” to become the large classification among the target of enterprise evaluation.
- the user may also select “enterprise” as the detailed classification of individual enterprises among the target of enterprise value evaluation, and designate input conditions such as the "enterprise name”, “enterprise code”, “applicant code” and so on.
- entity name the detailed classification of individual enterprises among the target of enterprise value evaluation
- appliance code the basic classification of individual enterprises among the target of enterprise value evaluation
- the user while viewing this screen, selects the "target” on the right side and further selects the enterprise, such user will input the enterprise name or enterprise code and applicant code.
- the information processing means 380 sets a flag of the enterprise to become the "target" input by the user, displays a selection mark at the portion of the index selected by the user, displays information such as the set enterprise name, enterprise code and application code on the display means 372, and notifies the user of the set information.
- the information processing means 380 subsequently reads the display data of the enterprise value evaluation output condition setting screen shown in FIG. 31 from the recording means 384, and outputs a command for displaying this on the display means 372 via the display interface 373.
- the user while viewing the enterprise value evaluation output condition setting screen displayed on the display means 372, selects a desired display mode.
- “single map” is selected as the information relating to the "map position”
- the patent diversification index "PDI” is selected as the "output data”
- “upper 20” is selected as the volume of information to be output and displayed.
- processing to the performed by the information processing means 380 proceeds to the processing of S503 "select combination".
- the processing to be performed by the information processing means 380 proceeds to the processing of S604 "acquire management-finance information"
- the processing to be performed by the information processing means 380 proceeds to the processing of S504 "acquire patent information”.
- the information processing means 380 does not select the combination processing and implements only the processing of S504 onward.
- the information processing means 380 acquires the patent publications of the respective enterprises and information relating thereto from the database 20 based on the operation processing of the patent portfolio and information relating to the designated enterprise, and performs processing for extracting the IPC sub-classes, number of patent applications, number of claims in a patent application and other information required for the operation.
- the processing to be performed by the information processing means 380 proceeds to the processing of subsequent S505 "calculate patent information".
- the information processing means 380 performs processing for calculating the desired index of the user based on the patent information acquired at S504, the operation formula related to the portfolio input by the user, and the calculating formula to which a flag has been set based on the enterprise name or the like.
- FIG. 32 and FIG. 33 are charts illustrating examples of indexes of "business, profit, market value" calculated by the enterprise evaluation device and the calculating formula thereof.
- index groups "(A) investment”, “(B) management-finance analysis”, “(C) profit related”, “(D) excess profit analysis”, “(M) market value related”, and “(PE) patent profitability are provided, and the names and outline of the respective indexes and the calculating formula thereof are indicated in each of these groups.
- FIG. 34 and FIG. 35 are charts illustrating examples of indexes of "R&D patent" calculated by the enterprise evaluation device and the calculating formula thereof.
- index groups "(R) research and development related”, “(PA) patent application related”, “(PB) examination request related”, “(PT) patent acquisition (registration) related”, “(PP) patent productivity” and “(PS) patent stock related” are provided, and the names and outline of the respective indexes and the calculating formula thereof are indicated in each of these groups.
- FIG. 36 is a chart illustrating an example of an index of "patent portfolio" calculated by the enterprise evaluation device and the calculating formula thereof.
- index groups "(PA, P) patent portfolio analysis”, “(PAK) characteristic keywords”, and “(PSI) patent similarity ratio analysis” are provided, and the names and outline of the respective indexes and the calculating formula thereof are indicated in each of these groups.
- the information processing means 380 classifies; the predetermined enterprise into a predetermined category based on the operation result of the index relating to patents, and further performs operation processing for predetermined ranking or discrimination, and then organizes the various operation results.
- the information processing means 380 acquires various types of information from the database 20 such as the information showing the size of the enterprise, finance information of the enterprise, and combined information of the enterprise, and operates the management-finance information at the subsequent S605 "calculate management-finance information".
- the information processing means 380 creates a chart or graph by applying the operation result of the patent information calculated at S505, various operation results organized at S506, operation result of the management-finance information operated at S605, or operation result of the various types of management-finance information organized at S606 into a display format according to the index or the operation result thereof, and coverts this into display data.
- the information processing means 380 outputs the display data of the chart or graph created at S507 to the display interface 373, and displays this on the display means 372.
- the user perusing the chart or graph display at S508, the user will be able to easily and accurately judge, with a unique index, the enterprise value based on the diversification of inventions in the respective enterprises, competitive position relating to inventions, or the relationship between such unique information concerning inventions and the management-finance information.
- the information processing means 380 may perform a more detailed ranking in order to judge the enterprise value.
- the information processing means 380 will read the predetermined threshold or the like at S509 "determine enterprise value" to judge the enterprise value, thereafter output the numerical value or graph thereof, and then end the calculation processing of the various indexes.
- FIG. 37 is a diagram illustrating the judgment method of a graph representing the patent competitive position index (PCPI), which is one form of patent information, on the horizontal axis, and representing the gross operating profit, which is one form of management-finance information, on the vertical axis.
- PCPI patent competitive position index
- PCPI patent competitive position index
- avgPCPI standardized patent competitive position index
- PDI patent diversification index
- GFP gross operating profit
- the cross lines running vertically and horizontally in the center of the graph are lines showing the average value of the vertical axis and horizontal axis.
- Enterprises belonging to the group at the upper right portion of FIG. 37 have a high gross operating profit and show a large value as the patent competitive position index (PCPI), and it is therefore possible to judge that these enterprises have favorable profitability and strong patent competitive position.
- PCPI patent competitive position index
- PCPI patent competitive position index
- FIG. 38 is a diagram showing the relationship between the patent competitive position index (PCPI) and gross operating profit (GBP) of an enterprise belonging to a chemical division.
- PCPI patent competitive position index
- GBP gross operating profit
- an average value line is drawn using the least square method regarding the position of the respective enterprises in the chemical industry. It is possible to judge that enterprises located at the upper right of the straight line of this average value have a strong patent competitive position in relatively various technical fields, and also have business profitability.
- FIG. 39 is a diagram showing the relationship between the standardized patent competitive position index (avgPCPI) and gross operating profit (GBP) of an enterprise belonging to a chemical division.
- an average value line is drawn using the least square method regarding the position of the respective enterprises in the chemical industry. It is possible to judge that enterprises located at the upper right of the straight line of this average value have a strong patent competitive position in a particular technical field, and also have business profitability.
- FIG. 40 is a diagram showing the relationship between the patent diversification index (PDI) and gross operating profit (GBP) of all enterprises.
- the excess gross operating profit may also be employed.
- Excess GBP sales volume ⁇ ( sales volume GPB ratio ⁇ sales volume GPB ratio of industry sector average )
- Excess gross operating profit is a numerical value showing the portion exceeding the business category average among the business income obtained through manufacture and sales activities by a certain enterprise. By using this excess gross operating profit (excess GBP), it is possible to appropriately conduct a comparison with other companies in the same business category, and to easily judge whether the enterprise to be researched is superior in comparison to the business category average.
- excess gross operating profit (excess GBP) and patent competitive position index (PCPI), standardized patent competitive position index (avgPCPI) or patent diversification index (PDI) may be combined and displayed on a single graph.
- PCPI patent competitive position index
- avgPCPI standardized patent competitive position index
- PDI patent diversification index
- FIG. 41 is a diagram showing the relationship of the patent competitive position index (PCPI) and excess GBP of the chemical industry.
- FIG. 42 is a diagram showing the relationship of the standardized patent competitive position index (avgPCPI) and excess GBP of the chemical industry.
- FIG. 43 is a diagram showing the relationship between the patent diversification index (PDI) and excess GBP of the respective enterprises in the chemical industry.
- a large number of enterprises belong to a generalized type (90 or more, less than 96) in the chemical industry, there are only 4 enterprises positioned above the average value line, and only 1 enterprise is showing strong business profitability.
- the characteristics of the industry, whether the enterprise to be researched has strong profitability, or whether the enterprise to be researched as weak profitability will become evident, and this will be useful upon judging the enterprise value.
- the enterprise evaluation device includes:
- the enterprise evaluation device of the present invention includes:
- the enterprise evaluation device of the present invention includes:
- the enterprise evaluation device of the present invention includes:
- the enterprise evaluation device of the present invention includes:
- the enterprise evaluation device of the present invention includes:
- the enterprise evaluation device of the present invention includes:
- the enterprise evaluation device of the present invention includes:
- the enterprise evaluation device of the present invention includes:
- the enterprise evaluation device of the present invention includes:
- the enterprise evaluation device of the present invention includes:
- the enterprise evaluation device of the present invention includes:
- the enterprise evaluation device of the present invention includes:
- the enterprise evaluation device of the present invention includes:
- the enterprise evaluation device of the present invention includes:
- the enterprise evaluation device of the present invention classifies the technical field by IPC sections, IPC classes, IPC sub-classes, IPC main groups, IPC sub-groups, F terms, FI, facets or keywords contained in the technical documents. Therefore, it is possible to calculate the oligopolistic state or diversified state of inventions and competitive position by using published patent documents and present the same to a user.
- the enterprise evaluation device of the present invention uses, as the technical documents, publications of registered patents, unexamined patent applications, registered utility models, unexamined utility model applications, published translations of PCT international applications, domestic re-publications of PCT international applications, foreign publications, published appeal and trial decisions, transitional information or journals of technical disclosure. Therefore, it is possible to calculate the oligopolistic state or diversified state of inventions and competitive position by using published patent documents and present the same to a user.
- the enterprise evaluation device of the present invention uses, as the number of inventions among the total number of inventions per technical field or number of inventions per enterprise and per technical field, the number of patent or utility model applications, number of claims filed, number of registrations, number of claims registered, number of examination requests, number of claims requested for examination, number of decisions of registration, number of claims decided to be registered, number of decisions of rejection, number of claims decided to be rejected, number of demands for trial, number of claims demanded for trial or the ratios thereof. Therefore, it is possible to calculate the oligopolistic state or diversified state of inventions and competitive position by using published patent documents and present the same to a user.
- the enterprise evaluation device of the present invention includes:
- the enterprise evaluation device of the present invention includes:
- the enterprise evaluation device of the present invention includes:
- the enterprise evaluation device of the present invention includes:
- the enterprise evaluation device of the present invention uses, as the management-finance information, the sales volume, sales profit, operating profit, sales profit ratio, operating profit ratio, total market value to total assets ratio, total market value to stockholders' equity ratio, total market value to sales volume ratio, total market value to gross operating profit ratio, total market value to operating profit ratio, gross operating profit to total assets ratio, gross operating profit to stockholders' equity ratio, operating profit to total assets ratio, operating profit to stockholders' equity ratio, stockholders' equity ratio, balance of total market value and stockholders' equity, R&D cost, R&D cost to sales volume ratio, R&D cost to gross operating profit ratio, gross operating profit ratio, gross operating profit or other financial information of the enterprise. Therefore, it is possible to accurately judge the condition of an enterprise by combining the technical strength and management-finance information relating to the invention.
Landscapes
- Business, Economics & Management (AREA)
- Engineering & Computer Science (AREA)
- Human Resources & Organizations (AREA)
- Entrepreneurship & Innovation (AREA)
- Strategic Management (AREA)
- Tourism & Hospitality (AREA)
- Economics (AREA)
- General Business, Economics & Management (AREA)
- Operations Research (AREA)
- Marketing (AREA)
- Physics & Mathematics (AREA)
- General Physics & Mathematics (AREA)
- Theoretical Computer Science (AREA)
- Quality & Reliability (AREA)
- Data Mining & Analysis (AREA)
- Technology Law (AREA)
- Educational Administration (AREA)
- Game Theory and Decision Science (AREA)
- Development Economics (AREA)
- Health & Medical Sciences (AREA)
- General Health & Medical Sciences (AREA)
- Primary Health Care (AREA)
- Management, Administration, Business Operations System, And Electronic Commerce (AREA)
- Information Retrieval, Db Structures And Fs Structures Therefor (AREA)
- Financial Or Insurance-Related Operations Such As Payment And Settlement (AREA)
Applications Claiming Priority (3)
| Application Number | Priority Date | Filing Date | Title |
|---|---|---|---|
| JP2003396346 | 2003-10-23 | ||
| JP2003423855 | 2003-12-19 | ||
| PCT/JP2004/004099 WO2005050511A1 (ja) | 2003-10-23 | 2004-03-24 | 企業評価装置並びに企業評価プログラム |
Publications (2)
| Publication Number | Publication Date |
|---|---|
| EP1686515A1 true EP1686515A1 (de) | 2006-08-02 |
| EP1686515A4 EP1686515A4 (de) | 2006-11-22 |
Family
ID=34622211
Family Applications (1)
| Application Number | Title | Priority Date | Filing Date |
|---|---|---|---|
| EP04722964A Withdrawn EP1686515A4 (de) | 2003-10-23 | 2004-03-24 | Unternehmens-bewertungseinrichtung und unternehmens-bewertungsprogramm |
Country Status (9)
| Country | Link |
|---|---|
| US (1) | US20070136271A1 (de) |
| EP (1) | EP1686515A4 (de) |
| KR (1) | KR20060096432A (de) |
| AU (1) | AU2004292080A1 (de) |
| CA (1) | CA2543604A1 (de) |
| IL (1) | IL175116A0 (de) |
| IS (1) | IS8453A (de) |
| NO (1) | NO20062329L (de) |
| WO (1) | WO2005050511A1 (de) |
Families Citing this family (26)
| Publication number | Priority date | Publication date | Assignee | Title |
|---|---|---|---|---|
| EP1783678A4 (de) * | 2004-07-05 | 2009-04-29 | Intellectual Property Bank | Einrichtung zum spezifizieren des firmenevaluierungs-beitragsfaktors und/oder index, spezifizierungsprogramm und spezifizierungsverfahren |
| WO2006128183A2 (en) | 2005-05-27 | 2006-11-30 | Schwegman, Lundberg, Woessner & Kluth, P.A. | Method and apparatus for cross-referencing important ip relationships |
| US20090307148A1 (en) * | 2006-03-13 | 2009-12-10 | Cardoza Keith M | Method And System For Generating An Index Of Securities |
| JP5165857B2 (ja) * | 2006-05-19 | 2013-03-21 | 株式会社東芝 | データ処理装置、データ処理方法およびデータ処理プログラム |
| US8311860B2 (en) * | 2006-06-07 | 2012-11-13 | Accenture Global Services Limited | Industry scenario mapping tool |
| CA2564451A1 (en) * | 2006-10-17 | 2008-04-17 | Ibm Canada Limited - Ibm Canada Limitee | Determining an executable growth strategy |
| US8024215B2 (en) * | 2006-10-25 | 2011-09-20 | Csm Worldwide, Inc. | Managing sales and/or competition within an industry |
| WO2008119083A1 (en) * | 2007-03-28 | 2008-10-02 | Cheryl Milone | Requesting prior art from the public in exchange for a reward |
| CN101436191A (zh) * | 2007-11-13 | 2009-05-20 | 日电(中国)有限公司 | 用于计算对象之间竞争性度量的方法与系统 |
| US8041696B2 (en) * | 2008-06-13 | 2011-10-18 | International Business Machines Corporation | Idea tracking and management |
| JP5326387B2 (ja) * | 2008-07-10 | 2013-10-30 | 富士通株式会社 | 経過情報出力方法および経過情報出力プログラム |
| US20100131513A1 (en) | 2008-10-23 | 2010-05-27 | Lundberg Steven W | Patent mapping |
| US9904726B2 (en) | 2011-05-04 | 2018-02-27 | Black Hills IP Holdings, LLC. | Apparatus and method for automated and assisted patent claim mapping and expense planning |
| KR101315177B1 (ko) * | 2011-05-09 | 2013-10-07 | 한국생산기술연구원 | 융합 지수 요소 점수 산출을 위한 특허 정보 처리 방법 |
| US10242066B2 (en) | 2011-10-03 | 2019-03-26 | Black Hills Ip Holdings, Llc | Systems, methods and user interfaces in a patent management system |
| US9607274B2 (en) * | 2012-03-23 | 2017-03-28 | Chairman's View, Inc. | Enterprise value assessment tool |
| KR101389503B1 (ko) * | 2013-11-01 | 2014-04-28 | 한국과학기술정보연구원 | 기술 매치메이킹 장치, 방법 및 시스템 |
| KR101960960B1 (ko) * | 2017-09-28 | 2019-03-22 | (주)망고플레이트 | Hhi를 이용한 온라인 콘텐츠의 허위 평가 정보 적발 장치 및 방법 |
| WO2019103183A1 (ko) | 2017-11-23 | 2019-05-31 | 지속가능발전소 주식회사 | Esg 기반의 기업 평가 수행 장치 및 이의 작동 방법 |
| KR102105319B1 (ko) | 2019-09-20 | 2020-04-28 | 지속가능발전소 주식회사 | Esg 기반의 기업 평가 수행 장치 및 이의 작동 방법 |
| RU2736957C1 (ru) * | 2020-06-17 | 2020-11-23 | Публичное акционерное общество «Аэрофлот - российские авиалинии» | Система контроля за показателями деятельности предприятия |
| JP7181261B2 (ja) * | 2020-07-30 | 2022-11-30 | 株式会社ユーザベース | 情報処理装置、方法、プログラム |
| JP2023111147A (ja) * | 2022-01-31 | 2023-08-10 | 日本電気株式会社 | 情報提示装置、情報提示方法及びプログラム |
| US20250322458A1 (en) * | 2022-07-21 | 2025-10-16 | Kazuko SHOBAYASHI | Information processing device, information processing method, and computer program |
| KR102505521B1 (ko) | 2022-09-22 | 2023-03-02 | (주)퀀티파이드이에스지 | 기업 esg 평가 시스템 |
| KR102641853B1 (ko) | 2023-06-19 | 2024-03-04 | 신용보증기금 | 환경, 사회, 지배구조 평가시스템 |
Family Cites Families (2)
| Publication number | Priority date | Publication date | Assignee | Title |
|---|---|---|---|---|
| JP2000011078A (ja) * | 1998-06-25 | 2000-01-14 | Gijutsu Transfer Service:Kk | 電子データ集計方法およびデータのグラフ化方法並びに電子データ集計とデータのグラフ化のプログラムを記録したコンピュータ読取可能な記録媒体 |
| JP2002092228A (ja) * | 2000-09-13 | 2002-03-29 | Patolis Corp | 特許技術力評価方法及び同システム |
-
2004
- 2004-03-24 AU AU2004292080A patent/AU2004292080A1/en not_active Abandoned
- 2004-03-24 KR KR1020067007432A patent/KR20060096432A/ko not_active Ceased
- 2004-03-24 US US10/576,584 patent/US20070136271A1/en not_active Abandoned
- 2004-03-24 WO PCT/JP2004/004099 patent/WO2005050511A1/ja not_active Ceased
- 2004-03-24 CA CA002543604A patent/CA2543604A1/en not_active Abandoned
- 2004-03-24 EP EP04722964A patent/EP1686515A4/de not_active Withdrawn
-
2006
- 2006-04-23 IL IL175116A patent/IL175116A0/en unknown
- 2006-05-11 IS IS8453A patent/IS8453A/is unknown
- 2006-05-22 NO NO20062329A patent/NO20062329L/no not_active Application Discontinuation
Non-Patent Citations (2)
| Title |
|---|
| No Search * |
| See also references of WO2005050511A1 * |
Also Published As
| Publication number | Publication date |
|---|---|
| US20070136271A1 (en) | 2007-06-14 |
| KR20060096432A (ko) | 2006-09-11 |
| IL175116A0 (en) | 2006-10-05 |
| WO2005050511A1 (ja) | 2005-06-02 |
| IS8453A (is) | 2006-05-11 |
| NO20062329L (no) | 2006-07-12 |
| AU2004292080A1 (en) | 2005-06-02 |
| CA2543604A1 (en) | 2005-06-02 |
| EP1686515A4 (de) | 2006-11-22 |
Similar Documents
| Publication | Publication Date | Title |
|---|---|---|
| EP1686515A1 (de) | Unternehmens-bewertungseinrichtung und unternehmens-bewertungsprogramm | |
| US20070094117A1 (en) | Enterprise evaluation device and enterprise evaluation program | |
| Eberl et al. | Corporate reputation: disentangling the effects on financial performance | |
| EP1783624A1 (de) | Firmenevaluierungseinrichtung, firmenevaluierungsprogramm und firmenevaluierungsverfahren | |
| KR20050108406A (ko) | 기업가치 평가장치 및 기업가치평가 프로그램 | |
| EP1688874A1 (de) | Unternehmensbewertungseinrichtung und unternehmensbewertungsprogramm | |
| EP1686516A1 (de) | System zum bewerten eines unternehemns und programm zum bewerten eines unternehmens | |
| Frost | ABCs of Activity Based Management: crushing competition through performance improvement | |
| JP4018723B2 (ja) | 企業評価装置並びに企業評価プログラム | |
| WO2001028188A2 (en) | Activity information accounting method and system | |
| JPWO2004061714A1 (ja) | 技術評価装置、技術評価プログラム、技術評価方法 |
Legal Events
| Date | Code | Title | Description |
|---|---|---|---|
| PUAI | Public reference made under article 153(3) epc to a published international application that has entered the european phase |
Free format text: ORIGINAL CODE: 0009012 |
|
| 17P | Request for examination filed |
Effective date: 20060517 |
|
| AK | Designated contracting states |
Kind code of ref document: A1 Designated state(s): AT BE BG CH CY CZ DE DK EE ES FI FR GB GR HU IE IT LI LU MC NL PL PT RO SE SI SK TR |
|
| A4 | Supplementary search report drawn up and despatched |
Effective date: 20061019 |
|
| DAX | Request for extension of the european patent (deleted) | ||
| RAP1 | Party data changed (applicant data changed or rights of an application transferred) |
Owner name: MASUYAMA, HIROAKI Owner name: INTELLECTUAL PROPERTY BANK CORP. |
|
| STAA | Information on the status of an ep patent application or granted ep patent |
Free format text: STATUS: THE APPLICATION HAS BEEN WITHDRAWN |
|
| 18W | Application withdrawn |
Effective date: 20090324 |