EP1528394A2 - Procédé et système de détection basé sur transducteurs - Google Patents
Procédé et système de détection basé sur transducteurs Download PDFInfo
- Publication number
- EP1528394A2 EP1528394A2 EP04256656A EP04256656A EP1528394A2 EP 1528394 A2 EP1528394 A2 EP 1528394A2 EP 04256656 A EP04256656 A EP 04256656A EP 04256656 A EP04256656 A EP 04256656A EP 1528394 A2 EP1528394 A2 EP 1528394A2
- Authority
- EP
- European Patent Office
- Prior art keywords
- transducer
- binding partner
- drive signal
- immobilized binding
- sample material
- Prior art date
- Legal status (The legal status is an assumption and is not a legal conclusion. Google has not performed a legal analysis and makes no representation as to the accuracy of the status listed.)
- Withdrawn
Links
Images


Classifications
-
- G—PHYSICS
- G01—MEASURING; TESTING
- G01N—INVESTIGATING OR ANALYSING MATERIALS BY DETERMINING THEIR CHEMICAL OR PHYSICAL PROPERTIES
- G01N29/00—Investigating or analysing materials by the use of ultrasonic, sonic or infrasonic waves; Visualisation of the interior of objects by transmitting ultrasonic or sonic waves through the object
- G01N29/22—Details, e.g. general constructional or apparatus details
- G01N29/26—Arrangements for orientation or scanning by relative movement of the head and the sensor
-
- G—PHYSICS
- G01—MEASURING; TESTING
- G01N—INVESTIGATING OR ANALYSING MATERIALS BY DETERMINING THEIR CHEMICAL OR PHYSICAL PROPERTIES
- G01N29/00—Investigating or analysing materials by the use of ultrasonic, sonic or infrasonic waves; Visualisation of the interior of objects by transmitting ultrasonic or sonic waves through the object
- G01N29/44—Processing the detected response signal, e.g. electronic circuits specially adapted therefor
- G01N29/4409—Processing the detected response signal, e.g. electronic circuits specially adapted therefor by comparison
- G01N29/4427—Processing the detected response signal, e.g. electronic circuits specially adapted therefor by comparison with stored values, e.g. threshold values
-
- G—PHYSICS
- G01—MEASURING; TESTING
- G01N—INVESTIGATING OR ANALYSING MATERIALS BY DETERMINING THEIR CHEMICAL OR PHYSICAL PROPERTIES
- G01N29/00—Investigating or analysing materials by the use of ultrasonic, sonic or infrasonic waves; Visualisation of the interior of objects by transmitting ultrasonic or sonic waves through the object
- G01N29/02—Analysing fluids
- G01N29/022—Fluid sensors based on microsensors, e.g. quartz crystal-microbalance [QCM], surface acoustic wave [SAW] devices, tuning forks, cantilevers, flexural plate wave [FPW] devices
-
- G—PHYSICS
- G01—MEASURING; TESTING
- G01N—INVESTIGATING OR ANALYSING MATERIALS BY DETERMINING THEIR CHEMICAL OR PHYSICAL PROPERTIES
- G01N29/00—Investigating or analysing materials by the use of ultrasonic, sonic or infrasonic waves; Visualisation of the interior of objects by transmitting ultrasonic or sonic waves through the object
- G01N29/36—Detecting the response signal, e.g. electronic circuits specially adapted therefor
- G01N29/40—Detecting the response signal, e.g. electronic circuits specially adapted therefor by amplitude filtering, e.g. by applying a threshold or by gain control
-
- G—PHYSICS
- G01—MEASURING; TESTING
- G01N—INVESTIGATING OR ANALYSING MATERIALS BY DETERMINING THEIR CHEMICAL OR PHYSICAL PROPERTIES
- G01N29/00—Investigating or analysing materials by the use of ultrasonic, sonic or infrasonic waves; Visualisation of the interior of objects by transmitting ultrasonic or sonic waves through the object
- G01N29/44—Processing the detected response signal, e.g. electronic circuits specially adapted therefor
- G01N29/46—Processing the detected response signal, e.g. electronic circuits specially adapted therefor by spectral analysis, e.g. Fourier analysis or wavelet analysis
-
- G—PHYSICS
- G01—MEASURING; TESTING
- G01N—INVESTIGATING OR ANALYSING MATERIALS BY DETERMINING THEIR CHEMICAL OR PHYSICAL PROPERTIES
- G01N2291/00—Indexing codes associated with group G01N29/00
- G01N2291/01—Indexing codes associated with the measuring variable
- G01N2291/014—Resonance or resonant frequency
-
- G—PHYSICS
- G01—MEASURING; TESTING
- G01N—INVESTIGATING OR ANALYSING MATERIALS BY DETERMINING THEIR CHEMICAL OR PHYSICAL PROPERTIES
- G01N2291/00—Indexing codes associated with group G01N29/00
- G01N2291/01—Indexing codes associated with the measuring variable
- G01N2291/015—Attenuation, scattering
-
- G—PHYSICS
- G01—MEASURING; TESTING
- G01N—INVESTIGATING OR ANALYSING MATERIALS BY DETERMINING THEIR CHEMICAL OR PHYSICAL PROPERTIES
- G01N2291/00—Indexing codes associated with group G01N29/00
- G01N2291/02—Indexing codes associated with the analysed material
- G01N2291/025—Change of phase or condition
- G01N2291/0255—(Bio)chemical reactions, e.g. on biosensors
-
- G—PHYSICS
- G01—MEASURING; TESTING
- G01N—INVESTIGATING OR ANALYSING MATERIALS BY DETERMINING THEIR CHEMICAL OR PHYSICAL PROPERTIES
- G01N2291/00—Indexing codes associated with group G01N29/00
- G01N2291/02—Indexing codes associated with the analysed material
- G01N2291/025—Change of phase or condition
- G01N2291/0256—Adsorption, desorption, surface mass change, e.g. on biosensors
-
- G—PHYSICS
- G01—MEASURING; TESTING
- G01N—INVESTIGATING OR ANALYSING MATERIALS BY DETERMINING THEIR CHEMICAL OR PHYSICAL PROPERTIES
- G01N2291/00—Indexing codes associated with group G01N29/00
- G01N2291/02—Indexing codes associated with the analysed material
- G01N2291/028—Material parameters
- G01N2291/0289—Internal structure, e.g. defects, grain size, texture
-
- G—PHYSICS
- G01—MEASURING; TESTING
- G01N—INVESTIGATING OR ANALYSING MATERIALS BY DETERMINING THEIR CHEMICAL OR PHYSICAL PROPERTIES
- G01N2291/00—Indexing codes associated with group G01N29/00
- G01N2291/04—Wave modes and trajectories
- G01N2291/042—Wave modes
- G01N2291/0426—Bulk waves, e.g. quartz crystal microbalance, torsional waves
Definitions
- the present application relates to a method of performing rupture event scanning and to a transducer-based sensor system.
- Quartz crystal microbalance is a transducer-based technology that may employ piezoelectric transducers in various configurations to perform sensing functions.
- QCM technology takes advantage of the fact that the resonant 15 frequency of a transducer typically varies with the effective mass of the transducer. Accordingly, when portions of a sample material bind to the transducer, the mass of the bonded sample material can be detected by monitoring the resonant frequency of the vibrating mass.
- a related technology is rupture event scanning (RES), in which transducers may be employed to produce mechanical energy to break bonds within a sample material.
- the transducers may be used as sensors to analyze acoustic events (e.g., a pressure wave) that can occur when bonds break.
- acoustic events e.g., a pressure wave
- Different types of bonds have unique properties that produce distinctive acoustic events. The bonds can be identified and analyzed by using various techniques to study the acoustic events.
- Existing rupture event devices and methods typically employ high Q transducer devices which are excited with pure sinusoidal signals at the resonant frequency of the transducer.
- continuous scanning operations are performed on the transducer to determine whether the system is still operating at resonance, and/or to determine whether a change in resonant frequency has occurred. This often requires use of a low-amplitude test signal to ensure that rupture events are not induced while the resonant frequency is being determined.
- the process of determining the resonant frequency particularly when performed frequently and repeatedly, can significantly limit the speed at which samples are processed. Processing speed is also limited in many existing systems by the analytic methods used to study transducer output data.
- the present description provides a system and method for performing rupture event scanning and other sensing operations on a sample.
- the method includes providing a transducer with an immobilized binding partner material and a sample material disposed thereon.
- the sample material is applied to the immobilized binding partner material so that, if components in the sample material have sufficient affinity for the immobilized binding partner material, bonds will form between at least some of such components and the immobilized binding partner material.
- the method further includes accelerating the transducer to induce bond breakage, where such accelerating is performed by applying a drive signal to the transducer.
- the drive signal includes a waveform having multiple frequency components that are pre-selected based on expected resonance behavior of the transducer.
- the method may also include analyzing an output response of the transducer in response to application of the drive signal.
- the following description relates to systems, devices and methods in which a transducer is employed to obtain information about materials secured to or in proximity with the transducer.
- RES rupture event scanning
- QCM quartz crystal microbalance
- Transducer 20 typically is a piezoelectric device formed from a quartz crystal or other material with piezoelectric properties. In RES, QCM and other applications, various materials may be provided on or around the transducer. Specifically, as shown in the figure, an immobilized binding partner material such as antibody sample 22 may be disposed on transducer 20. Transducer 20 may also be prepared with a sample material 24 including constituent components such as particles 26. If the components within the sample material have sufficient affinity for the immobilized binding partner material (e.g., for antibodies within the immobilized binding partner material), then bonds will form between the components and the immobilized binding partner. For example, if antibodies within antibody sample material 22 are exposed to complementary antigens (e.g., particles 26), the antibody-antigen pairs may form bonds.
- an immobilized binding partner material such as antibody sample 22
- Transducer 20 may also be prepared with a sample material 24 including constituent components such as particles 26. If the components within the sample material have sufficient affinity for the immobilized binding partner material (e.g.,
- Transducer 20 typically is coupled with a drive signal generator (not shown in Fig. 1) or like device for applying a drive signal to the transducer.
- Application of the drive signal typically creates a mechanical oscillation as indicated by the arrows in Fig. 1.
- An output processing system (not shown in the figure) may be employed to obtain and analyze electrical output resulting from movement of transducer 20.
- particles 26 experience an acceleration, and thus a force, that is proportional to the amplitude of the applied drive signal.
- this force is equal to or greater than the energy or force associated with the bond (e.g., the bond between an antibody and antigen)
- the bond breaks. Breaking of the bond yields a unique acoustic signature that represents and is associated with the unique binding force(s) between the bonded components (e.g., between the particular antibody and antigen).
- a drive signal such as a voltage waveform
- Applying a drive signal typically will cause the transducer to move, due to the piezoelectric properties of the transducer. Often the movement of the transducer will be oscillatory in nature. In many cases it will be desirable to drive the transducer at its resonant frequency by driving it at its direct fundamental or direct overtone frequency in the frequency domain.
- the resonant response of the transducer will be significant in many operational settings.
- the resonant frequency of transducer typically will vary with the effective mass of the transducer (e.g., the mass of the transducer itself and the mass of any material secured to the transducer). Specifically, resonant frequency increases as the effective transducer mass decreases. Accordingly, monitoring of frequency response (e.g., detection of resonant frequency changes) may be used in many applications to perform mass measurements.
- the effective mass of transducer 20 would be the mass of the transducer plus the mass of immobilized binding partner material 22 and the mass of any particles 26 secured or affixed to the binding partner material.
- the quantity of dislodged material may often be ascertained if the associated change in resonant frequency is known. If sample material 24 is known to contain only one type of particle 26 (e.g., a specific antigen), the number of particles involved in a rupture event may be determined, assuming that the mass of an individual particle 26 is known.
- a specific antigen e.g., a specific antigen
- bond breakage typically will produce an acoustic event.
- the acoustic event will in turn have a physical effect upon the transducer, that is, the acoustic event will cause a corresponding movement in the transducer, independent of and in addition to the movement caused by the applied drive signal.
- the transducer movement caused by the event will contribute components to the transducer's output, which may in turn be analyzed to obtain information about the occurrence producing the acoustic event.
- Such analysis may be employed, for example, to determine whether a sample material contains a specific type of particle 26, such as a specific antigen, pathogen, etc.
- Fig. 2 depicts a transducer system 40 that may be employed in RES, QCM and other applications involving transducers.
- System 40 typically includes an array of transducers similar to transducer 20, as opposed to a single transducer, to allow faster testing and/or testing of multiple samples.
- system 40 includes four transducers 42, 44, 46 and 48, though it should be appreciated that any practicable number of transducers may be employed.
- System 40 typically includes a controller, such as a processor and a memory coupled with the transducer array and configured to perform various functions. These functions may include performing overall system control, including sequential control of various system components; generating and applying drive signals to the transducer array in order to mechanically excite the transducers; controlling the energy imparted by the drive signals by controlling the amplitude and/or duration of the drive signals; detecting and/or obtaining resonant frequencies of the transducers, including initial frequencies and subsequent frequencies (e.g., after mass has been dislodged); sampling output from the transducers in response to application of the drive signals; storing the digitized output samples from the transducers; performing frequency domain transformations as appropriate on the sampled data; filtering or otherwise removing extraneous or unwanted portions of the sampled data; and comparing remaining portions of the sampled data to stored data, such as bond adhesion tables, to determine whether particular rupture events occurred.
- a controller such as a processor and a memory coupled with the transducer array and configured to perform
- the controller is implemented with a digital signal processor (DSP) 50 and various accompanying components, including a direct digital synthesizer (DDS) 52, digital-to-analog converter (DAC) 54, amplifier 56, hybrid RF device 58, amplifier 60 and a flash analog-to-digital converter (ADC) 62.
- DSP digital signal processor
- ADC flash analog-to-digital converter
- a multiplexing device including sections 64, 66, 68 and 70 may also be provided to selectively activate desired transducers in the array.
- DSP 50 and DDS 52 may be employed to generate an input voltage waveform (e.g., a drive signal) for application to one or more of transducers 42, 44, 46 and 48.
- the transducer or transducers are selected via multiplexer sections 64, 66, 68 and 70, which may be controlled via the depicted select lines 1-4 of DSP 50.
- the amplitude of the waveform may be controlled via operation of DAC 54 and amplifier 56, using values supplied from DSP 50.
- the resulting input drive signal may be applied to the selected transducer via RF hybrid device 58, which may be implemented as a four-port device in order to segregate input and output signals flowing in opposite directions to and from the array of transducers.
- Output signals flow through hybrid RF device 58, amplifier 60 and flash ADC 62. Outputs may be selectively sampled and read into the memory of DSP 50 via selective assertion of the READ ENABLE connection to flash ADC 62. As discussed in more detail below, DSP 50 may analyze the output response to identify frequency changes and/or amplitude phenomena indicating that mass has dislodged from a transducer and/or that a rupture event has occurred.
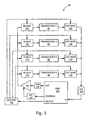
- Fig. 3 depicts another transducer system 80.
- system 80 includes an array of two-port transducers 82, 84, 86 and 88.
- a controller may be provided to drive and process output from the array.
- system 80 includes a DSP 100 configured to drive the transducers with drive signals applied via the combined operation of DSP 100, DAC 102 and amplifier 104. The resulting output is read into DSP 100 via ADC 106.
- Transducers within the array may be selected via operation of decode section 108, input multiplexer sections 110, 112, 114 and 116 and output multiplexer sections 120, 122, 124 and 126.
- a variety of different drive signals may be employed with the present systems and methods to produce oscillations or other transducer movement, for example to produce forces to induce dislodgment of material (e.g., a rupture event in which antibody-antigen bond(s) break).
- a rupture event in which antibody-antigen bond(s) break.
- Figs. 4A, 4B, 5A, 5B, 6A, 6B, 7A and 7B show time domain and frequency domain representations of various exemplary drive signals that may be employed with the systems and devices described herein.
- Figs. 4A and 4B show time domain and frequency domain representations, respectively, of a pure sinusoidal drive signal waveform 130, as conventionally employed in prior rupture event systems and methods.
- the pure sinusoidal signal has only one frequency component.
- the pure sinusoidal signal is applied at a particular amplitude and frequency, and the resulting transducer response is examined to determine if a rupture event occurred, such as breaking of a bond.
- the signal amplitude is increased (e.g., to produce greater acceleration and thus a greater force to induce bond breakage), the resulting response is analyzed, and so on until an event is detected.
- the process of repetitively increasing amplitude and searching for a response can be fairly time consuming, particularly in a large array of transducers.
- rupture events and other mass dislodgments are detected through changes in resonant behavior of the transducer.
- prior systems repeatedly and frequently sweep through a range of frequencies to determine what the resonant frequency is and/or whether the transducer is currently being driven at resonance.
- Use of a drive signal with only one frequency component, such as a pure sinusoid may require resonance determinations to be performed more frequently.
- the resonance determination for a given transducer typically is performed by decreasing the amplitude of the sinusoidal drive signal to a magnitude where it will not cause any dislodgment (e.g., a rupture event).
- the low amplitude signal is then swept through the range of potential frequencies, and the resulting physical response of the transducer is observed by analyzing the electrical output of the transducer.
- the frequency at which the maximum movement is observed is determined to be the resonant frequency.
- the determined resonant frequency is then compared to recent values to determine what, if any, change has occurred, and the magnitude of the change.
- the drive signal amplitude may then be increased once again to the desired operational level (e.g., the level used to induce bond breakage) and the transducer is again accelerated as described above.
- Figs. 5A, 5B, 6A, 6B, 7A and 7B show time domain and frequency domain representations of alternate drive signal waveforms having multiple frequencies.
- Figs. 5A and 5B are time domain and frequency domain representations, respectively, of a drive signal waveform 132 having components at 50 and 54 MHz.
- Figs. 6A and 6B are time domain and frequency domain representations, respectively, of a drive signal waveform 134 having components at 50, 51, 52 and 53 MHz.
- Figs. 7A and 7B are time domain and frequency domain representations, respectively, of a drive signal waveform 136 having components at 50, 51, 52, 53, 54, 55, 56 and 57 MHz.
- the drive signal may be formed by combining sinusoids (e.g., sine and/or cosine waves) at the respective frequencies using suitable amplitude coefficients.
- sinusoids e.g., sine and/or cosine waves
- Figs. 5A, 5B, 6A, 6B, 7A and 7B show illustrative examples only, and many other multiple-frequency waveforms may be employed.
- the frequencies in these waveforms are intended to be illustrative only, and it should be understood that transducer devices may be operated at much higher oscillatory frequencies in rupture event scanning and other applications.
- the Q factor of the transducers within the system will often be a consideration in determining the selection of frequencies within a given waveform. For example, it may be desirable to have numerous closely-spaced frequencies in a drive signal waveform used to drive a transducer device with a relatively high Q factor. In high Q devices, even a very small mass dislodgment could place the transducer off resonance relative to a frequency component within the waveform. If the next highest frequency component within the signal had a frequency that was too much higher than the first frequency, then the device could fall "between" the two frequencies, such that neither frequency component could produce a resonant response, due to the relatively high Q factor of the transducer. Accordingly, frequency components for the drive signal waveforms of the present description may be selected based upon transducer Q factors, and/or upon the expected mass dislodgments to occur during operation.
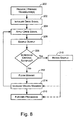
- Figs. 8 and 9 depict exemplary methods for driving a transducer or transducer array, and analyzing the resulting output.
- the methods of the present description commonly employ multiple-frequency drive signals, as in the examples of Figs. 5A, 5B, 6A, 6B, 7A and 7B, and may be implemented in connection with or independently of the embodiments discussed above.
- a transducer or array of transducers is provided at 200, and the transducers are prepared for excitation with a drive signal.
- the transducers may be provided with an immobilized binding partner material and a sample material, as described above with reference to Figs. 1-3.
- the sample material and binding partner material typically are brought into close contact to facilitate bond formation between constituent components of the materials (e.g., between an antibody in immobilized binding partner material 22 and an antigen in sample material 24).
- a spraying device may be employed in connection with systems 40 or 80 to spray the sample material onto a surface of the transducer to which the immobilized binding partner material has been applied.
- the transducers may be prepared with a binding partner material and sample material in advance.
- the preparation process may also include applying an initialization drive signal to the transducers in order to move the transducers and thereby facilitate formation of bonds between the sample material and immobilized binding partner material.
- the method may further include initializing the drive signal that is to be used to accelerate the transducer(s).
- initializing may include determining the specific frequency components that are to be present in the drive signal, based on the expected resonance behavior of the transducer. This may involve, for example, determining the initial resonant frequency of the prepared transducer (e.g., a transducer with a binding partner and sample material disposed thereon). Referring to Fig.
- DSP 100, DAC 102 and amplifier 104 may be used to apply initial drive signals to transducers 82, 84, 86 and 88 in order to identify the initial resonant frequencies of the transducers (e.g., prior to any rupture events or other dislodgment of mass from the transducers).
- the initial resonant frequency of a transducer may be used to establish a lower bound for the frequencies to be used in the drive signal, as the resonant frequency will increase as mass dislodges from the transducer.
- Other frequencies may be selected based on the particular sample material. For example, for a given sample, it may be relatively easy to estimate how much mass will break away during oscillation of the transducer (e.g., due to bonds breaking). This may be used to establish an upper bound for frequency components in the drive signal. These and other considerations, such as the Q factor of the transducers (see above discussion), may dictate how signal components with intermediate frequencies are incorporated into the drive signal.
- a multiple-frequency drive signal may produce a resonant response even in the face of changes in the effective mass of the transducer.
- a pure sinusoid (a single frequency drive signal), in contrast, will produce a resonant response only if the drive signal is close in frequency to the resonant frequency of the transducer, which of course will change as mass is dislodged.
- the multiple-frequency drive signal described herein accommodates changes in transducer effective mass and the attendant resonant frequency changes, reducing the need to frequently and repeatedly apply low-amplitude signals to obtain resonance. Also, by reducing the number of low-amplitude scans needed to obtain resonance, overall analysis times are reduced.
- Initialization may also involve setting a range of energies to which the prepared transducer will be subjected, and initially setting the drive signal to the lowest energy level (e.g., a minimum amplitude and/or duration for the applied waveform) in the determined range.
- the range of energy levels to be applied may be determined depending on the particular test to be conducted, and/or on the expected properties of the sample material. For example, system 40 or system 80 may be used to determine whether a sample material contains a particular antigen or pathogen.
- the immobilized binding partner material would be prepared to contain antibodies corresponding to the antigen/pathogen of interest. Using known bond forces for bonds formed between the particular antibody and antigen, a range of energy levels for the input drive signal may be selected. The range may be selected so that, at some level within the range, the antigen of interest, if present, would rupture away from the immobilized binding partner material due to the shear forces generated through oscillation of the transducer.
- the frequency components and energy levels for the drive signal may be determined in advance or dynamically while an experiment or other operation is being conducted.
- the various components of systems 40 and 80 may be programmed or otherwise configured to carry out the initialization tasks described above and with reference to step 202 in Fig. 8.
- the drive signal is generated for application to the transducers.
- the drive signal waveform is generated by DSP 50 with assistance of DDS 52, DAC 54 and amplifier 56.
- DSP 100 may be used to generate the waveform, with assistance of DAC 102, DDS 103 and amplifier 104.
- the method further includes, at 204 and 206, applying the drive signal to the transducer and then sampling the resulting output.
- the drive signal waveform may be generated by DSP 50 and DDS 52, with the signal amplitude being controlled by DSP 50, DAC 54 and amplifier 56.
- the drive signal may be applied to the selected transducer via RF hybrid device 58.
- the resulting output from the transducer may be sampled and at least temporarily stored in the memory of DSP 50.
- DSP 50 selectively asserts the READ ENABLE input of flash 25 ADC 62 to cause output samples to be read from the selected transducer through RF hybrid device 58 into the DSP's memory through amplifier 60 and flash ADC 62.
- DSP 100 generates the drive signal waveform in conjunction with DDS 103, and the amplitude may be controlled by DSP 100 in cooperation with DAC 102 and amplifier 104. Output samples from the selected 30 transducer are read into DSP 100 through ADC 106.
- the output sample may be screened, for example to determine whether a detailed analysis of the particular sample is desirable.
- output samples may be screened for amplitude phenomena indicating or suggesting that a rupture event has occurred, such as the breaking of a bond(s) formed between an antibody-antigen pair. Because bond forces are often relatively high, when the bonds break they typically produce an acoustic event that is detected by the transducer and manifested in the transducer output sample as a short duration, high amplitude burst.
- the amplitude burst typically is at substantially different frequencies than the resonant response attributable to the drive signal that is applied to excite the transducer, and thus may be differentiated from the drive signal by its frequency and amplitude.
- the amplitude associated with the rupture may not be much higher than any noise, crosstalk, or other components present in the output sample, it typically occurs synchronously with the drive signal and this may be extracted synchronously and compared afterward with an amplitude trigger or level threshold. Accordingly, a threshold value may be established, and the output sample may be screened for components having amplitudes higher than the threshold.
- the threshold may be determined in advance, or calculated during operation based on various parameters.
- the particular threshold may be determined with reference to amplitudes of certain frequency components present in the drive signal.
- other criteria may be employed to identify output samples of potential interest.
- the method may include a preliminary analysis for phenomena indicating that a shift in resonant frequency has occurred. An upward shift in resonant frequency would indicate that a mass dislodgment, and thus a potential rupture event, had occurred. The particular output sample could then be retained and analyzed in more detail to determine whether a rupture event had in fact occurred as a result of the transducer excitation.
- step 208 may be thought of as a preliminary screening analysis in which an output sample is scanned for the presence of rupture indicators.
- the presence of a rupture indicator typically is not a conclusive indication that an event of interest has occurred, as will be explained below.
- screening for rupture indicators will provide, in many settings, an efficient way to identify output samples of potential interest. Typically, the screening process is substantially faster than the more detailed processing that is required to confirm or deny that an event of interest occurred due to excitation of the transducer.
- the method may include taking different actions depending on whether the screening criteria at step 208 is or is not satisfied. If the criteria is satisfied, for example if the output sample includes components exceeding an established amplitude threshold, then the output sample may be retained, as indicated at 210. Alternatively, as shown at 212, if the screening criteria is not satisfied, then the respective memory location (e.g., within DSP 50 or DSP 100) may be flushed to free up memory resources.
- the energy of a given waveform may be viewed in terms of the area under a time domain representation of the waveform. Accordingly, the energy level may be increased by increasing the amplitude and/or duration of the overall waveform, or of certain components of the waveform. For example, the amplitude of a selected frequency component, or of the overall waveform, may be increased. In the depicted exemplary method, the drive signal energy level may be increased at 214 unless the maximum energy level has been reached.
- the method may include providing the drive signal to the transducer at successively increasing energy levels. For each energy level, the corresponding output response may be sampled (e.g., at 206). After cycling through all the energy levels, further processing may be performed, as shown at 216.
- the further processing may include a more thorough analysis of the sampled data, as explained in more detail below. Instead of cycling through the entire range of energies for the applied drive signal, the further processing may be performed as soon as a potential event has been identified, as shown at 210 and 216.
- the method may include performing a frequency domain transformation on the output sample. Any practicable transformation technique may be employed, including Fourier, FFT, Hartley, Wavelet or Bracewell transformations. Typically, the transformation yields data that may be analyzed within the frequency domain in terms of amplitude as a function of frequency. As shown at 232, the transformation data may be analyzed to identify the major resonant frequency present in the sampled transducer response.
- the method may include, at 234, determination of whether the resonant frequency of the transducer has shifted, for example from prior recorded values. As discussed above, such a shift typically occurs when the effective mass of the transducer changes (e.g., when mass breaks off of the surface of the transducer). Specifically, a decrease in mass produces an increase in resonant frequency.
- a shift in frequency is not a conclusive indication that an event of interest has occurred. In other words, not all mass dislodgments will have experimental significance.
- a given experiment might involve determining whether a sample material contains a certain pathogen, such as a particular variety of the streptococcus virus.
- the only shift in frequency of interest would be a shift associated with a rupture (e.g., bond breakage) between that variety of streptococcus virus and the immobilized binding partner affixed to the transducer.
- the sample material may include components other than the antigen of interest (proteins, for example) that become affixed to the transducer. When these proteins break off due to oscillation of the transducer, the resonant frequency will shift, however this shift in frequency is not associated with breakage of the particular antibody-antigen bond that is the subject of the experiment.
- the transformation data may be further processed to isolate potential event data, if any is present, and then compare the isolated potential event data to stored values.
- isolation data associated with the transducer's response to the drive signal typically will be subtracted or otherwise removed.
- various methods may be employed to remove noise and crosstalk from the sample. Isolation may involve deconvolution or other methods, as suitable and appropriate to a given setting. Separation of potential event data is often facilitated by the fact that event data typically occurs at frequencies other than the resonant frequency of the transducer. Accordingly, filtering and like techniques may also be applied in many cases to extract the data that is potentially of interest.
- the potential event data may be compared to known values, as shown at 238.
- data associated with known bonds may be stored within the memories of DSP 50 or DSP 100.
- data might include, for example, data pertaining to the acoustic signatures for a variety of antibody-antigen pairs.
- the known data would include the unique acoustic signature associated with rupture of the streptococcus strain away from partner components (e.g., antigens) within the immobilized binding partner material.
- the isolated potential event data would be compared to the known acoustic signatures, and a match would indicate that the sample material in fact contained the streptococcus strain of interest, and that a rupture event occurred involving the strain of interest.
- Transformations into the frequency domain and subsequent analysis can be fairly time consuming.
- processing speed may be increased by rapidly screening the sampled data to separate potentially relevant data from data which appears to be not relevant.
- the sampled data is preliminarily screened for amplitude and/or frequency phenomena suggesting or indicating that an event of interest occurred.
- Use of such screening may be employed to avoid performing a fuller and more time-consuming analysis on all of the data sampled from the transducer(s). This is particularly advantageous given that, in many settings, a large majority of transducer excitations will not produce an event of interest or other mass dislodgment.
Landscapes
- Physics & Mathematics (AREA)
- Immunology (AREA)
- General Physics & Mathematics (AREA)
- Pathology (AREA)
- Analytical Chemistry (AREA)
- Health & Medical Sciences (AREA)
- Life Sciences & Earth Sciences (AREA)
- General Health & Medical Sciences (AREA)
- Biochemistry (AREA)
- Chemical & Material Sciences (AREA)
- Engineering & Computer Science (AREA)
- Signal Processing (AREA)
- Mathematical Physics (AREA)
- Spectroscopy & Molecular Physics (AREA)
- Acoustics & Sound (AREA)
- Investigating Or Analyzing Materials By The Use Of Ultrasonic Waves (AREA)
Applications Claiming Priority (2)
| Application Number | Priority Date | Filing Date | Title |
|---|---|---|---|
| US10/698,834 US6978656B2 (en) | 2003-10-31 | 2003-10-31 | Transducer-based sensor system and method |
| US698834 | 2003-10-31 |
Publications (2)
| Publication Number | Publication Date |
|---|---|
| EP1528394A2 true EP1528394A2 (fr) | 2005-05-04 |
| EP1528394A3 EP1528394A3 (fr) | 2007-08-29 |
Family
ID=34423425
Family Applications (1)
| Application Number | Title | Priority Date | Filing Date |
|---|---|---|---|
| EP04256656A Withdrawn EP1528394A3 (fr) | 2003-10-31 | 2004-10-28 | Procédé et système de détection basé sur transducteurs |
Country Status (6)
| Country | Link |
|---|---|
| US (1) | US6978656B2 (fr) |
| EP (1) | EP1528394A3 (fr) |
| JP (1) | JP4129450B2 (fr) |
| KR (1) | KR20050041915A (fr) |
| CA (1) | CA2486295A1 (fr) |
| TW (1) | TWI266864B (fr) |
Cited By (1)
| Publication number | Priority date | Publication date | Assignee | Title |
|---|---|---|---|---|
| US7543476B2 (en) | 2003-04-17 | 2009-06-09 | Akubio Limited | Rupture event sensors |
Families Citing this family (8)
| Publication number | Priority date | Publication date | Assignee | Title |
|---|---|---|---|---|
| US7130727B2 (en) * | 2003-12-05 | 2006-10-31 | Full-View-Matic, Inc. | Vehicle safety system having methods and apparatus configurable for various vehicle geometries |
| JP4487662B2 (ja) * | 2004-07-12 | 2010-06-23 | セイコーエプソン株式会社 | 圧電アクチュエータの駆動方法、圧電アクチュエータの駆動装置、電子機器 |
| US20060179918A1 (en) * | 2005-02-15 | 2006-08-17 | Honeywell International | Gas chromatograph and quartz crystal microbalance sensor apparatus |
| FR2905277B1 (fr) * | 2006-08-29 | 2009-04-17 | Centre Nat Rech Scient | Dispositif de traitement volumique de tissus biologiques |
| RU2524100C2 (ru) * | 2009-04-10 | 2014-07-27 | Шлюмбергер Текнолоджи Б.В. | Скважинные системы датчиков и соответствующие способы |
| US9084048B1 (en) * | 2010-06-17 | 2015-07-14 | Shindig, Inc. | Audio systems and methods employing an array of transducers optimized for particular sound frequencies |
| US10133702B2 (en) * | 2015-03-16 | 2018-11-20 | Rockwell Automation Technologies, Inc. | System and method for determining sensor margins and/or diagnostic information for a sensor |
| US10730744B2 (en) | 2018-12-28 | 2020-08-04 | Industrial Technology Research Institute | MEMS device with movable stage |
Family Cites Families (17)
| Publication number | Priority date | Publication date | Assignee | Title |
|---|---|---|---|---|
| US3582838A (en) | 1966-09-27 | 1971-06-01 | Zenith Radio Corp | Surface wave devices |
| US3983424A (en) | 1973-10-03 | 1976-09-28 | The University Of Southern California | Radiation detector employing acoustic surface waves |
| US4055072A (en) | 1975-09-19 | 1977-10-25 | Nasa | Apparatus for measuring a sorbate dispersed in a fluid stream |
| JPS5540967A (en) | 1978-09-18 | 1980-03-22 | Toshiba Corp | Surface acoustic wave unit |
| US4788466A (en) | 1987-11-09 | 1988-11-29 | University Of Arkansas | Piezoelectric sensor Q-loss compensation |
| US5201215A (en) | 1991-10-17 | 1993-04-13 | The United States Of America As Represented By The United States Department Of Energy | Method for simultaneous measurement of mass loading and fluid property changes using a quartz crystal microbalance |
| CA2127282C (fr) | 1992-01-03 | 2004-05-18 | Leonhard Reindl | Capteur d'ondes de surface passif pouvant etre interroge sans fil |
| JPH0750548A (ja) | 1993-05-31 | 1995-02-21 | Canon Inc | 弾性表面波素子 |
| US5448126A (en) | 1993-10-05 | 1995-09-05 | Matsushita Electric Industrial Co., Ltd. | Surface acoustic wave-semiconductor composite device |
| US5719324A (en) * | 1995-06-16 | 1998-02-17 | Lockheed Martin Energy Systems, Inc. | Microcantilever sensor |
| US6167748B1 (en) * | 1998-08-31 | 2001-01-02 | Lockheed Martin Energy Research Corporation | Capacitively readout multi-element sensor array with common-mode cancellation |
| GB9823410D0 (en) * | 1998-10-26 | 1998-12-23 | Smithkline Beecham Plc | Novel device |
| US6289717B1 (en) * | 1999-03-30 | 2001-09-18 | U. T. Battelle, Llc | Micromechanical antibody sensor |
| GB9909308D0 (en) | 1999-04-22 | 1999-06-16 | Univ Cambridge Tech | Measurement and use of molecular interactions |
| JP2001257554A (ja) | 2000-01-07 | 2001-09-21 | Tdk Corp | 弾性表面波装置 |
| US6848295B2 (en) * | 2002-04-17 | 2005-02-01 | Wayne State University | Acoustic wave sensor apparatus, method and system using wide bandgap materials |
| US6826949B1 (en) * | 2003-06-13 | 2004-12-07 | Becton, Dickinson And Company | Method and apparatus for guiding a liquid sample towards a sensing surface |
-
2003
- 2003-10-31 US US10/698,834 patent/US6978656B2/en not_active Expired - Fee Related
-
2004
- 2004-05-31 TW TW093115522A patent/TWI266864B/zh not_active IP Right Cessation
- 2004-10-22 JP JP2004307986A patent/JP4129450B2/ja not_active Expired - Fee Related
- 2004-10-28 KR KR1020040086495A patent/KR20050041915A/ko not_active Withdrawn
- 2004-10-28 EP EP04256656A patent/EP1528394A3/fr not_active Withdrawn
- 2004-10-29 CA CA002486295A patent/CA2486295A1/fr not_active Abandoned
Cited By (2)
| Publication number | Priority date | Publication date | Assignee | Title |
|---|---|---|---|---|
| US7543476B2 (en) | 2003-04-17 | 2009-06-09 | Akubio Limited | Rupture event sensors |
| US7570125B2 (en) | 2003-04-17 | 2009-08-04 | Akubio Limited | Crystal oscillator |
Also Published As
| Publication number | Publication date |
|---|---|
| US6978656B2 (en) | 2005-12-27 |
| JP2005134386A (ja) | 2005-05-26 |
| JP4129450B2 (ja) | 2008-08-06 |
| EP1528394A3 (fr) | 2007-08-29 |
| TWI266864B (en) | 2006-11-21 |
| CA2486295A1 (fr) | 2005-04-30 |
| US20050092088A1 (en) | 2005-05-05 |
| TW200514968A (en) | 2005-05-01 |
| KR20050041915A (ko) | 2005-05-04 |
Similar Documents
| Publication | Publication Date | Title |
|---|---|---|
| JP7569811B2 (ja) | 振動応答信号を使用して試験片を分析するための方法およびシステム | |
| SE518997C2 (sv) | Förfarande och anordning för att detektera skada i material eller föremål | |
| US6978656B2 (en) | Transducer-based sensor system and method | |
| JP2004520587A (ja) | 細長い非軸対称物体の検査 | |
| WO2008094358A1 (fr) | Matériau structurel avec particules de matériau piézoélectrique | |
| US20020189357A1 (en) | Method and apparatus for determining dynamic response of microstructure by using pulsed broad bandwidth ultrasonic transducer as BAW hammer | |
| US5216921A (en) | Method and apparatus for detecting defects and different-hardness portions of an object with protrusions | |
| US11548043B2 (en) | Method for detecting and removing buildup on a component, system and computer program | |
| JP2009109460A (ja) | パネルの検査装置及び検査方法 | |
| WO2000034750A1 (fr) | Spectroscopie a ultrasons non lineaire a resonance | |
| JPS63186122A (ja) | 構造物の異常診断方式 | |
| US20050109110A1 (en) | Structural health monitoring | |
| JP2014504734A (ja) | 少なくとも1つの金属含有層が埋め込まれた電子部品を検査するための装置、方法、および電磁超音波探触子の使用 | |
| US20100095774A1 (en) | Mass measuring device and cantilever | |
| JP2006523835A (ja) | 破裂イベントセンサ装置 | |
| RU2219538C2 (ru) | Способ обнаружения трещин в твердом теле | |
| JP2004101413A (ja) | 固体内部の振動検査装置 | |
| Ohtsu et al. | Development of non-contact SIBIE procedure for identifying ungrouted tendon duct | |
| US7135806B2 (en) | Transducer-based sensor system with multiple drive signal variants | |
| Didenkulov et al. | Nonlinear acoustic technique of crack location | |
| JPH11183443A (ja) | 果実の熟度測定方法 | |
| SU979989A1 (ru) | Способ контрол трещин в материале деталей с осевой симметрией | |
| JP2004085412A (ja) | 固体内部の振動検査装置 | |
| SU1762225A1 (ru) | Способ контрол клеевых соединений многоэлементных пьезокерамических преобразователей | |
| Chen et al. | Quantifying fatigue cracks in TC4 titanium alloy using a nonlinear modulation ultrasonic testing method |
Legal Events
| Date | Code | Title | Description |
|---|---|---|---|
| PUAI | Public reference made under article 153(3) epc to a published international application that has entered the european phase |
Free format text: ORIGINAL CODE: 0009012 |
|
| AK | Designated contracting states |
Kind code of ref document: A2 Designated state(s): AT BE BG CH CY CZ DE DK EE ES FI FR GB GR HU IE IT LI LU MC NL PL PT RO SE SI SK TR |
|
| AX | Request for extension of the european patent |
Extension state: AL HR LT LV MK |
|
| PUAL | Search report despatched |
Free format text: ORIGINAL CODE: 0009013 |
|
| AK | Designated contracting states |
Kind code of ref document: A3 Designated state(s): AT BE BG CH CY CZ DE DK EE ES FI FR GB GR HU IE IT LI LU MC NL PL PT RO SE SI SK TR |
|
| AX | Request for extension of the european patent |
Extension state: AL HR LT LV MK |
|
| 17P | Request for examination filed |
Effective date: 20080229 |
|
| 17Q | First examination report despatched |
Effective date: 20080325 |
|
| AKX | Designation fees paid |
Designated state(s): DE GB |
|
| GRAP | Despatch of communication of intention to grant a patent |
Free format text: ORIGINAL CODE: EPIDOSNIGR1 |
|
| STAA | Information on the status of an ep patent application or granted ep patent |
Free format text: STATUS: THE APPLICATION IS DEEMED TO BE WITHDRAWN |
|
| 18D | Application deemed to be withdrawn |
Effective date: 20091007 |