EP1155289B1 - Flow measurement with diagnostics - Google Patents
Flow measurement with diagnostics Download PDFInfo
- Publication number
- EP1155289B1 EP1155289B1 EP00913631A EP00913631A EP1155289B1 EP 1155289 B1 EP1155289 B1 EP 1155289B1 EP 00913631 A EP00913631 A EP 00913631A EP 00913631 A EP00913631 A EP 00913631A EP 1155289 B1 EP1155289 B1 EP 1155289B1
- Authority
- EP
- European Patent Office
- Prior art keywords
- pressure
- transmitter
- data set
- pressure transmitter
- diagnostic
- Prior art date
- Legal status (The legal status is an assumption and is not a legal conclusion. Google has not performed a legal analysis and makes no representation as to the accuracy of the status listed.)
- Expired - Lifetime
Links
- 238000005259 measurement Methods 0.000 title description 8
- 238000000034 method Methods 0.000 claims description 38
- 238000012549 training Methods 0.000 claims description 19
- 230000003595 spectral effect Effects 0.000 claims description 15
- 238000012544 monitoring process Methods 0.000 claims description 13
- 238000004422 calculation algorithm Methods 0.000 claims description 9
- 238000004891 communication Methods 0.000 claims description 8
- 238000002405 diagnostic procedure Methods 0.000 claims description 4
- 238000004590 computer program Methods 0.000 claims description 2
- 239000012530 fluid Substances 0.000 description 42
- 238000001228 spectrum Methods 0.000 description 18
- 230000006870 function Effects 0.000 description 11
- 238000010586 diagram Methods 0.000 description 5
- 230000003068 static effect Effects 0.000 description 4
- 230000015556 catabolic process Effects 0.000 description 3
- 238000006731 degradation reaction Methods 0.000 description 3
- 238000003745 diagnosis Methods 0.000 description 3
- 238000012423 maintenance Methods 0.000 description 3
- 238000012545 processing Methods 0.000 description 3
- 238000012935 Averaging Methods 0.000 description 2
- 230000003628 erosive effect Effects 0.000 description 2
- 239000000126 substance Substances 0.000 description 2
- XUIMIQQOPSSXEZ-UHFFFAOYSA-N Silicon Chemical compound [Si] XUIMIQQOPSSXEZ-UHFFFAOYSA-N 0.000 description 1
- 230000002411 adverse Effects 0.000 description 1
- 230000005540 biological transmission Effects 0.000 description 1
- 238000004364 calculation method Methods 0.000 description 1
- 238000012512 characterization method Methods 0.000 description 1
- 238000001514 detection method Methods 0.000 description 1
- 238000012774 diagnostic algorithm Methods 0.000 description 1
- 238000012631 diagnostic technique Methods 0.000 description 1
- 238000005516 engineering process Methods 0.000 description 1
- 238000011156 evaluation Methods 0.000 description 1
- 239000002360 explosive Substances 0.000 description 1
- 239000000835 fiber Substances 0.000 description 1
- 238000007689 inspection Methods 0.000 description 1
- 238000009434 installation Methods 0.000 description 1
- 238000002955 isolation Methods 0.000 description 1
- 239000007788 liquid Substances 0.000 description 1
- 238000004519 manufacturing process Methods 0.000 description 1
- 239000003921 oil Substances 0.000 description 1
- 230000010355 oscillation Effects 0.000 description 1
- 239000003208 petroleum Substances 0.000 description 1
- -1 pulp Substances 0.000 description 1
- 229910052710 silicon Inorganic materials 0.000 description 1
- 239000010703 silicon Substances 0.000 description 1
- 239000002002 slurry Substances 0.000 description 1
- 239000007787 solid Substances 0.000 description 1
- 230000002195 synergetic effect Effects 0.000 description 1
Images


Classifications
-
- G—PHYSICS
- G01—MEASURING; TESTING
- G01F—MEASURING VOLUME, VOLUME FLOW, MASS FLOW OR LIQUID LEVEL; METERING BY VOLUME
- G01F1/00—Measuring the volume flow or mass flow of fluid or fluent solid material wherein the fluid passes through a meter in a continuous flow
- G01F1/05—Measuring the volume flow or mass flow of fluid or fluent solid material wherein the fluid passes through a meter in a continuous flow by using mechanical effects
- G01F1/34—Measuring the volume flow or mass flow of fluid or fluent solid material wherein the fluid passes through a meter in a continuous flow by using mechanical effects by measuring pressure or differential pressure
- G01F1/50—Correcting or compensating means
Definitions
- Fluid flow meters are used in industrial process control environments to measure fluid flow and provide flow signals for flow indicators and controllers.
- Inferential flow meters measure fluid flow in a pipe by measuring a pressure drop near a discontinuity within the pipe.
- the discontinuity primary element
- the discontinuity can be an orifice, a nozzle, a venturi, a pitot tube, a vortex shedding bar, a target or even a simple bend in the pipe.
- Flow around the discontinuity causes both a pressure drop and increased turbulence.
- the pressure drop is sensed by a pressure transmitter (secondary element) placed outside the pipe and connected by impulse lines or impulse passageways to the fluid in the pipe. Reliability depends on maintaining a correct calibration. Erosion or buildup of solids on the primary element can change the calibration. Impulse lines can become plugged over time, which also adversely affects calibration.
- Disassembly and inspection of the impulse lines is one method used to detect and correct plugging of lines.
- Another known method for detecting plugging is to periodically add a "check pulse" to the measurement signal from a pressure transmitter. This check pulse causes a control system connected to the transmitter to disturb the flow. If the pressure transmitter fails to accurately sense the flow disturbance, an alarm signal is generated indicating line plugging.
- Another known method for detecting plugging is sensing of both static and differential pressures. If there is inadequate correlation between oscillations in the static and differential pressures, then an alarm signal is generated indicating line plugging.
- Still another known method for detecting line plugging is to sense static pressures and pass them through high pass and low pass filters. Noise signals obtained from the filters are compared to a threshold, and if variance in the noise is less than the threshold, then an alarm signal indicates that the line is blocked.
- EP-A-0,807,804 describes a method for calibrating a differential pressure fluid measuring system. This document teaches providing a synergistic method of obtaining higher measurement accuracy by calibrating the assembled combination of primary and secondary system elements with actual reference to fluid flow. Additionally, this reference teaches characterizing a differential pressure transmitter and subsequently using the stored data obtained during characterization in order to reduce or eliminate measurement errors.
- the present invention resides in a pressure transmitter according to Claim 1, a diagnostic method according to Claim 7 and a computer program product according to Claim 8.
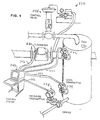
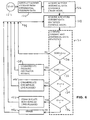
- process variable transmitters such as flow meter 230, level transmitters 232, 234 on tank 236 and integral orifice flow meter 238 are shown connected to control system 240.
- Process variable transmitters can be configured to monitor one or more process variables associated with fluids in a process plant such as slurries, liquids, vapors and gasses in chemical, pulp, petroleum, gas, pharmaceutical, food and other fluid processing plants.
- the monitored process variables can be pressure, temperature, flow, level, pH, conductivity, turbidity, density, concentration, chemical composition or other properties of fluids.
- Process variable transmitter includes one or more sensors that can be either internal to the transmitter or external to the transmitter, depending on the installation needs of the process plant.
- Process variable transmitters generate one or more transmitter outputs that represent the sensed process variable.
- Transmitter outputs are configured for transmission over long distances to a controller or indicator via communication busses 242.
- a communication buss 242 can be a 4-20 mA current loop that powers the transmitter, or a fieldbus connection, a HART protocol communication or a fiber optic connection to a controller, a control system or a readout.
- power In transmitters powered by a 2 wire loop, power must be kept low to provide intrinsic safety in explosive atmospheres.
- integral orifice flow meter 238 is provided with a diagnostic output which is also coupled along the communication bus 242 connected to it.
- Control system 240 can be programmed to display the diagnostic output for a human operator, or can be programmed to alter its operation when there is a diagnostic warning from flow meter 238.
- Control system 240 controls the operation of output devices such as control valve 244, pump motors or other controlling devices.
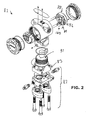
- Transmitter 82 includes a flange 83 for receiving a differential pressure, a differential pressure sensor 31, electronics including an analog to digital converter 84, a microprocessor system 88, a digital to analog converter 96, and a digital communications circuit 100.
- Transmitter 82 is bolted to flange adapter 87.
- Microprocessor 88 is programmed with diagnostic algorithms as explained by examples shown in FIGS. 3, 6, 14 and 15.
- Flange adapter 87 connects to impulse pipes which, in turn, connect to flow around a primary flow element (not shown in FIG. 2). The arrangement of transmitter 82 of FIG. 2 is explained in more detail in FIG. 3.
- Fluid flow meter 80 includes a pressure generator 26 that includes a primary element 28 and impulse lines 30 that couple pressures generated in the fluid flow around the primary element 28 to a differential pressure sensor 31 in a pressure transmitter 82.
- the term "pressure generator” as used in this application means a primary element (e.g., an orifice plate, a pitot tube, a nozzle, a venturi, a shedding bar, a bend in a pipe or other flow discontinuity adapted to cause a pressure drop in flow) together with impulse pipes or impulse passageways that couple the pressure drop from locations near the primary element to a location outside the flow pipe.
- the spectral and statistical characteristics of this pressure presented by this defined "pressure generator" at a location outside the flow pipe to a connected pressure transmitter 82 can be affected by the condition of the primary element as well as on the condition of the impulse pipes.
- the connected pressure transmitter 82 can be a self-contained unit, or it can be fitted with remote seals as needed to fit the application.
- a flange 83 on the pressure transmitter 82 (or its remote seals) couples to a flange adapter 87 on the impulse lines 30 to complete the pressure connections.
- Pressure transmitter 82 couples to a primary flow element 28 via impulse lines 30 to sense flow.
- the pressure transmitter 82 comprises a differential pressure sensor 31 adapted to couple to the impulse lines 30 via a flange arrangement.
- An analog to digital converter 84 couples to the pressure sensor 31 and generates a series of digital representations of the sensed pressure at 86.
- a microprocessor system 88 receives the series of digital representations of pressure at 86 and has a first algorithm 90 stored therein calculating a difference between the series of digital representations 86 and a moving average of the series of digital representations.
- a second algorithm 92 is also stored in the microprocessor system 88 that receives the difference calculated by algorithm 90 and calculates a trained data set of historical data during a training mode and calculates a current data set during a monitoring mode and generates diagnostic data 94 as a function of the current data set relative to the historical data indicating changes in the condition of pressure generator 26.
- a digital to analog converter 96 coupled to the microprocessor system 88 generates an analog transmitter output 98 indicative of the sensed flow rate.
- a digital communication circuit 100 receives the diagnostic data 94 from the microprocessor system 88 and generates a transmitter output 102 indicating the diagnostic data.
- the analog output 98 and the diagnostic data 102 can be coupled to indicators or controllers as desired.
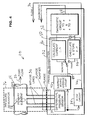
- FIG. 4 a block diagram shows a further embodiment of a fluid flow meter 20 adapted to sense fluid flow 22 in pipe 24.
- the fluid flow meter 20 in FIG. 4 is similar to the fluid flow meters 80 of FIG. 3 and the same reference numerals used in FIGS. 3 are also used in FIG. 4 for similar elements.
- Fluid flow meter 20 includes a pressure generator 26 that includes a primary element 28 and impulse lines 30 that couple pressures generated in the fluid flow around the primary element 28 to a differential pressure sensor 31 in a pressure transmitter 32.
- the pressure transmitter 32 can be a self-contained unit, or it can be fitted with remote seals as needed to fit the application.
- a flange on the pressure transmitter 32 (or its remote seals) couples to a flange adapter on the impulse lines 30 to complete the pressure connections.
- a flow circuit 34 in the pressure transmitter 32 couples to the sensor 31 and generates a flow rate output 36 that can couple to a controller or indicator as needed.
- a difference circuit 42 couples to the sensor 31 and generates data at a difference output 44 representing the sensed pressure minus a moving average.
- a calculate circuit 46 receives the difference output 44 and calculates a trained output 48 of historical data obtained during a training mode or time interval. After training, calculate circuit 46 calculates a monitor output 50 of current data obtained during a monitoring mode or normal operation time of the fluid flow meter 20.
- a diagnostic circuit 52 receives the trained output 48 and the monitor output 50 and generating a diagnostic output 54 indicating a current condition of the pressure generator 26 relative to an historical condition.
- calculate circuit 46 stores the historical data in circuit 56 which includes memory.
- the historical data comprises statistical data, for example, the mean ( ⁇ ) and standard deviation ( ⁇ ) of the difference output or other statistical measurements, and the diagnostic output 54 indicates impulse line plugging.
- the calculate circuit 46 switches between a training mode when it is installed and a monitoring mode when it is in use measuring flow.
- the calculate circuit 46 stores historical data in the training mode.
- the diagnostic output 54 indicates a real time condition of the pressure generator 26.
- statistical data such as the mean ⁇ and standard deviation ⁇
- the corresponding sample statistical data such as sample mean X and sample standard deviation s, are calculated from a relatively smaller number of data points.
- hundreds of data points are used to calculate statistical data such as ⁇ and ⁇ , while only about 10 data points are used to calculate sample statistical data such as X and s.
- the number of data points during monitoring is kept smaller in order to provide diagnostics that is real time, or completed in about 1 second.
- Diagnostic circuit 52 indicates line plugging if the sample standard deviation s deviates from the standard deviation ⁇ by a preset amount, for example 10%.
- a fluid flow meter 60 that diagnoses the condition of the primary element 28.
- the fluid flow meter 60 in FIG. 5 is similar to the fluid flow meter 20 of FIG. 4 and the same reference numerals used in FIG. 4 are also used in 5 for similar elements.
- the diagnostic output 62 indicates a condition of the primary element 28, while in FIG. 4, the diagnostic output indicates a condition of the impulse lines 30.
- calculate circuit 46 calculates and stores data on power spectral density (PSD) of the difference output 44 rather than statistical data which is used in FIG. 4.
- PSD power spectral density
- the power spectral density data is preferably in the range of 0 to 100 Hertz.
- the center frequency of a bandpass filter can be swept across a selected range of frequencies to generate a continuous or quasi-continuous power spectral density as a function of frequency in a manner that is well known. Various known Fourier transforms can be used.
- Power spectral density, Fi can also be calculated using Welch's method of averaged periodograms for a given data set.
- a front end filter with a filter frequency less than fs /2 is used to reduce aliasing in the spectral calculations.
- the data set is divided into F k,i as shown in Eq.
- F k , i ( 1 / M )
- ⁇ n 1 M x k ( n ) e - j 2 ⁇ i ⁇ f n
- F k,i ( 1 / M )
- ⁇ n 1 M x k ( n ) e - j 2 ⁇ i ⁇ f n
- F k,i ( 1 / M )
- ⁇ n 1 M x k ( n ) e - j 2 ⁇ i ⁇ f n
- this sequence is stored in memory, preferably EEPROM, as the baseline power spectrum for
- Fi is thus the power spectrum sequence and i goes from 1 to N which is the total number of points in the original data sequence.
- N usually a power of 2
- Fi is also known as the signal strength at the i th frequency.
- the power spectrum typically includes a large number points at predefined frequency intervals, defining a shape of the spectral power distribution as a function of frequency.
- a relatively larger sample of the spectral density at baseline historical conditions and a relatively smaller sample of the spectral density at monitoring conditions are compared.
- the relatively smaller sample allows for a real time indication of problems in about 1 second.
- An increase in the related frequency components of the power spectrum can indicate the degradation of the primary element.
- orifice plates as primary elements for example, changes as high as 10% are observed in spectral components when the orifice plate is degraded to a predetermined level.
- the amount of change can be adjusted as needed, depending on the tolerable amount of degradation and the type of primary element in use.
- the amount of change needed to indicate a problem is arrived at experimentally for each type of primary element arrangement. Fuzzy logic can also be used to compare the many points of the power spectrums.
- FIG. 6 a flow chart 120 of a method of diagnosis performed in a pressure transmitter couplable to a primary flow element via impulse lines is shown.
- the algorithm starts at 122.
- a moving average is subtracted from differential pressure data as shown at 124 to calculate a difference.
- historical data on the calculated difference is acquired and stored at 126 as statistical data ⁇ and ⁇ , for example.
- current data on the difference is acquired and stored at 128 as statistical data X and s. The smaller sample of current data is compared to the larger sample of the historical data to diagnose the condition of the impulse lines.
- the historical data set comprises statistical data such as data on the mean ( ⁇ ) and standard deviation ( ⁇ ) of the calculated difference;
- the current data set comprises current sample statistical data, such as the sample average ( X ) and sample deviation (s) of the calculated difference.
- sample deviation (s) is compared to the standard deviation ( ⁇ ) to diagnose impulse line plugging, for example.
- standard deviation Other known statistical measures of uncertainty, or statistical measures developed experimentally to fit this application can also be used besides mean and standard deviation.
- the diagnostics can be temporarily suspended as shown at 130 until usual flow conditions are reestablished. This helps to prevent false alarm indications.
- the transmitter generates a calibrated output and also a diagnostic output that indicates if the pressure generator is out of calibration.
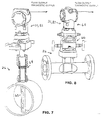
- the primary element can comprise a simple pitot tube or an averaging pitot tube.
- the averaging pitot tube 63 can be inserted through a tap 64 on a pipe as shown in FIG. 7.
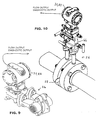
- An instrument manifold 66 as shown in FIG. 8, can be coupled between the pressure generator 26 and a pressure transmitter 68.
- the primary element 28 and impulse pipes 30 can be combined in an integral orifice as shown in FIG. 9.
- An orifice plate adapted for clamping between pipe flanges is shown in FIG. 10.
- the primary element can comprise a venturi as shown in FIG. 11 or a nozzle as shown in FIG.
- a standard arrangement of a pressure generator can be used with a transmitter that is adapted to provide the diagnostics outputs.
- the transmitter adapts itself to the characteristics of the pressure generator during the training mode and has a standard of comparison stored during the training mode that is available for comparison during the monitoring or operational mode.
- the standard of comparison can be adjusted as needed by a technician via the digital communication bus.
- the fluid flow meter provides a calibrated flow rate output and the diagnostic output of the transmitter indicates if the pressure generator is out of calibration.
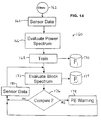
- a flow chart 160 of a process for diagnosing the condition of a primary element is shown.
- the condition of the primary element can include erosion or fouling of the primary element.
- the method or algorithm starts at 162.
- Sensor data is taken in a training mode or time interval as shown at 164.
- a power spectrum of the sensor data, minus the moving average, is calculated at 166.
- the power spectrum obtained is identified as the training power spectrum at 168 and stored in non-volatile memory 170.
- the process moves on to monitoring or normal use.
- a further power spectrum of current sensor data, minus the moving average, is evaluated at 172, and the power spectrum so obtained in stored in memory 174, that can be either RAM or nonvolatile memory.
- the power spectrum Fi obtained during training is compared to the power spectrum Fi obtained during monitoring. If there is a significant difference between Fi and Fi which is indicative of a problem with the primary element, a primary element warning (PE Warning) is generated as shown at 178. If the power spectrums Fi and Fi are sufficiently similar, then no primary element warning is generated.
- program flow moves to obtain new real time sensor data at 180 and the monitoring process moves on to a new evaluation at 172, or the flow meter can shut down when there is a PE warning.
- the process 160 can loop continuously in the monitoring mode to provide real time information concerning the condition of the primary element.
- a flow chart illustrates a process 190 which provides diagnosis of both primary element (PE) and impulse lines (IL).
- Program flow starts at 200.
- sensor data minus a moving average, is obtained and training power spectrum and training statistics are stored in nonvolatile memory as explained above.
- impulse line diagnostics (such as those explained in process 128 in Fig. 6) are performed at step 204 in FIG. 15.
- current impulse line statistics are compared to historical (training) impulse line statistics (as detailed in processes 130, 132, 134, 136 in FIG. 6) at 206. If the comparison indicates a problem with plugging of impulse lines, then an impulse line warning is generated as shown at 208.
- program flow moves on to primary element (PE) diagnostics at 210.
- PE primary element
- power spectral density for the current real time data is calculated (as explained above in connection with FIG. 14).
- the current power spectral density is compared to the historical power spectral density at 212, and if there is a difference large enough to indicate a problem with the primary element, then a PE Warning is generated as shown at 214. If the differences in the power spectral densities are small, then no PE warning is generated as shown at 216.
- Program flow continues on at 218 to repeat the IL and PE diagnostics, or the flow meter can be shut down if there is a PE or IL warning until maintenance is performed.
- Any of the methods can be stored on a computer-readable medium as a plurality of sequences of instructions, the plurality of sequences of instructions including sequences that, when executed by a microprocessor system in a pressure transmitter cause the pressure transmitter to perform a diagnostic method relative to a primary element and impulse lines couplable to the transmitter.
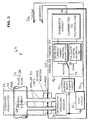
- FIG. 16 illustrates a transmitter 230 which includes remote seals 232, 234 connected by flexible capillary tubes 236, 238 that are filled with a controlled quantity of isolation fluid such as silicon oil.
- the isolator arrangement permits placement of the sensor and electronics of transmitter 230 to be spaced away from extremely hot process fluids which contact the remote seals.
- the diagnostic circuitry of transmitter 230 can also be used to detect leaking and pinching off of capillary tubes 236, 238 using the diagnostic techniques described above to provide diagnostic output 239.
- FIG. 17 schematically illustrates a transmitter 240 which is connected to taps 248, 250 near the bottom and top of tank 242.
- Transmitter 240 provides an output 244 that represents a time integral of flow in and out of the tank 242.
- Transmitter 240 includes circuitry, or alternatively software, that measures the differential pressure between the taps 248, 250 and computes the integrated flow as a function of the sensed differential pressure and a formula stored in the transmitter relating the sensed pressure to the quantity of fluid in the tank. This formula is typically called a strapping function and the quantity of fluid which has flowed into or out of the tank can be integrated as either volumetric or mass flow, depending on the strapping function stored in transmitter 240.
- the diagnostic circuitry or software in transmitter 240 operates as explained above to provide diagnostic output 252.
- transmitter 240 can be located either near the bottom or the top of tank 242, with a tube going to the other end of the tank, often called a "leg.”
- This leg can be either a wet leg filled with the fluid in the tank, or a dry leg filled with gas. Remote seals can also be used with transmitter 240.
- circuit elements may not be partitioned into separate blocks as shown, but components used for various functional blocks can be intermingled and shared. Likewise with software, some instructions can be shared as part of several functions and be intermingled with unrelated instructions within the scope of the invention.
Landscapes
- Physics & Mathematics (AREA)
- Fluid Mechanics (AREA)
- General Physics & Mathematics (AREA)
- Measuring Volume Flow (AREA)
Applications Claiming Priority (3)
| Application Number | Priority Date | Filing Date | Title |
|---|---|---|---|
| US25789699A | 1999-02-25 | 1999-02-25 | |
| US257896 | 1999-02-25 | ||
| PCT/US2000/004978 WO2000050851A1 (en) | 1999-02-25 | 2000-02-24 | Flow measurement with diagnostics |
Publications (2)
| Publication Number | Publication Date |
|---|---|
| EP1155289A1 EP1155289A1 (en) | 2001-11-21 |
| EP1155289B1 true EP1155289B1 (en) | 2006-07-05 |
Family
ID=22978242
Family Applications (1)
| Application Number | Title | Priority Date | Filing Date |
|---|---|---|---|
| EP00913631A Expired - Lifetime EP1155289B1 (en) | 1999-02-25 | 2000-02-24 | Flow measurement with diagnostics |
Country Status (9)
| Country | Link |
|---|---|
| EP (1) | EP1155289B1 (enExample) |
| JP (1) | JP4948707B2 (enExample) |
| KR (1) | KR100683511B1 (enExample) |
| CN (1) | CN1183374C (enExample) |
| AU (1) | AU3504000A (enExample) |
| BR (1) | BR0008534B1 (enExample) |
| CA (1) | CA2362631A1 (enExample) |
| DE (1) | DE60029196T2 (enExample) |
| WO (1) | WO2000050851A1 (enExample) |
Families Citing this family (51)
| Publication number | Priority date | Publication date | Assignee | Title |
|---|---|---|---|---|
| US8290721B2 (en) * | 1996-03-28 | 2012-10-16 | Rosemount Inc. | Flow measurement diagnostics |
| US6907383B2 (en) * | 1996-03-28 | 2005-06-14 | Rosemount Inc. | Flow diagnostic system |
| US7949495B2 (en) * | 1996-03-28 | 2011-05-24 | Rosemount, Inc. | Process variable transmitter with diagnostics |
| US7630861B2 (en) | 1996-03-28 | 2009-12-08 | Rosemount Inc. | Dedicated process diagnostic device |
| US7623932B2 (en) | 1996-03-28 | 2009-11-24 | Fisher-Rosemount Systems, Inc. | Rule set for root cause diagnostics |
| US8044793B2 (en) | 2001-03-01 | 2011-10-25 | Fisher-Rosemount Systems, Inc. | Integrated device alerts in a process control system |
| US7206646B2 (en) | 1999-02-22 | 2007-04-17 | Fisher-Rosemount Systems, Inc. | Method and apparatus for performing a function in a plant using process performance monitoring with process equipment monitoring and control |
| US7346404B2 (en) | 2001-03-01 | 2008-03-18 | Fisher-Rosemount Systems, Inc. | Data sharing in a process plant |
| US7562135B2 (en) | 2000-05-23 | 2009-07-14 | Fisher-Rosemount Systems, Inc. | Enhanced fieldbus device alerts in a process control system |
| US8073967B2 (en) | 2002-04-15 | 2011-12-06 | Fisher-Rosemount Systems, Inc. | Web services-based communications for use with process control systems |
| DE10153687A1 (de) * | 2001-10-31 | 2003-05-15 | Elster Gmbh | Durchfluss-Messgerät |
| US7523667B2 (en) * | 2003-12-23 | 2009-04-28 | Rosemount Inc. | Diagnostics of impulse piping in an industrial process |
| EP1711681B1 (en) * | 2004-02-05 | 2008-09-03 | Rosemount, Inc. | Annulus plugging detection using a pressure transmitter in gas-lift oil production |
| WO2006086894A1 (en) * | 2005-02-15 | 2006-08-24 | Abb Research Ltd | Diagnostic device for a process control system |
| US9201420B2 (en) | 2005-04-08 | 2015-12-01 | Rosemount, Inc. | Method and apparatus for performing a function in a process plant using monitoring data with criticality evaluation data |
| US7272531B2 (en) | 2005-09-20 | 2007-09-18 | Fisher-Rosemount Systems, Inc. | Aggregation of asset use indices within a process plant |
| WO2007084652A2 (en) * | 2006-01-18 | 2007-07-26 | Rosemount Inc. | Wet gas indication using a process fluid differential pressure transmitter |
| US8788070B2 (en) | 2006-09-26 | 2014-07-22 | Rosemount Inc. | Automatic field device service adviser |
| CN101802314B (zh) * | 2007-07-20 | 2013-05-29 | 罗斯蒙德公司 | 过程流体脉动的差压诊断 |
| US8898036B2 (en) | 2007-08-06 | 2014-11-25 | Rosemount Inc. | Process variable transmitter with acceleration sensor |
| US8055479B2 (en) * | 2007-10-10 | 2011-11-08 | Fisher-Rosemount Systems, Inc. | Simplified algorithm for abnormal situation prevention in load following applications including plugged line diagnostics in a dynamic process |
| US8639464B2 (en) | 2008-01-18 | 2014-01-28 | Dresser, Inc. | Flow meter diagnostic processing |
| JP5552734B2 (ja) * | 2008-11-17 | 2014-07-16 | 新日鐵住金株式会社 | 混練物の製造装置 |
| US8448525B2 (en) * | 2011-03-03 | 2013-05-28 | Rosemount Inc. | Differential pressure based flow measurement |
| US9207670B2 (en) | 2011-03-21 | 2015-12-08 | Rosemount Inc. | Degrading sensor detection implemented within a transmitter |
| US9927788B2 (en) | 2011-05-19 | 2018-03-27 | Fisher-Rosemount Systems, Inc. | Software lockout coordination between a process control system and an asset management system |
| US9052240B2 (en) | 2012-06-29 | 2015-06-09 | Rosemount Inc. | Industrial process temperature transmitter with sensor stress diagnostics |
| JP5891139B2 (ja) * | 2012-07-18 | 2016-03-22 | アズビル株式会社 | 導圧管の詰まり診断装置および詰まり診断方法 |
| US9602122B2 (en) | 2012-09-28 | 2017-03-21 | Rosemount Inc. | Process variable measurement noise diagnostic |
| US8845940B2 (en) | 2012-10-25 | 2014-09-30 | Carboncure Technologies Inc. | Carbon dioxide treatment of concrete upstream from product mold |
| ES2921859T3 (es) * | 2012-11-30 | 2022-09-01 | Ip2Ipo Innovations Ltd | Un dispositivo, procedimiento y sistema para monitorizar una red de conductos de transporte de fluidos |
| WO2014121198A1 (en) | 2013-02-04 | 2014-08-07 | Coldcrete, Inc. | System and method of applying carbon dioxide during the production of concrete |
| US9157775B2 (en) | 2013-03-15 | 2015-10-13 | Rosemount Inc. | Flowmeter for measuring flow of a process fluid through a conduit including process variable sensors mounted on a pitot tube |
| DE102014005399A1 (de) * | 2013-04-24 | 2014-10-30 | Marquardt Mechatronik Gmbh | Anordnung zur Füllstandsmessung |
| US9388072B2 (en) | 2013-06-25 | 2016-07-12 | Carboncure Technologies Inc. | Methods and compositions for concrete production |
| US10927042B2 (en) | 2013-06-25 | 2021-02-23 | Carboncure Technologies, Inc. | Methods and compositions for concrete production |
| US9108883B2 (en) | 2013-06-25 | 2015-08-18 | Carboncure Technologies, Inc. | Apparatus for carbonation of a cement mix |
| US9376345B2 (en) | 2013-06-25 | 2016-06-28 | Carboncure Technologies Inc. | Methods for delivery of carbon dioxide to a flowable concrete mix |
| US20160107939A1 (en) | 2014-04-09 | 2016-04-21 | Carboncure Technologies Inc. | Methods and compositions for concrete production |
| CN103736184B (zh) * | 2013-12-13 | 2016-01-13 | 科迈(常州)电子有限公司 | 一种家用呼吸机流量传感器纠错方法 |
| WO2015123769A1 (en) | 2014-02-18 | 2015-08-27 | Carboncure Technologies, Inc. | Carbonation of cement mixes |
| EP3129126A4 (en) | 2014-04-07 | 2018-11-21 | Carboncure Technologies Inc. | Integrated carbon dioxide capture |
| EP3129753B1 (en) * | 2014-04-09 | 2019-06-05 | Carboncure Technologies Inc. | Compositions and methods for delivery of carbon dioxide |
| US20160047681A1 (en) * | 2014-08-15 | 2016-02-18 | Honeywell International Inc. | Fluctuation and phase-based method for detection of plugged impulse lines |
| DE102014119240A1 (de) * | 2014-12-19 | 2016-06-23 | Endress + Hauser Gmbh + Co. Kg | Durchflussmessanordnung nach dem Differenzdruckmessprinzip zur Messung eines Durchflusses eines Mediums |
| EP3442761B1 (en) | 2016-04-11 | 2025-12-10 | Carboncure Technologies Inc. | Method of preparing a concrete mix |
| MX2019015651A (es) | 2017-06-20 | 2020-08-03 | Carboncure Tech Inc | Métodos y composiciones para tratamiento de agua de lavado de concreto. |
| CA3100199C (en) | 2018-05-14 | 2023-10-17 | Giner Life Sciences, Inc. | System and method for controlling oxygen delivery to implanted cells |
| WO2020217232A1 (en) | 2019-04-26 | 2020-10-29 | Carboncure Technologies Inc. | Carbonation of concrete aggregates |
| CN116519095A (zh) * | 2023-03-01 | 2023-08-01 | 重庆川仪自动化股份有限公司 | 一种仪表状态诊断及响应方法、装置、设备及存储介质 |
| EP4474776B1 (de) * | 2023-06-07 | 2025-06-04 | Siemens Aktiengesellschaft | Diagnoseverfahren für eine durchflussmessvorrichtung mit wirkdruckleitung mit vibrationsmessungsierung |
Family Cites Families (8)
| Publication number | Priority date | Publication date | Assignee | Title |
|---|---|---|---|---|
| US4654813A (en) * | 1984-03-09 | 1987-03-31 | Southern Gas Association | Electronic square root error indicator |
| US5347843A (en) * | 1992-09-23 | 1994-09-20 | Korr Medical Technologies Inc. | Differential pressure flowmeter with enhanced signal processing for respiratory flow measurement |
| JP3139597B2 (ja) * | 1994-04-27 | 2001-03-05 | 横河電機株式会社 | 圧力測定装置における導圧管の詰まり診断装置 |
| JP3129121B2 (ja) * | 1994-11-10 | 2001-01-29 | 横河電機株式会社 | 管路閉塞検出装置 |
| JP3180182B2 (ja) * | 1995-08-31 | 2001-06-25 | 株式会社山武 | 配管異常検出方法 |
| US5710370A (en) * | 1996-05-17 | 1998-01-20 | Dieterich Technology Holding Corp. | Method for calibrating a differential pressure fluid flow measuring system |
| JP3223501B2 (ja) * | 1996-06-17 | 2001-10-29 | 横河電機株式会社 | 差圧測定装置 |
| US5680109A (en) * | 1996-06-21 | 1997-10-21 | The Foxboro Company | Impulse line blockage detector systems and methods |
-
2000
- 2000-02-24 DE DE60029196T patent/DE60029196T2/de not_active Expired - Lifetime
- 2000-02-24 JP JP2000601401A patent/JP4948707B2/ja not_active Expired - Fee Related
- 2000-02-24 BR BRPI0008534-0B1A patent/BR0008534B1/pt not_active IP Right Cessation
- 2000-02-24 EP EP00913631A patent/EP1155289B1/en not_active Expired - Lifetime
- 2000-02-24 CN CNB00805410XA patent/CN1183374C/zh not_active Expired - Fee Related
- 2000-02-24 WO PCT/US2000/004978 patent/WO2000050851A1/en not_active Ceased
- 2000-02-24 AU AU35040/00A patent/AU3504000A/en not_active Abandoned
- 2000-02-24 KR KR1020017010915A patent/KR100683511B1/ko not_active Expired - Fee Related
- 2000-02-24 CA CA002362631A patent/CA2362631A1/en not_active Abandoned
Also Published As
| Publication number | Publication date |
|---|---|
| DE60029196T2 (de) | 2007-06-28 |
| WO2000050851A1 (en) | 2000-08-31 |
| KR20020001745A (ko) | 2002-01-09 |
| BR0008534B1 (pt) | 2013-06-11 |
| AU3504000A (en) | 2000-09-14 |
| EP1155289A1 (en) | 2001-11-21 |
| JP4948707B2 (ja) | 2012-06-06 |
| CN1346435A (zh) | 2002-04-24 |
| CN1183374C (zh) | 2005-01-05 |
| KR100683511B1 (ko) | 2007-02-16 |
| DE60029196D1 (de) | 2006-08-17 |
| WO2000050851A9 (en) | 2002-03-28 |
| JP2002538420A (ja) | 2002-11-12 |
| BR0008534A (pt) | 2002-04-16 |
| CA2362631A1 (en) | 2000-08-31 |
Similar Documents
| Publication | Publication Date | Title |
|---|---|---|
| EP1155289B1 (en) | Flow measurement with diagnostics | |
| US6654697B1 (en) | Flow measurement with diagnostics | |
| US7254518B2 (en) | Pressure transmitter with diagnostics | |
| US6907383B2 (en) | Flow diagnostic system | |
| US7949495B2 (en) | Process variable transmitter with diagnostics | |
| US8290721B2 (en) | Flow measurement diagnostics | |
| EP1668333B1 (en) | Calibration of a process pressure sensor | |
| EP3781911B1 (en) | Vortex flowmeter with flow instability detection | |
| JPH08247900A (ja) | 流量制御設備の異常診断装置 | |
| UA71492A (uk) | Пристрій оперативного експрес-контролю лічильників природного газу |
Legal Events
| Date | Code | Title | Description |
|---|---|---|---|
| PUAI | Public reference made under article 153(3) epc to a published international application that has entered the european phase |
Free format text: ORIGINAL CODE: 0009012 |
|
| 17P | Request for examination filed |
Effective date: 20010904 |
|
| AK | Designated contracting states |
Kind code of ref document: A1 Designated state(s): AT BE CH CY DE DK ES FI FR GB GR IE IT LI LU MC NL PT SE |
|
| AX | Request for extension of the european patent |
Free format text: AL;LT;LV;MK;RO;SI |
|
| RIN1 | Information on inventor provided before grant (corrected) |
Inventor name: ERYUREK, EVREN Inventor name: KAVAKLIOGLU, KADIR |
|
| RBV | Designated contracting states (corrected) |
Designated state(s): DE FR GB IT NL |
|
| 17Q | First examination report despatched |
Effective date: 20040604 |
|
| GRAP | Despatch of communication of intention to grant a patent |
Free format text: ORIGINAL CODE: EPIDOSNIGR1 |
|
| GRAS | Grant fee paid |
Free format text: ORIGINAL CODE: EPIDOSNIGR3 |
|
| GRAA | (expected) grant |
Free format text: ORIGINAL CODE: 0009210 |
|
| AK | Designated contracting states |
Kind code of ref document: B1 Designated state(s): DE FR GB IT NL |
|
| PG25 | Lapsed in a contracting state [announced via postgrant information from national office to epo] |
Ref country code: IT Free format text: LAPSE BECAUSE OF FAILURE TO SUBMIT A TRANSLATION OF THE DESCRIPTION OR TO PAY THE FEE WITHIN THE PRESCRIBED TIME-LIMIT;WARNING: LAPSES OF ITALIAN PATENTS WITH EFFECTIVE DATE BEFORE 2007 MAY HAVE OCCURRED AT ANY TIME BEFORE 2007. THE CORRECT EFFECTIVE DATE MAY BE DIFFERENT FROM THE ONE RECORDED. Effective date: 20060705 |
|
| REG | Reference to a national code |
Ref country code: GB Ref legal event code: FG4D |
|
| REF | Corresponds to: |
Ref document number: 60029196 Country of ref document: DE Date of ref document: 20060817 Kind code of ref document: P |
|
| ET | Fr: translation filed | ||
| PLBE | No opposition filed within time limit |
Free format text: ORIGINAL CODE: 0009261 |
|
| STAA | Information on the status of an ep patent application or granted ep patent |
Free format text: STATUS: NO OPPOSITION FILED WITHIN TIME LIMIT |
|
| 26N | No opposition filed |
Effective date: 20070410 |
|
| PGFP | Annual fee paid to national office [announced via postgrant information from national office to epo] |
Ref country code: IT Payment date: 20080226 Year of fee payment: 9 Ref country code: NL Payment date: 20080224 Year of fee payment: 9 |
|
| NLV4 | Nl: lapsed or anulled due to non-payment of the annual fee |
Effective date: 20090901 |
|
| PG25 | Lapsed in a contracting state [announced via postgrant information from national office to epo] |
Ref country code: NL Free format text: LAPSE BECAUSE OF NON-PAYMENT OF DUE FEES Effective date: 20090901 |
|
| PG25 | Lapsed in a contracting state [announced via postgrant information from national office to epo] |
Ref country code: IT Free format text: LAPSE BECAUSE OF NON-PAYMENT OF DUE FEES Effective date: 20090224 |
|
| PGFP | Annual fee paid to national office [announced via postgrant information from national office to epo] |
Ref country code: FR Payment date: 20110309 Year of fee payment: 12 |
|
| PGFP | Annual fee paid to national office [announced via postgrant information from national office to epo] |
Ref country code: GB Payment date: 20110223 Year of fee payment: 12 |
|
| GBPC | Gb: european patent ceased through non-payment of renewal fee |
Effective date: 20120224 |
|
| REG | Reference to a national code |
Ref country code: FR Ref legal event code: ST Effective date: 20121031 |
|
| PG25 | Lapsed in a contracting state [announced via postgrant information from national office to epo] |
Ref country code: FR Free format text: LAPSE BECAUSE OF NON-PAYMENT OF DUE FEES Effective date: 20120229 Ref country code: GB Free format text: LAPSE BECAUSE OF NON-PAYMENT OF DUE FEES Effective date: 20120224 |
|
| PGFP | Annual fee paid to national office [announced via postgrant information from national office to epo] |
Ref country code: DE Payment date: 20180227 Year of fee payment: 19 |
|
| REG | Reference to a national code |
Ref country code: DE Ref legal event code: R119 Ref document number: 60029196 Country of ref document: DE |
|
| PG25 | Lapsed in a contracting state [announced via postgrant information from national office to epo] |
Ref country code: DE Free format text: LAPSE BECAUSE OF NON-PAYMENT OF DUE FEES Effective date: 20190903 |