EP1074958A1 - Traffic congestion measuring method and device and applications thereof - Google Patents
Traffic congestion measuring method and device and applications thereof Download PDFInfo
- Publication number
- EP1074958A1 EP1074958A1 EP00115861A EP00115861A EP1074958A1 EP 1074958 A1 EP1074958 A1 EP 1074958A1 EP 00115861 A EP00115861 A EP 00115861A EP 00115861 A EP00115861 A EP 00115861A EP 1074958 A1 EP1074958 A1 EP 1074958A1
- Authority
- EP
- European Patent Office
- Prior art keywords
- congestion
- information
- virtual plane
- degree
- cameras
- Prior art date
- Legal status (The legal status is an assumption and is not a legal conclusion. Google has not performed a legal analysis and makes no representation as to the accuracy of the status listed.)
- Granted
Links
Images




Classifications
-
- G—PHYSICS
- G08—SIGNALLING
- G08G—TRAFFIC CONTROL SYSTEMS
- G08G1/00—Traffic control systems for road vehicles
- G08G1/01—Detecting movement of traffic to be counted or controlled
- G08G1/04—Detecting movement of traffic to be counted or controlled using optical or ultrasonic detectors
-
- G—PHYSICS
- G06—COMPUTING OR CALCULATING; COUNTING
- G06V—IMAGE OR VIDEO RECOGNITION OR UNDERSTANDING
- G06V20/00—Scenes; Scene-specific elements
- G06V20/50—Context or environment of the image
- G06V20/52—Surveillance or monitoring of activities, e.g. for recognising suspicious objects
Definitions
- the invention relates to a method of and a system for measuring the degree of human or vehicle traffic congestion by using three-dimensional information in a monitor space, and to applications thereof.
- An image recognition system which measure the degree of congestion in a monitor space is disclosed in a Japanese patent application No. Hei10-339,206, filed November 30, 1998, and assigned to the present assignee.
- the system measures the degree of congestion on the basis of the area where the brightness has changed or the number of pixels the brightness of which has changed by detecting time-based changes in the brightness of a video signal through the calculation of a frame difference or background difference. That is, the system judges the degree of congestion to be higher if the brightness-changed area is relatively large and lower if the brightness-changed area is relatively small. Since the system basically detects time-based changes, if a headlight from a vehicle or the shadow of a flying bird or airplane happens to fall into the monitor space, then they will be detected as brightness changes in the system.
- the system is so configured as not to use the brightness-changed area calculated every video frame, as it is, for the judgement of the degree of congestion. Instead, the system is so configured as to use the average or the median of brightness-changed areas calculated for some frames.
- Existing traffic control systems are controlled according to information obtained by detecting whether any vehicle is waiting for a signal with a supersonic vehicle detector provided near the signal and/or information on the state of a push button switch for pedestrians.
- information on the degree of human or vehicle congestion is not used in operation, the operation is not so optimized as to enable jostling vehicles and/or people to flow effectively.
- an existing toll system provided along a toll road usually includes a plurality of tollgates.
- an attendant judges the degree of vehicle congestion near the toll system by viewing with the eye. If the attendant judges the degree of vehicle congestion to be higher, then he or she opens the more tollgates.
- the gates furnished at the entrance to a parking lot of, for example, an amusement park are controlled in the same manner. These gates are not controlled automatically according to the degree of congestion at each gate.
- the buses and the trains are serviced according to time schedules. It is desirable to control the bus or train operation by utilizing information on the degree of congestion at each of predetermined stops or stations.
- congestion information is collected from taxi drivers via radio, and the dispatcher allocates cars to cabstands or cab zones which are crowded with taxi-waiting people according to the collected congestion information. In this case, it is desirable to collect the congestion information automatically from predetermined cab zones.
- the invention has been made to solve the above and other problems and makes it an object to provide a congestion measuring method and a congestion measuring device which is not only capable of measuring the degree of human or vehicle congestion even when people or vehicles stay still, but also free from influence of brightness changes in a video signal which changes are caused by light or shade falling-in to the monitor space.
- Another object of the invention is to provide various embodiments that incorporate the inventive congestion-measuring device.
- a method of and a system for measuring a degree of congestion in a space covered by a pair of cameras is provided.
- Three-dimensional orthogonal coordinates are defined in the space such that one of the coordinates is parallel with the optical axes of the cameras.
- a value of the parallel coordinate for any point in the space is referred to as "3D information" of the point.
- parts of each of body images which parts exist above a virtual plane set at a predetermined height and within a predetermined height from the virtual plane are detected by using first 3D information and second 3D information of each image unit of the body images.
- the first 3D information is expressed in two-dimensional coordinates on pictures obtained from the cameras.
- the second 3D information is expressed in two-dimensional coordinates defined on the virtual plane.
- the degree of congestion is calculated on the basis of the detected parts.
- the detected parts are projected on the virtual plane. Then, the degree of congestion is founded on the basis of the projected parts on the virtual plane.
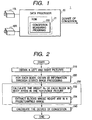
- FIG. 1 is a schematic block diagram showing an exemplary arrangement of an illustrative embodiment of a congestion-measuring device according to the principles of the invention.
- the congestion measuring device 1 comprises a pair of video cameras 10L and 10R which are disposed horizontally apart from each other and directed to a desired monitor space (as shown in FIG. 6) and which provide left and right images or pictures (denoted as 11 and 12 in FIG. 2), respectively, taken-in from the monitor space; and a data processor 20 for processing the left picture and the right picture to provide the degree of congestion as an output.
- the data processor 20 is typically any suitable computer provided with a ROM (read-only memory) 21 that stores congestion measuring programs 200.
- the data processor 20 may be a device including an electronic circuit comprising integrated circuits (not shown), not-shown ASICs (application specific integrated circuits), etc. In this case, the data processor 20 no longer needs ROM 21 because the congestion measuring programs 200 is incorporated in the ASICs.
- FIG. 2 is a flowchart showing, in a simplified manner, an exemplary procedure of measuring the degree of congestion in accordance with a first illustrative embodiment of the invention.
- the procedure is executed in the data processor 20 under the control of a congestion-measuring program 200.
- the data processor 20 on receiving the left picture 11 and the right picture 12 from the respective cameras 10L and 10R (step 210), the data processor 20 first finds 3D information (i.e., x, y and z-coordinates defined in the monitor space) of each of the bodies in the left and right pictures 11 and 12 by means of stereo image processing in 3D (three-dimensional) measurement step 220.
- 3D information i.e., x, y and z-coordinates defined in the monitor space
- the processor 20 extracts or detects blocks in an area (hereinafter, referred to as "body area”) corresponding to a part of each body which part is higher than the virtual plane and lower than a predetermined height from the virtual plane in step 230.
- body area an area corresponding to a part of each body which part is higher than the virtual plane and lower than a predetermined height from the virtual plane in step 230.
- the degree of congestion in the monitor space is calculated based on the detected blocks in step 240.
- 3D information of a point indicates x, y and z-coordinates of the point.
- 3D information is used to mean the z coordinate.
- FIG. 3 is a diagram for describing, in detail, the process executed in the 3D-measurement step 220 of FIG. 2.
- the three-dimensional coordinates defined in the real space or monitor space is denoted by x, y and z.
- the two-dimensional coordinates defined in the left picture 11 by the left camera 10L and the right picture 12 by the right camera 10R are denoted by (X L , Y L ) and (X R , Y R ), respectively.
- the two cameras 10L and 10R may be of different kinds having respective specifications, it is assumed, for the sake of the simplicity of the following description, that the two cameras 10 are of the same kind having the focal distance f.
- the two cameras 10 are so installed that (1) the middle point between the respective projection centers P 10L and P 10R of the cameras 10L and 10R coincides with the origin (O) of the x, y, z-coordinate space or device (hereinafter, referred to as "the 3D-coordinate space"), (2) both of the optical axis of the two cameras 10L and 10R are parallel to the z-axis of the 3D-coordinate space, and (3) both of the Y L -axis and the Y R -axis on the picture planes 11 and 12 are parallel to the y-axis of the 3D-coordinate space.
- the x-axis, the X L -axis and the X R -axis are parallel to each other and exist on an identical plane perpendicular to the pictures 10L and 10R.
- the distance between the respective projection centers P 10L and P 10R of the cameras 10L and 10R is expressed as 2a.
- a (x, y, z)-coordinate space monitored by a pair of cameras 10L and 10R as described above is called "a monitor space”. Accordingly, setting the camera pair 10 is to define the monitor space as described above.
- a point P(x, y, z) in the 3D monitor space which is regarded as a subspace of the 3D-coordinate space, has its images formed as a point P L (X L , Y L ) on the left picture 11 and a point P R (X R , Y R ) on the right picture 12.
- FIG. 4 is a diagram showing examples of left picture 11 and right picture 12 obtained through the arrangement of FIG. 3 for illustrating the just-mentioned method.
- Making the left picture 11 the reference picture the left picture 11 is divided into blocks of m-by-n pixels.
- the right picture 12 is divided into horizontal strips of n scanning lines.
- a matching block 122 which matches the current reference block 112 is found in the right picture 12 by searching an X R -directional range on the strip 121 of the right picture 12 which strip corresponds to the line (or strip) 111 of blocks which include the current reference block 112.
- the X R -directional range is smaller than the X L coordinate of the current reference block 112.
- the parallax d is calculated from the X L coordinate of the current reference block 112 and the X R coordinate of the matching block 122.
- the following expression may be used as an expression for finding a similarity estimating value (C) to determine the matching block 122.
- 3D information in a monitor space can be found by stereo image processing.
- the present invention is not limited to the above-described 3D-measuring methods. There have been proposed various 3D-measuring methods other than described above.
- the invention may be implemented by using, for example, a 3D-measuring method disclosed in Japanese unexamined patent publication No. Hei8-294143 (1996) assigned to the present assignee.
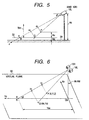
- FIG. 5 is a diagram showing the way of extracting a body area for a person or vehicle in a monitor space from 3D information in the monitor space and 3D information in a virtual plane set in the 3D monitor space.
- the cameras 10L and 10R are so set as to cover a desired monitor space (not shown).
- Numeral 30 denotes the ground or the floor that defines the bottom of the monitor space; and
- numeral 32 denotes a virtual plane which is set at a height of Hd from the ground 30 and parallel to the ground 30.
- the cameras 10 are set at a height of Hc from the ground 30 with an angle ⁇ of depression.
- a point R(0, 0, z r ) is an intersecting point at which the z-axis intersects the virtual plane 32.
- the monitor space causes the monitor space to be set so that the z axis of the monitor space runs through the middle point of the two cameras 10L and 10R and in parallel with the optical axes of the cameras 10L and 10R and that the x axis of the monitor space is parallel to the ground 30 (and accordingly the virtual plane 32).
- the middle point of the projection centers P 10L and P 10R of the cameras 10L and 10R is referred to as "the camera position".
- FIG. 6 is a 3D version of FIG. 5.
- an X B - and Y B - coordinate device is set on the virtual plane 32 such that the origin of the X B - and Y B -coordinates is set to the foot (O B ) of the perpendicular line drawn from the camera position to the virtual plane 32; the Y B axis runs through the origin O B and an intersecting point Y B0 at which the z axis of the monitor space intersects the virtual plane 32; and the X B axis is perpendicular to the Y B axis.
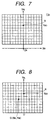
- FIG. 7 is a diagram showing an exemplary virtual plane chart obtained by shooting the virtual plane 32.
- the X BL axis may not appear on the virtual plane chart 11a. This is because the X B axis on the virtual plane 32 may be out of the sight of the cameras 10 (hereinafter referred to as "the stereo camera 10").
- FIG. 8 is a diagram showing a combination of the virtual plane chart 11a and a left picture 11 of a monitor space including the point P shown in FIGS. 5 and 6. From FIGS.
- the distance, along the optical axis of the reference or left camera, between the camera position and an intersecting point Q at which a line defined by the camera position and the point P(x, y, z) intersects the virtual plane 32, i.e., the z coordinate (z q ) of the intersecting point Q is expressed as a function z of the 3D information Q(X B , Y B ) on the virtual plane 32 (i.e., a function z of the 3D information Q(X BL , Y BL ) obtained from the combination of the virtual plane chart 11a and a left picture 11) as follows.
- z q z (X BL , Y BL )
- the function z (X BL , Y BL ) is found by means of a technique such as a method of least squares.
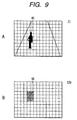
- step 232 for each block of each body area 40 appearing in the pictures 11 and 12, the height Hu of the body from the virtual plane 32 is calculated according to the equation (12). Then, in the left picture 11 for example, the blocks each height for which is shorter than a predetermined threshold TH1 are extracted from the blocks which correspond to the bodies in the monitor space in step 234. In other words, body area blocks 50 that satisfy the following height conditions that: 0 ⁇ Hu ⁇ TH1 are extracted.
- the reason why the virtual plane 32 is set at a height of Hd from the ground 30 is that the congestion measuring device 1 is so configured as to extract only body areas that correspond to a human body without extracting objects other than the human body even if there are a table and/or chairs in the monitor space.
- the determinant Det(j) is defined, e.g., as follows:
- the congestion measuring device 1 is so configured as to output the degree of congestion which is proportional to the total area of the detected blocks 50 (of FIG. 9B) in the body areas 40 of FIG. 9A.
- the congestion measuring device 1 measures the degree of congestion on the basis of the area of the images corresponding the parts of the bodies which parts exist between the virtual plane 32 and a predetermined height TH1. This enables the device 1 to not only measure the degree of human or vehicle congestion correctly even when people or vehicles stay still, but also to be free from influence of brightness changes in a video signal which changes are caused by light or shade falling-in to the monitor space.
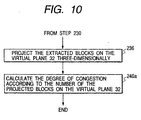
- FIG. 10 is a diagram showing steps which, when combined with FIG. 2, constitute a flowchart of an exemplary procedure of measuring the degree of congestion in accordance with a second illustrative embodiment of the invention.
- the processor 21 projects the detected blocks 50 of the FIG. 9B on the virtual plane 32 in step 236.
- the controller 20 calculates the degree of congestion on the basis of the number of projected blocks on the virtual plane 32 in step 240a, and ends the congestion measuring operation.
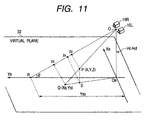
- FIG. 11 is a diagram showing, in three dimensions, the process of recognizing the object to be taken into account for determining the degree of congestion according to the second illustrative embodiment of the invention.
- FIG. 11 is identical to FIG. 5 except that a new point S has been added to FIG. 11.
- the point S is a foot of a perpendicular line drawn from the body point P to the virtual plane 32.
- FIG. 12 is a diagram showing the way of projecting the detected blocks 50 on the virtual plane 32 three-dimensionally.
- the detected blocks 50 are indicated by slanting lines.
- the blocks that satisfy predetermined height (Hu) conditions are detected or extracted out of the blocks containing the body image 40.
- the detected blocks 50 are projected on the virtual plane 32, i.e., on a scale-marked projection map 11C in a just described manner.
- the projected blocks 60 on the virtual plane 32 are drawn in bold lines in the scale-marked projection map 11C.
- the determinant Pro(j) is set to 1 for the projected blocks 60 on the virtual plane 32, and 0 for the other blocks, as follows:
- ⁇ j is a compensation coefficient for compensating the variation in image size of an object or body.
- the congestion measuring device 1 which operates according to the flow defined in FIGS. 2 and 10, measures the degree of congestion on not only by detecting the parts of the bodies which parts exist between the virtual plane 32 and a predetermined height TH1 but also by projecting the detected parts of the bodies on the virtual plane 32 so that the congestion measurement is achieved based on the projected blocks 60.
- a congestion-measuring device 1 provides a higher-precision measurement result as compared with the first embodiment.
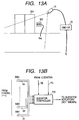
- FIG. 13 is an illustration showing an exemplary arrangement of an elevator system that controls the operations of the elevator(s) in response to the degree s of congestion near the elevator doors which degrees are measured by a congestion measuring device according to the invention.
- Each floor is provided with a console 302 near the elevator door and a stereo camera 10.
- the monitor space is a space around the elevator door 304.
- the stereo camera 10 is so installed as to shoot the monitor space.
- the output of the camera 10 are supplied to a congestion measuring device-data processor (CMD-DP) 20 according to either first or second illustrative embodiment of the invention.
- CMD-DP congestion measuring device-data processor
- FIG. 13B is a diagram showing an elevator controller.
- the elevator controller 310 receives the measurement result Sj and a switch output SWj from each floor.
- the elevator controller 310 further receives a signal SE indicative of the state of the switch buttons (not shown) provided in the elevator (not shown) and a signal PD indicative of the position and the moving direction of the elevator.
- the elevator controller 310 provides output signals to the elevator actuators (not shown) so as to carry people most effectively. Utilizing congestion information for the elevator operation enables the elevator operation to be optimized.
- the invention is also applicable to a multiple-elevator system.
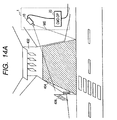
- FIG. 14 is an illustration showing an exemplary arrangement of a signal system that controls the signal(s) in response to the degree (s) of congestion near the signal(s) which degrees are measured by a congestion measuring device according to the invention.
- the signal system is used for controlling the traffic near each of the exits of a facility accommodating masses of people such as a stadium, a concert hole, an event hole, etc.
- FIG. 14A shows an arrangement of an exit area.
- each of the exit areas 404 near the exits 402 of a facility is a monitor space MS.
- a signal is provided in the monitor space MS.
- a stereo camera 10 is so installed as to shoot the monitor space.
- the output of the camera 10 is supplied to a congestion measuring device-data processor (CMD-DP) 20 according to either first or second illustrative embodiment of the invention.
- CMD-DP congestion measuring device-data processor
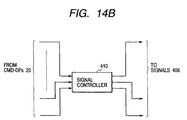
- FIG. 14B shows a signal controller 410.
- the signal controller 410 collects the degrees of congestion from the inventive CMD-DP 20 and controls the signals 406.
- the signals are controlled based on the degrees of congestion in respective exit areas such that the congestions are effectively resolved.
- the degree of congestion of people has been used for the signal control.
- the degree of congestion of vehicles maybe used instead of or in addition to the degree of congestion of people.
- FIG. 15 is an illustration showing an exemplary arrangement of a gate system that controls the gates in response to the degree of congestion near the gates which degrees are measured by a congestion measuring device according to the invention.
- the gate system is used for controlling a plurality of gates 502-1 through 502-5 provided at each of the entrances 500 of a facility accommodating masses of people such as a stadium, a concert hole, an event hole, etc.
- an entrance area 504 near the entrance 500 of a facility is a monitor space MS.
- a stereo camera 10 is so installed as to shoot the monitor space MS.
- the output of the camera 10 is supplied to the congestion measuring device-data processor (CMD-DP) 20, which in turn supplies the degree of congestion at the entrance area to a gate controller 510.
- CMD-DP congestion measuring device-data processor
- the gate controller 410 controls the gates 502.
- the gates are controlled based on the degrees of congestion in respective exit areas such that the congestion is effectively resolved. Specifically, the higher the degree of congestion is, the more gates are opened.
- the invention has been applied to the gate control. However, the invention may be used for the control of opening and shutting of ticket windows. Utilizing the congestion measuring system 1 for a gate system enables the gate control based on the degree of congestion near the entrance.
- FIG. 16A is an illustration showing an arrangement of each of the bus stop areas of a bus service administered by a bus operation system incorporating the congestion measuring system 1.
- the bus stop or station area 602 is provided with the congestion measuring system 1.
- Each of the congestion measuring devices 1 in this system outputs the degree (Si) of congestion.
- the signals S1 through SM are supplied to a bus operation manager 610 of FIG. 16B.
- the bus operation manager 610 On the basis of the signals S1 through SM, the bus operation manager 610 outputs control signals or instructions for the buses (not shown) B1, B2, ...BN, where N is the number of available buses.
- the buses are operated on the basis of the degrees of congestion at bus stations. This enables flexible management of the bus operation. For example, the number of active buses can be controlled according to the degree of overall congestion.
- the same arrangement may be applied to the management of the train operation based on the degree of congestion at platforms. Also, the same arrangement may be applied to a taxi dispatch management system.
Landscapes
- Physics & Mathematics (AREA)
- Engineering & Computer Science (AREA)
- General Physics & Mathematics (AREA)
- Multimedia (AREA)
- Theoretical Computer Science (AREA)
- Image Analysis (AREA)
- Length Measuring Devices By Optical Means (AREA)
- Measurement Of Optical Distance (AREA)
- Image Processing (AREA)
- Traffic Control Systems (AREA)
Abstract
Description


Claims (8)
- A method of measuring a degree of congestion in a space covered by a pair of cameras, wherein three-dimensional orthogonal coordinates are defined in the space such that one of the coordinates is parallel with the optical axes of the cameras, a value of the parallel coordinate for any point in the space being referred to as "3D information" of the point, the method comprising the steps of:detecting parts of each of body images which parts exist above a virtual plane set at a predetermined height and within a predetermined height from said virtual plane by using first 3D information and second 3D information of each image unit of said body images, said first 3D information being expressed in two-dimensional coordinates on pictures obtained from said cameras, and said second 3D information being expressed in two-dimensional coordinates defined on said virtual plane; andcalculating said degree of congestion on the basis of said detected parts.
- A method of measuring a degree of congestion in a space covered by a pair of cameras, wherein three-dimensional orthogonal coordinates are defined in the space such that one of the coordinates is parallel with the optical axes of the cameras, a value of the parallel coordinate for any point in the space being referred to as "3D information" of the point, the method comprising the steps of:detecting parts of each of body images which parts exist above a virtual plane set at a predetermined height and within a predetermined height from said virtual plane by using first 3D information and second 3D information of each image unit of said body images, said first 3D information being expressed in two-dimensional coordinates on pictures obtained from said cameras, and said second 3D information being expressed in two-dimensional coordinates defined on said virtual plane;projecting said detected parts on said virtual plane; andcalculating said degree of congestion on the basis of projected parts on said virtual plane.
- A device for measuring a degree of congestion in a monitor space, wherein three-dimensional orthogonal coordinates are defined in the monitor space, the device comprising:a pair of cameras so set as to cover said monitor space, one of the orthogonal coordinates being parallel with the optical axes of said cameras, a value of the parallel coordinate for any point in the space being referred to as "3D information" of the point;means for detecting parts of each of body images which parts exist above a virtual plane set at a predetermined height and within a predetermined height from said virtual plane by using first 3D information and second 3D information of each image unit of said body images, said first 3D information being expressed in two-dimensional coordinates on pictures obtained from said cameras, and said second 3D information being expressed in two-dimensional coordinates defined on a virtual plane set at a predetermined height; andmeans for calculating said degree of congestion on the basis of said detecting parts.
- A device for measuring a degree of congestion in a monitor space, wherein three-dimensional orthogonal coordinates are defined in the monitor space, the device comprising:a pair of cameras so set as to cover said monitor space, one of the orthogonal coordinates being parallel with the optical axes of said cameras, a value of the parallel coordinate for any point in the space being referred to as "3D information" of the point;means for detecting parts of each of body images which parts exist above a virtual plane set at a predetermined height and within a predetermined height from said virtual plane by using first 3D information and second 3D information of each image unit of said body images, said first 3D information being expressed in two-dimensional coordinates on pictures obtained from said cameras, and said second 3D information being expressed in two-dimensional coordinates defined on a virtual plane set at a predetermined height;means for projecting said detected parts on said virtual plane; andmeans for calculating said degree of congestion on the basis of projected parts on said virtual plane.
- An elevator system comprising:at least one elevator;means, disposed near door(s) of said at least one elevator on each floor, for measuring a degree of congestion near said door(s);means for controlling the operation of said at least one elevator on the basis of said degree of congestion of each floor.
- A signal system comprising:at least one signal provided near respective exits of a facility accommodating masses of people;means, so disposed as to monitor each of said exits, for measuring a degree of congestion near said exit;means for controlling the operation of said at least one signal on the basis of said degree of congestion near each exit.
- A gate control system comprising:a plurality of gates provided at an entrance of a facility accommodating masses of people;means, disposed near said entrance, for measuring a degree of congestion near said entrance;means for controlling the operation of said gates on the basis of said degree of congestion near said entrance.
- A bus service management system for managing a bus service the route of which includes predetermined bus stops, the bus service management system comprising:means, disposed at each bus stop, for measuring a degree of congestion of bus waiting people at the bus stop;means, based on said degree of congestion from each bus stop, for providing control outputs for buses available for said bus service; andmeans for transmitting said control outputs to respective buses.
Applications Claiming Priority (2)
| Application Number | Priority Date | Filing Date | Title |
|---|---|---|---|
| JP20980299A JP3243234B2 (en) | 1999-07-23 | 1999-07-23 | Congestion degree measuring method, measuring device, and system using the same |
| JP20980299 | 1999-07-23 |
Publications (2)
| Publication Number | Publication Date |
|---|---|
| EP1074958A1 true EP1074958A1 (en) | 2001-02-07 |
| EP1074958B1 EP1074958B1 (en) | 2004-12-08 |
Family
ID=16578848
Family Applications (1)
| Application Number | Title | Priority Date | Filing Date |
|---|---|---|---|
| EP00115861A Expired - Lifetime EP1074958B1 (en) | 1999-07-23 | 2000-07-24 | Traffic congestion measuring method and device and applications thereof |
Country Status (3)
| Country | Link |
|---|---|
| EP (1) | EP1074958B1 (en) |
| JP (1) | JP3243234B2 (en) |
| DE (1) | DE60016517T2 (en) |
Cited By (11)
| Publication number | Priority date | Publication date | Assignee | Title |
|---|---|---|---|---|
| EP1345445A1 (en) * | 2002-03-11 | 2003-09-17 | Inventio Ag | Space surveillance for elevator using a 3-D sensor |
| WO2004084556A1 (en) * | 2003-03-20 | 2004-09-30 | Inventio Ag | Monitoring a lift area by means of a 3d sensor |
| US7536253B2 (en) | 2005-01-31 | 2009-05-19 | Optex Co., Ltd. | Traffic monitoring apparatus |
| EP2063404A1 (en) * | 2007-11-23 | 2009-05-27 | Traficon | A detector for detecting traffic participants. |
| WO2009087536A3 (en) * | 2007-12-31 | 2009-09-03 | Imagsa Technologies S.A. | Method and system for detecting moving objects |
| BE1018764A3 (en) * | 2009-05-27 | 2011-08-02 | Traficon Nv | DEVICE AND SYSTEM FOR TUNNEL DETECTION. |
| EP2254104A3 (en) * | 2009-05-18 | 2012-11-07 | Deutsches Zentrum für Luft- und Raumfahrt e. V. | Method for automatic recognition of a change in a situation |
| US10005639B2 (en) | 2013-08-15 | 2018-06-26 | Otis Elevator Company | Sensors for conveyance control |
| CN109410582A (en) * | 2018-11-27 | 2019-03-01 | 易念科技(深圳)有限公司 | Traffic condition analysis method and terminal device |
| US11667493B2 (en) | 2018-03-19 | 2023-06-06 | Otis Elevator Company | Elevator operation for occupancy |
| CN119625977A (en) * | 2024-11-22 | 2025-03-14 | 中国船舶集团有限公司第七〇九研究所 | Road congestion prediction method and device based on training model |
Families Citing this family (18)
| Publication number | Priority date | Publication date | Assignee | Title |
|---|---|---|---|---|
| JP4667635B2 (en) * | 2001-04-25 | 2011-04-13 | 東急建設株式会社 | Transport system, transport method and transport management device |
| JP2003037836A (en) * | 2001-07-24 | 2003-02-07 | Ntt Docomo Inc | Image distribution method, image distribution system, computer-readable recording medium, and computer program |
| JP4056813B2 (en) * | 2002-07-11 | 2008-03-05 | 松下電器産業株式会社 | Obstacle detection device |
| JP4311107B2 (en) * | 2003-08-08 | 2009-08-12 | オムロン株式会社 | Three-dimensional object recognition device and setting method thereof |
| CN1312004C (en) * | 2003-08-15 | 2007-04-25 | 株式会社日立制作所 | Bus, stop and center system with information exchange |
| JP2005157635A (en) * | 2003-11-25 | 2005-06-16 | Matsushita Electric Ind Co Ltd | Congestion degree measuring device, facility control system, and congestion degree measuring method |
| KR100999084B1 (en) | 2006-01-12 | 2010-12-07 | 오티스 엘리베이터 컴파니 | Video Support System for Elevator Control |
| JP5279459B2 (en) * | 2008-11-12 | 2013-09-04 | 三菱プレシジョン株式会社 | Congestion detector |
| JP5774414B2 (en) * | 2011-08-26 | 2015-09-09 | 株式会社東芝 | Vehicle detection device |
| JP6033695B2 (en) * | 2013-01-28 | 2016-11-30 | 株式会社日立製作所 | Elevator monitoring device and elevator monitoring method |
| JP6186599B1 (en) * | 2014-12-25 | 2017-08-30 | パナソニックIpマネジメント株式会社 | Projection device |
| JP6464737B2 (en) * | 2014-12-26 | 2019-02-06 | 日本電気株式会社 | Prospective customer location information detection system, method and program |
| JP2016134003A (en) * | 2015-01-20 | 2016-07-25 | 株式会社東芝 | Traffic control system and traffic control method |
| JP6474687B2 (en) * | 2015-05-27 | 2019-02-27 | 株式会社日立製作所 | Elevator with image recognition function |
| JP6329671B1 (en) * | 2017-06-01 | 2018-05-23 | 三菱ロジスネクスト株式会社 | Dispatch system |
| JP6798937B2 (en) * | 2017-06-22 | 2020-12-09 | 株式会社日立ビルシステム | Elevators and escalators |
| CN112344854B (en) * | 2020-10-27 | 2022-06-03 | 深圳市航天华拓科技有限公司 | Vehicle overrun detection method, system and computer readable storage medium |
| CN113362632A (en) * | 2021-07-08 | 2021-09-07 | 安徽富煌科技股份有限公司 | Station public transport dispatching system based on 3D structure optical camera |
Citations (5)
| Publication number | Priority date | Publication date | Assignee | Title |
|---|---|---|---|---|
| EP0747870A1 (en) * | 1995-05-18 | 1996-12-11 | Omron Corporation | An object observing method and device with two or more cameras |
| JPH09107541A (en) * | 1995-10-11 | 1997-04-22 | Clarion Co Ltd | Mobile object counter |
| JPH09278301A (en) * | 1996-04-11 | 1997-10-28 | Mitsubishi Electric Corp | Elevator operation control device |
| US5729216A (en) * | 1994-03-14 | 1998-03-17 | Yazaki Corporation | Apparatus for monitoring vehicle periphery |
| US5757287A (en) * | 1992-04-24 | 1998-05-26 | Hitachi, Ltd. | Object recognition system and abnormality detection system using image processing |
-
1999
- 1999-07-23 JP JP20980299A patent/JP3243234B2/en not_active Expired - Fee Related
-
2000
- 2000-07-24 EP EP00115861A patent/EP1074958B1/en not_active Expired - Lifetime
- 2000-07-24 DE DE60016517T patent/DE60016517T2/en not_active Expired - Lifetime
Patent Citations (5)
| Publication number | Priority date | Publication date | Assignee | Title |
|---|---|---|---|---|
| US5757287A (en) * | 1992-04-24 | 1998-05-26 | Hitachi, Ltd. | Object recognition system and abnormality detection system using image processing |
| US5729216A (en) * | 1994-03-14 | 1998-03-17 | Yazaki Corporation | Apparatus for monitoring vehicle periphery |
| EP0747870A1 (en) * | 1995-05-18 | 1996-12-11 | Omron Corporation | An object observing method and device with two or more cameras |
| JPH09107541A (en) * | 1995-10-11 | 1997-04-22 | Clarion Co Ltd | Mobile object counter |
| JPH09278301A (en) * | 1996-04-11 | 1997-10-28 | Mitsubishi Electric Corp | Elevator operation control device |
Non-Patent Citations (2)
| Title |
|---|
| PATENT ABSTRACTS OF JAPAN vol. 1997, no. 08 29 August 1997 (1997-08-29) * |
| PATENT ABSTRACTS OF JAPAN vol. 1998, no. 02 30 January 1998 (1998-01-30) * |
Cited By (14)
| Publication number | Priority date | Publication date | Assignee | Title |
|---|---|---|---|---|
| EP1345445A1 (en) * | 2002-03-11 | 2003-09-17 | Inventio Ag | Space surveillance for elevator using a 3-D sensor |
| CN100568959C (en) * | 2003-03-20 | 2009-12-09 | 因温特奥股份公司 | Method and device for monitoring the range of an elevator installation |
| WO2004084556A1 (en) * | 2003-03-20 | 2004-09-30 | Inventio Ag | Monitoring a lift area by means of a 3d sensor |
| US7140469B2 (en) | 2003-03-20 | 2006-11-28 | Inventio Ag | Three-dimensional monitoring in the area of an elevator by means of a three-dimensional sensor |
| US7536253B2 (en) | 2005-01-31 | 2009-05-19 | Optex Co., Ltd. | Traffic monitoring apparatus |
| EP2063404A1 (en) * | 2007-11-23 | 2009-05-27 | Traficon | A detector for detecting traffic participants. |
| WO2009087536A3 (en) * | 2007-12-31 | 2009-09-03 | Imagsa Technologies S.A. | Method and system for detecting moving objects |
| EP2254104A3 (en) * | 2009-05-18 | 2012-11-07 | Deutsches Zentrum für Luft- und Raumfahrt e. V. | Method for automatic recognition of a change in a situation |
| BE1018764A3 (en) * | 2009-05-27 | 2011-08-02 | Traficon Nv | DEVICE AND SYSTEM FOR TUNNEL DETECTION. |
| US10005639B2 (en) | 2013-08-15 | 2018-06-26 | Otis Elevator Company | Sensors for conveyance control |
| US11667493B2 (en) | 2018-03-19 | 2023-06-06 | Otis Elevator Company | Elevator operation for occupancy |
| CN109410582A (en) * | 2018-11-27 | 2019-03-01 | 易念科技(深圳)有限公司 | Traffic condition analysis method and terminal device |
| CN109410582B (en) * | 2018-11-27 | 2021-11-16 | 易念科技(深圳)有限公司 | Traffic condition analysis method and terminal equipment |
| CN119625977A (en) * | 2024-11-22 | 2025-03-14 | 中国船舶集团有限公司第七〇九研究所 | Road congestion prediction method and device based on training model |
Also Published As
| Publication number | Publication date |
|---|---|
| DE60016517T2 (en) | 2005-12-15 |
| EP1074958B1 (en) | 2004-12-08 |
| JP2001034883A (en) | 2001-02-09 |
| DE60016517D1 (en) | 2005-01-13 |
| JP3243234B2 (en) | 2002-01-07 |
Similar Documents
| Publication | Publication Date | Title |
|---|---|---|
| EP1074958B1 (en) | Traffic congestion measuring method and device and applications thereof | |
| EP1030188B1 (en) | Situation awareness system | |
| CN109311622B (en) | Elevator system and car call estimation method | |
| US11500381B2 (en) | Stopping position control device, stopping position control method, and computer program for stopping position control | |
| CN109074728A (en) | Travel speed is recommended to provide program, running support system, vehicle control apparatus and automatic running vehicle | |
| JP4845580B2 (en) | Train congestion notification system | |
| JP2006031645A (en) | Real-time estimation method for dynamic crowd density and crowd accident prevention system | |
| JPH11175694A (en) | Congestion notification device | |
| CN117253203A (en) | Obstacle detecting system based on visual sensor | |
| CN114973743A (en) | Vehicle deployment management device for public vehicles and autonomous vehicles | |
| KR20230053934A (en) | A location-based vehicle breaker control system | |
| JPH04290199A (en) | Control method for parking lot | |
| US20070183763A1 (en) | Method and system for tracking images | |
| JP2023136920A (en) | Door control device, computer program for door control, and door control method | |
| KR102705957B1 (en) | Vehicle calling system based on location and method for processing thereof | |
| CN110046535B (en) | Intelligent travel time prediction system, method and storage medium based on machine learning | |
| CN111145580B (en) | Mobile body, management device and system, control method, and computer-readable medium | |
| JP7593205B2 (en) | Vehicle interior monitoring system and vehicle operation management system | |
| JP2023079602A (en) | Congestion information display system | |
| KR102720235B1 (en) | Parking guide system based on cameras and method for processing thereof | |
| JP2007047876A (en) | Toll road toll collection system | |
| KR102887807B1 (en) | Vehicle detection apparatus using virtual curtain and method using the same | |
| JPH04182900A (en) | Axle weight violation vehicle detection system | |
| KR102700257B1 (en) | Method for analys congestion employing digital video recorder in bus | |
| JP7757880B2 (en) | Vehicle occupant protection system |
Legal Events
| Date | Code | Title | Description |
|---|---|---|---|
| PUAI | Public reference made under article 153(3) epc to a published international application that has entered the european phase |
Free format text: ORIGINAL CODE: 0009012 |
|
| AK | Designated contracting states |
Kind code of ref document: A1 Designated state(s): DE FR GB |
|
| AX | Request for extension of the european patent |
Free format text: AL;LT;LV;MK;RO;SI |
|
| 17P | Request for examination filed |
Effective date: 20010403 |
|
| AKX | Designation fees paid |
Free format text: DE FR GB |
|
| 17Q | First examination report despatched |
Effective date: 20030319 |
|
| GRAP | Despatch of communication of intention to grant a patent |
Free format text: ORIGINAL CODE: EPIDOSNIGR1 |
|
| GRAS | Grant fee paid |
Free format text: ORIGINAL CODE: EPIDOSNIGR3 |
|
| GRAA | (expected) grant |
Free format text: ORIGINAL CODE: 0009210 |
|
| RAP1 | Party data changed (applicant data changed or rights of an application transferred) |
Owner name: MATSUSHITA ELECTRIC INDUSTRIAL CO., LTD. |
|
| AK | Designated contracting states |
Kind code of ref document: B1 Designated state(s): DE FR GB |
|
| REG | Reference to a national code |
Ref country code: GB Ref legal event code: FG4D |
|
| REF | Corresponds to: |
Ref document number: 60016517 Country of ref document: DE Date of ref document: 20050113 Kind code of ref document: P |
|
| ET | Fr: translation filed | ||
| PLBE | No opposition filed within time limit |
Free format text: ORIGINAL CODE: 0009261 |
|
| STAA | Information on the status of an ep patent application or granted ep patent |
Free format text: STATUS: NO OPPOSITION FILED WITHIN TIME LIMIT |
|
| 26N | No opposition filed |
Effective date: 20050909 |
|
| REG | Reference to a national code |
Ref country code: GB Ref legal event code: 746 Effective date: 20091221 |
|
| PGFP | Annual fee paid to national office [announced via postgrant information from national office to epo] |
Ref country code: DE Payment date: 20100721 Year of fee payment: 11 Ref country code: FR Payment date: 20100805 Year of fee payment: 11 |
|
| REG | Reference to a national code |
Ref country code: FR Ref legal event code: ST Effective date: 20120330 |
|
| PG25 | Lapsed in a contracting state [announced via postgrant information from national office to epo] |
Ref country code: DE Free format text: LAPSE BECAUSE OF NON-PAYMENT OF DUE FEES Effective date: 20120201 Ref country code: FR Free format text: LAPSE BECAUSE OF NON-PAYMENT OF DUE FEES Effective date: 20110801 |
|
| REG | Reference to a national code |
Ref country code: DE Ref legal event code: R119 Ref document number: 60016517 Country of ref document: DE Effective date: 20120201 |
|
| PGFP | Annual fee paid to national office [announced via postgrant information from national office to epo] |
Ref country code: GB Payment date: 20120718 Year of fee payment: 13 |
|
| GBPC | Gb: european patent ceased through non-payment of renewal fee |
Effective date: 20130724 |
|
| PG25 | Lapsed in a contracting state [announced via postgrant information from national office to epo] |
Ref country code: GB Free format text: LAPSE BECAUSE OF NON-PAYMENT OF DUE FEES Effective date: 20130724 |