EP0448044B1 - Integriertes System zur Qualitätskontrolle - Google Patents
Integriertes System zur Qualitätskontrolle Download PDFInfo
- Publication number
- EP0448044B1 EP0448044B1 EP91104243A EP91104243A EP0448044B1 EP 0448044 B1 EP0448044 B1 EP 0448044B1 EP 91104243 A EP91104243 A EP 91104243A EP 91104243 A EP91104243 A EP 91104243A EP 0448044 B1 EP0448044 B1 EP 0448044B1
- Authority
- EP
- European Patent Office
- Prior art keywords
- failure
- information
- product
- data
- analysis
- Prior art date
- Legal status (The legal status is an assumption and is not a legal conclusion. Google has not performed a legal analysis and makes no representation as to the accuracy of the status listed.)
- Expired - Lifetime
Links
Images


Classifications
-
- G—PHYSICS
- G07—CHECKING-DEVICES
- G07C—TIME OR ATTENDANCE REGISTERS; REGISTERING OR INDICATING THE WORKING OF MACHINES; GENERATING RANDOM NUMBERS; VOTING OR LOTTERY APPARATUS; ARRANGEMENTS, SYSTEMS OR APPARATUS FOR CHECKING NOT PROVIDED FOR ELSEWHERE
- G07C3/00—Registering or indicating the condition or the working of machines or other apparatus, other than vehicles
- G07C3/14—Quality control systems
-
- G—PHYSICS
- G06—COMPUTING OR CALCULATING; COUNTING
- G06F—ELECTRIC DIGITAL DATA PROCESSING
- G06F17/00—Digital computing or data processing equipment or methods, specially adapted for specific functions
-
- G—PHYSICS
- G05—CONTROLLING; REGULATING
- G05B—CONTROL OR REGULATING SYSTEMS IN GENERAL; FUNCTIONAL ELEMENTS OF SUCH SYSTEMS; MONITORING OR TESTING ARRANGEMENTS FOR SUCH SYSTEMS OR ELEMENTS
- G05B19/00—Program-control systems
- G05B19/02—Program-control systems electric
- G05B19/418—Total factory control, i.e. centrally controlling a plurality of machines, e.g. direct or distributed numerical control [DNC], flexible manufacturing systems [FMS], integrated manufacturing systems [IMS] or computer integrated manufacturing [CIM]
- G05B19/41875—Total factory control, i.e. centrally controlling a plurality of machines, e.g. direct or distributed numerical control [DNC], flexible manufacturing systems [FMS], integrated manufacturing systems [IMS] or computer integrated manufacturing [CIM] characterised by quality surveillance of production
-
- G—PHYSICS
- G05—CONTROLLING; REGULATING
- G05B—CONTROL OR REGULATING SYSTEMS IN GENERAL; FUNCTIONAL ELEMENTS OF SUCH SYSTEMS; MONITORING OR TESTING ARRANGEMENTS FOR SUCH SYSTEMS OR ELEMENTS
- G05B2219/00—Program-control systems
- G05B2219/30—Nc systems
- G05B2219/31—From computer integrated manufacturing till monitoring
- G05B2219/31282—Data acquisition, BDE MDE
-
- G—PHYSICS
- G05—CONTROLLING; REGULATING
- G05B—CONTROL OR REGULATING SYSTEMS IN GENERAL; FUNCTIONAL ELEMENTS OF SUCH SYSTEMS; MONITORING OR TESTING ARRANGEMENTS FOR SUCH SYSTEMS OR ELEMENTS
- G05B2219/00—Program-control systems
- G05B2219/30—Nc systems
- G05B2219/32—Operator till task planning
- G05B2219/32222—Fault, defect detection of origin of fault, defect of product
-
- Y—GENERAL TAGGING OF NEW TECHNOLOGICAL DEVELOPMENTS; GENERAL TAGGING OF CROSS-SECTIONAL TECHNOLOGIES SPANNING OVER SEVERAL SECTIONS OF THE IPC; TECHNICAL SUBJECTS COVERED BY FORMER USPC CROSS-REFERENCE ART COLLECTIONS [XRACs] AND DIGESTS
- Y02—TECHNOLOGIES OR APPLICATIONS FOR MITIGATION OR ADAPTATION AGAINST CLIMATE CHANGE
- Y02P—CLIMATE CHANGE MITIGATION TECHNOLOGIES IN THE PRODUCTION OR PROCESSING OF GOODS
- Y02P90/00—Enabling technologies with a potential contribution to greenhouse gas [GHG] emissions mitigation
- Y02P90/02—Total factory control, e.g. smart factories, flexible manufacturing systems [FMS] or integrated manufacturing systems [IMS]
Definitions
- the present invention relates to a system for collecting information concerning the quality of products from customers as well as during the manufacture and sale of the product, and retrieving and analyzing the accumulated information.
- a failure information input method employing bar-codes is disclosed in Japanese Patent Application Laid-open (Kokai) No. 63-40962, in which nothing is stated clearly about methods of accumulation, management, retrieval and analysis of data, and information concerning failure is referred to simply as "details of failure", which is obscure.
- a quality information system is disclosed in "Quality Information System Linking Production Process and the Market", Toshiba Corp., Fukaya Works, ENGINEERS, Aug. 1987.
- This quality information system manages quality data acquired in the market by a main frame computer installed in the factory and applies a statistical method to the analysis of the quality data.
- US-A-3 882 305 (Reissue no. 31 247) discloses a remote diagnostic communications system for computer controlled machine tools that can identify incipient faults or failures of the machine tool before they occur.
- an integrated quality control system which enables a field serviceman assigned to the maintenance of a customer's equipment to report information concerning repair work performed on the site of installation of a product, to repair the failed product immediately in an on-line mode through an office of the business department, such as a special agent or a business office, to the factory, which is the principal department responsible for the design, manufacture and inspection of the product, by means or a computer network.
- the computer network in accordance with a feature of the present invention is a hierarchical system of general purpose main frame computers, of general-purpose main frame computers and work stations, or of work stations.
- the field serviceman records the type of the product, the condition of failure, parts used and details of repair work in a card of a predetermined format each time repair work is performed on the site, and then the field serviceman enters the contents of the card through a terminal of the general-purpose computer, installed in the office of the business department.
- the improvement in design of products in production, evaluation of component parts and the improvement of the inspection system can be achieved quickly and improvements can be incorporated into the design of a new product to provide the new product with high reliability.
- each item of data relating to the repair of the failed product and that of combinations of the items of the data can be achieved by retrieving and developing records of source data on a memory at a work station.
- environmental factors such as temperature, humidity and the like at the time of manufacture of the product and at failure thereof are correlated for analysis purposes.
- Fig. 1 shows the general construction of an integrated quality control system embodying the present invention, namely, a network including a field service station where quality data acquired at the customer's site is entered for transmission to factories.
- a field serviceman assigned to the maintenance of the product performs repair work at the customer's working site and sends information principally concerning the details of the repair work performed at the site in an on-line mode through an office of the business department, such as an office of a special agent or a business office, to the factory, which is the principal department responsible for the design, manufacture and inspection of the product.
- quality data acquired through the repair of products at customer's working sites and recorded on cards are entered by terminals 100 installed at an office of a special agent such as a sales office.
- the quality data are edited by means of computers 102 installed respectively at business offices and all of the edited quality data are sent to a single main frame computer 104 from the business offices.
- the main frame computer classifies the edited quality data by factory, rearranges the quality data and stores the rearranged quality data in a large-capacity storage unit 106 having a mail box function.
- the large-capacity storage unit is accessible to all computers installed in factories A, B, C and D, for example.
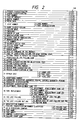
- the field serviceman Every time repair work is performed at the site by a field serviceman, the field serviceman records the details of the repair work including the type of the product, the condition of failure, parts used and measures taken in a card 108 of a predetermined format. The contents of the card are entered by the terminal of a general-purpose computer installed in the office of the business department.
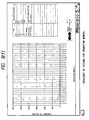
- Fig. 2 shows the format of the card 108. Data of several tens items of information are recorded on the card. Twenty-seven principal items of information corresponding to item numbers of the card 108 as shown in Fig. 2 are as follows.
- the listed information about the repair work and the product is analyzed in combination with the quantity of products sold.
- the quantity of products sold is the quantity of the products delivered from the business office to the special agent, the quantity of the products delivered from the special agent to the sales shop or the quantity of the products delivered from the sales shop to the customers, classified by type, month and business office.
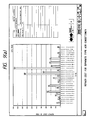
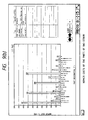
- Fig. 3 shows the relation between faults in products actually found in the field and problems in quality, and their causes.
- the chart shown in Fig. 3 exemplifies some of the relations between the contents of the card and related causes for five different examples.
- Example A Dependence of the distribution of failures classified by the special agent or the business office assigned to the repair work on local climate (temperature, humidity) and the service system
- Example B Dependence of the distribution of failures classified by the year of manufacture, serial number, lot and date of manufacture on the history of manufacture including the use of defective parts and the modification of specifications.
- Example C Dependence of the distribution of failures classified by the date of repair on seasonal factors including temperature and humidity
- Example D Dependence of the distribution of failures classified by the type of products and repaired parts (modules) and the condition of failures on the type and parts of products
- Example E Dependence of the distribution of failures classified by the period of operation of products or its class on initial failure, accidental failure or failure due to wear
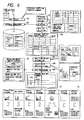
- Fig. 4 shows a block diagram arrangement of the computer 200 of each factory (Factory A-D, for example, of Fig. 1) for requesting the large-capacity storage unit 106 of Fig. 1 to send data and for accumulating and managing the received quality data for the factory via a data collection unit 202, and a work station 210 for retrieving and analyzing the quality data.
- a large-capacity storage unit 204 connected to the computer 200 stores the quality data and customer data of all the products of the factory.
- the work station 210 which includes a color graphic monitor 212 retrieves and analyzes the quality data, retrieves data from an external storage unit 214 storing a database including quality data, and feeds the results of analysis to an external storage unit such as a floppy disc 216 or a printer 218.
- the work station 210 is connected to the computer 200 by a high-speed network 220. When the work station 210 requires data other than those available from the database of the work station, the data is transferred by the computer 200 through the high-speed network to the work station.
- Fig. 5 is a flow chart for the retrieval and analysis of quality data by the work station of Fig. 4. Modules assigned to functions shown in Fig. 5 will be described hereinafter.
- a user interface 240 controls the start and termination of the modules.
- a display application 242 controls the display operation of the color graphic monitor 212 using a graphic package.
- a drawing or display management module 244 controls the start and termination of the display application.
- An application start/management module 246 starts and terminates each module.
- a fault or failure analyzing module 248 has analyzing functions for analyzing data for distribution, correlation and trend.
- a failure predicting module 250 predicts a failure occurrence distribution through hazard analysis.
- An alarm management module 252 manages the budget for dealing with failures and the progress of a plan for supplying parts.
- a free retrieval module 254 designates the retrieval of specified items from an intermediate file or a database.
- An intermediate file management module 256 manages the intermediate file and starts a database retrieval language.
- a database management module 258 is a database manager for the management and updating of the database and the retrieval of data from the database.
- An M-2050 communication module 260 controls data communication between the computer and the work station.
- Fig. 6 shows a procedure for the retrieval and analysis of quality data to be executed by the work station. Steps of the procedure shown in Fig. 6 will be described in order of data retrieval and data analysis.
- Conditions for data retrieval are set in step 61.
- Data is retrieved and a database management function to be executed in step 63 is started in step 62.
- data unavailable from the database is transferred from the computer to the database by a host access function and the data is registered in the database in step 64.
- An original data set retrieved in step 62 is written in a core storage. Items of data set selected in step 65 for data set item selection can be used for direct reference. The data set written in the core storage is analyzed.
- An analyzing method is specified in step 67, parameters for analysis are selected in step 68, and then the data is processed in step 69.
- a numerical operation is carried out according to the analyzing method specified in step 67, and then results of numerical operations are provided in an output format 72 specified by the analyzing method.
- the numerical operation conforming to the analyzing method calculates a management item shown in Fig. 7(a) for each item of data shown in Fig. 7(b).
- the integrated quality control method will be described as applied to the quality control of a series of air conditioners.
- Objective air conditioners for analysis for the improvement of the design and inspection system are chosen among a series of air conditioners by classifying the data representing the frequency of failure, the repair cost and the failure rate by the type of air conditioners.
- the results of classification are displayed as shown in Fig. 9(a). Assuming that an air conditioner of a type: RAC-2236HV, which is prominent in repair cost, is chosen as the object for analysis, the cursor of the computer display is placed under the bar indicating the repair cost for RAC-2236HV by means of a mouse and an instruction is given to select only the data of the air conditioner of RAC-2236HV.
- Components of the air conditioner of RAC-2236HV subject to design improvement and inspection system improvement are chosen with reference to diagrams showing the frequency of failure, the repair cost and the failure rate classified by part and by the condition of failure.
- Fig. 9(b) shows repair costs for the component parts of the air conditioner RAC-2236HV. From Fig. 9(b), the compressor, which is prominent in repair cost, is chosen. In choosing data of repair cost for compressors, which failed during operation, of the air conditioners of RAC-2326HV, the cursor is placed under a bar indicating the repair cost for compressors by means of the mouse and an instruction is entered. Components of compressors subject to design improvement and inspection system improvement are chosen by using a diagram of Fig. 9(c) showing the repair cost classified by the condition of failure. Thus, it is determined that the starting mechanism of the compressor is one of the most important objects of design improvement and inspection system improvement.
- Fig. 10(a) and 10(b) show a set of data-related tables providing typical data for explanation of causes of actual failure of product.
- the explanation of causes involves analyzing and developing in more detail the contents of analyzed data regarding specific factors and as described below enables processing in the manner indicated in Figs. 9(a)-9(c).
- the source data management table shown in Fig. 10(a) is a table that manages source data for the explanation of causes wherein one line represents the repair of one failure.
- the data on the repair of one failure comprises a plurality of items, each item containing independent information.
- a specified data processing method is applied to each column of the items for data analysis.
- the source data count table in Fig. 10(a) stores the number of data lines held in the source data management table.
- the analyzing management table in Fig. 10(b) is a table that manages the information for analyzing the source data.
- This table comprises an analysis item, a data processing method and an analyzing method.
- the analysis item contains an item number (1 - L) of the source data to be analyzed.
- the data processing method stores the type of processing to be made on the specified analysis item.
- the analyzing method contains the type of display to be made of the analyzed result.
- the specified data processing method is executed on the analysis item contained in the analyzing management table. The result of the analysis is displayed in accordance with the specified analyzing method.
- the explanation of causes management table in Fig. 10(b) accommodates an analyzing management table and the content of a data item, the table containing information necessary for the explanation of causes, the data item being specified by the analyzed data displayed according to the analyzing method, the data item being further accommodated as the content of explanation of causes.
- the explanation of causes count table in Fig. 10(b) stores the number of data items stored in the explanation of causes management table. When a plurality of data items are held in the explanation of causes table, a check is repeated as many times as the explanation of causes count to see if the content of explanation causes on the analysis items is the same. If all analysis items are found to be the same in content, the data items are judged to be subject to the explanation of causes; they are processed in accordance with the data processing method stored in the analyzing management table.
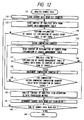
- Fig. 11 is a flow chart of the explanation of causes for a specific analysis item. It is assumed for the steps in the flow chart that all necessary data are set in the source data management table and in the source data count table shown in Fig. 10(a).
- Fig. 11 shows a flow chart for processing starting with step 111.
- the explanation of causes count in the explanation of causes count table is first cleared in step 112.
- the analyzing method, analysis item and data processing method i.e., the information held in the analyzing management table, are specified and set thereto in steps 113 to 115.
- step 116 source data is analyzed in accordance with the information set in the analyzing management table.
- the result of the analysis is displayed in step 117 according to the analyzing method contained in the analyzing management table. Based on the analyzed result, a check is made to see if the content thereof is analyzed and developed in more detail regarding the specific factor in question in step 118.
- steps 122 to 125 are carried out where one is specified out of the analysis items displayed by the analyzing method of the analyzing management table.
- the analyzed content of the specified factor is saved into the explanation of causes management table.
- the content of the analyzing management table indicative of the current content of analysis is saved into the explanation of causes management table.
- an explanation of causes management counter is incremented by 1. This completes the saving of the current analysis-related information.
- the information held in the analyzing management table is specified; where no specific factor is to be analyzed, i.e., No, a check is made to see if control is returned to the analysis of the preceding specific factor, which is the content of the preceding analysis as shown in step 119. If control is to be returned to the analysis of the preceding specific factor, i.e., Yes, the following takes place in accordance with steps 120 and 121:
- the analyzing method, analysis item and data processing method are retrieved from the explanation of causes management table and set into the analyzing means management table.
- the explanation of causes count table is then decremented by 1, and the analysis data is reconstructed.
- the source data is analyzed based on the information which was set from the explanation of causes management table to the analyzing management table, and the result of the analysis is displayed. If control is not returned to the analysis of the preceding specific factor, the whole processing comes to an end.
- Fig. 12 is a flow chart of source data analysis. The steps of this flow chart are intended to execute the data processing method on the content of the source data management table in accordance with the information from the analyzing management table with analyzing source data in step 131.
- a source data read-out counter is cleared first in step 132. Then the content of analysis items is read from the source data management table in step 133. Based on the value of the explanation of causes count table, a decision is made as to whether or not to perform an explanation of causes in step 134. If the explanation of causes is to be performed, i.e., Yes, a comparison counter is cleared in step 135. The content of the explanation of causes is read from the explanation of causes management table in step 136. A check is made to see if the content of the explanation of causes is the same as the analysis item stored in the explanation of causes management table of the source data in step 137. If the content and the item are the same, i.e., Yes, the explanation of causes comparison is incremented by 1 in step 138.
- step 142 When the value of the explanation of causes comparison counter becomes equal to the explanation of causes count, a check is made to see if the read position data equal to the value of the source data read-out counter is the analyzed data of the specific factor in step 139. Thereafter, the analysis item in the analyzing management table is analyzed in accordance with the data processing method in step 140. If the source data item is not the same as the content of the explanation of causes, or if no explanation of causes is to be carried out, no data processing is performed. Then the source data read-out counter is incremented by 1 in step 141. Until the value of the source data count table becomes equal to the value of the source data table read-out count, the aforesaid processing is repeated in step 142.
- Step A Find the total number of operating units N(t) and the number of failures r(t) for the number of months worked "t".
- Step C Plot (lnt, 1n ⁇ (t)) on a hazard rate graph
- Step D Apply a straight or broken line to the plotted points and select those that are applicable.
- Step E Find the parameter (m, ⁇ ) for the failure distribution (Weibull distribution) based on the gradient and intercept of the straight line.
- Step G Find the accumulated number of failures for the predicted month based on ⁇ n(t) ⁇ F(t), (n(t): number of units sold per month).
- the type of the product, the condition of failure, parts pertinent to the failure, measures taken to repair the failed product are reported by using a card upon the occurrence of the failure of the product.
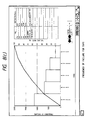
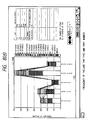
- life test operation products are started at the same time, whereas products installed for practical operation start operation at different times. Therefore, as shown in the upper left-hand corner of the right-hand column in Fig. 13, the respective failure rates of the products are calculated and classi fied by operating time represented by the number of operating months.
- Cumulative hazard values are determined from the failure rates and are plotted as a function of the number of operating months.
- the possibility of failure is estimated on the basis of the gradient and intercept of a straight line approximating the plots.
- a Weibull distribution is employed as a model for the estimation of the possibility of failure.
- the possibility of failure is estimated by using a function f(t) shown in the lower left-hand corner of Fig. 13 employing the gradient m and the intercept m ⁇ ln ⁇ determined by linear approximation are used as Weibull parameters.
- the present invention enables a work station to achieve all the necessary operations for the retrieval and analysis of quality data and hence sequences for data retrieval, data analysis request, data processing and output processing are executed in a real-time mode, so that the turnaround time of the analyzing tasks can be effectively curtailed.
- the present invention also enables the field serviceman assigned to the maintenance of the product installed in customer's working site to feed information concerning repair work performed by the field serviceman mostly on the site without delay through the station of the business department, such as the office of a special agent or a business office, to the factory, which is the principal department responsible for the design, manufacture and inspection of the product, in case the failure of the product occurs.
- the improvement of the design of the product under production and the inspection system for evaluating and inspecting the component parts of the product can be achieved without delay, and the information concerning the failure of the product is used effectively for designing a new product having an improved reliability.
- All the necessary operations for the retrieval and analysis of the quality data can be achieved at the work station and hence sequences for data retrieval, data analysis request, data processing and output processing can be carried out in a real-time mode, so that the turn-around time of analyzing tasks can be curtailed.
- the retrieval of records of source data and the development of the records on a memory at the work station enables the analysis of each item of data concerning the failure and repair of the product and combinations of the items of the data.
Landscapes
- Engineering & Computer Science (AREA)
- Physics & Mathematics (AREA)
- General Physics & Mathematics (AREA)
- Quality & Reliability (AREA)
- Automation & Control Theory (AREA)
- General Engineering & Computer Science (AREA)
- Theoretical Computer Science (AREA)
- Manufacturing & Machinery (AREA)
- Software Systems (AREA)
- Mathematical Physics (AREA)
- Databases & Information Systems (AREA)
- Data Mining & Analysis (AREA)
- Management, Administration, Business Operations System, And Electronic Commerce (AREA)
- General Factory Administration (AREA)
Claims (4)
- Integriertes Qualitätskontrollsystem, welches eine Datenbank (106) zum Sammeln von Herstellungsinformation einschließlich Konstruktionsinformation, Herstellungsablaufinformation und Prüfinformation eines Produkts, das in einem Herstellungsbetrieb (A, B, C, D) hergestellt wird, von Feldinformation einschließlich Fehlerinformation über das Produkt im Feld und Reparaturinformation über das Produkt und von Verkaufsinformation über das Produkt aufweist, wobei das System weiterhin aufweist:
eine Einrichtung zum Verbinden des Herstellungsbetriebs mit einer Service-Stelle (100) im Feld über Netzwerke (102, 104, 200, 210), wobei an der Service-Stelle (100) die Feldinformation (Fig. 2) in Verbindung mit Verarbeitungsinformation, die auf den im Feld vorgefallenen Fehler angewandt ist, oder mit Information über zumindest den Teils, den Fehlerzustand, den Namen des fehlerhaften Produkts und den Fehler des ausgefallenen Produkts empfangen wird und diese in der Datenbank (106) über die Netzwerke gespeichert wird;
eine Benutzerschnittstelleneinrichtung (204) zum Empfangen einer Analyseanforderung und zum Ausgeben einer grafischen Information, die Fehlerursachen für jeden Produkttyp auf der Grundlage von in der Datenbank gespeicherter Information analysiert;
ein Fehleranalysemodul (248) zum Anzeigen auf einem Monitor (212) einer Workstation (210) zumindest eines Übergangsdiagramms [Fig. 8(a)], von Graphen [Fig. 8(b), Fig. 8(c) und Fig. 8(e)], eines Konstruktionsverhältnisdiagramms [Fig. 8(d)] und eines Streudiagramms [Fig. 8(f)], wobei zumindest die Anzahl der Fehler, eine Reparaturgebühr und eine Fehlerrate [Fig. 7(a)] für eine Anzahl von Wiederauffindungsbedingungen [Fig. 7(b)] von zumindest einem Fehlerjahr und -monat, eines Produkttyps, eines Teilenamens, eines Fehlerzustandscodes und eines Betriebsmonats in Antwort auf die in der Datenbank (106) gespeicherte Information angegeben wird, wobei das Fehleranalysemodul (248) weiterhin Grenzwerte der Analyse anzeigt, und zwar jedes Mal, wenn die Wiederauffindungsbedingungen von der Benutzerschnittstelleneinrichtung empfangen werden, wobei die Anzeige wiederholt wird, wobei gleichzeitig die Wiederauffindungsbedingungen und der Analyseablauf aufgezeichnet werden und wobei die Wiederherstellung in einer umgekehrten Reihenfolge ermöglicht wird;
ein Fehlervorhersagemodul (250) zum Vorhersagen und Anzeigen auf einem Monitor der Workstation der Anzahl von Vorkommnissen von Fehlern für jeden zukünftigen Betriebsmonat [Fig. 13] gemäß Information über das Vorkommnis von Fehlern bis zum laufenden Zeitpunkt, welche in der Datenbank gespeichert ist, und über Verkaufs-(Liefer-)Information über das Produkt des Produkttyps oder das Produkt, das mit einem Teil mit diesem Teilenamen für den Produkttyp oder dem Teilenamen, der durch die Wiederauffindungsbedingungen, die dem Fehleranalysemodul hinzugefügt sind, definiert ist, ausgestattet ist; und
ein Alarmverwaltungsmodul (252) zum Erzeugen eines Alarms, wenn eine vorhergesagte Fehlerrate, die in dem Fehlervorkommnis-Vorhersagemodul vorhergesagt wird, einen Grenzwert einer Fehlerrate überschreitet, der zuvor für jeden Produkttyp festgelegt ist, und zum Vorhersagen des Zeitpunkts, zu dem der Grenzwert überschritten sein wird. - System gemäß Anspruch 1, wobei das Fehlervorhersagemodul (250) aufweist:
eine Einrichtung zum Feststellen der Gesamtzahl von Betriebseinheiten N(t) des Produkts und der Anzahl von Fehlern r(t) für die Anzahl von gearbeiteten Monaten, wobei "t" auf der Verkaufs-(Liefer-)Information des in der Datenbank gespeicherten Produkts basiert;
eine Einrichtung zum Bestimmen einer Fehlerrate unter Verwendung der Gleichung λ(t) = r(t)/N (t);
eine Einrichtung zum Auftragen (ln t, ln Σλ(t)) auf einem Schnellratengraph und zum Anbringen einer Linie an die aufgezeichneten Punkte bei Auswählen geeigneter Punkte;
eine Einrichtung zum Bestimmen des Parameters (m, η) für eine Weibull-Fehlerverteilung auf der Grundlage des Gradienten und des Schnittpunkts der Linie;
eine Einrichtung zum Verwenden des so bestimmten Parameters (m, η) und gemäß der Gleichung
eine Einrichtung zum Bestimmen der akkumulierten Anzahl von Fehlern für den Vorhersagemonat auf der Grundlage von Σn(t)·F(t), wobei n(t) die Anzahl von Produkteinheiten ist, die pro Monat verkauft ist;
eine Einrichtung zum Bestimmen der akkumulierten Fehlerrate für den Vorhersagemonat auf der Grundlage von Σn(t)·F(t)/N, wobei N = Σn(t) die verkaufte Gesamtzahl der Produkteinheiten ist;
eine Einrichtung zum Vorhersagen der Anzahl von Vorkommnissen von Fehlern für jeden zukünftigen Betriebsmonat für den Produkttyp oder den Teilenamen; und
eine Einrichtung zum Anzeigen des Vorhersageergebnisses auf dem Monitor. - System gemäß Anspruch 1 oder 2, wobei das Fehleranalysemodul (248) aufweist:
eine Einrichtung zum Zugreifen auf und zum Durchsuchen der Datenbank und zum Anzeigen von grafischer Information für die Vielzahl von Produkten, zum Auswählen eines Produkts aus der Vielzahl von Produkten zur Anzeige von Information, die sich spezifisch darauf bezieht, und zum Anzeigen von Information des ausgewählten Produkts, die sich spezifisch darauf bezieht, ohne erneut auf die Datenbank zuzugreifen. - System gemäß einem der vorhergehenden Ansprüche, wobei das Fehleranalysemodul (248) aufweist:
eine Einrichtung zum Korrelieren der Information, die sich auf den Fehler des Produkts bezieht, und der Verarbeitung, die angewandt wurde, um den Fehler zu korrigieren, mit der Information, die sich auf die Herstellung und den Verkauf des Produkts bezieht, die in der Datenbank gespeichert ist;
eine Einrichtung zum Anzeigen der korrelierten Information auf eine fortlaufende Weise in Abhängigkeit von begrenzten vorbestimmten Parametern des Produkts und zum Erweitern der Anzeige auf der Grundlage der vorbestimmten Parameter; und
eine Einrichtung zum Anzeigen der korrelierten Information in unterschiedlichen grafischen Formen, zum Anwenden vorbestimmter Parameter auf eine der grafischen Formen, und zum Anzeigen der korrelierten Information in einer unterschiedlichen grafischen Form, was eine Erweiterung der Anzeige auf der Grundlage der vorbestimmten Parameter darstellt.
Applications Claiming Priority (2)
| Application Number | Priority Date | Filing Date | Title |
|---|---|---|---|
| JP6700690 | 1990-03-19 | ||
| JP67006/90 | 1990-03-19 |
Publications (3)
| Publication Number | Publication Date |
|---|---|
| EP0448044A2 EP0448044A2 (de) | 1991-09-25 |
| EP0448044A3 EP0448044A3 (en) | 1992-11-19 |
| EP0448044B1 true EP0448044B1 (de) | 1995-08-09 |
Family
ID=13332411
Family Applications (1)
| Application Number | Title | Priority Date | Filing Date |
|---|---|---|---|
| EP91104243A Expired - Lifetime EP0448044B1 (de) | 1990-03-19 | 1991-03-19 | Integriertes System zur Qualitätskontrolle |
Country Status (4)
| Country | Link |
|---|---|
| US (1) | US5245554A (de) |
| EP (1) | EP0448044B1 (de) |
| KR (1) | KR910017313A (de) |
| DE (1) | DE69111861T2 (de) |
Cited By (1)
| Publication number | Priority date | Publication date | Assignee | Title |
|---|---|---|---|---|
| EP0785491A3 (de) * | 1996-01-29 | 1998-01-07 | Toyota Jidosha Kabushiki Kaisha | Verfahren und System zur Verwaltung von Bau- und Produktionsinformation |
Families Citing this family (40)
| Publication number | Priority date | Publication date | Assignee | Title |
|---|---|---|---|---|
| FI930877A7 (fi) * | 1992-11-30 | 1994-05-31 | Pfu Ltd | Maongsidigt produktionssystem och metod foer anvaendning av detta |
| US5452218A (en) * | 1994-02-03 | 1995-09-19 | Texas Instruments | System and method for determining quality analysis on fabrication and/or assembly design using shop capability data |
| US5440478A (en) * | 1994-02-22 | 1995-08-08 | Mercer Forge Company | Process control method for improving manufacturing operations |
| US5765038A (en) * | 1994-04-19 | 1998-06-09 | International Business Machines Corporation | Integration of groupware with the integrated quality control methodology via facilitated work sessions |
| US5729452A (en) * | 1995-03-31 | 1998-03-17 | Envirotest Acquisition Co. | Method and system for diagnosing and reporting failure of a vehicle emission test |
| US5715181A (en) * | 1995-04-03 | 1998-02-03 | Horst; Robert L. | Isogrammetric analysis method for high-yield processes |
| US5586059A (en) * | 1995-06-07 | 1996-12-17 | Advanced Micro Devices, Inc. | Automated data management system for analysis and control of photolithography stepper performance |
| WO1997007443A1 (en) * | 1995-08-18 | 1997-02-27 | Dornan Research & Development Limited | Validation control system |
| US5748500A (en) * | 1995-11-14 | 1998-05-05 | Electric Power Research Institute, Inc. | System to assess the starting performance of a turbine |
| US5812055A (en) * | 1996-05-31 | 1998-09-22 | Eskom | Monitoring of a system |
| TWI249760B (en) * | 1996-07-31 | 2006-02-21 | Canon Kk | Remote maintenance system |
| JPH10173021A (ja) * | 1996-12-12 | 1998-06-26 | Mitsubishi Electric Corp | 製造ライン解析方法及び製造ライン解析装置 |
| US5918191A (en) * | 1997-03-11 | 1999-06-29 | Certified Measurements, Inc. | System and method for managing data for an equipment calibration laboratory |
| JP3588531B2 (ja) * | 1997-03-24 | 2004-11-10 | 株式会社ルネサステクノロジ | 不良解析装置 |
| US6336078B1 (en) * | 1997-09-30 | 2002-01-01 | Canon Kabushiki Kaisha | Quality management of components |
| US6549820B1 (en) * | 1998-07-31 | 2003-04-15 | The Boeing Company | Method and system for providing feedback from a non-destructive inspection of a composite part |
| JP2002117107A (ja) * | 1999-09-02 | 2002-04-19 | Ricoh Co Ltd | 生産管理システム、生産管理システムにおけるクライアント、生産管理システムにおける生産管理方法、生産管理システムにおけるデータ検索方法、およびその方法を実行させるためのプログラムを記録したコンピュータが読取可能な記録媒体 |
| JP2001134798A (ja) * | 1999-11-08 | 2001-05-18 | Nippon Chem Ind Co Ltd | 製品品質管理情報システム |
| AU2001255568A1 (en) * | 2000-12-29 | 2002-07-16 | General Electric Company | Method and system for identifying repeatedly malfunctioning equipment |
| ITBO20010330A1 (it) | 2001-05-25 | 2002-11-25 | Gd Spa | Metodo per la stima dell'efficienza di una macchina automatica |
| KR100941558B1 (ko) | 2001-05-29 | 2010-02-10 | 웨스팅하우스 일렉트릭 컴퍼니 엘엘씨 | 복합 플랜트의 안정성 모니터링 디스플레이 시스템 |
| DE10161424A1 (de) * | 2001-12-13 | 2003-07-03 | Winkler & Duennebier Ag | Verfahren und Vorrichtung zum Erkennen von Produktfehlern bei der Herstellung von Briefhüllen, Versandtaschen und dergleichen |
| US6714893B2 (en) * | 2002-02-15 | 2004-03-30 | International Business Machines Corporation | Enhanced concern indicator failure prediction system |
| US20030212518A1 (en) * | 2002-05-09 | 2003-11-13 | Johnson & Johnson | System and method for quality performance evaluation and reporting |
| FR2847686B1 (fr) * | 2002-11-21 | 2005-02-18 | Renault Automation Comau | Procede d'echantillonnage et produit logiciel adapte a sa gestion |
| US6823287B2 (en) * | 2002-12-17 | 2004-11-23 | Caterpillar Inc | Method for predicting the quality of a product |
| JP3731125B2 (ja) * | 2003-03-03 | 2006-01-05 | ダイキン工業株式会社 | 保守情報提供システム |
| TWI279734B (en) * | 2003-09-12 | 2007-04-21 | Hon Hai Prec Ind Co Ltd | System for managing action of correcting quality problems |
| US20050076276A1 (en) * | 2003-10-07 | 2005-04-07 | International Business Machines Corporation | System and method for defect projection in transaction management in a target computer environment |
| US7716239B2 (en) * | 2004-07-20 | 2010-05-11 | Siemens Energy, Inc. | Apparatus and method for performing process hazard analysis |
| US20060129265A1 (en) * | 2004-12-11 | 2006-06-15 | Ouchi Norman K | Directed defective item repair system and methods |
| US20070203912A1 (en) * | 2006-02-28 | 2007-08-30 | Thuve Matthew L | Engineering manufacturing analysis system |
| US7970711B2 (en) * | 2006-05-12 | 2011-06-28 | Accenture Global Services Gmbh | Warranty management system and method |
| US20100161374A1 (en) * | 2008-11-26 | 2010-06-24 | Jim Horta | Real-Time Quality Data and Feedback for Field Inspection Systems and Methods |
| JP6898748B2 (ja) * | 2017-02-16 | 2021-07-07 | 株式会社Nttファシリティーズ | 設備異常分析システム、設備異常分析方法、およびプログラム |
| DE102017217967A1 (de) * | 2017-10-09 | 2019-04-11 | Sieb & Meyer Ag | Verfahren zur Bestimmung von Positionsfehlern von Bohrungen und Sicherung des Bohrprozesses |
| DE102019116139A1 (de) | 2019-06-13 | 2020-12-17 | Endress+Hauser Group Services Ag | Verfahren zum Überprüfen des Produktionsprozesses von Feldgeräten mittels eines Machine-Learning-, bzw. Prognosesystems |
| DE102019116137B8 (de) * | 2019-06-13 | 2024-03-07 | Endress+Hauser Group Services Ag | Verfahren zum Überprüfen des Produktionsprozesses von Feldgeräten |
| CN113010950B (zh) * | 2021-03-15 | 2024-09-20 | 珠海格力智能装备有限公司 | 工厂布局处理方法、装置、存储介质及处理器 |
| CN117132005B (zh) * | 2023-10-16 | 2024-02-27 | 浙江春风动力股份有限公司 | 高度离散、高度柔性下的大排量摩托车低成本制造系统 |
Family Cites Families (5)
| Publication number | Priority date | Publication date | Assignee | Title |
|---|---|---|---|---|
| USRE31247E (en) * | 1974-01-15 | 1983-05-17 | Kearney & Trecker Corporation | Diagnostic communications system for computer controlled machine tools |
| US4057847A (en) * | 1976-06-14 | 1977-11-08 | Sperry Rand Corporation | Remote controlled test interface unit |
| JPH0778810B2 (ja) * | 1983-11-18 | 1995-08-23 | 株式会社日立製作所 | 製造工程の信頼性分析システム |
| US4967381A (en) * | 1985-04-30 | 1990-10-30 | Prometrix Corporation | Process control interface system for managing measurement data |
| US5134574A (en) * | 1990-02-27 | 1992-07-28 | The Foxboro Company | Performance control apparatus and method in a processing plant |
-
1991
- 1991-03-18 KR KR1019910004241A patent/KR910017313A/ko not_active Ceased
- 1991-03-19 DE DE69111861T patent/DE69111861T2/de not_active Expired - Lifetime
- 1991-03-19 EP EP91104243A patent/EP0448044B1/de not_active Expired - Lifetime
- 1991-03-19 US US07/672,112 patent/US5245554A/en not_active Expired - Lifetime
Non-Patent Citations (1)
| Title |
|---|
| NAKAYAMA: 'failure analysis for automatic identification systems' * |
Cited By (2)
| Publication number | Priority date | Publication date | Assignee | Title |
|---|---|---|---|---|
| EP0785491A3 (de) * | 1996-01-29 | 1998-01-07 | Toyota Jidosha Kabushiki Kaisha | Verfahren und System zur Verwaltung von Bau- und Produktionsinformation |
| US5806069A (en) * | 1996-01-29 | 1998-09-08 | Toyota Jidosha Kabushiki Kaisha | Method and system of managing construction-related information and production-related information |
Also Published As
| Publication number | Publication date |
|---|---|
| EP0448044A2 (de) | 1991-09-25 |
| DE69111861D1 (de) | 1995-09-14 |
| EP0448044A3 (en) | 1992-11-19 |
| DE69111861T2 (de) | 1996-04-18 |
| US5245554A (en) | 1993-09-14 |
| KR910017313A (ko) | 1991-11-05 |
Similar Documents
| Publication | Publication Date | Title |
|---|---|---|
| EP0448044B1 (de) | Integriertes System zur Qualitätskontrolle | |
| US5596712A (en) | Method and system for diagnosis and analysis of products troubles | |
| Ittner et al. | An empirical examination of dynamic quality-based learning models | |
| JP6926008B2 (ja) | 保守計画装置、及び保守計画方法 | |
| US5740429A (en) | E10 reporting tool | |
| US8185346B2 (en) | Dynamic maintenance plan for an industrial robot | |
| US5767848A (en) | Development support system | |
| JP2000155700A (ja) | 品質情報収集診断システムおよびその方法 | |
| Howell et al. | Operating Controls in the New Manufacturing Environment (Part 3)[2] | |
| US20020078403A1 (en) | Reliability assessment and prediction system and method for implementing the same | |
| CN107850889A (zh) | 管理系统及管理方法 | |
| KR20050119168A (ko) | 예방 유지보수 절차의 통계적 분석 및 제어 | |
| Rahim et al. | Integrated models in production planning, inventory, quality, and maintenance | |
| JP2642438B2 (ja) | プラント機器保守管理支援装置 | |
| EP1220097A2 (de) | Geräteverwaltungs-Verfahren, -System, und -Programm-Produkt | |
| JP4309803B2 (ja) | 保守支援プログラム | |
| CN112700095A (zh) | 电池包生产管理系统 | |
| US20030046250A1 (en) | System and method for integrated reliability and warranty financial planning | |
| CN117829736A (zh) | 基于项目进度的备件库存调整系统 | |
| Son | Simulation-based manufacturing accounting for modern management | |
| JP2003016226A (ja) | 製品市場品質情報解析支援装置、製品市場品質情報解析支援システム及び製品市場品質情報解析支援用プログラム | |
| House et al. | Logistics system modelling | |
| BENSON et al. | Benchmarking manufacturing performance in the semiconductor industry | |
| Blanks | The challenge of quantitative reliability | |
| JPH0561877A (ja) | 品質データ表示方法 |
Legal Events
| Date | Code | Title | Description |
|---|---|---|---|
| PUAI | Public reference made under article 153(3) epc to a published international application that has entered the european phase |
Free format text: ORIGINAL CODE: 0009012 |
|
| 17P | Request for examination filed |
Effective date: 19910319 |
|
| AK | Designated contracting states |
Kind code of ref document: A2 Designated state(s): DE FR GB NL |
|
| PUAL | Search report despatched |
Free format text: ORIGINAL CODE: 0009013 |
|
| AK | Designated contracting states |
Kind code of ref document: A3 Designated state(s): DE FR GB NL |
|
| 17Q | First examination report despatched |
Effective date: 19940117 |
|
| GRAA | (expected) grant |
Free format text: ORIGINAL CODE: 0009210 |
|
| AK | Designated contracting states |
Kind code of ref document: B1 Designated state(s): DE FR GB NL |
|
| PG25 | Lapsed in a contracting state [announced via postgrant information from national office to epo] |
Ref country code: FR Free format text: THE PATENT HAS BEEN ANNULLED BY A DECISION OF A NATIONAL AUTHORITY Effective date: 19950809 |
|
| REF | Corresponds to: |
Ref document number: 69111861 Country of ref document: DE Date of ref document: 19950914 |
|
| EN | Fr: translation not filed | ||
| PLBE | No opposition filed within time limit |
Free format text: ORIGINAL CODE: 0009261 |
|
| STAA | Information on the status of an ep patent application or granted ep patent |
Free format text: STATUS: NO OPPOSITION FILED WITHIN TIME LIMIT |
|
| 26N | No opposition filed | ||
| REG | Reference to a national code |
Ref country code: GB Ref legal event code: IF02 |
|
| PGFP | Annual fee paid to national office [announced via postgrant information from national office to epo] |
Ref country code: GB Payment date: 20100302 Year of fee payment: 20 |
|
| PGFP | Annual fee paid to national office [announced via postgrant information from national office to epo] |
Ref country code: NL Payment date: 20100225 Year of fee payment: 20 Ref country code: DE Payment date: 20100318 Year of fee payment: 20 |
|
| REG | Reference to a national code |
Ref country code: DE Ref legal event code: R071 Ref document number: 69111861 Country of ref document: DE |
|
| REG | Reference to a national code |
Ref country code: NL Ref legal event code: V4 Effective date: 20110319 |
|
| REG | Reference to a national code |
Ref country code: GB Ref legal event code: PE20 Expiry date: 20110318 |
|
| PG25 | Lapsed in a contracting state [announced via postgrant information from national office to epo] |
Ref country code: NL Free format text: LAPSE BECAUSE OF EXPIRATION OF PROTECTION Effective date: 20110319 |
|
| PG25 | Lapsed in a contracting state [announced via postgrant information from national office to epo] |
Ref country code: GB Free format text: LAPSE BECAUSE OF EXPIRATION OF PROTECTION Effective date: 20110318 |
|
| PG25 | Lapsed in a contracting state [announced via postgrant information from national office to epo] |
Ref country code: DE Free format text: LAPSE BECAUSE OF EXPIRATION OF PROTECTION Effective date: 20110319 |