WO2025046894A1 - 分析プログラム、分析装置、支援システム及び分析方法 - Google Patents
分析プログラム、分析装置、支援システム及び分析方法 Download PDFInfo
- Publication number
- WO2025046894A1 WO2025046894A1 PCT/JP2023/032020 JP2023032020W WO2025046894A1 WO 2025046894 A1 WO2025046894 A1 WO 2025046894A1 JP 2023032020 W JP2023032020 W JP 2023032020W WO 2025046894 A1 WO2025046894 A1 WO 2025046894A1
- Authority
- WO
- WIPO (PCT)
- Prior art keywords
- equipment
- analysis
- control program
- simulation
- controlled
- Prior art date
- Legal status (The legal status is an assumption and is not a legal conclusion. Google has not performed a legal analysis and makes no representation as to the accuracy of the status listed.)
- Pending
Links
Images


Classifications
-
- G—PHYSICS
- G05—CONTROLLING; REGULATING
- G05B—CONTROL OR REGULATING SYSTEMS IN GENERAL; FUNCTIONAL ELEMENTS OF SUCH SYSTEMS; MONITORING OR TESTING ARRANGEMENTS FOR SUCH SYSTEMS OR ELEMENTS
- G05B19/00—Program-control systems
- G05B19/02—Program-control systems electric
- G05B19/04—Program control other than numerical control, i.e. in sequence controllers or logic controllers
- G05B19/05—Programmable logic controllers, e.g. simulating logic interconnections of signals according to ladder diagrams or function charts
Definitions
- This disclosure relates to an analysis program, an analysis device, a support system, and an analysis method.
- Patent Document 1 discloses a production line.
- Patent Document 1 suggests improvement measures based on past performance. For this reason, it cannot be applied in cases where past performance is insufficient. However, in cases such as before the launch of a new facility, it would be beneficial for the user if it could provide improvements to the production equipment that the user designed.
- the analysis program disclosed herein causes a computer to function as: an acquisition means for acquiring a control program to be executed by a programmable controller, and equipment information indicating the arrangement, size, and operating range in three-dimensional space of the controlled equipment controlled by execution of the control program; a simulation means for simulating the control of the controlled equipment by the programmable controller based on the control program and the equipment information; and an analysis means for analyzing, from the simulation results by the simulation means, changes in the control of the controlled equipment that will improve the production index of the line including the controlled equipment.
- FIG. 1 is a diagram showing a first example of a configuration of a support system according to a first embodiment
- FIG. 2 is a diagram showing a second example of the configuration of the support system according to the first embodiment
- FIG. 1 is a diagram showing a first example of a facility layout according to the first embodiment
- FIG. 1 is a diagram showing an example of a time chart according to the first embodiment
- FIG. 1 is a diagram showing an example of a control program according to the first embodiment.
- FIG. 1 is a diagram showing a hardware configuration of an assistance device according to a first embodiment.
- FIG. 1 is a diagram showing a functional configuration of an assistance device according to a first embodiment
- FIG. 1 is a diagram showing an example of facility data according to the first embodiment;
- FIG. 1 is a diagram showing an example of time length information according to the first embodiment; 1 is a flowchart showing a time chart generation process according to the first embodiment.
- FIG. 1 is a diagram showing an example of a screen displayed by the support device according to the first embodiment;
- FIG. 13 is a diagram showing an example of displaying variation in an operation according to the first embodiment;
- FIG. 1 is a diagram showing an example of displaying a temporal causal relationship according to the first embodiment;
- FIG. 1 is a diagram showing an example of displaying a conditional causal relationship according to the first embodiment;
- FIG. 1 is a first diagram showing a modified example of the display of a time chart according to the first embodiment;
- FIG. 13 is a diagram showing an example of a modification of the control content according to the first embodiment.
- FIG. 1 is a diagram showing a second example of the layout of facilities according to the first embodiment;
- FIG. 2 is a second diagram showing a modified example of the display of the time chart according to the first embodiment;
- FIG. 1 is a diagram showing an example of an interlock according to the first embodiment;
- FIG. 1 is a diagram showing an example of settings related to a control program according to the first embodiment;
- FIG. 1 is a diagram showing an example of a unit that groups together actuators according to the first embodiment;
- FIG. 13 is a diagram showing a modified example of the control program according to the second embodiment.
- FIG. 13 is a diagram showing a modified example of the time chart according to the second embodiment;
- FIG. 11 is a diagram showing a first example of parameter derivation according to the second embodiment;
- FIG. 11 is a diagram showing a second example of parameter derivation according to the second embodiment;
- FIG. 11 is a diagram showing a third example of parameter derivation according to the second embodiment;
- FIG. 13 is a diagram showing a display example of a time chart according to the second embodiment;
- FIG. 13 shows an additional example of an interlock according to the second embodiment.
- FIG. 13 is a diagram showing an example of editing a time chart according to the second embodiment;
- FIG. 13 is a diagram showing a first example of a display according to the third embodiment.
- FIG. 13 is a diagram showing a second example of a display according to the third embodiment.
- FIG. 11 is a diagram showing a third example of a display according to the third embodiment.
- FIG. 11 is a diagram showing a fourth example of a display according to the third embodiment.
- FIG. 13 is a diagram showing a display example of a screen according to the third embodiment;
- FIG. 13 is a diagram showing a first example of an improvement measure according to the fourth embodiment.
- FIG. 13 is a diagram showing a second example of an improvement measure according to the fourth embodiment.
- FIG. 13 is a diagram showing a third example of an improvement measure according to the fourth embodiment.
- FIG. 13 is a diagram showing a fourth example of an improvement measure according to the fourth embodiment.
- FIG. 13 is a diagram showing a fifth example of an improvement measure according to the fourth embodiment.
- FIG. 13 is a diagram showing a sixth example of an improvement measure according to the fourth embodiment.
- FIG. 13 is a diagram showing a display example of a screen according to the third embodiment;
- FIG. 13 is a diagram showing a first example of an improvement measure according to the fourth embodiment.
- FIG. 13 is a diagram showing a second example of an
- FIG. 13 is a diagram showing an example of support information according to the fourth embodiment.
- FIG. 13 is a diagram showing a seventh example of an improvement measure according to the fourth embodiment.
- FIG. 13 is a diagram showing an eighth example of an improvement measure according to the fourth embodiment.
- FIG. 13 shows a ninth example of an improvement measure according to the fourth embodiment.
- FIG. 13 is a diagram showing a proposed example of adding a sensor according to the fourth embodiment;
- a support system 1000 is a system that supports a user 40 in designing a facility including a PLC 20 and equipment 31, 32.
- the example in Fig. 1 shows a state before the start-up of a facility represented by a factory, and the PLC 20 and equipment 31, 32 are the targets of a simulation.
- the support system 1000 is a system that supports a user 40 who desires to improve a production index represented by a cycle time, for the PLC 20 and equipment 31, 32 that are actually installed and in operation in a facility.
- the support system 1000 has a support device 10 that supports a user 40 by presenting various information.
- the support device 10 is a terminal device such as an IPC (Industrial Personal Computer), or a GOT (Graphic Operation Terminal) or display device that is connected to a PLC 20 and functions primarily as a UI (User Interface) terminal for the PLC 20.
- IPC Intelligent Personal Computer
- GOT Graphic Operation Terminal
- display device that is connected to a PLC 20 and functions primarily as a UI (User Interface) terminal for the PLC 20.
- the support device 10 may receive a time chart 11 designed by a user 40 and output support information created based on the received time chart 11 to the user 40, or may generate a time chart 11 based on input information input by the user 40 and provide it to the user 40 as support information.
- the time chart 11 is a chart diagram showing the progress of the operation of the equipment 31, 32. Note that in this embodiment, an example in which the support device 10 generates a time chart 11 and provides it to the user 40 will be mainly described.
- the support device 10 may also accept a control program 12 created by a user 40 and output support information created based on the accepted control program 12 to the user 40, or may generate a control program 12 based on input information input by the user 40 and provide it to the user 40 as support information, or have the PLC 20 execute it.
- the control program 12 is a program executed by the PLC 20 to control the equipment 31, 32, and is, for example, a sequence program written in ladder language.
- the control processing defined in the control program 12 is usually executed repeatedly by the PLC 20 to perform the same process on multiple workpieces.
- the support device 10 also has a 3D (3-dimensions) simulator 13 that simulates the operation of the equipment 31, 32 controlled by the PLC 20 in a three-dimensional space.
- the 3D simulator 13 receives information from the user 40 indicating the details of the equipment 31, 32, such as the model, model number, size, shape, position and posture in the facility, and the size, distance, direction, speed, range, time, pressure, temperature and strength of the operation when an operation command specified by the control program 12 is given.
- the user 40 selects the equipment 31, 32 to be placed in the facility from a library of various devices prepared in advance and places it in a three-dimensional virtual space corresponding to the facility.
- the 3D simulator simulates the operation of the equipment 31, 32 in the three-dimensional virtual space by virtually executing the control program 12 provided by the user 40 or the control program 12 generated by the support device 10. Furthermore, the 3D simulator 13 accepts settings for the placement and movement of the walls, floors, and ceilings of the facility, as well as the equipment 31 and 32, the pillars and foundations within the facility, workers, AGVs (Automated Guided Vehicles), and other elements not controlled by the control program 12, and simulates the operations in the virtual space described above.
- AGVs Automate Guided Vehicles
- the 3D simulator 13 is primarily used to allow a user 40 to consider the operation and production index of a facility before the facility is launched, but may also be used to support a user 40 who wishes to improve production indexes even after the launch of a facility such as that shown in FIG. 2.
- the mechanical engineer who designs the equipment and the SW (Software) engineer who designs the software are often different. It is desirable that the mechanical engineer provisionally decides on the equipment and creates a time chart, the SW engineer creates the basic model of the software, and then the two engineers work together to brush up on what they have created, and that actual operation begins only when it is certain that a production index exceeding a certain level can be achieved.
- actual operation often begins without such preparation. For example, as a result of starting operation without creating a time chart, improvement measures are drawn up after it is found that the production index is low, and SW engineers are forced to create a time chart instead of the mechanical engineer, which results in an excessive workload.
- the support device 10 creates a time chart to support the user 40, thereby contributing to the early realization of efficient control processing by the PLC 20.
- PLC 20 is a control device that controls equipment 31, 32 by executing a control program 12 written in advance in a facility.
- PLC 20 may be connected to equipment 31, 32 by a signal line that transmits a voltage signal or a current signal, or may be connected to equipment 31, 32 via a field network.
- equipment 31, 32 may be referred to as equipment 30 without distinction.
- PLC 20 corresponds to an example of a programmable controller
- equipment 30 corresponds to an example of a controlled device.
- Equipment 31, 32 each have axes 31a, 32a as operating parts.
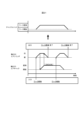
- equipment 301-303, 311-313 are installed in a facility.
- equipment 301 which is a servo motor, rotates an axis, which is a ball screw, to move the support platform on which workpiece 41 is placed, from point A to point C via point B in the figure, and transports workpiece 41 to directly below equipment 303, which is an air chuck.
- equipment 302 which is an air cylinder, lowers a piston rod by air drive, and equipment 303 attached to said piston rod grips workpiece 41.
- equipment 311 which serves as a sensor that detects that the piston rod of equipment 302 is at the lowering end
- equipment 312 which serves as a sensor that detects that equipment 303 is in a gripping state
- equipment 313, which serves as a sensor that detects that the piston rod of equipment 302 is at the upper end.
- the equipment 30 also operates according to the control program 12 in the process before the workpiece 41 is placed on the support table and in the process after the workpiece 41 is gripped by the equipment 303, but details of these processes are omitted.
- FIG. 4 An example of a time chart showing the operation of the equipment shown in FIG. 3 is shown in FIG. 4.
- the time chart is a graph showing the transition of the machine position of the equipment 30 or each of its axes of operation, with the horizontal axis representing time and the vertical axis representing the equipment 30 or each of its axes of operation.
- the time chart includes lines showing the causal relationship between the operation of the equipment 30 and the events that trigger the operation. In FIG. 4, the causal relationship is shown by a dashed arrow.
- dashed arrow 501 shows that a trigger occurs in which the device value "M0" corresponding to the operation command for "workpiece grip” turns ON, resulting in the device value “Y0” turning ON and the air cylinder executing the operation of pushing out the piston.
- dashed arrow 502 shows that a trigger occurs in which the device value "X0" corresponding to the detection result of the equipment 311, which is a sensor, turns ON, resulting in the device value "Y1" turning ON and the air chuck starting the operation of gripping the workpiece.
- the dashed arrow 503 shows that when the air chuck grips the workpiece, a trigger is generated in which the device value "X1" corresponding to the detection result of the equipment 312, which is a sensor, turns ON, causing the device value "Y2" to turn ON and the air cylinder to perform the operation of returning the piston. Furthermore, the dashed arrow 504 shows that when the piston of the air cylinder returns, a trigger is generated in which the device value "X2" corresponding to the detection result of the equipment 313, which is a sensor, turns ON, causing the PLC 20 to determine that gripping of the workpiece has been completed based on the device value "M3".
- the time chart shows device values X0, X1, X2, Y0, Y1, Y2, M0, M1, and M2 written in the control program 12.
- These device values correspond to variables used in the control program 12 and are values stored in the memory of the PLC 20. Some or all of the device values are shared with the equipment 30, and signals are transmitted between the PLC 20 and the equipment 30 using these device values.
- the control program 12 includes input variables X0, X1, and X2, each of which is named by combining "X”, which indicates that the signal is input to the PLC 20, with a numerical value that identifies the input signal; output variables Y0, Y1, and Y2, each of which is named by combining "Y”, which indicates that the signal is output from the PLC 20 to the equipment 30, with a numerical value that identifies the output signal; and intermediate variables M0, M1, and M2, each of which is named by combining "M", which indicates that the variable is used within the control program 12, with a numerical value that identifies the value.
- FIG. 5 shows representative control processes corresponding to the arrows 501 to 504 in FIG. 4, and other control processes are omitted.
- the control program 12 may include descriptions for manual operation and descriptions for automatic operation. In manual operation, it is desirable to specify a large number of interlock conditions to ensure safe operation. In contrast, in automatic operation, the minimum necessary interlock conditions that meet predetermined standards are left, and other conditions are excluded from the calculation target during program execution by Assert, thereby speeding up the scan period of the PLC 20.
- the sensor output may not be read when the ON/OFF of the sensor output is switched instantaneously, so speeding up the scan period can reduce the risk of errors due to such reading errors. In addition, speeding up the scan period can also contribute to shortening the cycle time.
- the support device 10 is composed of hardware elements for functioning as a computer.
- the support device 10 has a processor 101, a main memory unit 102, an auxiliary memory unit 103, an input unit 104, an output unit 105, and a communication unit 106.
- the main memory unit 102, the auxiliary memory unit 103, the input unit 104, the output unit 105, and the communication unit 106 are all connected to the processor 101 via an internal bus 107.
- the processor 101 includes a CPU (Central Processing Unit) or MPU (Micro Processing Unit) as a processing circuit.
- the processor 101 executes a program P1 stored in the auxiliary storage unit 103 to realize various functions and execute the processes described below.
- the program P1 may be a software application equivalent to a so-called engineering tool.
- the program P1 corresponds to an example of an analysis program.
- the main memory unit 102 includes a RAM (Random Access Memory).
- the program P1 is loaded into the main memory unit 102 from the auxiliary memory unit 103.
- the main memory unit 102 is used as a working area for the processor 101.
- the auxiliary memory unit 103 includes non-volatile memory such as an EEPROM (Electrically Erasable Programmable Read-Only Memory) and a HDD (Hard Disk Drive). In addition to the program P1, the auxiliary memory unit 103 stores various data used in the processing of the processor 101. The auxiliary memory unit 103 supplies the processor 101 with data used by the processor 101 in accordance with instructions from the processor 101. The auxiliary memory unit 103 also stores data supplied from the processor 101.
- EEPROM Electrically Erasable Programmable Read-Only Memory
- HDD Hard Disk Drive
- the input unit 104 includes input devices such as hardware switches, input keys, a keyboard, a pointing device, and a microphone.
- the input unit 104 acquires information input by a user and notifies the processor 101 of the acquired information.
- the user may input information via a GUI (Graphical User Interface) or by voice input.
- GUI Graphic User Interface
- the output unit 105 includes output devices such as an LED (Light Emitting Diode), an LCD (Liquid Crystal Display), and a speaker.
- the output unit 105 presents various information to the user according to instructions from the processor 101.
- the communication unit 106 includes a communication interface circuit for communicating with an external device.
- the communication unit 106 receives a signal from the outside and outputs data indicated by this signal to the processor 101.
- the communication unit 106 also transmits a signal indicating the data output from the processor 101 to the external device.
- the support device 10 has a memory unit 110 that stores various data, an acquisition unit 120 that acquires information from the outside, a 3D simulator 13 that simulates the operation of the equipment 30 in a three-dimensional virtual space, a generation unit 140 that generates support information including a time chart, a correction unit 150 that appropriately corrects the data in the memory unit 110, an analysis unit 160 that analyzes the data in the memory unit 110, an interface unit 170 that relays the exchange of information with the outside, and a display unit 180 that presents information to the user 40.
- the memory unit 110 is mainly realized by at least one of the main memory unit 102 and the auxiliary memory unit 103.
- the data stored in the memory unit 110 includes data written in advance in the support device 10 and data acquired by the acquisition unit 120.
- the memory unit 110 stores an equipment library 111 indicating specifications including details of the model, shape, and operation of a large number of pieces of equipment that can be arranged in the virtual space, time chart data 112 indicating a time chart generated by the generation unit 140, equipment data 113 regarding the equipment 30 arranged in the virtual space, time length information 114 indicating the time length of the operation of the equipment 30, and the control program 12.
- the equipment library 111 is data written in advance in the memory unit 110
- the control program 12 is data provided by the user 40.
- FIG. 8 shows a schematic example of the equipment data 113.
- the equipment data 113 includes simulation data 1131 for executing a simulation on the equipment 30 selected by the user 40 from the equipment library 111, and an auxiliary program 1132 that represents causal relationships among multiple operations of the equipment 30 that are not expressed in the control program 12.
- the simulation data 1131 is data that associates the model number of the equipment 30, the arrangement of the equipment 30, parameters set for the equipment 30, and device values corresponding to the equipment 30, and is generated according to the settings of the user 40.
- the model number is information that specifies the size, shape, and details of the operation. By searching the equipment library 111 for a model number that is the same as the model number of the simulation data 1131, it is possible to refer to the specifications of the equipment 30 of that model number.
- the arrangement represents the position and posture.
- the parameters are information that specifies the operation of the equipment 30. For example, the parameter "A ⁇ B: sine wave" in FIG. 8 indicates that the transition of the machine position from point A to point B is sinusoidal as shown in FIG. 4.
- the device value represents the name of the device value shared with the equipment 30.
- the parameter "out” is associated with the device value "Y0", which indicates that when the device value Y0 is ON, the air cylinder performs the operation of pushing out the piston rod.
- the simulation data 1131 corresponds to an example of device information related to the controlled devices, and corresponds to an example of placement information indicating the placement of the controlled devices.
- the contents of the simulation data 1131 shown in FIG. 8 are merely an example, and the simulation data 1131 may include information different from that shown in FIG. 8.
- the stroke length of the air cylinder may be set as a parameter, and the simulation data 1131 may include so-called configuration data for the 3D simulator 13.
- the auxiliary program 1132 is information that indicates the relationships between the equipment 30 and the relationships between the operations of the equipment 30 in a format equivalent to that of the control program 12.
- the sensor equipment 311 detects that the piston rod of equipment 302 has reached its lowering end. This relationship between equipment 302 and equipment 311 is necessary to generate a time chart, but is not shown in the control program 12. This relationship is shown by the auxiliary program 1132.
- line 517 of the auxiliary program 1132 indicates that when the device value Y0 corresponding to equipment 302 becomes ON, the device value X0 corresponding to equipment 311 becomes ON.
- the auxiliary program 1132 corresponds to an example of trigger information.
- the detection by the equipment 311 that the equipment 302 has operated can be simulated by the 3D simulator 13.
- the information indicated by the auxiliary program 1132 can be included in the simulation data 1131.
- the auxiliary program 1132 may be omitted from the equipment data 113.
- the time length information 114 indicates the length of time required for each operation of each equipment 30.
- the time length information 114 may be directly input by the user 40 and acquired by the acquisition unit 120.
- the parameters of the equipment 30 set by the user 40 may substantially define the time length of the operation of the equipment 30.
- the acquisition unit 120 may acquire the parameters as time length information, and the time length corresponding to the parameters may be determined by a calculation using the parameters or by referring to a database that stores the parameters and the time length in correspondence with each other. For example, when the stroke length and speed of an air cylinder are specified as parameters by the user 40, the time length is calculated by dividing the stroke length by the speed. In such a case, since the simulation data 1131 substantially includes the time length information 114, the time length information 114 stored separately from the simulation data 1131 in the storage unit 110 may be omitted.
- the operation log when the equipment 30 is actually operated and the operation log when the operation of the equipment 30 is simulated can be said to be duration information indicating the duration of each operation of the equipment 30.
- the acquisition unit 120 may acquire and process such operation logs as duration information 114, thereby storing the duration information 114 indicating the duration of each operation in the storage unit 110 as shown in FIG. 9.
- a representative value of various operations of the equipment 30 repeatedly recorded together with time in the operation log is adopted as the duration.
- the representative value may be, for example, any one sample, or may be a value that is statistically determined such as the average or median.
- the acquisition unit 120 is mainly realized by the input unit 104 and the communication unit 106.
- the acquisition unit 120 acquires information from outside the assistance device 10 and stores the acquired information in the storage unit 110.
- the acquisition unit 120 acquires parameters set by the user 40, as well as the control program 12, the auxiliary program 1132, and the time length information 114 provided by the user 40.
- the acquisition unit 120 corresponds to an example of an acquisition means that acquires a control program to be executed by the programmable controller, as well as device information indicating the arrangement, size, and operating range in three-dimensional space of a controlled device controlled by the execution of the control program.
- the 3D simulator 13 is mainly realized by the processor 101.
- the 3D simulator 13 simulates the operation of the equipment 30 based on the simulation data 1131. If the simulation cannot continue due to a lack of data after starting the simulation of the operation, the 3D simulator 13 may supplement the data by prompting the user 40 to input, and simulate the operation of the equipment 30.
- the 3D simulator 13 corresponds to an example of a simulation means that simulates the control of a controlled device by a programmable controller based on a control program and device information.
- the generating unit 140 is mainly realized by the processor 101.
- the generating unit 140 generates the time chart data 112 based on the equipment data 113, the time length information 114, and the control program 12, and stores it in the storage unit 110.
- the causal relationship shown by the dashed arrow in FIG. 4 can be understood as described above. This allows the generating unit 140 to determine that, for example, the air cylinder in FIG. 4 reaches the "extended" state and at the same time the gripping operation of the air chuck starts.
- the auxiliary program 1132 of the equipment data 113 it can be understood that, for example, the air cylinder in FIG.
- the generating unit 140 starts the pushing operation of the piston rod, and the completion of the operation is detected by the sensor.
- This allows the generating unit 140 to connect the solid line indicating the pushing operation of the air cylinder, which connects "Y0" to "X0" in FIG. 4, to the arrow 502.
- the time length information 114 the length of time required for the pushing operation of the air cylinder can be understood.
- the generating unit 140 determines the slope of the solid line.
- the generating unit 140 generates a time chart showing the operation of each piece of equipment 30.
- the generating unit 140 corresponds to an example of a generating means.
- correction unit 150 and the analysis unit 160 are mainly realized by the processor 101. Details of the correction unit 150 and the analysis unit 160 will be described in other embodiments.
- the interface unit 170 is mainly realized by the processor 101, the input unit 104, and the communication unit 106.
- the interface unit 170 functions as a UI interface that accepts information input by the user 40, and provides the accepted information to the acquisition unit 120.
- the interface unit 170 also outputs display data indicating information to be displayed to the user to the display unit 180.
- the interface unit 170 corresponds to an example of an output means that outputs display data.
- the interface unit 170 functions as a communication interface that communicates with an external device.
- the display unit 180 is mainly realized by the output unit 105.
- the display unit 180 displays the time chart indicated by the time chart data 112 to the user in accordance with instructions from the user. Note that the display unit 180 may be omitted in the support device 10, and the support device 10 may exchange information with the user by communicating with an external UI device.
- FIG. 10 shows the procedure of the time chart generation process executed by the support device 10.
- This time chart generation process corresponds to an example of a time chart generation method, and is started by a specific operation of the user 40.
- the acquisition unit 120 acquires the control program 12, the equipment data 113, and the time length information 114 (step S1).
- the acquisition unit 120 may search and read information on the equipment 30 corresponding to the model number specified by the user 40 from the equipment library 111.
- the generation unit 140 generates a time chart based on the control program 12, the equipment data 113, and the time length information 114 (step S2).
- the interface unit 170 outputs display data for the time chart, and the time chart is displayed by the display unit 180 (step S3).
- FIG. 11 shows an example of a screen including a time chart displayed in step S3.
- the support device 10 may display the cycle time as a production index together with the time chart to support the review work by the user 40.
- the support device 10 generates a time chart using the control program 12.
- the control program 12 is essential data for causing the PLC 20 to execute control processing regardless of the presence or absence of a time chart, and the time chart is generated using the causal relationship information contained in this control program 12. This reduces the burden on the user 40 in generating the time chart.
- the acquisition unit 120 may also acquire parameters to be set in the equipment 30 as the duration information 114. This can reduce the burden on the user 40 of deciding the duration.
- the acquisition unit 120 may also acquire an operation log of the equipment 30 as the duration information 114. This can reduce the burden on the user 40 of preparing the duration information.
- the support device 10 may also be a GOT. Conventionally, it was necessary to operate an engineering tool on a PC to check the control program, and if the user 40 was not skilled in operating a PC and using engineering tools, it could be difficult to even grasp the current situation. In contrast, if a time chart is displayed on the support device 10 as a GOT, on-site workers can point out problems using the same indicator, i.e., the time chart.
- the machine positions of equipment 301 which is a servo motor
- the names "A", "B", and "C" These names may be specified not only as the stopping positions of the servo motor, but also when passing through. If the positions of the servo motors are shown numerically in a time chart, when the positions of the servo motors that are the starting points for commanding the operation of two different axes are close, a user 40 viewing the time chart may misinterpret which of the two points affects which axis. In contrast, if names can be given to the machine positions of the servo motors, misinterpretation of the time chart can be avoided.
- the generating unit 140 also generates a time chart from the simulation data 1131, which includes the configuration.
- a mechanical designer would create a 3D model to design equipment, build an operating procedure in the configuration, and then create a time chart after confirming it.
- a time chart is generated based on the configuration as described above, it is possible to reduce the number of design steps and avoid mistakes caused by overlooking one of them.
- the generation and display of the time chart is not limited to the above example, and may be changed as desired.
- regions 518-521 indicating the variation may be displayed on the time chart.
- regions 518-519 may be displayed without hatching
- regions 520-521 may be displayed with hatching to highlight the variation.
- coloring according to the magnitude of the variation may be used.
- the variation in region 520 occurs due to the variation in region 521. Two regions having such a causal relationship may be displayed in different ways, or only the region corresponding to the cause may be highlighted.
- the variation information indicating the variation may be acquired by the acquisition unit 120 from the user 40, or may be obtained by a statistical method from an operation log when the control process defined in the control program 12 is repeatedly executed.
- the variation may be, for example, a standard deviation, or a range defined by an upper limit value and a lower limit value.
- temporal causal relationships may be displayed as shown in FIG. 13.
- temporal causal relationships refer to the relationship between a cause that directly affected a result, among the causes that contribute to a result, and that result. In other words, it is the relationship between the last cause that occurred and the result that appeared at the same time as the occurrence of that cause.
- a dashed arrow is drawn only from device value X20, which was the last to contribute to device value M200, among device values X10 and X20 that correspond to causes, to device value M200, which corresponds to the result as described in the control program.
- FIG. 14 shows an example where a time chart displays a conditional causal relationship.
- a conditional causal relationship means the relationship between all causes that contribute to a result and that result. In other words, it is the relationship between all causes that occur, regardless of order or time, and that result.
- dashed arrows are drawn from both device values X10 and X20, which correspond to causes, to device value M200, which corresponds to the result. Note that the user may switch between the display of the temporal causal relationship as in FIG. 13 and the display of the conditional causal relationship as in FIG. 14 by operation.
- SW designers had to look at the control program, mechanical designers at 3D models or time charts they created, and on-site personnel at the actual equipment operation, all while adjusting the causal relationships of operation timing. Because each worker used different tools, there was a large discrepancy in information, and it took a long time from the occurrence of a problem to its resolution. In contrast, by displaying the temporal causal relationships and conditional causal relationships described above, it becomes possible to easily grasp areas for improvement in the control program and the cycle time. It is also expected that mechanical designers other than SW designers and on-site personnel will be able to easily grasp the processing flow defined in the control program.
- the lines representing the operation of each piece of equipment 30 in the time chart may be changed to blocks.
- a time chart such as a Gantt chart may be more suitable.
- the blocks may be colored to correspond to the type of operation.
- the generation unit 140 may include in the time chart a display component 522 that displays the power consumption or the amount of power consumption when the servo motor is operating.
- the amount of power consumption is calculated from the simulation data 1131 and the equipment library 111.
- Conventionally since it is complicated to grasp the power consumption at the design stage, it has often been the case that a breaker and power supply with a relatively large capacity are selected without calculating the accurate power consumption. In contrast, if the power consumption is displayed as in FIG. 15, it becomes possible to select an appropriate breaker and power supply.
- the generation unit 140 may include in the time chart a display component 523 that displays the air flow rate or amount of air consumed when the air cylinder is operating.
- the air flow rate and amount of air consumed are calculated from the simulation data 1131 and the equipment library 111. Conventionally, the air flow rate consumed was often over-designed. A shortage of air caused variations in the operation time of the equipment, leading to extended start-up times and operational problems. In contrast, if the air flow rate consumed is predicted and displayed along the time axis as shown in FIG. 15, the amount of air consumed at peak times can be understood, and this can support the design of stable equipment.
- the generating unit 140 may include a display component 524 in the time chart, which indicates that the peak value in the cycle time of the acceleration/deceleration of the servo motor exceeds a predetermined threshold value and is excessive.
- the peak value of the acceleration/deceleration is calculated from the simulation data 1131 and the equipment library 111.
- the servo motor suddenly accelerates or decelerates, the operator often presses the emergency stop button, and the servo motor may not be able to stop even if the button is pressed, and the mechanical position of the servo motor may reach outside the normal range. In other words, there are cases where the servo motor has to be stopped by a mechanical stopper rather than a limit switch.
- the user 40 can determine in advance that there is a risk that the servo motor will not be able to stop. This makes it possible to prevent equipment failure. Note that the user 40 may be notified of the sudden acceleration/deceleration of the servo motor by an alarm when compiling the control program 12, instead of or in addition to the display on the time chart.
- the generation unit 140 may include a display component 525 showing the torque value of the servo motor in the time chart.
- the torque value is calculated from the simulation data 1131 and the equipment library 111. Conventionally, designers have selected a servo motor by separately calculating acceleration/deceleration values for the timing when it is predicted in advance that the acceleration/deceleration of the servo motor will be the most intense. In contrast, if the torque value is displayed as in FIG. 15, it is expected that it will become easier to design a servo motor that averages out the acceleration/deceleration over the entire cycle time.
- the generation unit 140 may include a display component showing the average load or operating load of the servo motor in the time chart, similar to the display component 525 in FIG. 15.
- the average load is calculated from the simulation data 1131, which includes information about the workpiece, and the equipment library 111.
- the simulation data 1131 which includes information about the workpiece, and the equipment library 111.
- the average load is often overestimated without accurate calculation. This has resulted in the selection of large-sized parts, which in turn requires a larger motor, resulting in a tendency for the equipment to become larger overall.
- the average load is displayed on the time chart, appropriate parts can be selected, and the equipment can be expected to become more compact.
- the support device 10 may derive and propose control contents that achieve the target value of the cycle time while leveling out the acceleration and deceleration of the servo motor.
- the torque value of the servo motor has a margin up to the allowable value, and in section 542, the torque value exceeds the allowable value.
- the length of section 541 be shortened by increasing the torque value close to the allowable value, and that the torque value of section 542 be kept within the allowable range.
- the allowable range of torque may be provided as the equipment library 111 or the simulation data 1131, or may be input by the user 40 as the rated torque and allowable torque of the servo motor. According to such a proposal, the selection criteria for the servo motor are relaxed, and a further shortening of the cycle time can be expected.
- the generating unit 140 may generate time charts at multiple stages before the start-up of the facility and store them in the storage unit 110, or may generate time charts at multiple stages after the start-up or periodically and store them in the storage unit 110. That is, the storage unit 110 may store a log of the time chart as time chart data 112. For example, if the time chart at the time of the start-up of the facility is used as a reference, it is possible to observe the changes over time and predict the lifespan of actuators including servo motors and air cylinders, thereby contributing to predictive maintenance.
- the support device 10 may display both a time chart under normal circumstances and a time chart under abnormal circumstances, allowing the user 40 to compare these time charts.
- the user 40 would obtain a log of the operation of the equipment 30 and create a time chart himself, which would then be used to determine the cause of a malfunction and shorten the takt time.
- time charts created by the support device 10 for example, by comparing a time chart created at the design stage with a time chart created from the log, it becomes possible to identify bugs at an early stage, which can contribute to shortening the takt time.
- comparing a time chart created by a mechanical engineer with a time chart generated by the generation unit 140 can contribute to early start-up of a facility and shortening the takt time.
- Figure 17 shows another example of equipment to be placed in a facility.
- the order in which equipment 30 operates is shown by the numbers in parentheses attached to the dashed arrow indicating the direction of operation.
- operation 1 is an operation in which equipment 321, which is a servo motor, rotates a ball screw to move a support table on which workpiece 42 is placed from point D via points C and B in this order to point A, thereby transporting workpiece 42 to directly below equipment 322, 323.
- Operation 2 is an operation in which equipment 322, which is an air cylinder, pushes out a piston rod
- operation 3 is an operation in which equipment 323, which is an air chuck attached to the tip of the piston rod, grips workpiece 42.
- Operation 4 is an operation in which equipment 322 returns the piston rod, thereby raising the air chuck gripping the workpiece. And in the fifth operation, equipment 324, which is a servo motor, moves the support table to which equipment 322 is attached, thereby transporting workpiece 42 over wall 332 to directly above pallet 333.
- FIG. 18 shows a time chart corresponding to the operation of FIG. 17.
- the numbers along the vertical axis in FIG. 18 correspond to the reference numbers of the equipment 321 to 324 shown in FIG. 17.
- the numbers in parentheses along the horizontal axis in FIG. 18 correspond to the numbers on the dashed arrows shown in FIG. 17.
- the generation unit 140 may indicate on a time chart the timing at which the equipment 30 approaches the other equipment based on the simulation.
- the proximity of the equipment 30 to the other equipment means that the distance between the equipment 30 and the other equipment becomes shorter than a predetermined threshold value.
- the control program 12 usually includes an interlock description as shown in FIG. 19. Specifically, a b-contact of device value Y20 is inserted as a condition for device value Y10 to be ON, and a b-contact of device value Y10 is inserted as a condition for device value Y20 to be ON. This prevents both device values Y10 and Y20 from being ON at the same time.
- the generation unit 140 may include a block 531 indicating an interlock in a portion where the operation is restricted by the interlock, as shown in FIG. 18. Furthermore, the generating unit 140 may color the portion corresponding to the block 531 instead of the block 531. This allows the user 40 to easily determine from the time chart when an operation is restricted by an interlock.
- the acquisition unit 120 may provide, as a UI, a function for setting a block from input to completion of the operation of one actuator.
- FIG. 20 shows an example of setting such a block. Specifically, a description that spans multiple lines and is named "air chuck: work grip" is set as one block. The set block may be reused like a so-called routine or function without being separated. Conventionally, the configuration of a control program was dependent on the creator of the program, and there were many cases where the control program was not configured as a block from input to completion of the operation for each actuator.
- the generation unit 140 may use a pattern recognition technique to extract descriptions of sequential processes that appear repeatedly in the control program 12 as chunks.
- a time chart is generated based on the simulation data 1131 for executing a simulation by the 3D simulator 13.
- the time chart may be generated based on the constraint conditions of the 3D model indicated by the simulation data 1131. For example, in the case where two parts connected by a hinge operate in a correlated manner, the correlation between the operations may be detected by the 3D simulator 13, and the operations of these parts may be accurately synchronized on the time chart.
- the storage unit 110 stores the time chart indicated by the time chart data 112 in association with the control program 12.
- the storage unit 110 stores the lines indicated by the arrows 501 to 504 in the time chart of FIG. 4 in association with the description indicating the causal relationship appearing in the control program 12.
- FIG. 22 shows an example in which the control program 12 stored in the storage unit 110 is changed by an operation of the user 40.
- the device value Y0 included in the control program 12 is changed to device value Y2
- the device value X0 is changed to device value X2
- the device value Y2 is changed to device value Y0
- the device value X2 is changed to device value X0.
- the correction unit 150 of the support device 10 corrects the time chart indicated by the time chart data 112 stored in the memory unit 110 in accordance with the change in the control program 12, as shown in FIG. 23.
- the correction unit 150 corrects the time chart by generating chart components of the time chart for the changes in the control program 12 using a method similar to that used by the generation unit 140 according to the first embodiment.
- the correction unit 150 corrects the part of the other that corresponds to the change. This eliminates the need for the user 40 to correct the other when either the time chart or the control program is changed, reducing the burden on the user.
- the analysis unit 160 also analyzes the parameters to be set in the equipment 30 in order to realize the operation shown in the time chart.
- the acquisition unit 120 acquires data indicating the model number, stroke, payload, load rate, and shape of the cam curve of the motor as detailed information indicating the details of the operation shown in the time chart via an input screen exemplified in FIG. 24.
- the analysis unit 160 then derives the parameters to be set in the equipment 30 by a predetermined calculation for the operation shown in the time chart and the detailed information, or by referring to data stored in a storage device in association with the operation shown in the time chart and the detailed information.
- the interface unit 170 outputs the derived parameters to the display unit 180, and the display unit 180 displays an output screen as shown in FIG. 24.
- PG1 which represents a model control gain for adjusting the gain of the motor
- PG2 which represents a position control gain
- FIG. 25 shows a second example of parameters derived by the analysis unit 160.
- the pipe diameter is derived as a parameter from a time chart showing the operation of the air cylinder and the cylinder model number, stroke, work weight, throttle opening rate, and air pressure specified by the user 40.
- FIG. 26 shows another example of analysis by the analysis unit 160. In the example of FIG. 26, a recommended motor combination is shown from a time chart showing the operation of two servo motors and information specified by the user 40 on the input screen.
- the analysis unit 160 analyzes the parameters to be set in the equipment 30. Conventionally, when there were many parameters and an error occurred, it was difficult to determine whether the cause of the error was in the control program 12 itself or in the parameters, and debugging time tended to be long. In contrast, if the analysis unit 160 analyzes the parameters to be set in the equipment 30, the debugging time can be shortened.
- the analysis unit 160 corresponds to an example of an analysis means.
- the analysis unit 160 may also analyze loads such as average loads and operating loads or rated loads as shown in FIG. 15 based on the operations shown by the time charts and the simulation by the 3D simulator 13.
- the interface unit 170 outputs display data to the display unit 180, which highlights the element in the time chart that corresponds to the error. For example, as shown in FIG. 27, if an error occurs in timer T3, which counts time according to device values Y2 and X2, the line connecting device values Y2 and X2 is highlighted in the time chart.
- a timer like that shown in Figure 27 is introduced for the purpose of allowing a SW operator to output an error if device value X2 does not turn ON within a specific length of time because equipment 30 does not hold movement information for a certain axis (device value X2 turns ON after a specific length of time has elapsed since device value Y2 turned ON).
- the length of time for the movement information is calculated from the load and axis output specifications, just as when designing a time chart, and an allowable level of error is set for that length of time. If equipment 30 holds axis movement information, it is also possible to set it all at once to output an error when the equipment operates differently from expected, and program parts that cause unnecessary errors can also be excluded from the error output.
- a silent stop does not normally occur with a timer such as that shown in FIG. 27, but an error highlighted as shown in FIG. 27 may be a silent stop.
- an error highlighted as shown in FIG. 27 may be a silent stop.
- unresponsive sensor output values or device values may be displayed and a warning of the possibility of a silent stop may be issued. Then, when the user presses a button on the warning screen, the support device 10 may add error processing for the silent stop.
- the generating unit 140 generates a return-to-origin procedure for the multiple pieces of equipment 30. This procedure is generated, for example, by a brute force simulation or by a genetic algorithm.
- the correcting unit 150 then adds to the control program 12 program components that cause the multiple pieces of equipment 30 to execute the generated return-to-origin procedure. Furthermore, when a simulation using the simulation data 1131 indicates that interference will occur when the multiple pieces of equipment 30 operate simultaneously, the correcting unit 150 adds an interlock description to the program components, as exemplified in FIG. 28, thereby realizing a return-to-origin procedure that does not cause interference between the pieces of equipment 30.
- the return to origin procedure is generated by the generation unit 140 as described above and the interlock description is added by the correction unit 150, it can contribute to shortening the software production period, shortening the debugging time, and suppressing equipment interference problems caused by insufficient interlocks.
- the acquisition unit 120 also acquires detection results from sensors that detect the position of the motion axis when the equipment 30 is manually operated and the timing at which the motion axis operates. For example, a test run may be performed by manually performing a series of operations on a group of equipment using jog operation and single cylinder action.
- the support device 10 records point information and interlock information while an operator manually operates the equipment using a servo motor.
- the correction unit 150 then creates a program component that causes the equipment 30 to operate in the same way as the sensor detection result and adds it to the control program 12, or creates a chart component when the equipment 30 operates in the same way as the sensor detection result and adds it to the time chart.
- the equipment 311 to 313, which are sensors correspond to an example of a detection means.
- control program 12 for automatic operation may be created after considering appropriate operations while operating the actual machine with jog operation and biliary operation.
- the correction unit 150 creates program parts or chart parts that correspond to manual operations as described above, the number of steps can be reduced.
- the interface unit 170 also accepts intuitive operations by the user to modify the time chart.
- the thick solid line 621 in FIG. 29 may be drawn by tracing with a finger.
- a dashed line 624 connecting points 622 and 623 may be drawn by tapping on these points 622 and 623.
- an operation may be performed to associate a point on the time chart with a device value by selecting one of the sensors from a list of sensors.
- an operation to rearrange the axes aligned along the vertical axis of the time chart may be accepted.
- Embodiment 3 Next, the third embodiment will be described, focusing on the differences from the first embodiment. Note that the same reference numerals will be used for the same or equivalent configurations as the first embodiment. In this embodiment, the description will be focused on the function of the support device 10 that utilizes the 3D simulator 13.
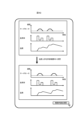
- the generating unit 140 in this embodiment generates and outputs display data for displaying an image including a first image showing the operation history of the equipment 30 from an operation log when the equipment 30 was actually controlled, and a second image showing the simulated operation history of the equipment 30 when the control of the equipment 30 was simulated by the 3D simulator 13.
- the generating unit 140 generates a first image showing a time chart of the planning stage based on a simulation, and a second image showing a time chart as an actual result based on an operation log.
- the different parts of these time charts are highlighted as shown by lines 701.
- the generating unit 140 also generates a first image showing the transition of the device values in the planning stage based on the simulation, and a second image showing a time chart as the actual results based on the operation log, as shown in FIG. 31.
- the generating unit 140 also generates a first image showing the operation of the 3D model in the planning stage based on the simulation, and a second image showing the 3D model as the actual results based on the operation log, as shown in FIG. 32.
- the display of the time charts, device value transitions, and 3D models shown in FIGS. 30 to 32 may be switched by the user 40.
- a pointer 704 indicating the current position on the seek bar 703 may move, and the first and second images may change over time. In other words, a video may be played.
- the seek bar 703 in FIG. 30 is divided into sections corresponding to a number of control sections.
- the control of the equipment 30 is realized by sequentially executing section control in a number of control sections.
- the control section may be highlighted as shown by the white line 705.
- the generation unit 140 may generate an image indicating that the events corresponding to the triggers are different when the events corresponding to the triggers of each operation are different.
- the generating unit 140 may also generate a time chart of the planning stage and a time chart of the actual results by superimposing them as shown in FIG. 33.
- the storage unit 110 corresponds to an example of a storage means that stores measures for reducing the error between the time required for the actual operation of the equipment 30 and the time required for the simulated operation, in association with the equipment 30.
- the generation unit 140 then reads out measures for reducing the error that has occurred in each of the multiple equipment 30 from the storage unit 110, and generates an image that displays a list of the measures in descending order of error, as shown in the upper part of FIG. 34.
- the storage unit 110 stores the equipment that is the cause of the error, the cause, the degree of difficulty of the measure for reducing the error, the effect of reducing the error when the measure is implemented, and the measure, in association with each other.
- the generation unit 140 When the user 40 selects the rank "3" in the image at the top of Figure 34, the generation unit 140 generates the image shown at the bottom of Figure 34. This image displays the check results for the measures and problems corresponding to the selected rank. Then, when the prototype operation button 707 is pressed, the display unit 180 displays the simulation results of the operation when the measures are implemented. In detail, the display unit 180 displays the time charts before and after the implementation of the measures in a format that allows comparison.
- an image is displayed that includes a first image showing the operation history of the equipment and a second image showing the simulated operation. This makes it easy to verify the differences between the simulation and the actual operation.
- Embodiment 4 Next, the fourth embodiment will be described, focusing on the differences from the first embodiment. Note that the same or equivalent configurations as those in the first embodiment will be denoted by the same reference numerals.
- the description will focus on the function of the support device 10 that outputs support information for improving the production index of a line based on a simulation.
- the analysis unit 160 corresponds to an example of an analysis means that analyzes changes in control of the controlled equipment based on the simulation results by the simulation means to improve the production index of a line including the controlled equipment
- the support device 10 corresponds to an example of an analysis device.
- the analysis unit 160 proposes improvements to the control program 12 from a time chart obtained by simulation.
- the analysis unit 160 changes the order of operations of the equipment 30 defined in the control program 12 and causes the 3D simulator 13 to simulate control of the equipment 30, if the cycle time is shortened while avoiding interference caused by the equipment 30 coming into contact with other devices, the analysis unit 160 outputs support information indicating the change in order as an improvement measure.
- the change in the order of operations may be selected randomly or may be made according to a predefined algorithm.
- the correction unit 150 changes the control program 12 to realize the improvement measure.
- a button for deciding to change the order of operations is shown to be pressed by the cursor.
- the support information may be displayed in the form of a time chart.
- the analysis unit 160 may search for avoidance actions that will prevent the components from interfering with each other, as shown in FIG. 36, and output a time chart showing the avoidance action as support information.
- a time chart showing an improvement measure is found, for example, by searching for changes in the operation in a brute-force manner.
- improvement measures are not limited to changes in operation, but may also include changes in the weight or material of the equipment 30 or the workpiece.
- the constraints for searching for these improvement measures are set by the user. The constraints are, for example, fixing the type of the current drive source to a servo motor or air cylinder, upper and lower stroke limits, and conditions for interference between operating axes.
- FIG. 37 shows an example in which the analysis unit 160 presents possible overlapping portions of events defined in the control program 12.
- the analysis unit 160 causes the 3D simulator 13 to simulate simultaneous execution of operations that are executed sequentially by multiple pieces of equipment 30 defined in the control program 12, if the cycle time can be reduced while avoiding interference caused by the multiple pieces of equipment 30 coming into contact with each other, the analysis unit 160 outputs support information indicating simultaneous execution of the operations that are executed sequentially as an improvement measure.
- a user 40 may select control content by operating a slider corresponding to the index value on a control content editing screen as shown in FIG. 38.
- the index value is, for example, a value corresponding to the closest distance between the pieces of equipment 30.
- the analysis unit 160 may also suggest reducing the speed of the servo motor as an improvement measure. Specifically, the analysis unit 160 may detect peak values of acceleration and deceleration of the servo motor in a simulation using a 3D simulator, and output support information indicating reducing the acceleration and deceleration of the servo motor at the timing when the peak value is detected as an improvement measure.
- the analysis unit 160 may also suggest excluding unused program parts from among the program parts constituting the control program 12.
- the analysis unit 160 may detect program parts that define the manual operation of the equipment 30 from the control program 12, and output support information indicating, as an improvement measure, excluding the detected program parts from the scanning targets during automatic operation of the equipment 30.
- an MC Master Control
- the analysis unit 160 may also propose improvements such as shifting the peak of power consumption and using regenerative power. Specifically, as shown in FIG. 40, the analysis unit 160 calculates the trend in power consumption based on the operation of the equipment 30 during the cycle time. Then, rather than using power from the main power source at the peak time, the analysis unit 160 may propose using regenerative power from the operating axis of other equipment at the same time, or releasing regenerative power that was generated and stored at a different time at that time. This is expected to level out power consumption over the cycle time, and the rated power required for the main power source can be reduced.
- the analysis unit 160 may calculate the maximum size that does not cause interference for a part specified by the user 40 using the cursor 708 as a change target from the time chart and the simulation result, and present the calculated size.
- the acquisition unit 120 corresponds to an example of a receiving means that receives a designation that the controlled device or a part of the controlled device is to be changed
- the analysis unit 160 corresponds to an example of an analysis means that calculates a size that avoids interference with other devices for a new device or part that is to be changed from the change target based on a simulation by a simulation means, and outputs the calculated size as an analysis result.
- the target of the change is not limited to a part of the controlled device, and may be the controlled device itself.
- the analysis unit 160 may also calculate the load factor of the servo motor and servo amplifier from the data in the memory unit 110 including the time chart, as shown in FIG. 42, and predict the temperature rise. If the temperature rise exceeds a threshold and is excessive, the analysis unit 160 may propose an operation pattern that brings the temperature rise within a predetermined allowable range as an improvement measure. Conventionally, the load factor was often calculated from the operating time within one cycle time, but the user had to separately calculate the heat balance that takes into account the temperature rise, i.e., the integral value of the load factor and the balance between heat dissipation. In contrast, if an improvement measure such as that in FIG. 42 is proposed, deterioration of the equipment 30 can be suppressed.
- the analysis unit 160 may also suggest parameters for the equipment 30 based on a target value specified as the operation time of the equipment 30. For example, as shown in FIG. 43, the analysis unit 160 may suggest recommended changes by a predetermined calculation or by referring to a database based on the operation selected by the user 40 and the specified target operation time. In detail, the analysis unit 160 predicts the machine position during operation of the equipment 30 and the vibration damping time after stopping from the physical model and the data stored in the storage unit 110, and suggests changes required to achieve operation within the target time. The changes include, for example, reducing the weight of the equipment 30, changing the motor output, and changing the air pressure. The prediction may be made using a prediction model obtained by machine learning from data of existing equipment.
- the mechanical design and cycle time estimation are first performed, followed by the creation of a time chart, and then the creation of a control program. Because the mechanical structure is finalized at the time the time chart and control program are created, the next opportunity to review or modify the mechanical structure is at the start of production or with the next machine, which results in an increase in drawing revisions and leads to structural differences between the first machine and the next machine onwards.
- a proposal such as that shown in Figure 43 is made, the points that should be changed in the mechanical design are presented after the time chart is created, making it possible to modify the mechanical design before start-up. This is expected to shorten the start-up period, reduce loss costs caused by purchasing unnecessary items, and eliminate machine differences between the first machine and the next machine onwards.
- the analysis unit 160 may also generate a control program according to the margin and risk level specified by the user, as shown in FIG. 44.
- the analysis unit 160 predicts the machine position during operation of the air cylinder and the vibration damping time after stopping from the data stored in the storage unit 110. This predicted value is calculated together with the prediction accuracy and precision.
- the prediction accuracy represents the range of temporal and spatial variation, and the precision represents the qualitative level of the prediction accuracy.
- the analysis unit 160 modifies and displays the prediction result according to the precision required by the user 40.
- the prediction may be performed by an external application or a model obtained by machine learning from big data.
- the user 40 specifies the margin, which is an index of the tolerance of deviations between the actual travel time and the elapsed position relative to the predicted time for each part, and the risk, which indicates the degree of impact of an accident that occurs when the machine position deviates significantly from the command value after the operation command is issued.
- the analysis unit 160 proposes overlapping the operation of this operation axis to shorten the cycle time.
- the position where a sensor that detects the operation axis should be added at a certain time may be presented. For example, as shown in FIG.
- the functions of the support device 10 in the above-described embodiment can be realized by dedicated hardware or by a normal computer system.
- program P1 can be stored and distributed on a computer-readable recording medium such as a flexible disk, a CD-ROM (Compact Disk Read-Only Memory), a DVD (Digital Versatile Disk), or an MO (Magneto-Optical disk), and by installing program P1 on a computer, a device that executes the above-mentioned processing can be configured.
- a computer-readable recording medium such as a flexible disk, a CD-ROM (Compact Disk Read-Only Memory), a DVD (Digital Versatile Disk), or an MO (Magneto-Optical disk).
- program P1 may be stored in a disk device of a server device on a communication network such as the Internet, and may be downloaded to a computer, for example, by superimposing it on a carrier wave.
- the above process can also be achieved by launching and executing program P1 while transferring it via a network such as the Internet.
- processing can also be achieved by executing all or part of program P1 on a server device, and executing program P1 while a computer transmits and receives information related to the processing via a communications network.
- the OS Operating System
- the OS working together with an application only the parts other than the OS may be stored on a medium and distributed, or may be downloaded to a computer.
- the means for realizing the functions of the support device 10 is not limited to software, and some or all of the functions may be realized by dedicated hardware or circuits.
- This disclosure is suitable for designing facilities in which equipment will be located at FA sites.
Landscapes
- Physics & Mathematics (AREA)
- General Physics & Mathematics (AREA)
- Engineering & Computer Science (AREA)
- Automation & Control Theory (AREA)
- Programmable Controllers (AREA)
Priority Applications (3)
| Application Number | Priority Date | Filing Date | Title |
|---|---|---|---|
| PCT/JP2023/032020 WO2025046894A1 (ja) | 2023-08-31 | 2023-08-31 | 分析プログラム、分析装置、支援システム及び分析方法 |
| JP2024514584A JP7483184B1 (ja) | 2023-08-31 | 2023-08-31 | 分析プログラム、分析装置、支援システム及び分析方法 |
| CN202380100084.3A CN121420256A (zh) | 2023-08-31 | 2023-08-31 | 分析程序、分析装置、辅助系统和分析方法 |
Applications Claiming Priority (1)
| Application Number | Priority Date | Filing Date | Title |
|---|---|---|---|
| PCT/JP2023/032020 WO2025046894A1 (ja) | 2023-08-31 | 2023-08-31 | 分析プログラム、分析装置、支援システム及び分析方法 |
Publications (1)
| Publication Number | Publication Date |
|---|---|
| WO2025046894A1 true WO2025046894A1 (ja) | 2025-03-06 |
Family
ID=91030972
Family Applications (1)
| Application Number | Title | Priority Date | Filing Date |
|---|---|---|---|
| PCT/JP2023/032020 Pending WO2025046894A1 (ja) | 2023-08-31 | 2023-08-31 | 分析プログラム、分析装置、支援システム及び分析方法 |
Country Status (3)
| Country | Link |
|---|---|
| JP (1) | JP7483184B1 (https=) |
| CN (1) | CN121420256A (https=) |
| WO (1) | WO2025046894A1 (https=) |
Families Citing this family (1)
| Publication number | Priority date | Publication date | Assignee | Title |
|---|---|---|---|---|
| WO2026003946A1 (ja) * | 2024-06-25 | 2026-01-02 | 三菱電機株式会社 | 表示制御プログラム、表示制御装置、表示制御システム及び表示制御方法 |
Citations (8)
| Publication number | Priority date | Publication date | Assignee | Title |
|---|---|---|---|---|
| JPH041806A (ja) * | 1990-04-19 | 1992-01-07 | Mitsubishi Electric Corp | プログラマブルコントローラ |
| JP2001067111A (ja) * | 1999-08-27 | 2001-03-16 | Honda Motor Co Ltd | 表示灯点灯装置 |
| JP2009080738A (ja) * | 2007-09-27 | 2009-04-16 | Koyo Electronics Ind Co Ltd | シーケンスプログラムのシミュレーション方法 |
| JP2012181574A (ja) * | 2011-02-28 | 2012-09-20 | Bridgestone Corp | 干渉チェック装置及びプログラム |
| JP2016025131A (ja) * | 2014-07-17 | 2016-02-08 | パナソニックIpマネジメント株式会社 | 部品実装方法および部品実装システム |
| JP2017207962A (ja) * | 2016-05-19 | 2017-11-24 | ファナック株式会社 | ラダープログラム解析装置 |
| JP2022547507A (ja) * | 2019-09-21 | 2022-11-14 | 株式会社アマダ | 加工プログラム作成装置及び加工プログラム作成方法 |
| JP2022179051A (ja) * | 2021-05-21 | 2022-12-02 | オムロン株式会社 | 開発支援装置、開発支援装置の制御方法、情報処理プログラム、および記録媒体 |
-
2023
- 2023-08-31 CN CN202380100084.3A patent/CN121420256A/zh active Pending
- 2023-08-31 WO PCT/JP2023/032020 patent/WO2025046894A1/ja active Pending
- 2023-08-31 JP JP2024514584A patent/JP7483184B1/ja active Active
Patent Citations (8)
| Publication number | Priority date | Publication date | Assignee | Title |
|---|---|---|---|---|
| JPH041806A (ja) * | 1990-04-19 | 1992-01-07 | Mitsubishi Electric Corp | プログラマブルコントローラ |
| JP2001067111A (ja) * | 1999-08-27 | 2001-03-16 | Honda Motor Co Ltd | 表示灯点灯装置 |
| JP2009080738A (ja) * | 2007-09-27 | 2009-04-16 | Koyo Electronics Ind Co Ltd | シーケンスプログラムのシミュレーション方法 |
| JP2012181574A (ja) * | 2011-02-28 | 2012-09-20 | Bridgestone Corp | 干渉チェック装置及びプログラム |
| JP2016025131A (ja) * | 2014-07-17 | 2016-02-08 | パナソニックIpマネジメント株式会社 | 部品実装方法および部品実装システム |
| JP2017207962A (ja) * | 2016-05-19 | 2017-11-24 | ファナック株式会社 | ラダープログラム解析装置 |
| JP2022547507A (ja) * | 2019-09-21 | 2022-11-14 | 株式会社アマダ | 加工プログラム作成装置及び加工プログラム作成方法 |
| JP2022179051A (ja) * | 2021-05-21 | 2022-12-02 | オムロン株式会社 | 開発支援装置、開発支援装置の制御方法、情報処理プログラム、および記録媒体 |
Also Published As
| Publication number | Publication date |
|---|---|
| JPWO2025046894A1 (https=) | 2025-03-06 |
| JP7483184B1 (ja) | 2024-05-14 |
| CN121420256A (zh) | 2026-01-27 |
Similar Documents
| Publication | Publication Date | Title |
|---|---|---|
| Rauch et al. | An advanced STEP-NC controller for intelligent machining processes | |
| EP1310844B1 (en) | Simulation device | |
| US7174225B2 (en) | Method and system for simulating processing of a workpiece with a machine tool | |
| TW201921203A (zh) | 用於機床之整合cad/cam/cnc軟體及具有該軟體之機床 | |
| CN103425842B (zh) | 一种并联机器人快速开发系统及方法 | |
| US10037019B2 (en) | System comprising development environments and machine controls | |
| Shen et al. | Digital twin based virtual commissioning for computerized numerical control machine tools | |
| JP7483184B1 (ja) | 分析プログラム、分析装置、支援システム及び分析方法 | |
| JP2010218036A (ja) | ロボットオフラインプログラミング装置 | |
| JP7599616B1 (ja) | タイムチャート生成プログラム、タイムチャート生成装置、支援システム及びタイムチャート生成方法 | |
| JP7504324B1 (ja) | 支援プログラム、支援装置、支援システム及び支援方法 | |
| JP7483183B1 (ja) | 画像生成プログラム、画像生成装置、支援システム及び画像生成方法 | |
| JP2013016021A (ja) | ラダープログラム作成装置およびラダープログラム作成方法 | |
| JPH10143221A (ja) | 機器制御プログラムの開発支援システムおよび開発支援方法 | |
| JPH0944219A (ja) | ロボットシミュレータ装置 | |
| De Aguiar et al. | Coloured Petri nets and graphical simulation for the validation of a robotic cell in aircraft industry | |
| JP4198374B2 (ja) | 設備のシミュレーション方法および設備のシミュレーションプログラム | |
| JPWO2019021938A1 (ja) | 設計情報生成装置及び設計支援システム | |
| Gallina et al. | Using safety contracts to guide the integration of reusable safety elements within ISO 26262 | |
| JP7753049B2 (ja) | ロボットデータ処理サーバ及び軌跡データ算出方法 | |
| JP7699729B1 (ja) | 情報処理システムおよび情報処理プログラム | |
| Nezzi et al. | Virtual commissioning of a mechatronic plant for insulating material processing: a company application towards Digital Twin | |
| CN1776553A (zh) | 机器上的探测系统和方法 | |
| JP2533372B2 (ja) | 制御プログラム作成方法 | |
| JP2533374B2 (ja) | 制御プログラム作成方法 |
Legal Events
| Date | Code | Title | Description |
|---|---|---|---|
| ENP | Entry into the national phase |
Ref document number: 2024514584 Country of ref document: JP Kind code of ref document: A |
|
| WWE | Wipo information: entry into national phase |
Ref document number: 2024514584 Country of ref document: JP |
|
| 121 | Ep: the epo has been informed by wipo that ep was designated in this application |
Ref document number: 23950835 Country of ref document: EP Kind code of ref document: A1 |