WO2024262152A1 - 自動分析装置 - Google Patents
自動分析装置 Download PDFInfo
- Publication number
- WO2024262152A1 WO2024262152A1 PCT/JP2024/015367 JP2024015367W WO2024262152A1 WO 2024262152 A1 WO2024262152 A1 WO 2024262152A1 JP 2024015367 W JP2024015367 W JP 2024015367W WO 2024262152 A1 WO2024262152 A1 WO 2024262152A1
- Authority
- WO
- WIPO (PCT)
- Prior art keywords
- liquid
- dispensing
- automatic analyzer
- amount
- unit
- Prior art date
- Legal status (The legal status is an assumption and is not a legal conclusion. Google has not performed a legal analysis and makes no representation as to the accuracy of the status listed.)
- Ceased
Links
Images



Classifications
-
- G—PHYSICS
- G01—MEASURING; TESTING
- G01N—INVESTIGATING OR ANALYSING MATERIALS BY DETERMINING THEIR CHEMICAL OR PHYSICAL PROPERTIES
- G01N35/00—Automatic analysis not limited to methods or materials provided for in any single one of groups G01N1/00 - G01N33/00; Handling materials therefor
- G01N35/10—Devices for transferring samples or any liquids to, in, or from, the analysis apparatus, e.g. suction devices, injection devices
Definitions
- the present invention relates to an automatic analyzer that performs qualitative and quantitative analysis of biological samples such as blood and urine contained in a sample container, and in particular to an automatic analyzer that can verify whether the analysis has been performed without any abnormalities.
- Biochemical automatic analyzers perform qualitative and quantitative analysis of biological samples (hereafter referred to as samples) such as serum and urine.
- samples biological samples
- a dispensing probe is generally used to dispense a predetermined amount of sample or reagent into a reaction vessel or the like, which is then reacted, and the analysis is performed by optically measuring the changes in color and turbidity that occur in the reaction solution using a photometric unit such as a spectrophotometer.
- Patent Document 1 discloses a dispensing device that "dispenses the liquid to be dispensed by inserting a dispensing probe into a vessel containing the liquid to be dispensed and aspirating the liquid, and then inserting the dispensing probe into a reaction vessel and discharging the liquid; an imaging device that images the position where the liquid is discharged from the tip of the dispensing probe into the reaction vessel; and a background portion that is arranged to face the imaging device across the reaction vessel and has a bright portion that is arranged to extend in the vertical direction at least in the center of the area imaged by the imaging device, and a dark portion that is arranged on at least one side of the bright portion and has a lower brightness than the bright portion.”
- Patent document 2 also discloses an automatic analyzer that "reacts a sample with a reagent and measures the optical properties of the reaction liquid to analyze the reaction liquid, and is equipped with a monitor container having a holding section made of a wall surface that has been treated to have a non-affinity for the liquid to be dispensed, and that holds the liquid in a substantially spherical shape by the holding section, and a liquid volume calculation means that images the shape of the liquid held in the holding section and calculates the volume of the liquid based on the imaged shape of the liquid.”
- the liquid in the holder also moves due to vibrations of the monitor container, making it difficult for the liquid to maintain its approximately spherical shape. If the liquid volume is calculated based only on the captured image of liquid that can no longer maintain its approximately spherical shape, the liquid volume may be misread.
- the object of the present invention is to provide an automatic analyzer that can verify the amount of liquid dispensed and improve the reliability of analysis.
- the present invention is configured as follows to achieve the above objectives:
- An automatic analyzer having a dispensing probe that dispenses a predetermined amount of liquid, a reaction vessel into which liquid is dispensed from the dispensing probe, and an analysis mechanism that analyzes the components of the liquid in the reaction vessel, the automatic analyzer having a dispensing detection unit that detects the contact state between the liquid dispensed from the dispensing probe into the reaction vessel and the reaction vessel, an imaging device that images the contact state, an image processing unit that selects an image from images captured by the imaging device based on information from the dispensing detection unit to determine the amount of liquid dispensed into the reaction vessel and extracts liquid features from the selected image, a memory unit that stores a database that associates the liquid features with information on the component amounts of the liquid analyzed by the analysis mechanism, and a liquid amount calculation unit that calculates the amount of liquid dispensed by the dispensing mechanism from the extracted features based on the database stored in the memory unit.
- the present invention provides an automatic analyzer that can verify the amount of liquid dispensed and improve the reliability of analysis.
- FIG. 1 is a schematic configuration diagram of an automatic analyzer according to an embodiment of the present invention.
- FIG. 2 is a diagram showing a configuration of a dispensing device in the automatic analyzer according to the first embodiment of the present invention.
- 1 is a diagram showing a configuration of a dispensing liquid volume measuring device in an automatic analyzer according to a first embodiment of the present invention;
- FIG. 2 is a diagram showing the configuration of a measurement unit in the automatic analyzer according to the first embodiment of the present invention.
- 5 is a flowchart showing a calibration process for liquid volume measurement according to the first embodiment of the present invention.
- FIG. 1 is a diagram showing an example of an image captured by the imaging device according to the first embodiment of the present invention
- 1A to 1C are explanatory diagrams relating to selection of an image from which liquid feature amount extraction is to be performed according to the first embodiment of the present invention.
- FIG. 4 is an explanatory diagram regarding the relationship between absorbance and liquid volume in the first embodiment of the present invention.
- FIG. 4 is a diagram showing an example of liquid amount reference data stored in a memory unit according to the first embodiment of the present invention.
- 4 is a flowchart showing a liquid volume measurement process according to the first embodiment of the present invention.
- 10 is a flowchart showing a process for selecting an image that is a target for liquid feature amount extraction according to a second embodiment of the present invention.
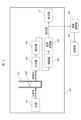
- FIG. 1 is a schematic diagram of an automatic analyzer according to this embodiment.
- the automatic analyzer 10 is a device for measuring a reaction liquid that is the result of a chemical reaction between a sample and a reagent in a reaction cell 104, and performing component analysis.
- the main components of this automatic analyzer 10 include a sample container 100, a sample rack 101, a reagent container 102, a reagent disk 103, a reaction cell 104, a reaction disk 105, a sample dispensing mechanism 106, a reagent dispensing mechanism 107, a stirring unit 108, a measurement unit 109, a cleaning unit 110, a control unit 111, and a display unit 112.
- Reaction cells 104 are arranged in a circular pattern on the reaction disk 105.
- the reaction cells 104 are containers for holding a mixture of a sample and a reagent, and multiple reaction cells 104 are arranged on the reaction disk 105.
- a sample rack 101 carrying multiple sample containers 100 containing samples is arranged near the reaction disk 105.
- a sample dispensing mechanism 106 that can rotate and move up and down is disposed between the reaction disk 105 and the sample container 100.
- the sample dispensing mechanism 106 moves horizontally while tracing an arc around the rotation axis, and moves up and down to dispense samples from the sample container 100 to the reaction cell 104.
- the reagent disk 103 is a storage unit in which multiple reagent containers 102 containing reagents can be placed on the circumference.
- the reagent disk 103 is kept cold.
- a reagent dispensing mechanism 107 capable of rotating and moving up and down is installed.
- the reagent dispensing mechanism 107 moves up and down and horizontally, and dispenses reagent, detergent, diluent, pretreatment reagent, etc., sucked from the reagent container 102, diluent bottle, pretreatment reagent container, etc., into the reaction cell 104.
- a cleaning unit 110 that cleans the inside of the reaction cell 104
- a measurement unit 109 that irradiates the reaction solution in the reaction cell 104 with light and measures the absorbance of the light that passes through
- a mixing unit 108 that mixes the sample and reagent dispensed into the reaction cell 104.
- Each mechanism is connected to the control unit 111, which controls its operation and performs analysis of the component amounts of the reaction liquid.
- the control unit 111 is connected to the memory unit 220, which stores the control parameters of each mechanism described above in the automatic analyzer, the position for each sequence, and absorbance data, which is the measurement result of the measurement unit 109.
- the analysis process of the test sample by the above-mentioned automatic analyzer 10 is performed in the following order: First, the sample in the sample container 100 placed on the sample rack 101 transported near the reaction disk 105 is dispensed by the sample dispensing mechanism 106 into the reaction cell 104 on the reaction disk 105. Next, the reagent to be used in the analysis is dispensed by the reagent dispensing mechanism 107 from the reagent container 102 on the reagent disk 103 into the reaction cell 104 into which the sample was previously dispensed. Next, the mixture of the sample and the reagent in the reaction cell 104 is stirred by the stirring unit 108 .
- the control unit 111 analyzes the amount of components based on the calibration curve data and Lambert-Beer's law. Note that while an automatic analyzer that uses the measurement unit 109 to determine the concentration of a specific component will be described as an example, the technology disclosed in the examples described below may also be used in automatic immunoanalyzers and automatic coagulation analyzers that measure samples using other optical means.
- FIG. 2 is a diagram showing the configuration of the dispensing device in this embodiment 1.
- This dispensing device can be applied to either the sample dispensing mechanism 106 or the reagent dispensing mechanism 107 in FIG. 1.
- An arm 114 that holds a probe 113 and can be driven to rotate is mounted on a shaft 115 that can be driven up and down.
- the probe 113, pressure sensor 116, and syringe pump 117 are connected via piping 118.
- the tip side of this dispensing flow path is opened by the probe 113, and the base side is configured so that it can be opened and closed by an electromagnetic valve 119.
- the liquid level sensor 120 is connected to the probe 113.
- the tip of the probe 113 is immersed in the sample or reagent based on the signal from the liquid level sensor 120, the solenoid valve 119 is closed, and the liquid (sample or reagent) is aspirated and dispensed by the syringe pump 117.
- the solenoid valve 119 is opened from the base side to supply cleaning water.
- the control unit 111 controls the reception of sensor signals and the transmission of motor drive signals.
- the liquid level detection sensor 120 generally determines whether the probe 113 has come into contact with the liquid in the container based on changes in capacitance.
- the probe 113 and the container form a pseudo-capacitor
- the capacitance is that of the air according to the distance, but when the probe 113 comes into contact with the liquid in the container, this changes to the capacitance of the liquid (the value of which is smaller than the capacitance of the air). Based on this change in capacitance, it is determined whether the probe 113 has come into contact with the liquid surface in the container.
- FIG. 3 is a configuration diagram of a dispensing liquid volume measurement device of the dispensing device in this embodiment 1.
- the dispensing liquid volume calculation unit 200 is a part that measures the volume of liquid 1000 discharged from the dispensing probe 113 into the reaction cell 104.
- the dispensing liquid volume calculation unit 200 has an imaging device 201 and an imaging control unit 210.
- the imaging device 201 is disposed at a location where the vicinity of the bottom surface of the reaction cell 104 can be observed.
- the bottom surface of the reaction cell 104 can be observed by disposing the imaging device 201 on the side, below, or above the reaction cell 104.
- processing of the reaction disk 105 is required.
- the imaging control unit 210 is a control means using an ECU or the like that controls the imaging of the liquid 1000 by the imaging device 201 and processes the image signal of the captured liquid.
- the image processing unit 211 processes the image signal captured by the imaging device 201 and outputs the characteristic amount of the liquid 1000.
- Feature amounts refer to information such as the shape and contour of the liquid.
- the calculation unit 212 calculates the volume of the liquid based on the shape of the liquid 1000 obtained by processing the image processing unit 211.
- the determination unit 213 determines whether the volume of the liquid 1000 calculated by the calculation unit 212 is an abnormal value relative to the dispensing volume set by the control unit 111.
- the feature amounts of the liquid obtained by the image processing unit 211, the volume of the liquid calculated by the calculation unit 212, and the results of the determination unit 213 are displayed on the display unit 112 via the control unit 111.
- FIG. 4 shows a configuration diagram of the measurement unit 109 of the automatic analyzer in this embodiment 1.
- the measurement unit 109 is composed of a light source 310, a spectrometer 320, a detection unit 330, an amplifier 340, and a signal processing unit 350.
- incident light 311 emitted from the light source lamp 310 passes through the liquid 1000 stored in the reaction cell 104, and transmitted light 312 is separated into various wavelengths by the spectroscope 320.
- the detection unit 330 converts the received light for each wavelength into a current corresponding to the intensity of the light.
- the amplifier 340 amplifies the weak current signal into an easy-to-handle voltage signal, and the signal processing unit 350 performs correction and other processing to output the final absorbance.
- the output absorbance result data is displayed on the display unit 112.
- the output absorbance is used by the liquid volume calculation unit 360 to calculate the amount of liquid dispensed by the dispensing device.
- the calculated liquid volume is then stored in the memory unit 220.
- FIG. 5 is a flow chart showing the calibration process for liquid volume measurement in this embodiment 1. This process is performed before the device is operated, and the data measured in this process is stored in the memory unit 220. When the device is operating, the liquid volume is measured based on the data stored in this process.
- the process begins when the control unit 111 commands the dispensing device to dispense the sample from the sample container 100 to the reaction cell 104.
- step S101 the system transitions to liquid volume measurement calibration mode.
- step S102 the control unit 111 operates the sample dispensing mechanism 106, moves it to the sample container 100, and instructs the probe 113 to aspirate (inject) the liquid stored in the sample container 100.
- step S103 the control unit 111 instructs the imaging device 201 to capture an image of the reaction cell 104. This is an image for checking the reaction cell 104 before the sample dispensing mechanism 106 dispenses the liquid 1000 into the reaction cell 104, and for checking whether there is any adhesion such as contamination inside the reaction cell 104.
- step S104 the control unit 111 operates the sample dispensing mechanism 106 to move the sample from the sample container 100 to the reaction cell 104. Then, it instructs the probe 113 to eject liquid into the reaction cell 104.
- the amount of liquid ejected from the sample container 100 to the reaction cell 104 is very small, on the order of a few ⁇ L.
- step S106 the control unit 111 receives notification that the ejection operation of the liquid 1000 has been completed and instructs the imaging device 201 to stop imaging.
- step S107 the image captured by the imaging device 201 is sent to the image processing unit.
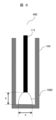
- FIG. 6 shows an example of an image acquired by the imaging device 201.
- an image 400 in which only the side surface of the reaction cell 104 is captured by the imaging device 201 will be described.
- the main information that can be obtained as a feature of the liquid is information about where in the reaction cell 104 the liquid 1000 is being ejected and information about the height of the liquid 1000 from the bottom surface of the reaction cell 104.
- image 400 can obtain information that liquid 1000 is in contact only with the bottom surface of reaction cell 104 and not with the sides, as well as information on the length a of the liquid adhering to the bottom surface of reaction cell 104 and the height b of liquid 1000 from the bottom surface of reaction cell 104.
- the dispensing image used to obtain the characteristics of the liquid is the image taken just before the probe 113 leaves the liquid 1000, so that the characteristics of the liquid can be obtained stably.
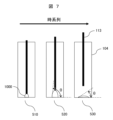
- FIG. 7 is an example of images captured by the imaging device 201 in chronological order.
- an example is described in which the side of the reaction cell 104 is imaged by the imaging device 201.
- image 510 which is taken while liquid 1000 is being ejected into the reaction cell 104, liquid 1000 still remains in the probe 113, so it is impossible to measure the final amount of liquid 1000 in the reaction cell 104.
- Image 520 in which the ejection of liquid 1000 into reaction cell 104 is complete but probe 113 has not yet separated from liquid 1000, can be obtained by determining that ejection of liquid 1000 into reaction cell 104 is complete from the value of pressure sensor 116 in sample dispensing mechanism 106, and then using the first image in which probe 113 and liquid 1000 are separated as a trigger and adopting the previous image as an image for acquiring the characteristics of the liquid from among the images acquired by imaging device 201 in control unit 111.
- step S109 the liquid characteristics acquired by the image processing unit 211 are stored in the memory unit 220.
- step S110 the control unit 111 operates the reagent dispensing mechanism 107 to dispense the liquid stored in the reagent container 102 on the reagent disk 103 into the reaction cell 104.
- step S111 the control unit 111 operates the measurement unit 109 to irradiate the light source onto the reaction cell 104 into which the liquid from the sample container 100 and the liquid from the reagent container 102 have been dispensed.
- step S112 the control unit 111 operates the measurement unit 109 and transmits the absorbance data output from the signal processing unit 350 to the calculation unit.
- step S113 the liquid volume calculation unit 360 calculates the volume of liquid in the sample container 100 dispensed into the reaction cell 104 based on the absorbance data obtained from the measurement unit 109.
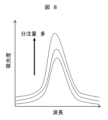
- Figure 8 shows an example of absorbance data output from the signal processing unit 350. If the contents in the reaction cell 104 are the same, the wavelength at which the absorbance peak occurs will also be the same.
- absorbance indicates the concentration of a specific component
- absorbance indicates the concentration of a specific component
- the concentration of the component to be measured contained in the liquid will increase depending on the amount of liquid in the sample container 100. Therefore, if the amount of liquid in the reagent container 102 in the reaction cell 104 is constant, the amount of liquid in the sample container 100 in the reaction cell 104 can be calculated based on the magnitude of the absorbance peak.
- step S114 the memory unit 220 stores information about the liquid volume of the sample container 100 in the reaction cell 104, calculated from the absorbance data by the calculation unit.
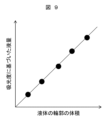
- step S115 the liquid characteristic quantities stored in the memory unit 220 are linked to the liquid volume information, and are stored again in the memory unit as liquid volume reference data.
- Figure 9 shows an example of liquid volume reference data stored in the memory unit.
- the side of the reaction cell 104 is imaged by the imaging device 201, and the liquid feature quantities are the position of attachment of the liquid 1000, the shape, and the area of the outline.
- the relationship between the derived contour area S and the liquid volume information is saved. By repeating this process, it is possible to statistically derive the relative relationship between the contour area S and the liquid volume. The more samples of liquid volume reference data there are, the greater the measurement accuracy.
- the liquid volume calculated by the calculation unit 212 based on the liquid characteristics acquired by the image processing unit 211 and the absorbance data is output to the display unit 112, and the process ends.
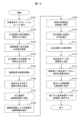
- FIG. 10 is a flowchart showing a method for measuring the amount of dispensed liquid using an imaging device in this embodiment 1.
- the process begins when the control unit 111 commands the dispensing device to dispense the sample from the sample container 100 into the reaction cell 104.
- step S201 the control unit 111 operates the sample dispensing mechanism 106, moves it to the sample container 100, and instructs it to inject the liquid stored in the sample container 100 from the probe 113.
- step S202 the control unit 111 instructs the imaging device 201 to capture an image of the reaction cell 104. This is an image for checking the reaction cell 104 before the sample dispensing mechanism 106 dispenses the liquid 1000 into the reaction cell 104, and for checking whether there is any adhesion such as contamination inside the reaction cell 104.
- step S203 the control unit 111 operates the sample dispensing mechanism 106 to move the sample from the sample container 100 to the reaction cell 104. Then, it instructs the probe 113 to eject liquid into the reaction cell 104.
- step S204 the control unit 111 instructs the imaging device 201 to capture an image of the probe 113 discharging the liquid 1000 into the reaction cell 104.
- the timing at which the imaging device 201 starts capturing images is determined based on the state of the sample dispensing mechanism 106.
- imaging is started using the value of the pressure sensor 116 as a trigger. Then, the imaging device 201 continues imaging until the sample dispensing mechanism 106 completes the operation of dispensing liquid into the reaction cell 104.
- step S205 the control unit 111 receives notification that the ejection operation of the liquid 1000 has been completed and instructs the imaging device 201 to stop imaging.
- step S206 the image captured by the imaging device 201 is sent to the image processing unit.
- step S207 the image processing unit 211 acquires the characteristics of the liquid based on the captured image.
- the characteristics refer to information such as the shape and contour of the liquid.
- the shape of the liquid indicates, for example, the shape of the liquid as well as information about where in the reaction cell 104 the liquid is dispensed.
- the contour information indicates, for example, when the shape of the dispensed liquid is half of an ellipsoid, the major and minor axes of the liquid attached to the bottom surface of the reaction cell 104, and the height of the liquid from the bottom surface of the reaction cell 104.
- step S208 the calculation unit 212 compares the liquid feature amount acquired by the image processing unit 211 with the liquid amount reference data stored in the memory unit 220, and derives the amount of liquid dispensed from the sample container 100 in the reaction cell 104.
- step S209 the determination unit 213 determines whether the amount of liquid dispensed from the sample container 100 calculated in step S208 is an abnormal value relative to the dispensing amount instructed by the control unit 111 to the sample dispensing mechanism 106.
- the liquid feature amount acquired by the image processing unit 211, the liquid volume derived by the calculation unit 212, and the result of the determination unit 213 are output to the display unit 112, and the process ends.
- step S210 If the value is abnormal, proceed to step S210.
- Step S210 is performed when the determination unit 213 determines in step S209 that the amount of liquid dispensed from the sample container 100 calculated in step S208 is an abnormal value relative to the dispensing amount instructed by the control unit 111 to the sample dispensing mechanism 106.
- the display unit 112 notifies the user that a dispensing abnormality has occurred in the sample dispensing mechanism 106.
- the liquid feature amount acquired by the image processing unit 211 and the liquid volume derived by the calculation unit 212 are output to the display unit 112, and the process ends.
- an image 510 of the liquid 1000 being dispensed into the reaction cell 104 is acquired using the imaging device 201 just before the probe 113 and the liquid 1000 separate, and the acquired image is used to extract features such as the shape and contour information of the liquid.
- the amount of dispensed liquid is calculated based on these features and liquid volume reference data that links the liquid features stored in advance in the memory unit 220 with liquid volume information calculated from absorbance data, making it possible to stably and accurately monitor the amount of dispensed liquid in the reaction cell 104, which is a very small amount on the order of a few ⁇ L.
- the image was acquired by using the first image of the probe 113 leaving the liquid 1000 as a trigger in the imaging device 201, but it is also possible to obtain an image using the liquid level detection sensor 120.
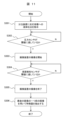
- FIG. 11 is a flowchart showing the process of acquiring a dispensing image using the liquid level detection sensor 120.
- step S301 the control unit 111 operates the sample dispensing mechanism 106 to move the sample from the sample container 100 to the reaction cell 104. Then, it instructs the probe 113 to eject liquid into the reaction cell 104.
- step S302 it is determined whether the value of the pressure sensor 116 reaches a threshold value. Details of the threshold value will be described later. If the value of the pressure sensor 116 reaches the threshold value, the process proceeds to step S303, and if the value has not reached the threshold value, the process repeats the determination.
- step S303 the control unit 111 instructs the imaging device 201 to start imaging.
- step S304 it is determined whether the value of the liquid level detection sensor 120 reaches the threshold value.
- the value of the liquid level detection sensor 120 changes when the probe 113 is removed from the liquid 1000. Therefore, by monitoring the value of the liquid level detection sensor 120, it is possible to determine whether the probe 113 has been removed from the liquid 1000. If the value of the liquid level detection sensor 120 reaches the threshold value, the process proceeds to step S305, and if the value has not reached the threshold value, the determination is made again.
- step 305 the control unit 111 instructs the imaging device 201 to stop imaging.
- step 306 the image processing unit 211 acquires the characteristics of the liquid based on the image immediately before the last image captured by the imaging device 201.
- the liquid level detection sensor 120 already provided in the dispensing mechanism can determine when the probe 113 is separated from the liquid 1000, reducing the load on the image processing unit 211 and improving the calculation speed.
- 10 automated analyzer, 100...sample container, 101...sample rack, 102...reagent container, 103...reagent disk, 104...reaction cell, 105...reaction disk, 106...sample dispensing mechanism, 107...reagent dispensing mechanism, 108...mixing unit, 109...measurement unit, 110...cleaning unit, 111...control unit, 112...display unit, 113...probe, 114...arm, 115...shaft, 116...pressure sensor, 117...syringe pump, 118...piping , 119... solenoid valve, 120... liquid level sensor, 121... reagent syringe, 201... imaging device, 210... imaging control section, 211... image processing section, 212...
- calculation section 220... storage section, 310... light source, 320... spectroscope, 330... detection section, 340... amplifier, 350... signal processing section, 360... liquid volume calculation section, 400... captured image, 510... captured image (during discharge), 520... captured image (before probe is removed), 530... captured image (after probe is removed), ⁇ ... contact angle
Landscapes
- Physics & Mathematics (AREA)
- Health & Medical Sciences (AREA)
- Life Sciences & Earth Sciences (AREA)
- Chemical & Material Sciences (AREA)
- Analytical Chemistry (AREA)
- Biochemistry (AREA)
- General Health & Medical Sciences (AREA)
- General Physics & Mathematics (AREA)
- Immunology (AREA)
- Pathology (AREA)
- Automatic Analysis And Handling Materials Therefor (AREA)
Abstract
Description
続いて、攪拌ユニット108で反応セル104内の試料と試薬との混合液の攪拌を行う。
Claims (7)
- 所定量の液体を分注する分注プローブと、
前記分注プローブから液体を分注する反応容器と、
前記反応容器中の液体の成分を分析する分析機構と、
を備えた自動分析装置において、
前記分注プローブから前記反応容器中に分注される液体の該反応容器との接触状態を検出する分注検出部と、
前記接触状態を撮像する撮像装置と、
前記分注検出部からの情報に基づき、前記撮像装置が撮像した画像の中から前記反応容器に分注された液体の量を判定するための画像を選択し、選択された画像から液体の特徴量を抽出する画像処理部と、
前記液体の特徴量と前記分析機構で分析された液体の成分量の情報とを関連付けたデータベースを記憶する記憶部と、
前記記憶部に記憶されたデータベースに基づき、抽出された前記特徴量から前記分注機構で分注された液体の量を演算する液体量演算部と、
を備えたことを特徴とする自動分析装置。 - 請求項1記載の自動分析装置において、
前記特徴量は少なくとも液体の形状、または輪郭の情報を含むことを特徴とする自動分析装置。 - 請求項1記載の自動分析装置において、
前記分注検出部は前記分注プローブ内の圧力を検出する圧力センサ、または前記分注プローブが前記反応容器中の液体に接触したことを検出する液面センサのいずれかであることを特徴とする自動分析装置。 - 請求項1記載の自動分析装置において、
前記分析機構は、前記反応容器中の液体の吸光度を測定する光度計であることを特徴とする自動分析装置。 - 請求項1記載の自動分析装置において、
前記画像処理部が選択する画像は、前記分注プローブが前記反応容器中の液体から離脱したことを前記分注検出部が検出した時点の直前の時点での画像であることを特徴とする自動分析装置。 - 請求項1~5のいずれかに記載の自動分析装置において、
前記液体量演算部が演算した液体の量が、前記制御部が設定した分注量と異なる場合に、前記自動分析装置の異常を報知する報知手段を備える判定部を有していることを特徴とする自動分析装置。 - 請求項1~5のいずれかに記載の自動分析装置において、
前記記憶部に記憶されている関連付けたデータベースは、分注する液体の物性毎に異なる関連付けとなっていることを特徴とする自動分析装置。
Priority Applications (2)
| Application Number | Priority Date | Filing Date | Title |
|---|---|---|---|
| EP24825562.2A EP4733769A1 (en) | 2023-06-22 | 2024-04-18 | Automatic analysis device |
| CN202480012647.8A CN120712480A (zh) | 2023-06-22 | 2024-04-18 | 自动分析装置 |
Applications Claiming Priority (2)
| Application Number | Priority Date | Filing Date | Title |
|---|---|---|---|
| JP2023102511A JP2025002374A (ja) | 2023-06-22 | 2023-06-22 | 自動分析装置 |
| JP2023-102511 | 2023-06-22 |
Publications (1)
| Publication Number | Publication Date |
|---|---|
| WO2024262152A1 true WO2024262152A1 (ja) | 2024-12-26 |
Family
ID=93935605
Family Applications (1)
| Application Number | Title | Priority Date | Filing Date |
|---|---|---|---|
| PCT/JP2024/015367 Ceased WO2024262152A1 (ja) | 2023-06-22 | 2024-04-18 | 自動分析装置 |
Country Status (4)
| Country | Link |
|---|---|
| EP (1) | EP4733769A1 (ja) |
| JP (1) | JP2025002374A (ja) |
| CN (1) | CN120712480A (ja) |
| WO (1) | WO2024262152A1 (ja) |
Citations (7)
| Publication number | Priority date | Publication date | Assignee | Title |
|---|---|---|---|---|
| JP2004239697A (ja) * | 2003-02-05 | 2004-08-26 | Hitachi High-Technologies Corp | 化学分析装置 |
| JP2005049267A (ja) * | 2003-07-30 | 2005-02-24 | Shimadzu Corp | 分注ユニットによる定量分注方法及び分注装置 |
| JP2005345345A (ja) * | 2004-06-04 | 2005-12-15 | Ckd Corp | 分注装置 |
| JP2010175417A (ja) * | 2009-01-30 | 2010-08-12 | Hitachi High-Technologies Corp | 自動分析装置 |
| JP2011149853A (ja) * | 2010-01-22 | 2011-08-04 | Toppan Printing Co Ltd | 分注方法及び分注装置 |
| US20160236190A1 (en) * | 2015-02-16 | 2016-08-18 | Marcel Kanter | Introducing a liquid into a depression of a sample holding plate |
| JP2018146479A (ja) * | 2017-03-08 | 2018-09-20 | 有限会社イグノス | 点着量測定システム、点着量測定方法及びプログラム |
Family Cites Families (2)
| Publication number | Priority date | Publication date | Assignee | Title |
|---|---|---|---|---|
| JP2009156793A (ja) | 2007-12-27 | 2009-07-16 | Olympus Corp | 自動分析装置 |
| JP6444817B2 (ja) | 2015-06-25 | 2018-12-26 | 株式会社日立ハイテクノロジーズ | 自動分析装置および撮像方法 |
-
2023
- 2023-06-22 JP JP2023102511A patent/JP2025002374A/ja active Pending
-
2024
- 2024-04-18 WO PCT/JP2024/015367 patent/WO2024262152A1/ja not_active Ceased
- 2024-04-18 CN CN202480012647.8A patent/CN120712480A/zh active Pending
- 2024-04-18 EP EP24825562.2A patent/EP4733769A1/en active Pending
Patent Citations (7)
| Publication number | Priority date | Publication date | Assignee | Title |
|---|---|---|---|---|
| JP2004239697A (ja) * | 2003-02-05 | 2004-08-26 | Hitachi High-Technologies Corp | 化学分析装置 |
| JP2005049267A (ja) * | 2003-07-30 | 2005-02-24 | Shimadzu Corp | 分注ユニットによる定量分注方法及び分注装置 |
| JP2005345345A (ja) * | 2004-06-04 | 2005-12-15 | Ckd Corp | 分注装置 |
| JP2010175417A (ja) * | 2009-01-30 | 2010-08-12 | Hitachi High-Technologies Corp | 自動分析装置 |
| JP2011149853A (ja) * | 2010-01-22 | 2011-08-04 | Toppan Printing Co Ltd | 分注方法及び分注装置 |
| US20160236190A1 (en) * | 2015-02-16 | 2016-08-18 | Marcel Kanter | Introducing a liquid into a depression of a sample holding plate |
| JP2018146479A (ja) * | 2017-03-08 | 2018-09-20 | 有限会社イグノス | 点着量測定システム、点着量測定方法及びプログラム |
Non-Patent Citations (1)
| Title |
|---|
| See also references of EP4733769A1 * |
Also Published As
| Publication number | Publication date |
|---|---|
| JP2025002374A (ja) | 2025-01-09 |
| CN120712480A (zh) | 2025-09-26 |
| EP4733769A1 (en) | 2026-04-29 |
Similar Documents
| Publication | Publication Date | Title |
|---|---|---|
| CN104011547B (zh) | 自动分析装置及测定值异常检测方法 | |
| EP2587250B1 (en) | Automatic analysis device | |
| US20120282137A1 (en) | Automatic analyzer | |
| CN110869769B (zh) | 试验套件、试验方法、分注装置 | |
| US20090114538A1 (en) | Automated biochemical analyzer | |
| JP2012026728A (ja) | 分析装置 | |
| US11567097B2 (en) | Apparatus for optically monitoring a dosing of a liquid to be pipetted | |
| CN114174800B (zh) | 自动分析装置 | |
| US7961324B2 (en) | Wavelength identification method and analyzer | |
| WO2024262152A1 (ja) | 自動分析装置 | |
| JP2604043B2 (ja) | 自動分析装置 | |
| US12504366B2 (en) | Diagnostic instruments having multiple illumination sources and methods thereof | |
| JP2000180368A (ja) | 化学分析装置 | |
| EP4685491A1 (en) | Automated analysis device and sample analysis method | |
| JP7719956B2 (ja) | 自動分析装置のデータ処理システム及び方法 | |
| JP7539547B2 (ja) | 自動分析装置、および検体の分注方法 | |
| JPH03181861A (ja) | 自動分析装置 | |
| JP5192316B2 (ja) | 自動分析装置 | |
| JP7309467B2 (ja) | 自動分析装置 | |
| WO2026072521A1 (en) | Ion selective electrode module and optical module startup | |
| JP2011038866A (ja) | 自動分析装置 |
Legal Events
| Date | Code | Title | Description |
|---|---|---|---|
| 121 | Ep: the epo has been informed by wipo that ep was designated in this application |
Ref document number: 24825562 Country of ref document: EP Kind code of ref document: A1 |
|
| WWE | Wipo information: entry into national phase |
Ref document number: 2024825562 Country of ref document: EP |
|
| NENP | Non-entry into the national phase |
Ref country code: DE |
|
| ENP | Entry into the national phase |
Ref document number: 2024825562 Country of ref document: EP Effective date: 20260122 |
|
| ENP | Entry into the national phase |
Ref document number: 2024825562 Country of ref document: EP Effective date: 20260122 |
|
| ENP | Entry into the national phase |
Ref document number: 2024825562 Country of ref document: EP Effective date: 20260122 |