WO2024214217A1 - 遺伝子解析装置及び遺伝子解析方法 - Google Patents
遺伝子解析装置及び遺伝子解析方法 Download PDFInfo
- Publication number
- WO2024214217A1 WO2024214217A1 PCT/JP2023/014893 JP2023014893W WO2024214217A1 WO 2024214217 A1 WO2024214217 A1 WO 2024214217A1 JP 2023014893 W JP2023014893 W JP 2023014893W WO 2024214217 A1 WO2024214217 A1 WO 2024214217A1
- Authority
- WO
- WIPO (PCT)
- Prior art keywords
- fluorescence intensity
- signal
- section
- intensity data
- feature
- Prior art date
- Legal status (The legal status is an assumption and is not a legal conclusion. Google has not performed a legal analysis and makes no representation as to the accuracy of the status listed.)
- Ceased
Links
Images


Classifications
-
- G—PHYSICS
- G01—MEASURING; TESTING
- G01N—INVESTIGATING OR ANALYSING MATERIALS BY DETERMINING THEIR CHEMICAL OR PHYSICAL PROPERTIES
- G01N27/00—Investigating or analysing materials by the use of electric, electrochemical, or magnetic means
- G01N27/26—Investigating or analysing materials by the use of electric, electrochemical, or magnetic means by investigating electrochemical variables; by using electrolysis or electrophoresis
- G01N27/416—Systems
- G01N27/447—Systems using electrophoresis
- G01N27/44756—Apparatus specially adapted therefor
-
- G—PHYSICS
- G01—MEASURING; TESTING
- G01N—INVESTIGATING OR ANALYSING MATERIALS BY DETERMINING THEIR CHEMICAL OR PHYSICAL PROPERTIES
- G01N27/00—Investigating or analysing materials by the use of electric, electrochemical, or magnetic means
- G01N27/26—Investigating or analysing materials by the use of electric, electrochemical, or magnetic means by investigating electrochemical variables; by using electrolysis or electrophoresis
- G01N27/416—Systems
- G01N27/447—Systems using electrophoresis
- G01N27/44704—Details; Accessories
- G01N27/44717—Arrangements for investigating the separated zones, e.g. localising zones
- G01N27/44721—Arrangements for investigating the separated zones, e.g. localising zones by optical means
Definitions
- the present invention relates to a genetic analysis device and a genetic analysis method.
- the base sequence of a nucleic acid is determined by including the following steps (A) to (C) in that order: (A) a base peak extraction step of extracting base peaks from electrophoretic data including peaks of four types of base types obtained by electrophoretic separation of a sample nucleic acid; (B) a condition setting step of setting a search start base peak and a peak interval reference value for starting a search in time series data composed of the extracted base peaks; (C) starting from the search start base peak in the time series data, sequentially scanning between adjacent base peaks in the forward and backward directions of the time series, comparing the interval between base peaks with the peak interval reference value and adding an interpolated peak to a peak missing section, thereby determining the base sequence.”
- the present invention aims to detect signal sections (signal regions) with high accuracy from time-series data showing the results of electrophoresis.
- a representative genetic analysis device of the present invention comprises an acquisition unit that acquires time series data indicating the results of electrophoresis of a sample, and an analysis unit that analyzes the base sequence of the sample from the time series data, wherein the time series data includes a plurality of fluorescence intensity data corresponding to a plurality of bases, and the analysis unit divides the time series data into a plurality of intervals, generates for each of the plurality of fluorescence intensity data a feature amount indicating the frequency of occurrence of at least one of a maximum portion, a minimum portion, and a flat portion of the fluorescence intensity data in each interval, determines an interval feature amount from the plurality of feature amounts generated for the plurality of fluorescence intensity data based on a magnitude relationship between the feature amounts, and uses the interval feature amount to detect a signal region in the time series data that is a region to be analyzed for the base sequence.
- one representative genetic analysis method of the present invention is characterized by comprising the steps of: acquiring time series data indicating the result of electrophoresis of the sample, the time series data including a plurality of fluorescence intensity data corresponding to a plurality of bases; dividing the time series data into a plurality of intervals; generating non-signal features of the fluorescence intensity data in each interval for each of the plurality of fluorescence intensity data based on the frequency of appearance of at least one of a maximum portion, a minimum portion, and a flat portion of the fluorescence intensity data in each interval; determining an interval feature from the plurality of feature features generated for the plurality of fluorescence intensity data based on a magnitude relationship between the feature features; and detecting a signal region, which is a region to be analyzed of the base sequence in the time series data, using the interval feature.
- Example of the configuration of the gene analysis device according to the first embodiment Configuration example of electrophoresis apparatus according to the first embodiment 1 is a flowchart outlining a process executed by a gene analysis device according to a first embodiment of the present invention.
- Flow of electrophoresis processing of real samples Base calling flow
- Signal section detection flow A diagram explaining the characteristics of non-signal sections
- Diagram of determining non-signal features of a section Diagram of signal boundary determination (part 1)
- Diagram of signal boundary determination (part 2)
- FIG. 1 is a diagram showing an example of the configuration of a gene analysis device 101 according to a first embodiment.
- the genetic analysis device 101 includes an electrophoresis device 105 and a data analysis device 112.
- the electrophoresis device 105 and the data analysis device 112 are communicatively connected using a communication cable.
- the data analysis device 112 includes a central control unit 102 , a storage unit 104 , and a user interface unit 103 .
- the central control unit 102 executes control and data processing of the electrophoretic device 105.
- the central control unit 102 is, for example, a central processing unit (CPU) and a graphics processing unit (GPU).
- the storage unit 104 stores programs executed by the central control unit 102, setting information for the electrophoretic device 105, information used for various processes, etc.
- the storage unit 104 is, for example, a memory.
- the user interface unit 103 is an interface for connecting to an input device and an output device, or an interface for connecting to an external device via a network.
- the data analysis device 112 presents information to a user via the user interface unit 103, and also accepts information input by the user.
- the central control unit 102 operates as a sample information setting unit 106, an electrophoresis device control unit 108, a fluorescence intensity calculation unit 110, and a base calling unit 107 by executing the programs stored in the memory unit 104.
- a sample information setting unit 106 an electrophoresis device control unit 108
- a fluorescence intensity calculation unit 110 a base calling unit 107 by executing the programs stored in the memory unit 104.
- the sample information setting section 106 is a setting section for setting information related to a sample.
- the electrophoresis device control unit 108 is a control unit that controls the electrophoresis of the sample performed by the electrophoresis device 105.
- the fluorescence intensity calculation unit 110 is an acquisition unit that acquires time series data indicating the results of electrophoresis from the electrophoresis device 105.
- the time series data includes a plurality of fluorescence intensity data corresponding to a plurality of bases.
- the base calling unit 107 is an analysis unit that analyzes the base sequence of a sample from time-series data.
- the base calling unit 107 includes an analysis interval detection unit 109.
- the analysis interval detection unit 109 divides the time series data into a plurality of intervals, and generates a non-signal feature indicating a non-signal for each fluorescence intensity data based on the frequency of occurrence of maximum, minimum, and flat points in the fluorescence intensity data in each interval.
- the feature is set to a value that is larger as the non-signal is more likely.
- a value that is larger as the occurrence frequency is smaller, such as the inverse of the occurrence frequency or a value obtained by subtracting the occurrence frequency from a fixed value, may be generated as a signal feature.
- the signal feature is set to a value that is larger as the signal is more likely.
- the analysis interval detection unit 109 determines the minimum value of the multiple non-signal features generated for multiple fluorescence intensity data as the non-signal feature for that interval. If a signal feature is used, the maximum signal feature is determined as the signal feature for that interval. Then, the signal interval of the time series data is detected using the signal feature for the interval.
- a signal interval (signal region) is an interval in the time series data that includes a change in fluorescence intensity due to the presence of bases.
- a non-signal section is a section of the time series data that does not contain any changes in fluorescence intensity due to the presence of bases.
- the electrophoresis device 105 electrophoreses the sample (DNA fragments) and obtains electrophoresis data.
- the electrophoresis data is time-series data of the brightness values of DNA fragments labeled with fluorescent dyes.
- Figure 2 is a diagram showing an example of the configuration of the electrophoresis device 105 of Example 1.
- the electrophoresis device 105 has a detection unit 216, a thermostatic chamber 218, a transport machine 225, a high-voltage power supply 204, a first ammeter 205, an anode electrode 211, a second ammeter 212, a capillary array 217, and a pump mechanism 203.
- the capillary array 217 is a replacement component that includes multiple (e.g., eight) capillaries 202, and includes a load header 229, a detection unit 216, and a capillary head 233. In addition, if a capillary 202 is damaged or its quality deteriorates, it can be replaced with a new capillary array 217.
- the capillary 202 is made of a glass tube with an inner diameter of several tens to several hundred microns and an outer diameter of several hundred microns, and its surface is coated with polyimide to improve its strength.
- the light irradiation section where the laser light is irradiated has a structure where the polyimide coating has been removed so that the internal light emission can easily leak to the outside.
- the inside of the capillary 202 is filled with a separation medium that creates a difference in migration speed during electrophoresis. Separation media come in both fluid and non-fluid types, but in Example 1, a fluid polymer is used.
- the high-voltage power supply 204 applies a high voltage to the capillary 202.
- the first ammeter 205 detects the current emitted from the high-voltage power supply 204.
- the second ammeter 212 detects the current flowing through the anode electrode 211.
- the optical detection unit that detects the information light obtained from the sample is composed of a light source 214 that irradiates the detection unit 216 with excitation light, an optical detector 215 for detecting the light emitted within the detection unit 216, and a diffraction grating 232.
- the detection unit 216 is a component that acquires information that depends on the sample.
- the detection unit 216 When detecting a sample in the capillary 202 that has been separated by electrophoresis, the detection unit 216 is irradiated with excitation light from the light source 214, generating fluorescence having a wavelength that depends on the sample as information light. Furthermore, the diffraction grating 232 separates the information light in the wavelength direction, and the optical detector 215 detects the separated information light to analyze the sample.
- the capillary cathode ends 227 are each fixed through a metallic hollow electrode 226, with the tip of the capillary 202 protruding from the hollow electrode 226 by approximately 0.5 mm.
- the hollow electrodes 226 provided on each capillary 202 are all attached together to the load header 229. Furthermore, all hollow electrodes 226 are electrically connected to the high-voltage power supply 204 mounted on the main body of the device, and function as cathode electrodes when voltage application is required for electrophoresis, sample introduction, etc.
- the capillary end opposite the capillary cathode end 227 (the other end) is bound together by the capillary head 233.
- the capillary head 233 can be connected to the block 207 in a pressure-tight manner.
- a high voltage is applied between the load header 229 and the capillary head 233 from the high-voltage power supply 204.
- new polymer is filled into the capillary 202 from the other end by the syringe 206.
- the polymer in the capillary 202 is refilled for each measurement to improve the measurement performance.
- the pump mechanism 203 is composed of a syringe 206 and a mechanism for pressurizing the syringe 206, and injects the polymer into the capillary 202.
- Block 207 is a connection part for connecting the syringe 206, the capillary array 217, the anode buffer container 210, and the polymer container 209.
- the thermostatic chamber 218 is covered with a heat insulating material to keep the capillaries 202 in the thermostatic chamber 218 at a constant temperature, and the temperature is controlled by a heating and cooling mechanism 220.
- a fan 219 circulates and stirs the air in the thermostatic chamber 218, keeping the temperature of the capillary array 217 uniform and constant in position.
- the transporter 225 transports various containers to the capillary cathode end 227.
- the transporter 225 is equipped with three electric motors and linear actuators, and can move in three axial directions: up and down, left and right, and depth. At least one container can be placed on the moving stage 230 of the transporter 225. Furthermore, the moving stage 230 is equipped with an electric grip 231, which can grasp and release each container. Therefore, the buffer container 221, the washing container 222, the waste liquid container 223, and the sample plate 224 can be transported to the capillary cathode end 227 as necessary. Unnecessary containers are stored in a designated storage location within the electrophoresis device 105.
- the user can use the data analysis device 112 to control various functions of the electrophoresis device 105 and obtain the electrophoresis data detected by the optical detection unit.
- the electrophoresis device 105 may have sensors for acquiring information about the observation environment that affects electrophoresis (observation environment information).
- the electrophoresis device 105 in FIG. 2 has an in-device sensor 240, a polymer sensor 241, and a buffer solution sensor 242.
- the internal sensor 240 is a sensor for acquiring information about the internal environment of the electrophoresis device 105, and measures, for example, a temperature sensor, a humidity sensor, and an air pressure sensor within the electrophoresis device 105.
- the polymer sensor 241 is a sensor for acquiring information about the quality of the polymer, such as a pH sensor and an electrical conductivity sensor.
- the polymer sensor 241 is installed inside the polymer container 209, but the installation location is not limited to this.
- the buffer solution sensor 242 is a sensor for obtaining information regarding the quality of the buffer solution, and may be, for example, a temperature sensor.
- the buffer solution sensor 242 is installed in the anode buffer container 210, but the installation location is not limited to this.
- the buffer solution sensor 242 may be installed in the buffer container 221.
- FIG. 3 is a flowchart outlining the processing executed by the genetic analysis device 101 of the first embodiment.
- the electrophoresis device 105 of the genetic analysis device 101 performs electrophoresis processing on the sample to be analyzed (step S301). Details of the electrophoresis processing will be explained using FIG. 4.
- the data analysis device 112 of the genetic analysis device 101 performs spectrum correction to correct the wavelength characteristics of the device (step S302), and executes a fluorescence intensity calculation process using the electrophoresis data (step S303).
- the fluorescence intensity calculation unit 110 calculates time series data of the fluorescence intensity of the fluorescent dye from the electrophoresis data, and detects the center position, height, width, etc. of the peak from the time series data of the fluorescence intensity.
- the data analyzer 112 of the genetic analyzer 101 executes a mobility correction process on the time series data of the fluorescence intensity (step S304).
- the data analyzer 112 of the genetic analyzer 101 executes base calling using the time series data of the fluorescence intensity corrected based on the result of the mobility correction process (step S305).
- the base calling unit 107 identifies the base sequence of the sample using the time series data of the corrected fluorescence intensity.
- FIG 4 shows the flow of electrophoresis processing of an actual sample in S301.
- the basic steps of electrophoresis can be broadly divided into sample preparation (S401), analysis start event (S402), loading of migration medium (S403), preliminary migration (S404), sample introduction (S405), migration analysis (S406), and end of migration analysis (S407).
- the operator of this device sets the samples and reagents in this device as sample preparation (S401) before starting the analysis. More specifically, first, the buffer container 221 and the anode buffer container 210 are filled with a buffer solution that forms part of the current path.
- the buffer solution is, for example, an electrolyte solution commercially available from various companies for electrophoresis.
- the sample to be analyzed is dispensed into the wells of the sample plate 224.
- the sample is, for example, a PCR product of DNA.
- a cleaning solution for cleaning the capillary cathode end 227 is dispensed into the cleaning container 222.
- the cleaning solution is, for example, pure water.
- a migration medium for electrophoresis of the sample is injected into the syringe 206.
- the migration medium is, for example, a polyacrylamide separation gel or polymer commercially available from various companies for electrophoresis.
- the capillary array 217 is replaced if degradation of the capillary 202 is expected or if the length of the capillary 202 is to be changed.
- the samples set on the sample plate 224 at this time include the actual DNA sample to be analyzed, as well as a positive control, a negative control, and an allelic ladder, each of which is electrophoresed in a different capillary.
- the positive control is, for example, a PCR product containing known DNA, and is a sample used in a control experiment to confirm that DNA has been correctly amplified by PCR.
- the negative control is a PCR product that does not contain DNA, and is a sample used in a control experiment to confirm that the PCR amplified product has not been contaminated by the operator's DNA, dust, etc.
- allelic ladder is an artificial sample that contains many alleles that may commonly be contained in a DNA marker, and is usually provided by reagent manufacturers as part of a reagent kit for DNA identification. Allelic ladders are used to fine-tune the correspondence between the DNA fragment length of each DNA marker and the allele.
- the operator specifies the type of allelic ladder, the type of size standard, the type of fluorescent reagent, and the type of sample set in the wells on the sample plate 224 corresponding to each capillary.
- the type of sample specified is any one of real sample, positive control, negative control, and allelic ladder. This information is set in the sample information setting section 106 on the data analysis device 112 via the user interface section 103.
- the operator After completing the above sample preparation (S401), the operator operates the user interface unit 103 on the data analysis device 112 to instruct the start of analysis. This instruction to start analysis is passed to the electrophoresis device control unit 108.
- the electrophoresis device control unit 108 sends an analysis start signal to the electrophoresis device 105, thereby starting the analysis (S402).
- the electrophoresis device 105 starts filling the migration medium (S403). This step may be performed automatically after the start of the analysis, or may be performed sequentially by sending a control signal from the electrophoresis device control unit 108. Filling the migration medium is a procedure in which new migration medium is filled into the capillary 202 to form a migration path.
- the waste liquid container 223 is transported directly below the load header 229 by the transport machine 225, and the solenoid valve 213 is closed so that the used migration medium discharged from the capillary cathode end 227 can be received. Then, the syringe 206 is driven to fill the capillary 202 with new migration medium, and the used migration medium is discarded. Finally, the capillary cathode end 227 is immersed in a cleaning solution in the cleaning container 222, and the capillary cathode end 227 contaminated by the migration medium is cleaned.
- preliminary electrophoresis is performed. This step may be performed automatically or sequentially by sending a control signal from the electrophoresis device control unit 108.
- Preliminary electrophoresis is a procedure in which a predetermined voltage is applied to the electrophoretic medium to make the electrophoretic medium suitable for electrophoresis.
- the capillary cathode end 227 is immersed in the buffer solution in the buffer container 221 by the conveyor 225 to form a current path.
- the capillary cathode end 227 is immersed in the cleaning solution in the cleaning container 222 to clean the capillary cathode end 227 contaminated by the buffer solution.
- sample introduction is performed. This step may be performed automatically or sequentially by sending a control signal from the electrophoresis device control unit 108.
- sample introduction sample components are introduced into the migration path.
- the capillary cathode end 227 is immersed in the sample held in the well of the sample plate 224 by the conveyor 225, and then the solenoid valve 213 is opened. This forms a current path, and the sample components are ready to be introduced into the migration path. Then, a pulse voltage is applied to the current path by the high-voltage power supply 204, and the sample components are introduced into the migration path. Finally, the capillary cathode end 227 is immersed in a cleaning solution in the cleaning container 222, and the capillary cathode end 227 contaminated by the sample is washed.
- electrophoretic analysis S406 is performed. This step may be performed automatically or sequentially by sending a control signal from the electrophoretic device control unit 108.
- electrophoretic analysis S406
- each sample component contained in the sample is separated and analyzed by electrophoresis.
- the capillary cathode end 227 is immersed in the buffer solution in the buffer container 221 by the conveyor 225 to form a current path.
- a high voltage of about 15 kV is applied to the current path by the high-voltage power supply 204 to generate an electric field in the electrophoretic path.
- each sample component in the electrophoretic path moves to the detection unit 216 at a speed that depends on the properties of each sample component.
- the sample components are separated due to the difference in their moving speed.
- the sample components that reach the detection unit 216 are detected in order.
- the migration speed differs depending on the base length, and the DNAs reach the detection unit 216 in order starting from the shortest base length.
- a fluorescent dye that depends on the terminal base sequence is attached to each DNA.
- This information light is detected by the optical detector 215.
- the optical detector 215 detects this information light at regular time intervals and transmits image data to the data analysis device 112.
- the luminance of only a part of the image data may be transmitted instead of the image data.
- luminance values sampled only at wavelength positions at regular intervals may be transmitted for each capillary.
- This luminance value data represents the spectral waveform of each capillary. This spectral waveform is stored in the memory unit 104.
- FIG. 5 shows the flow of base calling in S305.
- the analysis interval detection unit 109 of the base calling unit 107 detects a signal interval from the time-series data of the corrected fluorescence intensity (step S501).
- the base calling unit 107 analyzes the detected signal section and identifies the base sequence of the sample (step S502).
- Step S601 The analysis interval detection unit 109 divides the entire time series data into a plurality of small intervals. Then, the process proceeds to step S602. In step S602, the analysis interval detection unit 109 selects one of the small intervals and generates non-signal feature values for each signal included in that interval. Each signal is four pieces of fluorescence intensity data corresponding to four bases. The analysis interval detection unit 109 generates non-signal feature values for each of the four pieces of fluorescence intensity data in the selected small interval. Then, the process proceeds to step S603.
- Step S603 The analysis section detection unit 109 determines the non-signal feature of the selected subsection. Specifically, the analysis section detection unit 109 sets the smallest feature of the four non-signal features calculated from the four fluorescence intensity data as the non-signal feature of the subsection. After step S603, if there are still subsections remaining for which non-signal features have not been determined, the process returns to step S602. Once non-signal features have been determined for all subsections, the process proceeds to step S604. Note that, as described above, when signal features are used instead of non-signal features, the largest signal feature is set as the signal feature of the subsection, and processing is performed in the same manner as above.
- Step S604 The analysis section detection unit 109 uses the non-signal features determined for each small section to determine the boundary between the non-signal section and the signal section, and ends the process.
- Figure 7 is a diagram explaining the features of the non-signal section.
- Figure 8 is a diagram explaining the features of the signal section.
- Dye1 to Dye4 indicate four fluorescent dyes corresponding to four bases.
- the horizontal axis is time and the vertical axis is fluorescence intensity.
- the analysis section detection unit 109 generates non-signal features based on the number of occurrences of the three shape patterns (maximum, minimum, flat) in the fluorescence intensity data.
- the generation of non-signal features from the shape patterns corresponds to step S602.
- FIG. 9 is an explanatory diagram of generation of non-signal features from a shape pattern.
- the shape pattern "flat" is defined as a case where the intensity difference between adjacent points is ⁇ h1. In other words, the following formula is satisfied.
- the points referred to here are individual sample values of the electrophoretic signal, and are determined by the time interval or sampling rate at which the optical detector 215 acquires data. This time interval is determined in advance by the user or as a default value for the device.
- -h1 ⁇ (y[k+1]-y[k]) ⁇ h1
- the shape pattern "maximum” is a pattern that satisfies the following formula.
- h1, h2, and h3 may be values that are determined in advance according to the sampling rate and the electrophoretic voltage.
- the analysis interval detection unit 109 regards the number of times the three patterns appear as non-signal features of the fluorescence intensity data in that interval. Note that it is also possible to normalize by the interval length and regard the frequency of appearance of the three patterns as non-signal features.
- the "flat" shape pattern is unlikely to appear in signal sections and is therefore highly important as a feature of non-signal sections. Therefore, the "flat" shape pattern may be weighted more heavily than the other shape patterns to generate non-signal features.
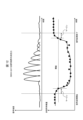
- FIG. 10 is an explanatory diagram of the determination of the non-signal feature of a section in S603.
- the minimum value of the non-signal feature of the fluorescence intensity data within the section is set as the non-signal feature of that section.
- the graph shown in FIG. 10 is the fluorescence intensity data of Dye1 to Dye4.
- F(Dye1) to F(Dye4) are the non-signal feature generated from the fluorescence intensity data of Dye1 to Dye4.
- the analysis section detection unit 109 finds the non-signal feature Fq for section q using Min(F(Dye1), F(Dye2), F(Dye3), F(Dye4)).
- FIGS. 11 and 12 are explanatory diagrams of the determination of the signal boundary in S604.
- the analysis interval detection unit 109 plots the non-signal features of each interval and performs smoothing and interpolation. This makes it possible to suppress the effects of small fluctuations in the non-signal features.
- the analysis interval detection unit 109 determines the time at which the smoothed and interpolated non-signal features exceed a threshold value as the signal interval boundary.
- the analysis interval detection unit 109 may determine the boundary to be the time when the interval in which the threshold value is exceeded continuously is equal to or exceeds a certain margin. This makes it possible to be robust against the effects of fluctuations near the boundary.
- FIG. 13 is an explanatory diagram of a case where a threshold is determined from the distribution of non-signal features in a section.
- the distribution of non-signal features is assumed to be bimodal.
- the signal portion is low, and the non-signal portion is high.
- the analysis section detection unit 109 can determine the threshold based on this distribution. For example, X% of the peak Fp of the higher (non-signal) mountain can be set as the threshold. Alternatively, a value at which the slope of the mountain becomes relatively flat can be set as the threshold.
- a predetermined fixed value may always be used.
- the threshold value is changed according to the signal level. That is, the threshold value is determined according to the following (1) and (2). (1) If the signal strength is above a certain level, it is always determined to be a signal section. (2) If the signal strength is below a certain level, the threshold is lowered according to the signal strength. Here, in the range (2), the lower the signal strength, the easier it is to determine that it is a non-signal section. Alternatively, a differential signal may be used. By lowering the threshold as the difference increases, the rising and falling edges of the signal section can be detected.
- a feature vector including non-signal features and other features is given as input to a signal section identifier 121, and a signal section is obtained as output. Any other feature such as signal intensity or a differential signal can be used.
- the signal interval identifier 121 any model such as a Deep Neural Network (DNN), a Support-Vector Machine (SVM), or Random Forest can be used.
- the output may be a discrimination result of whether it is a signal section or a non-signal section, or may be the probability (likelihood) of it being a signal section, or the like.
- FIG. 16 shows ensemble learning that combines multiple classifiers.
- a first feature vector is provided as input to the first signal section classifier 122
- a second feature vector is provided as input to the second signal section classifier 123.
- the outputs of the signal section classifiers 122-123 are then input to the discriminator 124, which finally obtains an output.
- the first feature vector includes, for example, a non-signal feature and a signal intensity
- the second feature vector includes, for example, a differential signal.
- the classifier 124 determines the output by majority vote, etc. Other methods such as bagging, boosting, and stacking may also be used.
- FIG. 17 is an explanatory diagram of the configuration for learning on the device.
- the signal section information storage unit 125 is a memory unit provided in the genetic analysis device. Each time the user performs a measurement, the signal section information storage unit 125 stores the signal section information (a label indicating whether it is a signal section or not) in association with the feature vector.
- the analysis section detection unit 109 can read the feature vector and label from the signal section information storage unit 125 and provide them to a signal section classifier to perform supervised learning.
- FIG. 18 is an explanatory diagram of learning that reflects the results of user adjustments.
- the operation and the results are stored in a specified information storage unit and reflected in the next learning. This improves the accuracy of signal section detection.
- FIG. 18 shows an example in which the user operates the boundary between the signal section and the non-signal section, the results of adjustments to other parameters can also be used. For example, if the user adjusts non-signal feature parameters (conditions for flat sections, conditions for maximum and minimum points), threshold settings, and parameters related to signal boundary determination, the results of that operation can be stored and learned.
- the base call unit 107 in the genetic analysis device 101 may reanalyze fluorescence intensity data other than the fluorescence intensity data generated from the electrophoresis results in the fluorescence intensity calculation unit 110.
- the fluorescence intensity data may be stored in the storage unit 104 or may be transmitted through a communication cable.
- the user can adjust the analysis interval by editing the fluorescence intensity data.
- FIG. 19 is an explanatory diagram of a case where the analysis interval is corrected by editing the fluorescence intensity data.
- the data is corrected so that the fluorescence intensity data near the beginning includes many flat parts, so that the non-signal feature amount increases and the signal start position can be moved.
- the fluorescence intensity near the beginning is set to a zero value, the fluorescence intensity will change significantly, and the base call result near the beginning may change compared to before the correction.
- the signal start position is changed by increasing the flat parts so that the signal intensity is within a certain range (gray range in the lower part of the figure) from the signal intensity before the correction.
- Such editing of the fluorescence intensity data may be performed using an external tool.
- the genetic analysis device 101 may have a function for editing such fluorescence intensity data.
- the disclosed genetic analysis device 101 includes a fluorescence intensity calculation unit 110 as an acquisition unit that acquires time-series data showing the results of electrophoresis of a sample, and a base calling unit 107 as an analysis unit that analyzes the base sequence of the sample from the time-series data.
- the time-series data includes a plurality of fluorescence intensity data corresponding to a plurality of bases
- the analysis unit divides the time-series data into a plurality of intervals, generates for each of the plurality of fluorescence intensity data a feature amount indicating the frequency of occurrence of at least one of a maximum portion, a minimum portion, and a flat portion of the fluorescence intensity data in each interval, determines an interval feature amount from the plurality of feature amounts generated for the plurality of fluorescence intensity data based on the magnitude relationship of the feature amounts, and detects a signal region, which is an analysis target region of the base sequence in the time-series data, using the interval feature amount.
- a signal section (signal region) can be detected with high accuracy from time-series data indicating the results of electrophoresis.
- a signal section including a low-intensity signal can be detected with high accuracy.
- a signal section can be detected with high accuracy even when the signal intensity varies widely.
- the detection accuracy of a signal section is improved for data including an unintended, suddenly high-intensity signal (dye blob) caused by sample pretreatment, data including a high-intensity signal that appears at the end of a PCR reaction, and data in which the signal intensity is attenuated due to a special sample or pretreatment.
- the analysis section determines, as the section feature, the feature that is the smallest among the feature values of the plurality of pieces of fluorescence intensity data.
- the signal section can be detected by identifying the non-signal section using a shape pattern that appears characteristically not in the signal section but in the non-signal section.
- the characteristics of electrophoresis due to the characteristics of electrophoresis, only one base will exist at the same position among multiple fluorescence intensity data, so by selecting the feature that is most likely to be a signal from the multiple fluorescence intensity data as the representative feature of the section, the characteristics of electrophoresis can be utilized to detect the signal section with high accuracy.
- the analysis unit may compare the feature amount of the section with a threshold value to determine whether the section is a non-signal section.
- the threshold value may be a predetermined fixed value or a value calculated from the distribution of the feature amount of the section. In this configuration, the signal section can be detected with high accuracy by taking into account the distribution of non-signal features.
- the analysis unit determines that the boundary between the consecutive sections and the signal area adjacent to the consecutive sections is the boundary between the signal area and non-signal area. This configuration can suppress the effects of fluctuations near the boundaries of the signal sections.
- the analysis unit detects the signal region using a discrimination model in which a feature amount of the section is one of inputs.
- signal sections can be flexibly detected from non-signal features and other features.
- the analysis unit generates feature quantities of the fluorescence intensity data by using a weight that is greater for flat portions of the fluorescence intensity data than for maximum and minimum portions of the fluorescence intensity data. In this way, by placing emphasis on the characteristic shape pattern of the non-signal section, the signal section can be detected with high accuracy.
- the analysis unit can detect a second signal section different from the fluorescence intensity data by using second fluorescence intensity data edited from the fluorescence intensity data, where the second fluorescence intensity data is a deviation amount within a certain range from the intensity of the fluorescence intensity data.
- the present invention is not limited to the above-mentioned embodiment, and various modifications are included.
- the above-mentioned embodiment is described in detail to easily explain the present invention, and is not necessarily limited to the embodiment having all the described configurations.
- the present invention is not limited to the deletion of the configurations, and it is also possible to replace or add the configurations.
- a configuration was exemplified in which a device that learns from data and a device that updates the signal section discriminator are integrated, but the learning and updating of the signal section discriminator may be performed by separate devices.
- Reference Signs List 101 Genetic analysis device
- 102 Central control unit
- 103 User interface unit
- 104 Memory unit
- 105 Electrophoresis device
- 106 Sample information setting unit
- 107 Base calling unit
- 108 Electrophoresis device control unit
- 109 Analysis section detection unit
- 110 Fluorescence intensity calculation unit
- 112 Data analysis device
- 121 to 123 Signal section discriminator
- 124 Discriminator
- 125 Signal section information storage unit
Landscapes
- Health & Medical Sciences (AREA)
- Life Sciences & Earth Sciences (AREA)
- Molecular Biology (AREA)
- Chemical & Material Sciences (AREA)
- Chemical Kinetics & Catalysis (AREA)
- Electrochemistry (AREA)
- Physics & Mathematics (AREA)
- Analytical Chemistry (AREA)
- Biochemistry (AREA)
- General Health & Medical Sciences (AREA)
- General Physics & Mathematics (AREA)
- Immunology (AREA)
- Pathology (AREA)
- Investigating, Analyzing Materials By Fluorescence Or Luminescence (AREA)
- Measuring Or Testing Involving Enzymes Or Micro-Organisms (AREA)
Priority Applications (5)
| Application Number | Priority Date | Filing Date | Title |
|---|---|---|---|
| PCT/JP2023/014893 WO2024214217A1 (ja) | 2023-04-12 | 2023-04-12 | 遺伝子解析装置及び遺伝子解析方法 |
| CN202380093546.3A CN120712472A (zh) | 2023-04-12 | 2023-04-12 | 基因解析装置及基因解析方法 |
| JP2025513573A JPWO2024214217A1 (https=) | 2023-04-12 | 2023-04-12 | |
| GB2512760.6A GB2641677A (en) | 2023-04-12 | 2023-04-12 | Genetic analysis device and genetic analysis method |
| DE112023005062.7T DE112023005062T5 (de) | 2023-04-12 | 2023-04-12 | Genanalysevorrichtung und genanalyseverfahren |
Applications Claiming Priority (1)
| Application Number | Priority Date | Filing Date | Title |
|---|---|---|---|
| PCT/JP2023/014893 WO2024214217A1 (ja) | 2023-04-12 | 2023-04-12 | 遺伝子解析装置及び遺伝子解析方法 |
Publications (1)
| Publication Number | Publication Date |
|---|---|
| WO2024214217A1 true WO2024214217A1 (ja) | 2024-10-17 |
Family
ID=93059143
Family Applications (1)
| Application Number | Title | Priority Date | Filing Date |
|---|---|---|---|
| PCT/JP2023/014893 Ceased WO2024214217A1 (ja) | 2023-04-12 | 2023-04-12 | 遺伝子解析装置及び遺伝子解析方法 |
Country Status (5)
| Country | Link |
|---|---|
| JP (1) | JPWO2024214217A1 (https=) |
| CN (1) | CN120712472A (https=) |
| DE (1) | DE112023005062T5 (https=) |
| GB (1) | GB2641677A (https=) |
| WO (1) | WO2024214217A1 (https=) |
Citations (6)
| Publication number | Priority date | Publication date | Assignee | Title |
|---|---|---|---|---|
| JPS62225956A (ja) * | 1986-03-26 | 1987-10-03 | Fuji Photo Film Co Ltd | 核酸の塩基配列決定のための信号処理方法 |
| JPS63210769A (ja) * | 1987-02-27 | 1988-09-01 | Shimadzu Corp | 等速電気泳動分析装置のデータ処理装置 |
| JPH11118760A (ja) * | 1997-10-14 | 1999-04-30 | Hitachi Ltd | 核酸断片の電気泳動パターンの解析法 |
| JP2003079366A (ja) * | 2001-09-11 | 2003-03-18 | Hitachi Ltd | プライマーウォーキング支援のための情報処理システム |
| JP2012177568A (ja) * | 2011-02-25 | 2012-09-13 | Arkray Inc | データ処理装置、データ処理方法、及びデータ処理プログラム |
| JP2018042560A (ja) * | 2010-07-05 | 2018-03-22 | ソニー株式会社 | 生体情報処理装置および方法、並びにプログラム |
-
2023
- 2023-04-12 JP JP2025513573A patent/JPWO2024214217A1/ja active Pending
- 2023-04-12 CN CN202380093546.3A patent/CN120712472A/zh active Pending
- 2023-04-12 GB GB2512760.6A patent/GB2641677A/en active Pending
- 2023-04-12 WO PCT/JP2023/014893 patent/WO2024214217A1/ja not_active Ceased
- 2023-04-12 DE DE112023005062.7T patent/DE112023005062T5/de active Pending
Patent Citations (6)
| Publication number | Priority date | Publication date | Assignee | Title |
|---|---|---|---|---|
| JPS62225956A (ja) * | 1986-03-26 | 1987-10-03 | Fuji Photo Film Co Ltd | 核酸の塩基配列決定のための信号処理方法 |
| JPS63210769A (ja) * | 1987-02-27 | 1988-09-01 | Shimadzu Corp | 等速電気泳動分析装置のデータ処理装置 |
| JPH11118760A (ja) * | 1997-10-14 | 1999-04-30 | Hitachi Ltd | 核酸断片の電気泳動パターンの解析法 |
| JP2003079366A (ja) * | 2001-09-11 | 2003-03-18 | Hitachi Ltd | プライマーウォーキング支援のための情報処理システム |
| JP2018042560A (ja) * | 2010-07-05 | 2018-03-22 | ソニー株式会社 | 生体情報処理装置および方法、並びにプログラム |
| JP2012177568A (ja) * | 2011-02-25 | 2012-09-13 | Arkray Inc | データ処理装置、データ処理方法、及びデータ処理プログラム |
Also Published As
| Publication number | Publication date |
|---|---|
| GB2641677A (en) | 2025-12-10 |
| DE112023005062T5 (de) | 2025-09-18 |
| CN120712472A (zh) | 2025-09-26 |
| JPWO2024214217A1 (https=) | 2024-10-17 |
Similar Documents
| Publication | Publication Date | Title |
|---|---|---|
| EP3583413B1 (en) | Automated quality control and spectral error correction for sample analysis instruments | |
| EP1367388B1 (en) | Capillary electrophoresis method | |
| US8392126B2 (en) | Method and system for determining the accuracy of DNA base identifications | |
| US20030127328A1 (en) | Multi-capillary electrophoresis apparatus | |
| JP4991252B2 (ja) | 電気泳動装置、及び電気泳動分析方法 | |
| WO2024214217A1 (ja) | 遺伝子解析装置及び遺伝子解析方法 | |
| CN112513618B (zh) | 生物聚合物分析方法及生物聚合物分析装置 | |
| JP7640687B2 (ja) | 塩基配列の解析方法及び遺伝子解析装置 | |
| CN113439117B (zh) | 基因型解析装置及方法 | |
| CN118435050A (zh) | 电泳系统 | |
| WO2021166210A1 (ja) | 電気泳動装置 | |
| WO2026013861A1 (ja) | 遺伝子解析装置、遺伝子解析方法及び遺伝子解析システム | |
| US12282000B2 (en) | Biological sample analysis device and biological sample analysis method | |
| JP7745749B2 (ja) | 塩基配列の解析方法及び遺伝子解析装置 | |
| GB2633217A (en) | Electrophoresis data processing device and electrophoresis data processing method | |
| US20080110757A1 (en) | Methods for manipulating separation media | |
| US12276635B2 (en) | Electrophoresis device and foreign matter detection method | |
| GB2639474A (en) | Mutant gene detection method | |
| JP4994250B2 (ja) | キャピラリ電気泳動装置及び電気泳動媒体のリーク検査方法 |
Legal Events
| Date | Code | Title | Description |
|---|---|---|---|
| 121 | Ep: the epo has been informed by wipo that ep was designated in this application |
Ref document number: 23932993 Country of ref document: EP Kind code of ref document: A1 |
|
| WWE | Wipo information: entry into national phase |
Ref document number: 112023005062 Country of ref document: DE |
|
| ENP | Entry into the national phase |
Ref document number: 202512760 Country of ref document: GB Kind code of ref document: A Free format text: PCT FILING DATE = 20230412 |
|
| WWE | Wipo information: entry into national phase |
Ref document number: 2512760.6 Country of ref document: GB |
|
| ENP | Entry into the national phase |
Ref document number: 2025513573 Country of ref document: JP Kind code of ref document: A |
|
| WWE | Wipo information: entry into national phase |
Ref document number: 2025513573 Country of ref document: JP |
|
| WWP | Wipo information: published in national office |
Ref document number: 112023005062 Country of ref document: DE |
|
| WWP | Wipo information: published in national office |
Ref document number: 2512760.6 Country of ref document: GB |
|
| 122 | Ep: pct application non-entry in european phase |
Ref document number: 23932993 Country of ref document: EP Kind code of ref document: A1 |