WO2024166705A1 - 粒子径分布測定装置、粒子径分布測定方法、及び、粒子径分布測定用プログラム - Google Patents
粒子径分布測定装置、粒子径分布測定方法、及び、粒子径分布測定用プログラム Download PDFInfo
- Publication number
- WO2024166705A1 WO2024166705A1 PCT/JP2024/002288 JP2024002288W WO2024166705A1 WO 2024166705 A1 WO2024166705 A1 WO 2024166705A1 JP 2024002288 W JP2024002288 W JP 2024002288W WO 2024166705 A1 WO2024166705 A1 WO 2024166705A1
- Authority
- WO
- WIPO (PCT)
- Prior art keywords
- particle size
- size distribution
- focus position
- focus
- imaging data
- Prior art date
- Legal status (The legal status is an assumption and is not a legal conclusion. Google has not performed a legal analysis and makes no representation as to the accuracy of the status listed.)
- Ceased
Links
Images


Classifications
-
- G—PHYSICS
- G01—MEASURING; TESTING
- G01N—INVESTIGATING OR ANALYSING MATERIALS BY DETERMINING THEIR CHEMICAL OR PHYSICAL PROPERTIES
- G01N15/00—Investigating characteristics of particles; Investigating permeability, pore-volume or surface-area of porous materials
- G01N15/02—Investigating particle size or size distribution
- G01N15/0205—Investigating particle size or size distribution by optical means
- G01N15/0227—Investigating particle size or size distribution by optical means using imaging; using holography
-
- G—PHYSICS
- G03—PHOTOGRAPHY; CINEMATOGRAPHY; ANALOGOUS TECHNIQUES USING WAVES OTHER THAN OPTICAL WAVES; ELECTROGRAPHY; HOLOGRAPHY
- G03B—APPARATUS OR ARRANGEMENTS FOR TAKING PHOTOGRAPHS OR FOR PROJECTING OR VIEWING THEM; APPARATUS OR ARRANGEMENTS EMPLOYING ANALOGOUS TECHNIQUES USING WAVES OTHER THAN OPTICAL WAVES; ACCESSORIES THEREFOR
- G03B13/00—Viewfinders; Focusing aids for cameras; Means for focusing for cameras; Autofocus systems for cameras
- G03B13/32—Means for focusing
- G03B13/34—Power focusing
- G03B13/36—Autofocus systems
Definitions
- the present invention relates to a particle size distribution measuring device, a particle size distribution measuring method, and a program for measuring particle size distribution.
- PTA method particle trajectory analysis method
- This measurement method measures particle size distribution by calculating the diffusion speed of particles due to Brownian motion based on the imaging data obtained by imaging particles inside a cell.
- the inventor therefore attempted to apply the existing autofocus function found in cameras and other devices in order to equip the device with a function for automatically adjusting the focus.
- Existing autofocus functions for example, convert the image contrast into a numerical value using first-order differentiation, and focus on the position where the contrast is maximum.
- the present invention solves all of the above problems at once, and its main objective is to enable the focus position to be adjusted with a high success rate when measuring particle size distribution using the PTA method.
- the particle size distribution measuring device is a particle size distribution measuring device comprising an imaging means for imaging particles in a cell, and an analysis unit for calculating a particle size distribution by calculating the diffusion speed of particles due to Brownian motion based on imaging data obtained by the imaging means, and is characterized by comprising a data group acquisition unit for acquiring an imaging data group consisting of a plurality of imaging data obtained by the imaging means at each of a plurality of focus positions in the cell, a fluctuation value calculation unit for calculating a fluctuation value of a predetermined evaluation parameter obtained from each of the plurality of imaging data constituting the imaging data group, and a focus position determination unit for determining a measurement focus position to be used during measurement based on the fluctuation value corresponding to each of the plurality of focus positions.
- the particle size distribution measuring device determines the measurement focus position based on the fluctuation values of the evaluation parameters corresponding to each of the multiple focus positions.
- the measurement focus position is determined by using the essence of Brownian motion, that is, the fluctuation over time.
- the focus position determination unit determines the measurement focus position from within a stable range that includes a plurality of focus positions whose fluctuation value is below a threshold value.
- the focus position determination unit determines the focus position where the fluctuation value is smallest in the stable range, or the focus position in the center of the stable range, as the measurement focus position.
- the evaluation parameter be the contrast of the image shown by the imaging data, the number of particles appearing in the image, the intensity of each pixel that constitutes the image, or the number of pixels contained in the image that exceed a predetermined intensity.
- the fluctuation value indicates the degree of time fluctuation of the evaluation parameter, so that the measurement focus position can be determined by utilizing the essence of Brownian motion, which is time fluctuation.
- the fluctuation value calculation section calculates the fluctuation value by fitting a predetermined function to a distribution graph in which one axis represents the value of the evaluation parameter and the other axis represents frequency.
- the variation value calculation section fits the predetermined function to the distribution graph corresponding to the focus position included in a search region set in a part of the cell in the depth direction. With this configuration, it is not necessary to move the focus position over the entire area in the depth direction of the cell, and the focus position can be adjusted in a shorter time.
- the particles in the cell may be stirred or the image capturing position may be changed, and then the particle size distribution may be measured again.
- the number of measurements may be increased to improve the measurement accuracy.
- the focus is not significantly off after stirring, and measurements are continued without changing the focus position before stirring.
- manually adjusting the focus every time you mix would take an enormous amount of time and effort.
- the particle size distribution measuring device further includes a stirring means for stirring the particles in the cell, the effects of the present invention are more pronounced, and measurement accuracy can be further improved in a short time and with little effort.
- a focus adjustment unit that adjusts the focus of the imaging means to the measurement focus position.
- the particle size distribution measurement method is a particle size distribution measurement method using a particle size distribution measurement device that includes an imaging means for imaging particles in a cell and an analysis unit that calculates a particle size distribution by calculating the diffusion speed of the particles due to Brownian motion based on the imaging data obtained by the imaging means, and is characterized by comprising a data group acquisition step of acquiring an imaging data group consisting of a plurality of imaging data obtained by the imaging means at each of a plurality of focus positions in the cell, a fluctuation value calculation step of calculating a fluctuation value of a predetermined evaluation parameter obtained from each of the plurality of imaging data constituting the imaging data group, and a focus position determination step of determining a measurement focus position to be used during measurement based on the fluctuation value corresponding to each of the plurality of focus positions.
- the particle size distribution measurement program is a program used in a particle size distribution measurement device that includes an imaging means for imaging particles in a cell, and an analysis unit that calculates the particle size distribution by calculating the diffusion speed of the particles due to Brownian motion based on the imaging data obtained by the imaging means, and is characterized in that it causes a computer to perform the functions of a data group acquisition unit that acquires an imaging data group consisting of multiple imaging data obtained by the imaging means at multiple focus positions in the cell, a fluctuation value calculation unit that calculates the fluctuation value of a predetermined evaluation parameter obtained from each of the multiple imaging data that constitute the imaging data group, and a focus position determination unit that determines the measurement focus position to be used during measurement based on the fluctuation value corresponding to each of the multiple focus positions.
- Such a particle size distribution measurement method and program for measuring particle size distribution can provide the same effects as the particle size distribution measurement device described above.
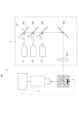
- FIG. 1 is a schematic diagram showing a particle size distribution measuring device according to an embodiment of the present invention.
- FIG. 2 is a functional block diagram showing functions of the information processing apparatus according to the embodiment.
- FIG. 4 is a schematic diagram illustrating an autofocus function in the embodiment.
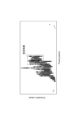
- 6 is an experimental result showing the variation of evaluation parameters according to the embodiment.
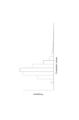
- 11 is a distribution graph showing the variation of evaluation parameters according to the embodiment;
- FIG. 13 is a schematic diagram showing a particle size distribution measuring device in another embodiment.
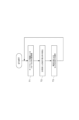
- 10 is a flowchart showing the operation of a particle size distribution measuring device in another embodiment.
- a particle size distribution measuring apparatus 100 in this embodiment includes a light irradiating unit 2 that irradiates particles in a cell 1 with light of an excitation wavelength, an imaging means 3 that images the particles by detecting light scattered by the particles in the cell 1, and an information processing device 4 that analyzes the imaging data obtained by the imaging means 3.
- the light irradiation unit 2 has multiple light sources 21, 22, 23 that irradiate light of different excitation wavelengths.
- the light sources 21, 22, 23 are, for example, laser light sources. When detecting scattered light by particles and imaging the particles, it is necessary to irradiate light of an appropriate excitation wavelength according to the particle diameter.
- three light sources 21, 22, 23 are provided to accommodate particles of various diameters. Note that one light source may irradiate light including three excitation wavelengths. The number of light sources may be three or more, or may be one.
- the first light source 21 irradiates light of a predetermined first excitation wave ⁇ 1
- the second light source 22 irradiates light of a predetermined second excitation wavelength ⁇ 2
- the third light source 23 irradiates light of a predetermined third excitation wavelength ⁇ 3.
- the light emitted from each of these light sources 21, 22, and 23 is guided to the cell 1 via an irradiation optical system 24 including reflecting mirrors 241 and 242, half mirrors 243 and 244, and a condenser lens 245.
- These light sources 21, 22, and 23 are controlled by a control unit (not shown) so as to simultaneously irradiate light of the respective excitation wavelengths ⁇ 1, ⁇ 2, and ⁇ 3. Note that these light sources 21, 22, and 23 can also be controlled so as to irradiate light individually.
- the imaging means 3 captures images of particles by detecting scattered light from the particles in the cell 1.
- the imaging means 3 is an imaging camera such as a CCD camera, and outputs image data as imaging data. Note that in FIG. 1, the light irradiation direction of the light irradiation unit 2 and the imaging direction of the imaging means 3 are arranged perpendicular to each other, but this is not limited to this.
- the information processing device 4 is a computer equipped with a CPU, memory, a display, various input/output devices, etc., and is connected to the imaging means 3 by wire or wirelessly.
- the information processing device 4 performs at least the function of an analysis unit 41 as shown in FIG. 2 by executing the particle size distribution measurement program stored in the memory.
- the analysis unit 41 acquires imaging data from the imaging means 3 and calculates the particle size distribution by the PTA method based on this imaging data. More specifically, it calculates the particle size distribution by calculating the diffusion speed of the particles due to Brownian motion based on the imaging data.
- the particle size distribution measuring device 100 of this embodiment is equipped with an autofocus function that automatically adjusts the focus of the imaging means 3 described above to the particles in the cell 1.
- the information processing device 4 described above is configured to function as a focus adjustment unit 42, a data group acquisition unit 43, a fluctuation value calculation unit 44, and a focus position determination unit 45.
- the focus adjustment unit 42 moves the focus of the imaging means 3 to multiple focus positions within the cell 1, and is specifically configured to move the focus of the imaging means 3 toward and away from the cell 1 according to a predetermined rule.
- the focus adjustment unit 42 of this embodiment is configured to move the focus of the imaging means 3 from the front side of the cell 1 to the back side, or from the back side to the front side, in increments of a predetermined distance (S1 in FIG. 3).
- the focus adjustment unit 42 may move the focus of the imaging means 3 over the entire area in the depth direction of the cell 1, but here it is configured to move only to a partial area in the depth direction (hereinafter referred to as the search area).
- this search area may be an unchanging range that is preset during the manufacture of the device, or may be a range that can be changed by the user, or may be a range that is automatically changed depending on the measurement conditions such as the solvent in the cell.
- the imaging means 3 captures images of the inside of the cell 1 multiple times at each of the focus positions to which it is moved, and the data group acquisition unit 43 acquires an imaging data group consisting of these multiple imaging data (S2 in FIG. 3).
- the data group acquisition unit 43 may acquire an image data group at each of the multiple focus positions by imaging the inside of cell 1 once at each focus position and moving each focus position multiple times.
- the number of pieces of imaging data included in the imaging data group is not particularly limited, but if it is too small, the success rate of the autofocus function may decrease, and if it is too large, the time required for autofocusing will increase, so it is desirable for the number to be, for example, several tens to several hundreds.
- the various parameters (hereinafter also referred to as evaluation parameters) that can be obtained from each piece of imaging data, such as the contrast of the image shown by each piece of imaging data, the number of particles captured in that image, the intensity of each pixel that composes that image, or the number of pixels contained in that image that exceed a certain intensity, vary due to differences in the imaging timing of each piece of imaging data.
- the variation value calculation unit 44 then calculates the variation value of a predetermined evaluation parameter obtained from each of the multiple imaging data constituting the imaging data group (S3 in FIG. 3).
- These evaluation parameters are parameters that can be obtained from imaging data, and their values vary over time, in other words, vary according to the timing of imaging of the imaging data, and the variation value indicates the degree of this variation over time, in other words, the variance of the evaluation parameter value.
- the degree of change over time in this evaluation parameter i.e., the variance in the evaluation parameter, should be large at an out-of-focus focus position and small at an in-focus focus position.
- the evaluation parameter will be described as contrast such as the RMS contrast (Root Mean Square Contrast) of the image represented by the imaging data.
- the variation value may be anything that is an index of the variation in the values of the evaluation parameters, such as standard deviation, variance, or residual sum of squares.
- the variation value will be described by taking the width of the distribution of the evaluation parameters (hereinafter, also referred to as the distribution width).
- variation value calculation unit 44 of this embodiment performs image processing or image analysis on each of the multiple imaging data that make up the imaging data group, obtains the image contrast from each of the imaging data as an evaluation parameter, and calculates the distribution width of the contrast as a variation value.
- the contrast obtained by the variation value calculation unit 44 may be the contrast of the entire image represented by the imaging data, or may be the contrast of a predetermined partial area of the image.
- the graph shown in Figure 4 plots contrast, an evaluation parameter obtained from each of multiple pieces of imaging data, on a graph with focus position on the horizontal axis and the evaluation parameter value on the vertical axis. As can be seen from this graph, there is some variation in the evaluation parameter values obtained from each of multiple imaging data included in a certain imaging data group.
- the fluctuation value calculation unit 44 of this embodiment is configured to calculate the fluctuation value by fitting a predetermined function to the above-mentioned distribution graph.
- examples of the predetermined function include equations that represent probability density distributions such as the Gumble distribution and the Frechet distribution, and the fluctuation value calculation unit 44 fits these functions to a distribution graph and obtains the distribution width from the parameters included in the function after the fitting.
- the variation value calculation unit 44 may fit a predetermined function to a distribution graph corresponding to all of the imaging data groups obtained in the above-mentioned search area, in other words, a distribution graph corresponding to all focus positions to which the focus of the imaging means 3 is moved in the search area, or may fit a predetermined function only to a distribution graph corresponding to some of the focus positions.
- the fluctuation value calculation unit 44 compares each of the fluctuation values (distribution width) obtained after fitting with a threshold value, and identifies a range (hereinafter referred to as a stable range) that includes multiple focus positions where the fluctuation value is below the threshold value (see Figure 4).
- the focus position determination unit 45 determines the measurement focus position to be used during measurement based on the fluctuation values corresponding to each of the multiple focus positions (S4 in FIG. 3).
- This focus position determination unit 45 determines a measurement focus position from within the above-mentioned stable range, and here one of the focus positions included in the stable range is set as the measurement focus position. Note that the unit may be configured to determine multiple focus positions included in the stable range as measurement focus positions and output these focus positions in a selectable manner.
- the focus position determination unit 45 here determines the focus position where the fluctuation value is the smallest in the stable range, or the focus position in the center of the stable range, as the focus position for measurement.
- the center of the stable range may be the center of the stable range itself, or it may be a position (center of gravity position) that is biased from the center toward the focus position where the fluctuation value is the smallest.
- the measurement focus position determined by the focus position determination unit 45 is output to the focus adjustment unit 42 described above, and the focus adjustment unit 42 adjusts the focus of the imaging means 3 to the measurement focus position before measuring the particle size distribution (S5 in FIG. 3), after which the analysis unit 41 calculates the particle size distribution (S6 in FIG. 3).
- the measurement focus position is determined based on the fluctuation values of the evaluation parameters corresponding to each of the multiple focus positions.
- the measurement focus position is determined using the essence of Brownian motion, that is, fluctuation over time. Therefore, the in-focus focus position can be automatically adjusted with a high success rate, and the effort required for focusing can be significantly reduced.
- the contrast of the image shown by the imaging data is used as the evaluation parameter, and the standard deviation is used as the variation value, so the variation value can be calculated without using complex calculation processing.
- the focus position determination unit 45 determines the measurement focus position from within the stable range, so that it is possible to prevent a focus position at which the fluctuation value becomes accidentally small from being determined as the measurement focus position.
- the focus position determination unit 45 determines the focus position with the smallest fluctuation value in the stable range or the focus position in the center of the stable range as the focus position for measurement, so that the focus position for measurement can be brought closer to the focused position.
- the fluctuation value calculation unit 44 calculates the fluctuation value by fitting a predetermined function to a distribution graph in which one axis represents the value of the evaluation parameter and the other axis represents the frequency, so that even if the distribution is prone to outliers, it is possible to calculate a plausible fluctuation value without using outlier processing.
- variation value calculation unit 44 fits a predetermined function to a distribution graph corresponding to the focus position included in the search area, it is not necessary to move the focus position over the entire depth direction of cell 1, and the focus position can be adjusted in a shorter time.
- the particle size distribution measuring device 100 may further include a stirring means 5 for stirring the particles in the cell 1, as shown in FIG. 6.
- the information processing device 4 may be equipped with a control unit that repeats each of the following operations multiple times: adjusting the focus position of the imaging means 3 by an autofocus function (T1), calculating the particle size distribution by the analysis unit 41 (T2), and stirring the particles in the cell 1 by the stirring means 7 (T3), as shown in FIG. 7 .
- T1 autofocus function
- T2 particle size distribution
- T3 stirring means 7
- the number of measurements can be increased (i.e., the number of particles to be measured can be increased) in the measurement by the PTA method, and the focus of the imaging means 3 can be automatically adjusted each time stirring is performed, thereby enabling further improvement in measurement accuracy in a short time and without hassle.
- the evaluation parameter is not limited to contrast, but may be the number of particles appearing in the image shown by the imaging data, or the intensity of each pixel that constitutes the image, etc.
- the variation value is not limited to the standard deviation, but may be the variance or the sum of squared residuals, etc.
- the particle size distribution measuring device 100 may be configured so that the focus of the imaging means 3 can be manually changed so that the focus position can be finely adjusted, for example, after completion of an autofocus operation.
- a focus position change button may be displayed on a display or the like, and the focus of the imaging means 3 may be manually changed by operating this button.
Landscapes
- Physics & Mathematics (AREA)
- General Physics & Mathematics (AREA)
- Chemical & Material Sciences (AREA)
- Dispersion Chemistry (AREA)
- Health & Medical Sciences (AREA)
- Life Sciences & Earth Sciences (AREA)
- Analytical Chemistry (AREA)
- Biochemistry (AREA)
- General Health & Medical Sciences (AREA)
- Immunology (AREA)
- Pathology (AREA)
- Length Measuring Devices By Optical Means (AREA)
Abstract
セル1内の粒子を撮像する撮像手段3と、撮像手段3により得られる撮像データに基づいて、粒子のブラウン運動による拡散速度を算出することにより粒子径分布を算出する分析部41と、を備える粒子径分布測定装置100であって、撮像手段3により得られる複数の撮像データからなる撮像データ群を、セル1内における複数のフォーカス位置それぞれにおいて取得するデータ群取得部43と、撮像データ群を構成する複数の撮像データそれぞれから得られる所定の評価パラメータの変動値を算出する変動値算出部44と、複数のフォーカス位置それぞれに対応する変動値に基づいて、測定時に用いる測定用フォーカス位置を判断するフォーカス位置判断部45と、を備えるようにした。
Description
本発明は、粒子径分布測定装置、粒子径分布測定方法、及び、粒子径分布測定用プログラムに関するものである。
従来の粒子径分布測定装置としては、特許文献1に示すように、粒子軌跡解析法(PTA法)と称される測定法を用いたものがある。
この測定法は、セル内の粒子を撮像して得られる撮像データに基づいて、粒子のブラウン運動による拡散速度を算出することで粒子径分布を測定するものである。
測定精度を担保するためには、多くの粒子にフォーカスを合わせた状態で撮像データを得ることが望ましいものの、現状では、作業者が手動でフォーカス位置を調整しており、この作業には手間や時間がかかっている。
そこで本発明者は、装置にフォーカスを自動で合わせる機能を備えさせるべく、カメラ等に搭載されている既存のオートフォーカス機能の適用を試みた。
かかる既存のオートフォーカス機能としては、例えば画像のコントラストを一次微分等により数値化して、その最大となる位置にフォーカスを合わせるものがある。
ところが、粒子のブラウン運動は、本質的に不連続な運動であり、言い換えれば、いたるタイミングで微分不可能な運動であるから、粒子は常にちらついており、上述した既存のオートフォーカス機能を用いても、コントラストを最大化する動作が収束しない場合が多い。
このことは、コントラストに限らず、オートフォーカスに際してどのようなパラメータを用いるにせよ共通することである。つまり、画像に現れる種々のパラメータが短時間で変化し得るので、例えばハイスピードカメラを用いて撮像間隔を短くするなどといった工夫をしたとしても、前の撮像データと次の撮像データとが似通ったものになる保証はなく、反ってガラッと変わることもあり、フォーカス位置が定まらないことが多い。
その結果、PTA法にフォーカス機能を適用しても成功確率は非常に低く、現実的には時間の短縮化につながらない。
そこで、本発明は上述した問題を一挙に解決するものであり、PTA法による粒子径分布測定において、フォーカス位置を高い成功確率で合わせることができるようにすることをその主たる課題とするものである。
すなわち本発明に係る粒子径分布測定装置は、セル内の粒子を撮像する撮像手段と、前記撮像手段により得られる撮像データに基づいて、粒子のブラウン運動による拡散速度を算出することにより粒子径分布を算出する分析部と、を備える粒子径分布測定装置であって、前記撮像手段により得られる複数の撮像データからなる撮像データ群を、前記セル内における複数のフォーカス位置それぞれにおいて取得するデータ群取得部と、前記撮像データ群を構成する複数の撮像データそれぞれから得られる所定の評価パラメータの変動値を算出する変動値算出部と、前記複数のフォーカス位置それぞれに対応する前記変動値に基づいて、測定時に用いる測定用フォーカス位置を判断するフォーカス位置判断部と、を備えることを特徴とするものである。
ここで、上述した通り、撮像データに含まれる種々のパラメータは短時間で変化し得るが、この時間的な変化の度合いは、ピントの合わないフォーカス位置では大きくなり、ピントの合うフォーカス位置では小さくなるはずである。
このことに鑑みれば、本発明に係る粒子径分布測定装置は、複数のフォーカス位置それぞれに対応する評価パラメータの変動値に基づいて測定用フォーカス位置を判断しており、言い換えれば、時間的な変動というブラウン運動の本質を用いて測定用フォーカス位置を判断していることになる。
その結果、本発明によれば、ピントの合うフォーカス位置に高い成功確率で合わせることができ、フォーカスを合わす手間を大幅に削減することが可能となる。
このことに鑑みれば、本発明に係る粒子径分布測定装置は、複数のフォーカス位置それぞれに対応する評価パラメータの変動値に基づいて測定用フォーカス位置を判断しており、言い換えれば、時間的な変動というブラウン運動の本質を用いて測定用フォーカス位置を判断していることになる。
その結果、本発明によれば、ピントの合うフォーカス位置に高い成功確率で合わせることができ、フォーカスを合わす手間を大幅に削減することが可能となる。
ところで、粒子のブラウン運動は本質的に不連続な運動であるから、フォーカスの合わないフォーカス位置においても、変動値が偶発的に小さくなることが考えられる。
そこで、このようなフォーカス位置が測定用フォーカス位置として判断されてしまうことを防ぐためには、前記フォーカス位置判断部が、前記変動値が閾値を下回る複数のフォーカス位置を含む安定範囲の中から前記測定用フォーカス位置を定めることが好ましい。
そこで、このようなフォーカス位置が測定用フォーカス位置として判断されてしまうことを防ぐためには、前記フォーカス位置判断部が、前記変動値が閾値を下回る複数のフォーカス位置を含む安定範囲の中から前記測定用フォーカス位置を定めることが好ましい。
測定用フォーカス位置をフォーカスの合う位置により近づけるためには、前記フォーカス位置判断部が、前記安定範囲において前記変動値が最小となるフォーカス位置、又は、前記前記安定範囲の中央部のフォーカス位置を前記測定用フォーカス位置として判断することが好ましい。
前記評価パラメータを値が時間的に変動するものとするためには、前記撮像データの示す画像のコントラスト、該画像に写る粒子数、該画像を構成する各ピクセルの強度、又は、該画像に含まれる所定強度を上回るピクセルの数であることが好ましい。
前記変動値が、前記評価パラメータの時間変動の度合いを示す値であることで、時間的な変動というブラウン運動の本質を用いて測定用フォーカス位置を判断することができる。
ここで、一方の軸を評価パラメータの値とし、他方の軸を頻度とした分布グラフが、例えば値の大きい側に広いテールを引いており、外れ値が発生しやすい分布であった場合、変動値を算出するには、外れ値をカットするか、外れ値があることを前提に算出するかの2通りが考えられる。しかしながら、外れ値をカットする外れ値処理は、サンプルによって大きく状況が異なり、プログラムの煩雑化を招来し得る。
そこで、前記変動値算出部が、一方の軸を前記評価パラメータの値とし、他方の軸を頻度とした分布グラフに所定関数をフィッティングして前記変動値を算出することが好ましい。
このような構成であれば、上述した分布が外れ値の発生しやすい分布であったとしても、煩雑になり得る外れ値処理を用いることなく、尤もらしい変動値を算出することが可能となる。
そこで、前記変動値算出部が、一方の軸を前記評価パラメータの値とし、他方の軸を頻度とした分布グラフに所定関数をフィッティングして前記変動値を算出することが好ましい。
このような構成であれば、上述した分布が外れ値の発生しやすい分布であったとしても、煩雑になり得る外れ値処理を用いることなく、尤もらしい変動値を算出することが可能となる。
前記変動値算出部が、前記セルの奥行方向の一部に設定された探索領域に含まれる前記フォーカス位置に対応する前記分布グラフに前記所定関数をフィッティングすることが好ましい。
このような構成であれば、セルの奥行方向の全領域に亘りフォーカス位置を移動させずに済み、フォーカス位置をより短時間で調整することができる。
このような構成であれば、セルの奥行方向の全領域に亘りフォーカス位置を移動させずに済み、フォーカス位置をより短時間で調整することができる。
ところで、PTA法による測定では、粒子径分布の測定後、セル内の粒子を攪拌したり、或いは、撮像する位置を変更したりして、再び粒子径分布を測定するといった作業を繰り返すことで、測定回数を増やして測定精度の向上を図る場合がある。
この場合、現状では、撹拌後はフォーカスが大きく外れていないと考え、撹拌前のフォーカス位置を変えずに測定を続けているが、測定精度のさらなる向上を図るには、撹拌後もフォーカス位置を再調整することが好ましい。
とはいえ、撹拌する度にフォーカスを手動で合わせるのでは、時間や手間が膨大にかかってしまう。
この場合、現状では、撹拌後はフォーカスが大きく外れていないと考え、撹拌前のフォーカス位置を変えずに測定を続けているが、測定精度のさらなる向上を図るには、撹拌後もフォーカス位置を再調整することが好ましい。
とはいえ、撹拌する度にフォーカスを手動で合わせるのでは、時間や手間が膨大にかかってしまう。
そこで、前記粒子径分布測定装置が、前記セル内の粒子を攪拌させる攪拌手段をさらに備える構成であれば、本発明の作用効果がより顕著に発揮され、短時間で手間をかけずに測定精度のさらなる向上を図れる。
前記撮像手段のフォーカスを前記測定用フォーカス位置に合わせるフォーカス調整部を備えることが好ましい。
このような構成であれば、測定用フォーカス位置に自動的にフォーカスを合わせるオートフォーカス機能を発揮させることができる。
このような構成であれば、測定用フォーカス位置に自動的にフォーカスを合わせるオートフォーカス機能を発揮させることができる。
上述した撹拌手段及びフォーカス調整部を備える構成において、測定の自動化を図るためには、前記フォーカス調整部による前記撮像手段のフォーカスの位置合わせと、前記分析部による前記粒子径分布の算出と、前記撹拌手段による前記セル内の粒子の撹拌とが繰り返されることが好ましい。
本発明に係る粒子径分布測定方法は、セル内の粒子を撮像する撮像手段と、前記撮像手段により得られる撮像データに基づいて、粒子のブラウン運動による拡散速度を算出することにより粒子径分布を算出する分析部と、を備える粒子径分布測定装置を用いた粒子径分布測定方法であって、前記撮像手段により得られる複数の撮像データからなる撮像データ群を、前記セル内における複数のフォーカス位置それぞれにおいて取得するデータ群取得ステップと、前記撮像データ群を構成する複数の撮像データそれぞれから得られる所定の評価パラメータの変動値を算出する変動値算出ステップと、前記複数のフォーカス位置それぞれに対応する前記変動値に基づいて、測定時に用いる測定用フォーカス位置を判断するフォーカス位置判断ステップと、を備えることを特徴とする方法である。
本発明に係る粒子径分布測定用プログラムは、セル内の粒子を撮像する撮像手段と、前記撮像手段により得られる撮像データに基づいて、粒子のブラウン運動による拡散速度を算出することにより粒子径分布を算出する分析部と、を備える粒子径分布測定装置に用いられるプログラムであって、前記撮像手段により得られる複数の撮像データからなる撮像データ群を、前記セル内における複数のフォーカス位置それぞれにおいて取得するデータ群取得部と、前記撮像データ群を構成する複数の撮像データそれぞれから得られる所定の評価パラメータの変動値を算出する変動値算出部と、前記複数のフォーカス位置それぞれに対応する前記変動値に基づいて、測定時に用いる測定用フォーカス位置を判断するフォーカス位置判断部と、としての機能をコンピュータに発揮させることを特徴とするものである。
このような粒子径分布測定方法及び粒子径分布測定用プログラムであれば、上述した粒子径分布測定装置と同様の作用効果が得られる。
以上に述べた本発明によれば、PTA法による粒子径分布測定において、フォーカス位置を高い成功確率で合わせることが可能となり、フォーカス調整の手間を大幅に削減することができる。
以下、本発明に係る粒子径分布測定装置の一実施形態について、図面を参照しながら説明する。
<装置構成>
本実施形態における粒子径分布測定装置100は、図1に示すように、セル1内の粒子に励起波長の光を照射する光照射部2と、セル1内の粒子による散乱光を検出することで粒子を撮像する撮像手段3と、撮像手段3により得られた撮像データを解析する情報処理装置4とを備える。
本実施形態における粒子径分布測定装置100は、図1に示すように、セル1内の粒子に励起波長の光を照射する光照射部2と、セル1内の粒子による散乱光を検出することで粒子を撮像する撮像手段3と、撮像手段3により得られた撮像データを解析する情報処理装置4とを備える。
光照射部2は、異なる励起波長の光を照射する複数の光源21、22、23を有している。光源21、22、23は、例えばレーザー光源である。ここで、粒子による散乱光を検出して粒子を撮像する場合、粒子径に応じて適した励起波長の光を照射する必要がある。本実施形態では、様々な粒子径の粒子対応するために、3つの光源21、22、23を有している。なお、1つの光源において3つの励起波長を含む光を照射するものであっても良い。また、光源の数は3つ以上であっても良いし、1つであっても良い。
第1の光源21は、所定の第1の励起波λ1の光を照射するものであり、第2の光源22は、所定の第2の励起波長λ2の光を照射するものであり、第3の光源23は、所定の第3の励起波長λ3の光を照射するものである。また、これら各光源21、22、23から射出された光は、反射ミラー241、242、ハーフミラー243、244、集光レンズ245等の照射光学系24を介して、セル1に導光される。
これらの光源21、22、23は、図示しない制御部によって、各励起波長λ1、λ2、λ3の光を同時に照射するように制御されている。なお、これらの光源21、22、23は、個別に光を照射するように制御することもできる。
撮像手段3は、セル1内の粒子による散乱光を検出することで粒子を撮像するものであり、本実施形態では、例えばCCDカメラ等の撮像カメラであり、撮像データとして例えば画像データを出力する。なお、図1では、光照射部2の光照射方向と撮像手段3の撮像方向とが互いに直交して設けられているが、これに限られない。
情報処理装置4は、CPU、メモリ、ディスプレイ、各種入出力機器等を備えたコンピュータであり、撮像手段3と有線又は無線でつながれている。
この情報処理装置4は、前記メモリに格納されている粒子径分布測定用プログラムが実行されることにより、図2に示すように、少なくとも分析部41としての機能を発揮する。
分析部41は、撮像手段3から撮像データを取得するとともに、この撮像データに基づいてPTA法により粒子径分布を算出するものであり、より具体的には、撮像データに基づいて、粒子のブラウン運動による拡散速度を算出することにより粒子径分布を算出する。
然して、本実施形態の粒子径分布測定装置100は、上述した撮像手段3のフォーカスをセル1内の粒子に自動で合わせるオートフォーカス機能を備えてなる。
具体的には、上述した情報処理装置4が、図2に示すように、フォーカス調整部42、データ群取得部43、変動値算出部44、及び、フォーカス位置判断部45としての機能を発揮するように構成されている。
以下、これらの機能の説明をしつつ、図3に示すフローチャートを参照しながら情報処理装置4の動作を説明する。
フォーカス調整部42は、撮像手段3のフォーカスをセル1内における複数のフォーカス位置に移動させるものであり、具体的には撮像手段3のフォーカスを所定の規則に従ってセル1に対して進退移動させるように構成されている。
本実施形態のフォーカス調整部42は、撮像手段3のフォーカスをセル1の手前側から奥側に、又は、奥側から手前側に所定距離ずつ移動させるように構成されている(図3のS1)。なお、フォーカス調整部42としては、撮像手段3のフォーカスを、セル1の奥行方向の全領域に亘り移動させるものであっても良いが、ここでは奥行方向の一部の領域(以下、探索領域という)にのみ移動させるように構成されている。なお、この探索領域は、装置の生産時などに予め設定された不変の範囲であっても良いし、ユーザにより変更可能な範囲であっても良いし、セル内の溶媒などの測定条件に応じて自動的に変更される範囲であっても良い。
データ群取得部43は、撮像手段3により得られる複数の撮像データからなる撮像データ群を、セル1内における複数のフォーカス位置それぞれにおいて取得するものである。
より具体的に説明すると、撮像手段3のフォーカスがフォーカス調整部42により移動されると、その移動先のフォーカス位置それぞれにおいて撮像手段3によりセル1内が複数回撮像され、それら複数の撮像データからなる撮像データ群をデータ群取得部43が取得する(図3のS2)。
ただし、それぞれフォーカス位置でセル1内を必ずしも複数回撮像する必要はなく、それぞれのフォーカス位置でセル1内を1回撮像するとともに、それぞれのフォーカス位置を複数回移動させることにより、複数のフォーカス位置それぞれにおける撮像データ群をデータ群取得部43が取得しても良い。
なお、撮像データ群に含まれる撮像データのデータ数は特に限られるものではないが、少なすぎるとオートフォーカス機能の成功確率が低下し得るし、多すぎるとオートフォーカスにかかる時間が長くなるので、例えば数十~数百程度であることが望ましい。
ここで、ある撮像データ群に含まれる複数の撮像データは、同じフォーカス位置においてセル1内を撮像したものであるが、撮像したタイミング(時刻)が異なっており、粒子がブラウン運動していることから、各撮像データの示す画像には差が現れる。
具体的には、各撮像データの示す画像のコントラスト、その画像に写る粒子数、その画像を構成する各ピクセルの強度、又は、その画像に含まれる所定強度を上回るピクセルの数など、各撮像データから取得可能な種々のパラメータ(以下、評価パラメータともいう。)は、各撮像データの撮像タイミングの違いによる差が生じる。
そこで、変動値算出部44は、撮像データ群を構成する複数の撮像データそれぞれから得られる所定の評価パラメータの変動値を算出する(図3のS3)。
この評価パラメータは、撮像データから取得可能なパラメータであって、その値が時間変動する、言い換えれば、撮像データの撮像タイミングに応じて変動するものであり、その時間変動の度合い、言い換えれば、評価パラメータの値のばらつきを示すものが変動値である。
また、この評価パラメータの時間的な変化の度合い、すなわち評価パメータのばらつきは、ピントの合わないフォーカス位置では大きくなり、ピントの合うフォーカス位置では小さくなるはずである。
このような評価パラメータとしては、上述した通り、種々のものを挙げることができるが、この実施形態では、評価パラメータとして、撮像データの示す画像のRMSコントラスト(Root mean square contrast)等のコントラストを取り上げて説明する。
また、変動値としては、評価パラメータの値のばらつきの指標になるものであれば良く、例えば標準偏差、分散、又は、残差平方和などを挙げることができ、この実施形態では、変動値として評価パラメータの分布の幅(以下、分布幅ともいう)を取り上げて説明する。
つまり、本実施形態の変動値算出部44は、撮像データ群を構成する複数の撮像データそれぞれを画像処理又は画像解析することで、それらの撮像データそれぞれから画像のコントラストを評価パラメータとして取得し、それらのコントラストの分布幅を変動値として算出する。
なお、変動値算出部44により取得されるコントラストは、撮像データの示す画像全体のコントラストであっても良いし、その画像において予め定められている一部の領域のコントラストであっても良い。
ここで、図4に示すグラフは、横軸をフォーカス位置とし、縦軸を評価パラメータの値としたグラフに、複数枚の撮像データそれぞれから取得される評価パラメータたるコントラストをプロットしたものである。このグラフからも分かるように、ある撮像データ群に含まれる複数の撮像データそれぞれから取得される評価パラメータの値は、多少なりともばらつきがある。
このことから、ある撮像データ群に含まれる複数の撮像データそれぞれから取得される評価パラメータの値を、図5に示すような一方の軸を評価パラメータの値とし、他方の軸を頻度としたグラフにプロットした場合に、広がりのある分布グラフが得られる。
そこで、本実施形態の変動値算出部44は、上述した分布グラフに所定関数をフィッティングして変動値を算出するように構成されている。
より具体的に説明すると、所定関数としては、例えばGumble分布やFrechet分布などの確率密度分布を表す式を挙げることができ、変動値算出部44は、これらの関数を分布グラフにフィッティングするとともに、そのフィッティング後の関数に含まれるパラメータから分布幅を得る。
変動値算出部44としては、上述した探索領域において得られた全ての撮像データ群に対応する分布グラフ、言い換えれば、探索領域における撮像手段3のフォーカスの移動先である全てのフォーカス位置に対応する分布グラフに所定関数をフィッティングしても良いし、一部のフォーカス位置に対応する分布グラフのみに所定関数をフィッティングしても良い。
そして、変動値算出部44は、フィッティング後に得られる変動値(分布幅)それぞれと閾値とを比較して、変動値が閾値を下回る複数のフォーカス位置を含む範囲(以下、安定範囲という)を特定する(図4参照)。
フォーカス位置判断部45は、複数のフォーカス位置それぞれに対応する変動値に基づいて、測定時に用いる測定用フォーカス位置を判断するものである(図3のS4)。
このフォーカス位置判断部45は、上述した安定範囲の中から測定用フォーカス位置を定めるものであり、ここでは安定範囲に含まれるフォーカス位置の1つを測定用フォーカス位置とする。なお、安定範囲に含まれる複数のフォーカス位置を測定用フォーカス位置として定め、これらのフォーカス位置を選択可能に出力するように構成されていても良い。
ここでのフォーカス位置判断部45は、安定範囲において変動値が最小となるフォーカス位置、又は、安定範囲の中央部のフォーカス位置を測定用フォーカス位置として判断する。なお、安定範囲の中央部とは、安定範囲の中央そのものであっても良いし、中央から変動値が最小となるフォーカス位置側に偏った位置(重心位置)であっても良い。
そして、フォーカス位置判断部45により判断された測定用フォーカス位置は、上述したフォーカス調整部42に出力されて、フォーカス調整部42が、撮像手段3のフォーカスを粒子径分布の測定前に測定用フォーカス位置に合わせ(図3のS5)、その後、分析部41による粒子径分布の算出が行われる(図3のS6)。
<本実施形態の効果>
このように構成された本実施形態の粒子径分布測定装置100によれば、複数のフォーカス位置それぞれに対応する評価パラメータの変動値に基づいて測定用フォーカス位置を判断しており、言い換えれば、時間的な変動というブラウン運動の本質を用いて測定用フォーカス位置を判断しているので、ピントの合うフォーカス位置を高い成功確率で自動的に合わせることができ、フォーカスを合わす手間を大幅に削減することが可能となる。
このように構成された本実施形態の粒子径分布測定装置100によれば、複数のフォーカス位置それぞれに対応する評価パラメータの変動値に基づいて測定用フォーカス位置を判断しており、言い換えれば、時間的な変動というブラウン運動の本質を用いて測定用フォーカス位置を判断しているので、ピントの合うフォーカス位置を高い成功確率で自動的に合わせることができ、フォーカスを合わす手間を大幅に削減することが可能となる。
また、評価パラメータとして、撮像データの示す画像のコントラストを用いており、変動値として標準偏差を用いているので、複雑な演算処理を用いることなく変動値を算出することができる。
ところで、粒子のブラウン運動は本質的に不連続な運動であるから、フォーカスの合わないフォーカス位置においても、変動値が偶発的に小さくなることが考えられる。
これに対して、本実施形態では、フォーカス位置判断部45が、安定範囲の中から測定用フォーカス位置を定めるので、変動値が偶発的に小さくなるフォーカス位置を測定用フォーカス位置として判断してしまうことを防ぐことができる。
これに対して、本実施形態では、フォーカス位置判断部45が、安定範囲の中から測定用フォーカス位置を定めるので、変動値が偶発的に小さくなるフォーカス位置を測定用フォーカス位置として判断してしまうことを防ぐことができる。
さらに、フォーカス位置判断部45が、安定範囲において変動値が最小となるフォーカス位置、又は、前記安定範囲の中央部のフォーカス位置を測定用フォーカス位置として判断するので、測定用フォーカス位置をフォーカスの合う位置により近づけることができる。
そのうえ、変動値算出部44が、一方の軸を評価パラメータの値とし、他方の軸を頻度とした分布グラフに所定関数をフィッティングして変動値を算出するので、外れ値の発生しやすい分布であったとしても、外れ値処理を用いることなく、尤もらしい変動値を算出することが可能となる。
加えて、変動値算出部44が、探索領域に含まれるフォーカス位置に対応する分布グラフに所定関数をフィッティングするので、セル1の奥行方向の全体に亘りフォーカス位置を移動させずに済み、フォーカス位置をより短時間で調整することができる。
<その他の実施形態>
なお、本発明は前記実施形態に限られるものではない。
なお、本発明は前記実施形態に限られるものではない。
例えば、粒子径分布測定装置100としては、図6に示すように、セル1内の粒子を攪拌させる攪拌手段5をさらに備えていても良い。
この場合、情報処理装置4としては、図7に示すように、オートフォーカス機能による撮像手段3のフォーカスの位置調整(T1)と、分析部41による粒子径分布の算出(T2)と、撹拌手段7によるセル1内の粒子の撹拌(T3)とのそれぞれを複数回繰り返す制御部を備えていても良い。
このような構成であれば、PTA法による測定において、測定回数を増やすことができる(すなわち、測定対象粒子数を増やすことができる)うえ、撹拌の度に撮像手段3のフォーカスを自動で合わせることができ、短時間で手間をかけずに測定精度のさらなる向上を図れる。
このような構成であれば、PTA法による測定において、測定回数を増やすことができる(すなわち、測定対象粒子数を増やすことができる)うえ、撹拌の度に撮像手段3のフォーカスを自動で合わせることができ、短時間で手間をかけずに測定精度のさらなる向上を図れる。
また、評価パラメータは、コントラストに限らず、撮像データの示す画像に写る粒子数、又は、その画像を構成する各ピクセルの強度などであっても良い。
変動値は、標準偏差に限らず、分散、又は、残差平方和などであっても良い。
また、粒子径分布測定装置100としては、例えばオートフォーカス動作の完了後などにフォーカス位置を微調整できるようにするべく、撮像手段3のフォーカスを手動で変更できるように構成されていても良い。
この場合の実施態様としては、例えばディスプレイ等にフォーカス位置変更ボタンを表示しておき、このボタンを操作することにより、撮像手段3のフォーカスを手動で変更できるようになる態様を挙げることができる。
この場合の実施態様としては、例えばディスプレイ等にフォーカス位置変更ボタンを表示しておき、このボタンを操作することにより、撮像手段3のフォーカスを手動で変更できるようになる態様を挙げることができる。
さらに、本発明に係る粒子径分布測定装置100としては、必ずしもフォーカス調整部42によるオートフォーカス機能を必ずしも備えている必要はなく、フォーカス位置判断部45が判断した測定用フォーカス位置に、作業者が手動でフォーカスを合わせるようにしても良い。
その他、本発明は前記実施形態に限られず、その趣旨を逸脱しない範囲で種々の変形が可能であるのは言うまでもない。
上記した本発明によれば、PTA法による粒子径分布測定において、フォーカス位置を高い成功確率で自動的に合わせることができるようになる。
100・・・粒子径分布測定装置
1 ・・・セル
2 ・・・光照射部
3 ・・・撮像手段
4 ・・・情報処理装置
41 ・・・分析部
42 ・・・フォーカス調整部
43 ・・・データ群取得部
44 ・・・変動値算出部
45 ・・・フォーカス位置判断部
1 ・・・セル
2 ・・・光照射部
3 ・・・撮像手段
4 ・・・情報処理装置
41 ・・・分析部
42 ・・・フォーカス調整部
43 ・・・データ群取得部
44 ・・・変動値算出部
45 ・・・フォーカス位置判断部
Claims (12)
- セル内の粒子を撮像する撮像手段と、前記撮像手段により得られる撮像データに基づいて、粒子のブラウン運動による拡散速度を算出することにより粒子径分布を算出する分析部と、を備える粒子径分布測定装置であって、
前記撮像手段により得られる複数の撮像データからなる撮像データ群を、前記セル内における複数のフォーカス位置それぞれにおいて取得するデータ群取得部と、
前記撮像データ群を構成する複数の撮像データそれぞれから得られる所定の評価パラメータの変動値を算出する変動値算出部と、
前記複数のフォーカス位置それぞれに対応する前記変動値に基づいて、測定時に用いる測定用フォーカス位置を判断するフォーカス位置判断部と、を備えることを特徴とする粒子径分布測定装置。 - 前記フォーカス位置判断部が、前記変動値が閾値を下回る複数のフォーカス位置を含む安定範囲の中から前記測定用フォーカス位置を定める、請求項1記載の粒子径分布測定装置。
- 前記フォーカス位置判断部が、前記安定範囲において前記変動値が最小となるフォーカス位置、又は、前記前記安定範囲の中央部のフォーカス位置を前記測定用フォーカス位置として判断する、請求項2記載の粒子径分布測定装置。
- 前記評価パラメータが、前記撮像データの示す画像のコントラスト、該画像に写る粒子数、該画像を構成する各ピクセルの強度、又は、該画像に含まれる所定強度を上回るピクセルの数である、請求項1乃至3のうち何れか一項に記載の粒子径分布測定装置。
- 前記変動値が、前記評価パラメータの時間変動の度合いを示す値である、請求項1記載の粒子径分布測定装置。
- 前記変動値算出部が、一方の軸を前記評価パラメータの値とし、他方の軸を頻度とした分布グラフに所定関数をフィッティングして前記変動値を算出する、請求項1乃至5のうち何れか一項に記載の粒子径分布測定装置。
- 前記変動値算出部が、前記セルの奥行方向の一部に設定された探索領域に含まれる前記フォーカス位置に対応する前記分布グラフに前記所定関数をフィッティングする、請求項6記載の粒子径分布測定装置。
- 前記セル内の粒子を攪拌させる攪拌手段をさらに備える、請求項1乃至7のうち何れか一項に記載の粒子径分布測定装置。
- 前記撮像手段のフォーカスを前記測定用フォーカス位置に合わせるフォーカス調整部を備える、請求項1乃至8のうち何れか一項に記載の粒子径分布測定装置。
- 前記フォーカス調整部による前記撮像手段のフォーカスの位置合わせと、前記分析部による前記粒子径分布の算出と、前記撹拌手段による前記セル内の粒子の撹拌とが繰り返される、請求項8を引用する請求項9に記載の粒子径分布測定装置。
- セル内の粒子を撮像する撮像手段と、前記撮像手段により得られる撮像データに基づいて、粒子のブラウン運動による拡散速度を算出することにより粒子径分布を算出する分析部と、を備える粒子径分布測定装置を用いた粒子径分布測定方法であって、
前記撮像手段により得られる複数の撮像データからなる撮像データ群を、前記セル内における複数のフォーカス位置それぞれにおいて取得するデータ群取得ステップと、
前記撮像データ群を構成する複数の撮像データそれぞれから得られる所定の評価パラメータの変動値を算出する変動値算出ステップと、
前記複数のフォーカス位置それぞれに対応する前記変動値に基づいて、測定時に用いる測定用フォーカス位置を判断するフォーカス位置判断ステップと、を備えることを特徴とする粒子径分布測定方法。 - セル内の粒子を撮像する撮像手段と、前記撮像手段により得られる撮像データに基づいて、粒子のブラウン運動による拡散速度を算出することにより粒子径分布を算出する分析部と、を備える粒子径分布測定装置に用いられるプログラムであって、
前記撮像手段により得られる複数の撮像データからなる撮像データ群を、前記セル内における複数のフォーカス位置それぞれにおいて取得するデータ群取得部と、
前記撮像データ群を構成する複数の撮像データそれぞれから得られる所定の評価パラメータの変動値を算出する変動値算出部と、
前記複数のフォーカス位置それぞれに対応する前記変動値に基づいて、測定時に用いる測定用フォーカス位置を判断するフォーカス位置判断部と、としての機能をコンピュータに発揮させることを特徴とする粒子径分布測定用プログラム。
Priority Applications (1)
| Application Number | Priority Date | Filing Date | Title |
|---|---|---|---|
| JP2024576234A JPWO2024166705A1 (ja) | 2023-02-10 | 2024-01-25 |
Applications Claiming Priority (2)
| Application Number | Priority Date | Filing Date | Title |
|---|---|---|---|
| JP2023018935 | 2023-02-10 | ||
| JP2023-018935 | 2023-02-10 |
Publications (1)
| Publication Number | Publication Date |
|---|---|
| WO2024166705A1 true WO2024166705A1 (ja) | 2024-08-15 |
Family
ID=92262383
Family Applications (1)
| Application Number | Title | Priority Date | Filing Date |
|---|---|---|---|
| PCT/JP2024/002288 Ceased WO2024166705A1 (ja) | 2023-02-10 | 2024-01-25 | 粒子径分布測定装置、粒子径分布測定方法、及び、粒子径分布測定用プログラム |
Country Status (2)
| Country | Link |
|---|---|
| JP (1) | JPWO2024166705A1 (ja) |
| WO (1) | WO2024166705A1 (ja) |
Cited By (1)
| Publication number | Priority date | Publication date | Assignee | Title |
|---|---|---|---|---|
| CN119941779A (zh) * | 2025-04-08 | 2025-05-06 | 深圳北理莫斯科大学 | 基于图像识别的运动颗粒的位置和取向角度同时追踪的方法 |
Citations (3)
| Publication number | Priority date | Publication date | Assignee | Title |
|---|---|---|---|---|
| KR20170089232A (ko) * | 2016-01-26 | 2017-08-03 | 윈포시스(주) | 입자 분석 장치 및 그 방법 |
| WO2021090574A1 (ja) * | 2019-11-06 | 2021-05-14 | ソニー株式会社 | 位置調整方法、微小粒子分析装置、及びプログラム |
| WO2022163230A1 (ja) * | 2021-01-26 | 2022-08-04 | 株式会社堀場製作所 | 粒子径推定方法、学習モデル生成方法、粒子径推定装置、及びコンピュータプログラム |
-
2024
- 2024-01-25 WO PCT/JP2024/002288 patent/WO2024166705A1/ja not_active Ceased
- 2024-01-25 JP JP2024576234A patent/JPWO2024166705A1/ja active Pending
Patent Citations (3)
| Publication number | Priority date | Publication date | Assignee | Title |
|---|---|---|---|---|
| KR20170089232A (ko) * | 2016-01-26 | 2017-08-03 | 윈포시스(주) | 입자 분석 장치 및 그 방법 |
| WO2021090574A1 (ja) * | 2019-11-06 | 2021-05-14 | ソニー株式会社 | 位置調整方法、微小粒子分析装置、及びプログラム |
| WO2022163230A1 (ja) * | 2021-01-26 | 2022-08-04 | 株式会社堀場製作所 | 粒子径推定方法、学習モデル生成方法、粒子径推定装置、及びコンピュータプログラム |
Cited By (1)
| Publication number | Priority date | Publication date | Assignee | Title |
|---|---|---|---|---|
| CN119941779A (zh) * | 2025-04-08 | 2025-05-06 | 深圳北理莫斯科大学 | 基于图像识别的运动颗粒的位置和取向角度同时追踪的方法 |
Also Published As
| Publication number | Publication date |
|---|---|
| JPWO2024166705A1 (ja) | 2024-08-15 |
Similar Documents
| Publication | Publication Date | Title |
|---|---|---|
| JP6761312B2 (ja) | 可変焦点距離レンズを含む撮像システムにおける色収差補正 | |
| CN107884903B (zh) | 具有聚焦监测和控制的可变焦距透镜系统 | |
| US7436590B2 (en) | Scanning laser microscope apparatus and light-amount detection unit | |
| US20210215923A1 (en) | Microscope system | |
| US8928881B2 (en) | Cytometer with automatic continuous alignment correction | |
| EP3462236B1 (en) | Variable focal length lens system with optical power monitoring | |
| US11119382B2 (en) | Tunable acoustic gradient lens system with amplitude adjustment corresponding to z-height as indicated by calibration data | |
| JP2017021025A (ja) | 倍率調整可能光学システムにおける可変焦点距離レンズの適応的な動作周波数の調整方法 | |
| US10120163B2 (en) | Auto-focus method for a coordinate-measuring apparatus | |
| US10534164B2 (en) | Digital microscope and focusing method thereof | |
| JP2018039028A (ja) | レーザ加工機、及びレーザ加工方法 | |
| US20170168282A1 (en) | Focusing system for a telecentric optical measuring machine | |
| JP5757458B2 (ja) | 顕微鏡システム、サーバー及びプログラム | |
| US11874224B2 (en) | Sample observation device and sample observation method | |
| US20210190999A1 (en) | Tunable acoustic gradient lens system utilizing amplitude adjustments for acquiring images focused at different z-heights | |
| US10379335B2 (en) | Illumination setting method, light sheet microscope apparatus, and recording medium | |
| KR20200119200A (ko) | 입자 사이즈 측정 장치 및 측정 방법 | |
| CN106773495A (zh) | 多光源投影仪的自动调焦方法与系统 | |
| WO2024166705A1 (ja) | 粒子径分布測定装置、粒子径分布測定方法、及び、粒子径分布測定用プログラム | |
| JP2020173244A (ja) | 粒子サイズ測定装置および測定方法 | |
| JP6312410B2 (ja) | アライメント装置、顕微鏡システム、アライメント方法、及びアライメントプログラム | |
| WO2010032567A1 (ja) | 共焦点顕微鏡を用いた試料測定装置とその測定方法 | |
| JP2002062251A (ja) | フロー式粒子画像解析方法及び装置 | |
| JP2012181341A (ja) | 顕微鏡装置 | |
| JP2021089171A (ja) | 高さ測定方法および高さ測定装置 |
Legal Events
| Date | Code | Title | Description |
|---|---|---|---|
| 121 | Ep: the epo has been informed by wipo that ep was designated in this application |
Ref document number: 24753149 Country of ref document: EP Kind code of ref document: A1 |
|
| WWE | Wipo information: entry into national phase |
Ref document number: 2024576234 Country of ref document: JP |
|
| NENP | Non-entry into the national phase |
Ref country code: DE |
|
| 122 | Ep: pct application non-entry in european phase |
Ref document number: 24753149 Country of ref document: EP Kind code of ref document: A1 |