WO2024043229A1 - 熱分析装置及び熱分析装置用制御ソフトウェア - Google Patents
熱分析装置及び熱分析装置用制御ソフトウェア Download PDFInfo
- Publication number
- WO2024043229A1 WO2024043229A1 PCT/JP2023/030116 JP2023030116W WO2024043229A1 WO 2024043229 A1 WO2024043229 A1 WO 2024043229A1 JP 2023030116 W JP2023030116 W JP 2023030116W WO 2024043229 A1 WO2024043229 A1 WO 2024043229A1
- Authority
- WO
- WIPO (PCT)
- Prior art keywords
- sample
- thermal analysis
- temperature
- color information
- data
- Prior art date
- Legal status (The legal status is an assumption and is not a legal conclusion. Google has not performed a legal analysis and makes no representation as to the accuracy of the status listed.)
- Ceased
Links
Images






Classifications
-
- G—PHYSICS
- G01—MEASURING; TESTING
- G01N—INVESTIGATING OR ANALYSING MATERIALS BY DETERMINING THEIR CHEMICAL OR PHYSICAL PROPERTIES
- G01N25/00—Investigating or analyzing materials by the use of thermal means
- G01N25/20—Investigating or analyzing materials by the use of thermal means by investigating the development of heat, i.e. calorimetry, e.g. by measuring specific heat, by measuring thermal conductivity
-
- G—PHYSICS
- G01—MEASURING; TESTING
- G01N—INVESTIGATING OR ANALYSING MATERIALS BY DETERMINING THEIR CHEMICAL OR PHYSICAL PROPERTIES
- G01N21/00—Investigating or analysing materials by the use of optical means, i.e. using sub-millimetre waves, infrared, visible or ultraviolet light
- G01N21/17—Systems in which incident light is modified in accordance with the properties of the material investigated
- G01N21/25—Colour; Spectral properties, i.e. comparison of effect of material on the light at two or more different wavelengths or wavelength bands
- G01N21/27—Colour; Spectral properties, i.e. comparison of effect of material on the light at two or more different wavelengths or wavelength bands using photo-electric detection ; circuits for computing concentration
-
- G—PHYSICS
- G01—MEASURING; TESTING
- G01N—INVESTIGATING OR ANALYSING MATERIALS BY DETERMINING THEIR CHEMICAL OR PHYSICAL PROPERTIES
- G01N25/00—Investigating or analyzing materials by the use of thermal means
Definitions
- the present invention relates to a thermal analysis device, particularly a sample observation type thermal analysis device and its control software.
- Thermal analysis is defined as "a set of techniques that measure certain physical properties of a material (including its reaction products) as a function of temperature or time while the temperature of the material is varied according to a fixed program.”
- Thermal analysis includes thermogravimetry (TG), which measures the change in mass of a sample while changing its temperature by heating or cooling the sample, differential thermal analysis (DTA), which measures the temperature difference between the sample and a reference material, and
- TG thermogravimetry
- DTA differential thermal analysis
- DSC differential scanning calorimetry
- TMA thermomechanical analysis
- Patent Document 1 discloses that in a thermal analysis device that measures the thermal behavior of a sample in a heating furnace as the temperature changes, an opening is provided in the heating furnace in order to observe the sample, and an opening is provided through the opening.
- a device is disclosed that is provided with an imaging means for capturing image data of the sample.
- This thermal analysis device displays color information generated from the image data superimposed on the temperature along with the thermal behavior accompanying temperature changes of the sample. Specifically, a graph of TG data and a graph of each value of R, G, and B are displayed in a superimposed manner, with temperature as the horizontal axis.
- One object of the present invention is to provide a thermal analysis device and a thermal analysis device capable of easily analyzing changes in the state of a sample in detail while visually grasping the color of the sample and its changes in detail as the sample temperature changes.
- the goal is to provide control software.
- thermal analysis apparatus comprising: thermal analysis graph display means for displaying a graph relating to temperature or time of the thermal analysis data on a display device; sample image display means for displaying an image of the sample of the image data on the display device; Color information generation means for generating color information data in a selected range and type from a sample image; and gradation display means for displaying on the display device a gradation in which colors generated from the color information data are arranged in correspondence with temperature or time. It is characterized by having the following.
- the thermal analysis apparatus of the present invention further includes a color information graph display means for displaying a graph related to temperature or time of the color information data on the display device, arranging the graph related to temperature or time of the thermal analysis data without superimposing the graph. You may prepare.
- the color information generation means may be capable of selecting a plurality of ranges for generating color information data from the sample image.
- the gradation display means causes the display device to display a gradation in which colors generated from the color information data are arranged in correspondence with temperature or time, as a band-shaped color bar. Good too.
- Another aspect of the present invention is to obtain thermal analysis data by measuring and calculating the physical properties of the sample while changing the temperature of the sample by heating or cooling, and to obtain image data by photographing the sample.
- a computer that controls a thermal analysis device is used as a thermal analysis graph display means for displaying a graph regarding the temperature or time of the thermal analysis on a display device, and as a sample image display means for displaying a sample image of the image data on the display device.
- a color information generation means for generating color information data of a selected range and type from the sample image, and displaying on the display device a gradation in which colors generated from the color information data are arranged in correspondence with temperature or time.
- This is control software for a thermal analyzer, which is characterized in that it functions as a gradation display means.
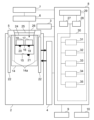
- FIG. 1 is an explanatory diagram showing the overall configuration of a thermal analysis device that is one embodiment of the present invention.
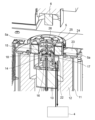
- 1 is a cutaway perspective view showing a structure around a heating furnace of a thermal analysis apparatus according to an embodiment of the present invention. Note that, in this figure, hatching that should be added to the cross-sectional portion is partially omitted.
- FIG. 1 is a block diagram showing a control/processing system of a thermal analysis device that is an embodiment of the present invention.
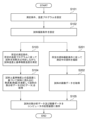
- FIG. 2 is a diagram showing an example of a flowchart for acquiring thermal analysis data and image data of a sample using a thermal analysis device according to an embodiment of the present invention.
- FIG. 2 is a diagram showing an example of a flowchart for displaying thermal analysis data, image data, etc. in a graph or the like using a thermal analysis apparatus according to an embodiment of the present invention.
- 1 is a diagram showing a graph of thermal analysis data (DSC data) displayed by a thermal analysis device according to an embodiment of the present invention, and a sample image at a desired point on the graph.
- FIG. 3 is a diagram showing a screen for selecting a range for generating color information data from a sample image by a color information generation means according to an embodiment of the present invention.
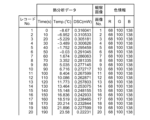
- 3 is a table showing color information data generated by a color information generation means according to an embodiment of the present invention.
- FIG. 3 is a diagram showing a color information graph displayed by a color information graph display means according to an embodiment of the present invention.
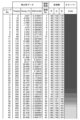
- 3 is a table showing colors generated by a gradation display means according to an embodiment of the present invention.
- FIG. 3 is a diagram showing a gradation in which colors generated by a gradation display means according to an embodiment of the present invention are arranged and displayed in correspondence with time.
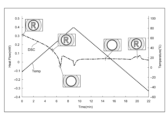
- a graph of thermal analysis data (DSC data) a sample image at a desired point on the graph, a graph of color information data, and a color gradation displayed by a thermal analysis device according to an embodiment of the present invention. It is a diagram.
- a thermal analysis device 1 includes a differential scanning calorimetry (DSC) device 2, an automatic sample exchanger 3, a cooling unit 4, a lid body 5 with an observation window, a camera 6, and a camera movement mechanism. 7, a computer 8, an input device 9, and a display device 10.
- the computer 8 has thermal analyzer control software 30, which will be described later, installed therein.
- the DSC device 2 includes a heating furnace 14 whose side and bottom surfaces are surrounded by heat insulating materials 12 and 13 in a cylindrical case 11.
- the heating furnace 14 includes a measurement chamber 15 whose upper surface is open and a heat-sensitive plate 16 provided inside the measurement chamber 15.
- a sample container 17 carrying a sample is placed at a predetermined sample measurement position on the heat-sensitive plate 16 .
- a sample container 18 carrying a reference material is placed at a predetermined reference material measurement position on the heat-sensitive plate 16 .
- a heater 14a (see FIG. 3) that generates heat when energized is provided within the side wall of the heating furnace 14. The heating furnace 14 heats the sample and reference material in the measurement chamber 15 by the heater generating heat.
- a sample temperature detection means 19 such as a thermocouple that detects the temperature by contacting or coming close to the bottom of the sample container 17 placed at the position.
- a reference material temperature detection means 20 such as a thermocouple is provided, which detects the temperature by contacting or coming close to the bottom of the sample container 18 placed at that position.
- a heating furnace temperature detection means 21 such as a thermocouple is provided at the bottom of the measurement chamber 15 of the heating furnace 14 to detect the temperature of the heating furnace 14 .
- the DSC device 2 uses the temperatures detected by the sample temperature detection means 19, the reference material temperature detection means 20, and the heating furnace temperature detection means 21 as a sample temperature signal, a reference material temperature signal, and a heating furnace temperature signal, respectively.
- the data is stored in a storage unit (not shown) included in the DSC device 2 and transmitted to the computer 8 via wireless or wired communication.
- a refrigerant jacket 22 connected to the cooling unit 4 through two conduits is installed around the outer periphery of the heating furnace 14.
- the cooling unit 4 cools the sample and reference material in the heating furnace 14 and the measurement chamber 15 by circulating a cooling medium such as liquid nitrogen between the inside of the refrigerant jacket 22 and the cooling unit 4 .
- a lid body 5 with an observation window is installed on a case lid 23 that closes the top surface of the case 11.
- the lid body 5 with an observation window is detachably attached to an inner lid 24 with an observation window that is detachably attached to the heating furnace 14 and a spacer 5a installed on the case lid 23 so that the upper surface opening of the measurement chamber 15 can be opened and closed.
- It includes an inner lid 25 with an observation window that can be freely attached, and an outer lid 26 with an observation window that can be detachably attached to the lid body 5.
- the reason why there are three lids with observation windows is to prevent condensation from forming on the observation windows when cooling is performed by the cooling unit 4. When measuring, all the lids 24, 25, and 26 with observation windows are attached to the lid body 5, and the upper opening of the measurement chamber 15 is closed.
- the DSC device 2 is a heat flux type differential scanning calorimetry device.
- Differential scanning calorimetry is "a method that measures the temperature of both a reference material and a sample while applying a constant amount of heat, and quantitatively measures endotherm and heat generation due to changes in the state of the sample.”
- the reference substance is made of a thermally stable material, and its physical properties such as melting and evaporation do not change even when the temperature changes.
- a sample causes an endothermic or exothermic reaction in response to a temperature change according to its own characteristics, the temperature stops changing during the reaction, and a temperature difference ⁇ T occurs between the sample and the reference substance.
- a heat flow for alleviating this temperature difference ⁇ T flows into the sample through the heat sensitive plate 16.
- the amount of heat per unit time (heat flow) flowing into the sample is proportional to the temperature difference ⁇ T between the sample and the reference material. Therefore, the amount of heat (energy) of the sample can be determined by correcting the value obtained by integrating the temperature difference ⁇ T with respect to time, taking into account the temperature dependence, and dividing it by the device constant k. In this way, the heat flux flowing into the sample, and therefore the amount of heat, is calculated based on the temperature difference between the sample and the reference material.
- the calorific value obtained by the calculation is thermal analysis data (DSC data) obtained by differential scanning calorimetry (DSC) of the sample.
- the camera 6 detects a sample container placed at a predetermined sample measurement position in the measurement chamber 15 through the observation windows of the three observation window-equipped lids 24, 25, and 26 of the lid body 5. Photograph the sample at step 17.
- the image data of the sample photographed by the camera 6 is stored in a storage unit (not shown) provided in the camera 6 or the camera movement mechanism 7, and is also transmitted to the computer 8.
- the camera movement mechanism 7 adjusts the photographing position of the sample by the camera 6.
- the camera 6, which is horizontally supported by the camera movement mechanism 7, rotates upward and backward, and retreats from the periphery of the lid body 5.
- the automatic sample exchanger 3 works.
- the automatic sample exchanger 3 can place a sample container 17 loaded with a sample at a predetermined sample measurement position or take it out from the position through the upper opening of the measurement chamber 15.
- the automatic sample exchanger 3 may further be configured to allow the sample container 18 loaded with the reference material to be placed at a predetermined reference material measurement position or to be taken out from the position.
- computer 8 is installed with thermal analyzer control software 30, which is an embodiment of the present invention.
- the computer 8 includes a central processing unit (CPU) 27, an image processing unit (GPU) 28, a storage device 29 such as an HDD/SSD, and the like.
- the computer 8 transmits various signals to and from the DSC device 2, automatic sample exchanger 3, cooling unit 4, camera 6, camera movement mechanism 7, input device 9, and display device 10 through wired or wireless communication. and receive.
- the input device 9 is a device through which an operator inputs sample measurement conditions, operating instructions for each device, etc. into the computer 8.
- the input device 9 includes a keyboard, a mouse, and the like, but may also include a touch panel and voice input means.
- the display device 10 displays various information under the control of the software 30 installed on the computer 8 and according to input from the input device 9.
- the display device 10 includes a liquid crystal monitor or the like.
- the thermal analyzer 1 is controlled by a computer 8 installed with software 30, and is heated by a heating furnace 14 or cooled by a cooling unit 4, and changes the temperature of a sample in a measurement chamber 15 while changing the physical state of the sample.
- the properties are measured and calculated to obtain thermal analysis data, and the sample is photographed by the camera 6 to obtain image data.
- the computer 8 installed with the software 30 has a configuration and function as a thermal analysis graph display means 31 that causes the display device 10 to display a graph related to temperature or time of the thermal analysis data.
- the computer 8 installed with the software 30 has the configuration and function as a sample image display means 32 that causes the display device 10 to display the sample image of the image data.
- the computer 8 installed with the software 30 has the configuration and function as a color information generation means 33 that generates color information data of a selected range and type from the sample image.
- the computer 8 installed with the software 30 has a color information graph display unit that causes the display device 10 to display a graph related to the temperature or time of the color information data side by side without superimposing the graph related to the temperature or time of the thermal analysis data. It has the configuration and functions as 34.
- the computer 8 installed with the software 30 has a configuration and function as a gradation display means 35 that causes the display device 10 to display a gradation in which colors generated from the color information data are arranged in correspondence with temperature or time.
- step S101 a setting screen for the measurement conditions and temperature program of the thermal analyzer 1 is opened, and the sample name, sample weight, set temperature range, measurement time, measurement interval, etc. are entered into the computer 8 using the input means 9 and set. .
- step S102 a sample imaging condition setting screen of the thermal analysis device 1 is opened, and the imaging time, imaging interval, etc. are entered into the computer 8 using the input means 9 and set.
- step S103 measurement is started, and the temperature is controlled by the computer 8 installed with the software 30 according to predetermined measurement conditions and a predetermined temperature program.
- the cooling unit 4 circulates the cooling medium to and from the inside of the refrigerant jacket 22 through two conduits, and heats the sample placed in the sample container 17 placed at a predetermined sample measurement position in the heating furnace 14.
- the sample placed in the sample container 17 placed at a predetermined sample measurement position in the measurement chamber 15 is cooled.
- the sample temperature detection means 19 measures the temperature of the sample
- the reference object temperature detection means 20 measures the temperature of the reference material.
- step S104 the computer 8 calculates the heat flux flowing into the sample, that is, the amount of heat, based on the temperature difference between the measured sample temperature and the reference material temperature, and obtains thermal analysis data (DSC data) of the sample.
- DSC data thermal analysis data
- step S201 under the control of the computer 8 installed with the software 30, the camera 6 of the thermal analyzer 1 places the sample on the sample container 17 placed at a predetermined sample measurement position in the measurement chamber 15, according to predetermined sample photographing conditions. The sample is photographed during the measurement.
- step S202 the computer 8 acquires image data of the sample being measured.
- step S105 the thermal analysis data of the sample and the image data of the sample acquired by the computer 8 are stored in the storage device 29 of the computer 8.
- step S301 the thermal analyzer 1 is controlled by the computer 8 installed with the software 30, and is heated by the heating furnace 14 or cooled by the cooling unit 4 to cool the inside of the measurement chamber 15. While changing the temperature of the sample, the physical properties of the sample are measured and calculated to obtain thermal analysis data, and the sample being measured is photographed by the camera 6 to obtain image data.
- thermal analysis data and image data can be obtained by measuring and photographing a sample according to the flowchart shown in FIG. Further, the thermal analysis data and image data may be obtained by reading data stored in the storage device 29 of the computer 8.
- Figure 6 shows the temperature of the sample and the reference material being measured during the process of raising the temperature of the sample to 80°C and then lowering it to -50°C, and calculating the temperature based on the temperature difference between the sample and the reference material.
- An example of a graph of acquired DSC data is shown.
- the thermal analysis graph display means 31 displays a graph regarding the temperature and time of the sample, with the horizontal axis representing time (in min.) and the vertical axis representing temperature (in degrees Celsius). .
- a graph relating to heat flux and time is displayed with the horizontal axis representing time (unit: min.) and the vertical axis representing heat flow (unit: mW.).
- the sample image display means 32 displays a sample image at an arbitrarily selected point on a graph regarding heat flux and time of thermal analysis data (DSC data).
- the sample image display means 32 selects a plurality of points on the graph of thermal analysis data or selects a plurality of sample images from the image data stored in the storage device 29 and displays them on the display device 10. It is possible to display multiple sample images.
- the color information generation means 33 can select the range and type of color information to be generated from the sample image.
- FIG. 7 shows an example of the sample observation color information window opened by the color information generation means 33 for selecting the range and type of color information to be generated from the sample image.
- a sample image is displayed in the sample observation color information window by the sample image display means 32.
- a check box is provided for selecting whether to select "select by square” or "select by circle” as the range (target range) of color information to be generated from the sample image.
- a dotted circle is displayed in the sample image displayed in the sample observation color information window.
- the size and position of the target range displayed as a dotted circle can be changed using an input device 9 such as a keyboard or a mouse.
- the color information is information that numerically represents the color of image data captured by the camera 6.
- the types of color information to be generated are "RGB,” which expresses colors by a combination of red, green, and blue, which are the “three primary colors of light,” and cyan, which is the “three primary colors of color.”
- RGB RGB
- CMYK expresses colors by a combination of three colors (Cyan, Magenta, Yellow) and Black
- CIE Lab defined by the Commission Internationale de Illumination (CIE)
- the color information generation means 33 generates color information data of the selected range and type from the sample image.
- the color information generation means 33 confirms the selection of the range and type of color information to be generated, and then generates color information data. generate.
- FIG. 8 an example of color information data generated by the color information generation means 33 is shown in a table.
- thermal analysis data Temp, DSC
- image data observed image
- color information data R value, G value, B value
- the color information graph display means 34 may further display a graph related to temperature or time of the color information data on the display device.
- FIG. 9 shows an example of a graph of the R value, G value, and B value, which are color information data, displayed by the color information graph display means 34 in relation to time.
- the color information changes significantly between about 5 and 7 minutes from the start of measurement and between about 14 and 20 minutes (especially around 19 minutes). .
- the color information graph it is possible to accurately grasp the timing and amount of color change of the sample.
- step S304 the gradation display means 35 generates a color from the color information data.
- colors generated from the R value, G value, and B value of the color information data by the gradation display means 35 are displayed in the "Color" column.
- the thermal analysis data, image data, color information (R value, G value, B value), and the generated color are linked to the measurement time and the temperature of the sample at that time. Therefore, based on the generated colors, it is possible to visually grasp the color of the sample corresponding to each measurement time and sample temperature.
- the gradation display means 35 displays the generated colors on the display device in a gradation arranged in correspondence with temperature or time.
- FIG. 11 shows an example in which the generated colors are displayed in a gradation arranged in correspondence with the measurement time.
- the gradation shown in FIG. 11 can be said to be a "color bar" because the gradation in which colors generated from color information data are arranged in correspondence with time is displayed in a band or bar shape.
- the color of the sample was dark blue (dark color in the black and white Figure 11) until around 5 minutes from the start of measurement, but from around 5 minutes to 7 minutes.
- the color changes from blue (dark color) to gray (light color) during that period, remains gray (light color) from around 7 minutes to around 14 minutes, and becomes gray (light color) from around 14 minutes to after 18 minutes. It changes from blue to blue (dark color), changes significantly around 19 minutes, and becomes dark blue (dark color) after around 20 minutes, making it possible to visually grasp the change in color of the sample in detail. be able to.
- a piece of paper with letters written on it using an erasable ballpoint pen was placed in a sample container, heated at a rate of 10°C/min to 80°C in an N2 atmosphere, and then cooled down to -50°C.
- a graph (Temp) showing the relationship between time (measurement time) and sample temperature is also displayed.
- FIG. 12 a graph of thermal analysis data (DSC data) and sample images at five points on the graph of thermal analysis data (DSC data) are displayed. Displaying sample images allows you to grasp the actual color of the sample, but there is a limit to the number of sample images that can be displayed. It is difficult to make a comparative evaluation.
- Figure 12 shows a graph of thermal analysis data (DSC data) as well as a gradation (color bar) is displayed.
- a gradation (color bar) in which colors generated from color information data (RGB values) are arranged makes it possible to visually and easily grasp the actual color of a sample and its changes in detail. Therefore, by displaying a graph of thermal analysis data and displaying the change in sample color with a gradation (color bar), you can visually understand in detail the color of the sample and its changes as the sample temperature changes. At the same time, changes in the state of the sample can be easily analyzed in detail.
- the color information generation means 33 may be capable of selecting a plurality of ranges for generating color information data from the sample image. By selecting a plurality of ranges in the sample image and generating color information data for each range, it is possible to compare and evaluate color changes and the like at a plurality of locations in the sample image.
- the thermal analysis apparatus of the present invention includes a color information graph display means for displaying a graph related to temperature or time of the color information data on the display device side by side without superimposing a graph related to temperature or time of the thermal analysis data. You don't have to.
- the gradation display means is not limited to displaying a gradation in which colors generated from color information data are arranged in correspondence with temperature or time on the display device as a band-shaped color bar.
- the color of a graph related to temperature or time of thermal analysis data may be displayed as a gradation in which colors generated from color information data are arranged in correspondence with temperature or time.
- the thermal analysis device of the present invention is limited to a device consisting of a plurality of devices such as a cooling unit, a computer installed with control software, an input device, and a display device in addition to a differential scanning calorimetry (DSC) device. Instead, some or all of these devices may be integrated.
- the computer installed with the control software may control a plurality of differential scanning calorimetry (DSC) devices or other thermal analysis devices. Further, part or all of the control software may be installed on a server on the cloud.
- the thermal analysis device of the present invention is not limited to a differential scanning calorimetry (DSC) device, but includes a thermogravimetry (TG) device, a differential thermal analysis (DTA) device, a differential scanning calorimetry (DSC) device, a thermogravimetry (TG) device, a differential scanning calorimetry (DSC) device, It may be a mechanical analysis (TMA) device or other various thermal analysis devices.
- the present invention relates to a thermal analysis device that can easily and in detail analyze changes in the state of a sample while visually grasping the color of the sample and its changes in detail as the temperature of the sample changes, and such a thermal analysis device. It can be used to provide control software to realize this.
Landscapes
- Physics & Mathematics (AREA)
- Health & Medical Sciences (AREA)
- Life Sciences & Earth Sciences (AREA)
- Chemical & Material Sciences (AREA)
- Analytical Chemistry (AREA)
- Biochemistry (AREA)
- General Health & Medical Sciences (AREA)
- General Physics & Mathematics (AREA)
- Immunology (AREA)
- Pathology (AREA)
- Engineering & Computer Science (AREA)
- Mathematical Physics (AREA)
- Theoretical Computer Science (AREA)
- Spectroscopy & Molecular Physics (AREA)
- Investigating Or Analyzing Materials Using Thermal Means (AREA)
Abstract
Description
2:示差走査熱量測定(DSC)装置、
3:試料自動交換機、
4:冷却ユニット、
5:観察窓付き蓋体、
6:カメラ、
7:カメラ移動機構、
8:コンピュータ、
9:入力装置、
10:表示装置、
11:ケース、
12,13:断熱材、
14:加熱炉、
14a:ヒータ、
15:測定室、
16:感熱板、
17,18:試料容器、
19:試料温度検出手段、
20:基準物質温度検出手段、
21:加熱炉温度検出手段、
22:冷媒ジャケット、
23:ケース蓋、
24:観察窓付き内蓋、
25:観察窓付き中蓋、
26:観察窓付き外蓋、
27:中央処理装置(CPU)、
28:画像処理装置(GPU)、
29:記憶装置、
30:制御ソフトウェア、
31:熱分析グラフ表示手段、
32:試料画像表示手段、
33:色情報生成手段、
34:色情報グラフ表示手段、
35:グラデーション表示手段
Claims (5)
- 加熱又は冷却して試料の温度を変化させながら該試料の物理的性質を測定し演算して熱分析データを取得すると共に、該試料を撮影して画像データを取得する熱分析装置において、
該熱分析データの温度又は時間に関するグラフを表示装置に表示させる熱分析グラフ表示手段と、
該画像データの試料画像を該表示装置に表示させる試料画像表示手段と、
該試料画像から選択した範囲及び種類の色情報データを生成する色情報生成手段と、
該色情報データから生成した色を温度又は時間に対応させて並べたグラデーションを該表示装置に表示させるグラデーション表示手段と、を備えたことを特徴とする熱分析装置。 - 前記色情報データの温度又は時間に関するグラフを、前記熱分析データの温度又は時間に関するグラフに重畳させずに並べて、前記表示装置に表示させる色情報グラフ表示手段を更に備えたことを特徴とする請求項1に記載の熱分析装置。
- 前記色情報生成手段は、前記試料画像から色情報データを生成する範囲を複数選択できることを特徴とする請求項1に記載の熱分析装置。
- 前記グラデーション表示手段は、前記色情報データから生成した色を温度又は時間に対応させて並べたグラデーションを、帯状のカラーバーとして前記表示装置に表示させることを特徴とする請求項1に記載の熱分析装置。
- 加熱又は冷却して試料の温度を変化させながら該試料の物理的性質を測定し演算して熱分析データを取得すると共に、該試料を撮影して画像データを取得する熱分析装置を制御するコンピュータを、
該熱分析データの温度又は時間に関するグラフを表示装置に表示させる熱分析グラフ表示手段として、
該画像データの試料画像を該表示装置に表示させる試料画像表示手段として、
該試料画像から選択した範囲及び種類の色情報データを生成する色情報生成手段として、及び、
該色情報データから生成した色を温度又は時間に対応させて並べたグラデーションを該表示装置に表示させるグラデーション表示手段として、機能させることを特徴とする、熱分析装置用制御ソフトウェア。
Priority Applications (4)
| Application Number | Priority Date | Filing Date | Title |
|---|---|---|---|
| DE112023003512.1T DE112023003512T5 (de) | 2022-08-23 | 2023-08-22 | Thermoanalysevorrichtung und steuersoftware für thermoanalysevorrichtung |
| JP2024542822A JPWO2024043229A1 (ja) | 2022-08-23 | 2023-08-22 | |
| CN202380061438.8A CN120112786A (zh) | 2022-08-23 | 2023-08-22 | 热分析装置和热分析装置用控制软件 |
| US19/060,093 US20250189470A1 (en) | 2022-08-23 | 2025-02-21 | Thermal analysis apparatus and control software for thermal analysis apparatus |
Applications Claiming Priority (2)
| Application Number | Priority Date | Filing Date | Title |
|---|---|---|---|
| JP2022132341 | 2022-08-23 | ||
| JP2022-132341 | 2022-08-23 |
Related Child Applications (1)
| Application Number | Title | Priority Date | Filing Date |
|---|---|---|---|
| US19/060,093 Continuation US20250189470A1 (en) | 2022-08-23 | 2025-02-21 | Thermal analysis apparatus and control software for thermal analysis apparatus |
Publications (1)
| Publication Number | Publication Date |
|---|---|
| WO2024043229A1 true WO2024043229A1 (ja) | 2024-02-29 |
Family
ID=90013375
Family Applications (1)
| Application Number | Title | Priority Date | Filing Date |
|---|---|---|---|
| PCT/JP2023/030116 Ceased WO2024043229A1 (ja) | 2022-08-23 | 2023-08-22 | 熱分析装置及び熱分析装置用制御ソフトウェア |
Country Status (5)
| Country | Link |
|---|---|
| US (1) | US20250189470A1 (ja) |
| JP (1) | JPWO2024043229A1 (ja) |
| CN (1) | CN120112786A (ja) |
| DE (1) | DE112023003512T5 (ja) |
| WO (1) | WO2024043229A1 (ja) |
Citations (3)
| Publication number | Priority date | Publication date | Assignee | Title |
|---|---|---|---|---|
| JP2016118397A (ja) * | 2014-12-18 | 2016-06-30 | 株式会社Screenホールディングス | 画像処理装置、画像出力装置及び検査装置 |
| WO2017033526A1 (ja) * | 2015-08-26 | 2017-03-02 | 株式会社リガク | 熱分析装置 |
| JP2021001870A (ja) * | 2019-06-19 | 2021-01-07 | 株式会社日立ハイテクサイエンス | 熱分析装置 |
-
2023
- 2023-08-22 WO PCT/JP2023/030116 patent/WO2024043229A1/ja not_active Ceased
- 2023-08-22 CN CN202380061438.8A patent/CN120112786A/zh active Pending
- 2023-08-22 JP JP2024542822A patent/JPWO2024043229A1/ja active Pending
- 2023-08-22 DE DE112023003512.1T patent/DE112023003512T5/de active Pending
-
2025
- 2025-02-21 US US19/060,093 patent/US20250189470A1/en active Pending
Patent Citations (3)
| Publication number | Priority date | Publication date | Assignee | Title |
|---|---|---|---|---|
| JP2016118397A (ja) * | 2014-12-18 | 2016-06-30 | 株式会社Screenホールディングス | 画像処理装置、画像出力装置及び検査装置 |
| WO2017033526A1 (ja) * | 2015-08-26 | 2017-03-02 | 株式会社リガク | 熱分析装置 |
| JP2021001870A (ja) * | 2019-06-19 | 2021-01-07 | 株式会社日立ハイテクサイエンス | 熱分析装置 |
Also Published As
| Publication number | Publication date |
|---|---|
| JPWO2024043229A1 (ja) | 2024-02-29 |
| DE112023003512T5 (de) | 2025-07-10 |
| CN120112786A (zh) | 2025-06-06 |
| US20250189470A1 (en) | 2025-06-12 |
Similar Documents
| Publication | Publication Date | Title |
|---|---|---|
| Sadiq et al. | Determination of steel emissivity for the temperature prediction of structural steel members in fire | |
| Salinero et al. | Measurement of char surface temperature in a fluidized bed combustor using pyrometry with digital camera | |
| CN104498654B (zh) | 一种高炉炉温变化趋势确定方法及装置 | |
| JP2019020370A (ja) | 温度測定装置、温度測定方法及びプログラム | |
| CN109211438B (zh) | 一种原位观察连铸保护渣相变过程热流密度的装置及方法 | |
| JP7365278B2 (ja) | 熱分析装置 | |
| JP2018179814A (ja) | 情報処理装置、温度測定システム、情報処理装置の制御方法、および制御プログラム | |
| WO2024043229A1 (ja) | 熱分析装置及び熱分析装置用制御ソフトウェア | |
| JP7814750B2 (ja) | 熱分析装置及び熱分析装置用制御ソフトウェア | |
| Kappagantula et al. | Determination of the spatial temperature distribution from combustion products: a diagnostic study | |
| Shimkin | Optimization of DSC calibration procedure | |
| Sugiura et al. | Simultaneous measurements of temperature and iron–slag ratio at taphole of blast furnace | |
| JPH08327573A (ja) | 熱分析装置 | |
| Li et al. | Shelf temperature estimation of a vacuum freeze dryer by infrared thermal imaging camera | |
| CN113433161B (zh) | 热分析装置的控制部以及热分析装置 | |
| JP2020112429A (ja) | スラグの定量化方法 | |
| RU2238529C1 (ru) | Способ бесконтактного измерения температуры поверхности нагретых тел | |
| CN119197785A (zh) | 一种材料方向发射率测量装置及方法 | |
| JP2008045888A (ja) | 過熱診断装置 | |
| JP2828211B2 (ja) | 熱変化測定方法 | |
| Specht et al. | Challenges and Opportunities of Thermography in Metallurgy | |
| Felice | Pyrometry for liquid metals: metals producers experience yield and quality issues from inaccurate temperature measurement due to the unusual optical behavior of metals. Multi-wavelength spectropyrometry provides accurate temperature measurement and enables close control of liquid metal processes. | |
| CN112113994B (zh) | 热分析装置 | |
| Heigel et al. | Variation of emittivity with powder bed fusion build parameters | |
| TWI821139B (zh) | 鋼液溫度預測方法及其電腦程式產品 |
Legal Events
| Date | Code | Title | Description |
|---|---|---|---|
| 121 | Ep: the epo has been informed by wipo that ep was designated in this application |
Ref document number: 23857338 Country of ref document: EP Kind code of ref document: A1 |
|
| WWE | Wipo information: entry into national phase |
Ref document number: 2024542822 Country of ref document: JP |
|
| WWE | Wipo information: entry into national phase |
Ref document number: 202380061438.8 Country of ref document: CN |
|
| WWE | Wipo information: entry into national phase |
Ref document number: 112023003512 Country of ref document: DE |
|
| WWP | Wipo information: published in national office |
Ref document number: 202380061438.8 Country of ref document: CN |
|
| WWP | Wipo information: published in national office |
Ref document number: 112023003512 Country of ref document: DE |
|
| 122 | Ep: pct application non-entry in european phase |
Ref document number: 23857338 Country of ref document: EP Kind code of ref document: A1 |