WO2023218516A1 - 異常診断装置および異常診断方法 - Google Patents
異常診断装置および異常診断方法 Download PDFInfo
- Publication number
- WO2023218516A1 WO2023218516A1 PCT/JP2022/019769 JP2022019769W WO2023218516A1 WO 2023218516 A1 WO2023218516 A1 WO 2023218516A1 JP 2022019769 W JP2022019769 W JP 2022019769W WO 2023218516 A1 WO2023218516 A1 WO 2023218516A1
- Authority
- WO
- WIPO (PCT)
- Prior art keywords
- motor
- data
- command
- abnormality diagnosis
- time series
- Prior art date
- Legal status (The legal status is an assumption and is not a legal conclusion. Google has not performed a legal analysis and makes no representation as to the accuracy of the status listed.)
- Ceased
Links
Images







Classifications
-
- G—PHYSICS
- G05—CONTROLLING; REGULATING
- G05B—CONTROL OR REGULATING SYSTEMS IN GENERAL; FUNCTIONAL ELEMENTS OF SUCH SYSTEMS; MONITORING OR TESTING ARRANGEMENTS FOR SUCH SYSTEMS OR ELEMENTS
- G05B19/00—Program-control systems
- G05B19/02—Program-control systems electric
- G05B19/18—Numerical control [NC], i.e. automatically operating machines, in particular machine tools, e.g. in a manufacturing environment, so as to execute positioning, movement or co-ordinated operations by means of program data in numerical form
- G05B19/19—Numerical control [NC], i.e. automatically operating machines, in particular machine tools, e.g. in a manufacturing environment, so as to execute positioning, movement or co-ordinated operations by means of program data in numerical form characterised by positioning or contouring control systems, e.g. to control position from one programmed point to another or to control movement along a programmed continuous path
- G05B19/27—Numerical control [NC], i.e. automatically operating machines, in particular machine tools, e.g. in a manufacturing environment, so as to execute positioning, movement or co-ordinated operations by means of program data in numerical form characterised by positioning or contouring control systems, e.g. to control position from one programmed point to another or to control movement along a programmed continuous path using an absolute digital measuring device
- G05B19/29—Numerical control [NC], i.e. automatically operating machines, in particular machine tools, e.g. in a manufacturing environment, so as to execute positioning, movement or co-ordinated operations by means of program data in numerical form characterised by positioning or contouring control systems, e.g. to control position from one programmed point to another or to control movement along a programmed continuous path using an absolute digital measuring device for point-to-point control
- G05B19/291—Numerical control [NC], i.e. automatically operating machines, in particular machine tools, e.g. in a manufacturing environment, so as to execute positioning, movement or co-ordinated operations by means of program data in numerical form characterised by positioning or contouring control systems, e.g. to control position from one programmed point to another or to control movement along a programmed continuous path using an absolute digital measuring device for point-to-point control the positional error is used to control continuously the servomotor according to its magnitude
-
- H—ELECTRICITY
- H02—GENERATION; CONVERSION OR DISTRIBUTION OF ELECTRIC POWER
- H02P—CONTROL OR REGULATION OF ELECTRIC MOTORS, ELECTRIC GENERATORS OR DYNAMO-ELECTRIC CONVERTERS; CONTROLLING TRANSFORMERS, REACTORS OR CHOKE COILS
- H02P29/00—Arrangements for regulating or controlling electric motors, appropriate for both AC and DC motors
- H02P29/02—Providing protection against overload without automatic interruption of supply
- H02P29/024—Detecting a fault condition, e.g. short circuit, locked rotor, open circuit or loss of load
-
- G—PHYSICS
- G05—CONTROLLING; REGULATING
- G05B—CONTROL OR REGULATING SYSTEMS IN GENERAL; FUNCTIONAL ELEMENTS OF SUCH SYSTEMS; MONITORING OR TESTING ARRANGEMENTS FOR SUCH SYSTEMS OR ELEMENTS
- G05B2219/00—Program-control systems
- G05B2219/30—Nc systems
- G05B2219/34—Director, elements to supervisory
- G05B2219/34013—Servocontroller
Definitions
- the present disclosure relates to an abnormality diagnosis device and an abnormality diagnosis method for diagnosing an abnormality in a motor or a drive machine.
- TBM Time Based Maintenance
- CBM condition-based maintenance
- the motor control system described in Patent Document 1 determines data abnormality based on a comparison between a data abnormality determination threshold and a Mahalanobis distance calculated based on time-series detection data during motor drive.
- Patent Document 1 data is analyzed without selecting the collected data, so a huge amount of data including redundant data that has little relevance to the abnormality is analyzed. There was a problem that the accuracy of diagnosis decreased.
- the present disclosure has been made in view of the above, and aims to provide an abnormality diagnosis device that can perform highly accurate abnormality diagnosis.
- an abnormality diagnosis device of the present disclosure includes a command generation unit that generates a command value that defines the operation of a motor or a drive machine driven by the motor, and a command generation unit that generates a command value that defines the operation of a motor or a drive machine driven by the motor, Alternatively, it includes a drive control section that performs feedback control of the motor based on the control gain so that the operation of the drive machine follows. Further, the abnormality diagnosis device of the present disclosure selects from time-series data indicating the state of the motor or the drive machine based on the comparison result between the control band determined from the control gain and the threshold value determined from the drive machine. It includes a data switching unit that switches series data, and an abnormality determination unit that determines an abnormal state of the motor or drive machine based on the selected time series data.
- the abnormality diagnosis device has the advantage of being able to perform highly accurate abnormality diagnosis.
- a diagram showing a configuration example of an abnormality diagnosis device according to Embodiment 1. A diagram showing an example of the configuration of a drive control section included in the abnormality diagnosis device according to the first embodiment.
- Flowchart showing the processing procedure of the process executed by the data switching unit included in the abnormality diagnosis device according to the first embodiment A diagram for explaining a process in which the abnormality diagnosis device according to the first embodiment calculates a control band from a control gain.
- a diagram showing a configuration example of an abnormality diagnosis device according to a second embodiment A diagram showing an example of command speed used by the abnormality diagnosis device according to the second embodiment Flowchart showing the processing procedure of the process executed by the data switching unit included in the abnormality diagnosis device according to the second embodiment
- a diagram showing a configuration example of an abnormality diagnosis device according to Embodiment 3 A diagram showing an example of the configuration of gears included in a drive machine whose abnormality is diagnosed by the abnormality diagnosis device according to Embodiment 3.
- Flowchart showing the processing procedure of the process executed by the data switching unit included in the abnormality diagnosis device according to the third embodiment A diagram showing an example of the configuration of a rolling bearing for which an abnormality diagnosis device according to Embodiment 3 diagnoses an abnormality.
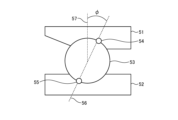
- Diagram for explaining the contact angle of the rolling bearing shown in Figure 12 A diagram showing a configuration example of an abnormality diagnosis device according to Embodiment 4 Flowchart showing the processing procedure of the process executed by the data switching unit included in the abnormality diagnosis device according to Embodiment 4 A diagram showing an example of a hardware configuration for realizing the abnormality diagnosis device according to the first embodiment.
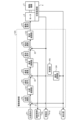
- FIG. 1 is a diagram illustrating a configuration example of an abnormality diagnosis device according to a first embodiment.
- the abnormality diagnosis device 1A is a device that diagnoses abnormalities in the motor 2 or the drive machine 3.
- the drive machine 3 is connected to the motor 2 and operates using the motor 2 as a drive source (power source).
- the motor 2 and the drive machine 3 are connected to a state observation section 4 .
- the abnormality diagnosis device 1A is connected to the state observation section 4 and the motor 2.
- the abnormality diagnosis device 1A includes a command generation section 11, a drive control section 12A, a data switching section 13, and an abnormality determination section 14.
- the command generation unit 11 generates a command value (command value that defines the operation) for causing the motor 2 and the drive machine 3 to perform a desired drive operation, and outputs the generated command value to the drive control unit 12A.
- the drive control unit 12A generates a preset control gain (position control gain, speed control gain, etc. to be described later) D1 so that the operation of the motor 2 or drive machine 3 follows the command value input from the command generation unit 11.
- a drive current is supplied to the motor 2 based on.
- the drive control unit 12A performs feedback control of the motor 2 based on the data acquired from the state observation unit 4 and the command value input from the command generation unit 11. Further, the drive control section 12A outputs the control gain D1 to the data switching section 13.
- the command generation unit 11 when the command generation unit 11 generates a command value of a position command (position command P1 described later) and the drive control unit 12A causes the actual position (actual position P11 described later) to follow the position command P1.
- the command value is not limited to the position command P1. That is, the command generation unit 11 may generate a command value of the speed command, and the drive control unit 12A may perform processing such as causing the actual speed to follow the speed command.
- the position command P1 is a command for the position of the motor 2 (rotational position, movement position, etc.) or a command for the drive position of the drive machine 3.
- the speed command is a command for the speed of the motor 2 (rotational speed, moving speed, etc.) or a command for the driving speed of the drive machine 3.
- the position command P1 is a position command to the motor 2, but the position command P1 may also be a position command to the drive machine 3.
- the actual position P11 is the position of the motor 2
- the speed command may be a speed command to the drive machine 3.
- the actual speed may be the speed of the driving machine 3.
- the motor 2 operates according to the drive current.
- the motor 2 transmits drive torque to the drive machine 3 and operates the drive machine 3.
- the motor 2 may be a rotary motor or a linear motor that performs translational motion.
- At least one motor 2 is connected to the drive machine 3.
- the driving machine 3 is configured to include, for example, an XY table that moves within the XY plane, mechanical parts such as a ball screw, a gear, a belt, or a group of parts that are a combination of these.
- the state observation unit 4 observes the state of at least one of the motor 2 and the drive machine 3, and obtains the observation results as time series data D2.
- the state observation unit 4 collects position data of the motor 2 and outputs time series data D2 of the position data to the drive control unit 12A.
- a specific example of the state observation unit 4 is an encoder attached to a servo motor.
- the state observation unit 4 is not limited to an encoder. For example, if a linear scale that can detect the displacement of the driving machine 3 is used, the linear scale also corresponds to the state observation section 4.
- the state observation unit 4 may output the collected time series data D2 to the data switching unit 13 without outputting it to the drive control unit 12A. Further, the state observation unit 4 may output part of the time series data D2 to the drive control unit 12A, and output the remaining time series data D2 to the data switching unit 13. In this case, the state observation unit 4 may output the time series data D2 including the time series data D2 to be output to the drive control unit 12A to the data switching unit 13, or may output the time series data D2 to the data switching unit 13. Time series data D2 including data D2 may be output to the drive control unit 12A. That is, the state observation unit 4 may output part or all of the collected time series data D2 to the drive control unit 12A and the data switching unit 13.
- the data switching unit 13 receives time series data D2 output from the state observation unit 4 or the drive control unit 12A.
- FIG. 1 shows a case where the data switching section 13 receives time series data D2 from the drive control section 12A.
- the time series data D2 that the data switching unit 13 receives from the state observation unit 4 or the drive control unit 12A is based on the time series data D2 obtained by the state observation unit 4 or the time series data D2 obtained by the state observation unit 4.
- This is processed time series data that has been subjected to arithmetic processing (processing processing). That is, in the first embodiment, the time series data D2 may include processed time series data. Arithmetic processing on the time series data D2 is executed by the state observation section 4 or the drive control section 12A.
- time series data D2 is not limited to data acquired by the state observation unit 4, but may be data generated by the drive control unit 12A or data generated by the command generation unit 11.
- the time series data D2 includes data acquired by the state observation unit 4 (first data), data generated by the drive control unit 12A (second data), and data generated by the command generation unit 11 (third data). data).
- the processed time series data is time series data obtained by performing four arithmetic operations, differential operations, integral operations, filter processing, or a combination thereof on the time series data D2.
- positional deviation, a disturbance torque estimated value that is an estimated value of disturbance torque of the motor 2 or the driving machine 3, etc. correspond to the machining time series data.
- the positional deviation is the difference between the position command P1 corresponding to the actual position P11 and the actual position P11, and is obtained by subtracting the actual position P11 from the position command P1.
- the resonant frequency (information regarding the resonant frequency) D3 of the drive machine 3 is input in advance to the data switching unit 13.
- the data switching unit 13 receives the resonance frequency D3 of the driving machine 3 from a measuring device for the resonance frequency D3.
- the resonant frequency D3 of the drive machine 3 is measured by subjecting the drive machine 3 to sine sweep vibration in advance, or by subjecting the drive machine 3 to an impact test in advance.
- the measured resonance frequency D3 is input to the abnormality diagnosis device 1A as input data to the data switching unit 13.
- the data switching unit 13 calculates a threshold determined from the drive machine 3 based on the resonance frequency D3. This threshold is a threshold that is compared to a control band (eg, speed control band).
- a control band eg, speed control band
- the threshold value calculated based on the resonance frequency D3 corresponds to the drive machine 3. That is, the threshold value is a value determined from the drive machine 3.
- the data switching unit 13 selects time series data (selected time series data D5) to be output to the abnormality determination unit 14 based on the acquired control gain D1, the acquired time series data D2, and a threshold determined from the drive machine 3. Switch.
- the data switching unit 13 calculates the control band based on the control gain D1.
- the control gain D1 is a speed control gain
- the data switching unit 13 calculates a speed control band based on the speed control gain.
- the data switching unit 13 selects the real position P11 as the type of selected time series data D5, and when the speed control band is larger than the threshold value, the data switching unit 13 selects the real position P11 as the type of selected time series data D5.
- the actual current of motor 2 is selected as .
- the actual position P11 is the actual position of the motor 2 or drive machine 3.
- the selected time series data D5 is time series data selected from the time series data D2 and output by the data switching unit 13.
- the data switching unit 13 outputs the selected time series data D5 to the abnormality determining unit 14.
- the abnormality determination unit 14 determines whether the motor 2 or drive machine 3 to be determined is normal or abnormal, based on the selected time series data D5 output from the data switching unit 13.
- the abnormality determination unit 14 performs determination of normality and abnormality by, for example, unsupervised learning.
- Unsupervised learning is a method in which only normal data (time series data D2 when the determination target is normal) is used as learning data, and abnormality determination is performed on selected time series data D5 input after learning. Examples of unsupervised learning include clustering and principal component analysis.
- the abnormality determination unit 14 may use supervised learning that utilizes the time series data D2 in which a correct label is attached to the learning data, or may perform actions to maximize the reward set according to the purpose. Reinforcement learning may be used, or other methods may be used.
- the abnormality determination unit 14 outputs the determination target, determination items, and determination results to an external device such as the display device 5.
- the determination target output by the abnormality determination unit 14 is the motor 2 or the driving machine 3.
- the determination items output by the abnormality determination unit 14 include positional deviation, estimated disturbance torque value, and the like.
- the determination result output by the abnormality determination unit 14 is abnormal or normal.
- the display device 5 displays the determination target, determination items, and determination results.
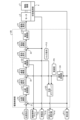
- FIG. 2 is a diagram illustrating a configuration example of a drive control section included in the abnormality diagnosis device according to the first embodiment.
- the drive control section 12A includes a subtracter 21, a position control section 121, a subtracter 22, a speed control section 122, a subtractor 23, a current control section 123, and a speed conversion section 124.
- the state observation unit 4 acquires the actual position P11 and the actual current P10 as time series data D2, and outputs it to the drive control unit 12A. Note that the actual position P11 and the actual current P10 are also sent to the data switching unit 13 via the drive control unit 12A.
- the real position P11 is the real position detected from the motor 2
- the real current P10 is the real current detected from the motor 2.
- the subtracter 21 receives the position command P1 output from the command generation unit 11 and the actual position P11 output from the state observation unit 4.
- the actual position P11 is the actual position of the motor 2 (rotational position, moving position, etc.) or the actual driving position of the driving machine 3.
- the subtracter 21 calculates a positional deviation P2 by subtracting the actual position P11 from the positional command P1, and outputs the calculated positional deviation P2 to the position control unit 121.
- the position control unit 121 calculates and outputs a speed command P3 using, for example, PID (Proportional-Integral-Differential) control based on the positional deviation P2.
- the speed command P3 is a speed command (rotational speed, movement speed, etc.) to the motor 2 or a speed command (drive speed, etc.) to the drive machine 3.
- a control gain D1 exists in PID control.
- the control gain D1 of the position control section 121 is referred to as a position control gain.
- the position control unit 121 outputs the speed command P3 to the subtractor 22.
- the speed conversion unit 124 calculates the actual speed P8 by, for example, performing time differentiation processing on the actual position P11 output by the state observation unit 4.
- the speed converter 124 outputs the actual speed P8 to the subtracter 22.
- the actual speed P8 is the actual speed (rotational speed, moving speed, etc.) of the motor 2 or the actual driving speed of the driving machine 3.
- the subtracter 22 receives the speed command P3 outputted from the position control section 121 and the actual speed P8 outputted from the speed conversion section 124.
- the subtractor 22 subtracts the actual speed P8 from the speed command P3 in order to calculate a speed deviation P4 that is the difference between the speed command P3 and the actual speed P8.
- the subtracter 22 outputs the calculated speed deviation P4 to the speed control section 122.
- the speed control unit 122 calculates and outputs a current command P5 based on the speed deviation P4, for example, by PID control.
- the current command P5 is a current command value for operating the motor 2.
- the PID control includes the control gain D1, and in the first embodiment, the control gain D1 of the speed control section 122 is referred to as the speed control gain P9.
- the speed control gain P9 is an example of the aforementioned control gain D1. In the first embodiment, the case where the control gain D1 is the speed control gain P9 will be mainly described.
- the speed control unit 122 outputs the current command P5 to the subtracter 23. Further, the speed control section 122 outputs the speed control gain P9 to the data switching section 13.
- the subtracter 23 receives the current command P5 output from the speed control section 122 and the actual current P10 output from the state observation section 4.
- the actual current P10 is the actual current value when the motor 2 is operating.
- the subtracter 23 subtracts the actual current P10 from the current command P5 in order to calculate a current deviation P6 that is the difference between the current command P5 and the actual current P10.
- the subtracter 23 outputs the calculated current deviation P6 to the current control section 123.
- the current control unit 123 supplies power to the motor 2 by calculating and outputting a drive current P7 by power conversion based on the current deviation P6.
- PID control is taken as an example, but the control is not limited to PID control.
- At least one of the position control section 121 and the speed control section 122 may execute PI control, P control, or control using feedforward compensation.
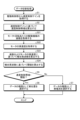
- FIG. 3 is a flowchart illustrating a processing procedure executed by a data switching section included in the abnormality diagnosis device according to the first embodiment.
- the data switching unit 13 acquires the speed control gain P9 set in the drive control unit 12A from the drive control unit 12A, which is a driving device (step S1).
- the data switching unit 13 calculates a speed control band based on the speed control gain P9 (step S2).
- FIG. 4 is a diagram for explaining a process in which the abnormality diagnosis device according to the first embodiment calculates a control band from a control gain.
- FIG. 4 shows a block configuration focusing on the transmission characteristics of the motor 2, drive machine 3, state observation section 4, and drive control section 12A. Note that FIG. 4 shows a case where the drive control section 12A is executing proportional control.
- the motor 2 and the drive machine 3 are regarded as rigid bodies, and the sum of the inertia of the motor 2 and the inertia of the drive machine 3 is set as J.
- s is a Laplace operator.
- K vp is a speed control gain, and K t is a current to torque conversion constant.
- the speed command P3 from the command generation unit 11 and the actual speed P8x detected by the motor 2 are input to the subtracter 24.
- the subtracter 24 calculates a speed deviation P4 by subtracting the actual speed P8x from the speed command P3, and outputs the calculated speed deviation P4 to the speed control section 122.
- the speed deviation P4 becomes the torque command P12 under the action of Kvp within the speed control section 122, and the torque command P12 becomes the current command P5 under the action of 1/ Kt within the speed control section 122.
- the current command P5 is affected by K t in the motor 2 and becomes an actual torque P13, and the actual torque P13 is affected by 1/Js in the motor 2 and becomes an actual speed P8x.
- This actual speed P8x is sent to the speed control section 122, and the speed control section 122 executes control using the actual speed P8x, thereby realizing a feedback loop.
- the closed loop transfer function G(s) from the speed command P3 to the actual speed P8x is expressed by the following equation (1), which is a first-order lag system transfer function.
- the transfer function from the speed command P3 to the actual speed P8x has a first-order lag characteristic determined by the frequency ⁇ sc shown in equation (2) below, and generally allows frequencies below ⁇ sc to pass, but frequencies greater than ⁇ sc It has the characteristic of blocking frequencies.
- This ⁇ sc becomes the speed control band, and can be calculated from the speed control gain K vp using the above equations (1) and (2).
- proportional control was explained in Fig. 4 as an example, the speed control band can be calculated in the same way even in PI control or PID control if the proportional gain is regarded as Kvp . be.
- the data switching unit 13 acquires the resonance frequency D3 of the drive machine 3 (step S3).
- the data switching unit 13 stores the resonant frequency D3 measured in advance, and acquires the resonant frequency D3 by reading out the stored resonant frequency D3.
- the resonance frequency D3 may be stored in a location other than the data switching unit 13.
- the data switching unit 13 calculates a threshold value based on the resonance frequency D3 of the drive machine 3 (step S4).
- the data switching unit 13 sets the threshold value to be the resonant frequency D3, or the threshold value to be the resonant frequency D3 ⁇ c.
- c is, for example, in a range of approximately 0.5 ⁇ c ⁇ 2.
- the data switching unit 13 compares the speed control band with the threshold and determines whether the speed control band ⁇ threshold (step S5). That is, the data switching unit 13 determines whether the speed control band is smaller than the threshold value.
- Step S5 If the data switching unit 13 determines that the speed control band is smaller than the threshold (Step S5, Yes), it selects the actual position P11 as the data type (Step S6) and outputs it to the abnormality determining unit 14. That is, the data switching unit 13 selects the real position P11 from the time series data D2, and outputs the selected real position P11 to the abnormality determining unit 14 as the selected time series data D5.
- the data switching unit 13 determines that the speed control band is larger than the threshold (Step S5, No), it selects the actual current P10 as the data type (Step S7) and outputs it to the abnormality determining unit 14. That is, the data switching unit 13 selects the real current P10 from the time series data D2, and outputs the selected real current P10 to the abnormality determining unit 14 as the selected time series data D5.
- the selected data is the actual current P10 or the actual position P11, but the actual current P10 is the current command P5 for driving the motor 2 or the driving machine 3.
- the actual position P11 includes a speed command P3 to the motor 2 or the drive machine 3, an actual speed P8 of the motor 2 or the drive machine 3, an acceleration of the motor 2 or the drive machine 3, a position deviation P2 of the motor 2 or the drive machine 3, Alternatively, it may be replaced by the speed deviation P4 of the motor 2 or the drive machine 3.
- the acceleration data of the motor 2 or the drive machine 3 includes vibration information.
- the data switching unit 13 selects the selected time series data D5 to be output to the abnormality determination unit 14 from the first data group of the time series data D2.
- the data switching unit 13 selects the selected time series data D5 to be output to the abnormality determination unit 14 from the second data group of the time series data D2.
- the first data group includes an actual current P10, a current command P5, a torque command P12, an actual torque P13, an estimated disturbance torque value, a current deviation P6, or a torque deviation.
- the second data group includes the actual position P11, speed command P3, actual speed P8, acceleration, position deviation P2, or speed deviation P4.
- the data switching unit 13 may select one piece of data from the first data group, or may select a plurality of pieces of data. Further, when the speed control band is smaller than the threshold value, the data switching unit 13 may select one piece of data from the second data group, or may select a plurality of pieces of data.
- FIG. 5 is a diagram showing another configuration example of the drive control section included in the abnormality diagnosis device according to the first embodiment.
- FIG. 5 shows the configuration of the drive control section 12B that estimates the estimated disturbance torque value P14.
- the drive control section 12B includes a disturbance observer 125 in addition to the components included in the drive control section 12A.
- the disturbance observer 125 is connected to the speed converter 124 and the speed controller 122.
- the speed control section 122 calculates a torque command P12 corresponding to the current command P5. Specifically, the speed control unit 122 calculates the torque command P12 by multiplying the current command P5 by the torque constant (conversion constant K t ) of the motor 2. The speed control unit 122 outputs the calculated torque command P12 to the disturbance observer 125. Further, the speed converter 124 outputs the calculated actual speed P8 to the subtracter 22 and the disturbance observer 125.
- the disturbance observer 125 calculates the estimated disturbance torque value P14 based on the torque command P12 and the actual speed P8. Specifically, the disturbance observer 125 calculates the disturbance observer by subtracting data obtained by differentiating the actual speed P8 by the total value of the inertia of the motor 2 and the inertia of the driving machine 3 from the torque command P12. Calculate 125. The disturbance observer 125 outputs the calculated disturbance torque estimated value P14 to the data switching unit 13.
- the abnormality diagnosis device 1A for the motor 2 or drive machine 3 detects data (selected Time series data D5) is selected, and an abnormality diagnosis of the motor 2 or drive machine 3 is performed based on the selected data. Thereby, the abnormality diagnosis device 1A can suppress an increase in calculation load, and also prevent the accuracy of abnormality diagnosis from decreasing because redundant data (data with low relevance to the abnormality) is not used. Further, the abnormality diagnosis device 1A does not require expertise and time to select data when diagnosing an abnormality of the motor 2 or the drive machine 3. Therefore, the abnormality diagnosis device 1A can easily and accurately diagnose the abnormality of the motor 2 or the drive machine 3.
- the reason why the abnormality diagnosis device 1A can easily and highly accurately diagnose the abnormality of the motor 2 or drive machine 3 will be explained in detail.
- the influence of the abnormality acts on the motor 2 as a disturbance, which appears in at least one of the actual current P10 and the actual position P11 output by the state observation section 4. That is, when an abnormality occurs in the drive machine 3, at least one of the actual current P10 and the actual position P11 output by the state observation unit 4 will show an abnormal value.
- a slight vibration occurs at the resonance frequency D3 of the drive machine 3 or a frequency near the resonance frequency D3, which acts on the motor 2 as a disturbance.
- the drive control unit 12A controls the motor 2 by forming a feedback loop, it is determined whether disturbances at a specific frequency can be easily suppressed depending on the control band determined from the control gain D1. For example, the larger the control band, the wider the range of frequencies that can be suppressed by the drive control unit 12A.
- the influence of the disturbance is unlikely to appear on the actual position P11, which is the control amount.
- the actual position P11 a frequency due to disturbance vibration appears, although this does not mean that there is no influence at all, and the influence is slight.
- the control gain D1 corresponding to the control band also becomes larger.
- the drive control unit 12A multiplies the deviation between command data such as the position command P1 or speed command P3 and the control amount such as the actual position P11 or the actual speed P8 by a control gain D1 to determine the operation. Calculate the amount.
- the control gain D1 when the control gain D1 is large, the actual position P11 or actual speed P8, which slightly contains the frequency component of the disturbance, is expanded, so the frequency of the disturbance is more likely to appear in the current command P5, which is the manipulated variable. .
- the drive control unit 12A cannot completely remove the influence of the disturbance even if it forms a feedback loop, and the influence of the disturbance tends to appear in the control amount. Therefore, the frequency of the disturbance tends to appear in the actual position P11, which is the controlled variable.
- the torque command P12 which is the manipulated variable, has a weak effect of canceling out disturbances due to the feedback loop, so the torque command P12 has a property that the frequency of the disturbance is difficult to appear.
- the abnormality diagnosis device 1A of the first embodiment compares the control band determined from the control gain D1 and the threshold value calculated based on the resonance frequency D3 determined from the drive machine 3, and determines whether the abnormality is detected based on the comparison result. Data (selected time series data D5) that easily excites the accompanying disturbance frequency is automatically selected. Then, the abnormality determination unit 14 of the abnormality diagnosis device 1A determines the abnormality of the drive machine 3 or the motor 2 based on the selected time series data D5, so that the abnormality can be detected with high accuracy.
- the data switching unit 13 uses a current command P5, a torque command P12 in a proportional relationship with the current command P5, an actual torque P13, a current deviation P6 obtained by subtracting the actual current P10 from the current command P5, The torque deviation obtained by subtracting the actual torque P13 from the torque command P12 and the estimated disturbance torque value P14 may be selected.
- the frequency component of the resonant frequency D3 superimposed on the actual current P10 is also superimposed on the actual current P10 or various processed data calculated from the data selected instead of the actual current P10, so the abnormality diagnosis device 1A can provide the same effect as when the actual current P10 is selected.
- the data switching unit 13 uses an actual velocity P8 obtained by differentiating the actual position P11 or an acceleration obtained by differentiating it twice, a position deviation P2 obtained by subtracting the actual position P11 from the position command P1, and a position deviation P2 obtained by subtracting the actual position P11 from the position command P1.
- the speed deviation P4 from which the actual speed P8 is subtracted may be selected.
- the frequency component of the resonance frequency D3 superimposed on the actual position P11 is also superimposed on the actual position P11 or various processed data calculated from the data selected instead of the actual position P11, so the abnormality diagnosis device 1A can obtain the same effect as when the real position P11 is selected.
- the threshold value determined from the driving machine 3 is the resonance frequency D3, but the threshold value is not limited to the resonance frequency D3.
- the resonant frequency D3 may vary depending on the operating conditions, and depending on the setting of the control gain D1, the resonant frequency D3 may vary slightly. Therefore, as described above, the abnormality diagnosis device 1A uses a value obtained by multiplying the resonance frequency D3 of the drive machine 3 by a specific constant c (for example, about 0.5 ⁇ c ⁇ 2) as a threshold determined by the drive machine 3. Good too.
- control band is not limited to the speed control band, but may be a position control band or a current (torque) control band. Also when the control band is a position control band or when the control band is a current (torque) control band, the data switching unit 13 calculates the threshold based on the resonance frequency D3.
- the abnormality diagnosis device 1A generates a time series indicating the state of the motor 2 or the drive machine 3 based on the comparison result between the control band determined from the control gain D1 and the threshold value determined from the drive machine 3.
- Selected time series data D5 which is time series data to be selected and output from the data D2, is switched.
- the abnormality diagnosis device 1A determines the abnormal state of the motor 2 or the driving machine 3 based on the selected time series data D5.
- the abnormality diagnosis device 1A can select and analyze the collected data, so that abnormal conditions can be determined using a small amount of data that does not include redundant data that has little relevance to the abnormality. can. Therefore, the abnormality diagnosis device 1A can perform highly accurate abnormality diagnosis. Further, the abnormality diagnosis device 1A can perform abnormality diagnosis in a short time.
- Embodiment 2 Next, Embodiment 2 will be described using FIGS. 6 to 8.
- data in which the operating state of the motor 2 or the drive machine 3 is in an acceleration section or a deceleration section is selected as data that is more advantageous for abnormality determination. It is selected and abnormality diagnosis is executed.
- FIG. 6 is a diagram showing an example of the configuration of the abnormality diagnosis device according to the second embodiment. Among the components shown in FIG. 6, the components that achieve the same functions as those of the abnormality diagnosis apparatus 1A of the first embodiment shown in FIG.
- the abnormality diagnosis device 1B of the second embodiment includes an operation determination unit 15 in addition to the components included in the abnormality diagnosis device 1A.
- the operation determination section 15 is connected to the command generation section 11 and the data switching section 13.
- the operation determination unit 15 receives, for example, a command value generated and output by the command generation unit 11.
- the operation determination unit 15 determines the operation state of the motor 2 or the drive machine 3 based on the command value generated by the command generation unit 11, for example. Specifically, when the command generation unit 11 generates the position command P1, the operation determination unit 15 calculates the command speed P21 by differentiating the position command P1, and controls the motor 2 based on the calculated command speed P21. Alternatively, the operating state of the drive machine 3 is determined.
- the operation determination section 15 outputs operation information P22 indicating the operation state to the data switching section 13.
- FIG. 7 is a diagram showing an example of command speeds used by the abnormality diagnosis device according to the second embodiment.
- the horizontal axis of the graph shown in FIG. 7 is time, and the vertical axis is command speed P21.
- the command speed P21 includes an acceleration section where the absolute value of the speed (operating speed) increases, a constant speed section where the absolute value of the speed is a constant value larger than 0 (r/min), and a constant speed section where the absolute value of the speed increases. It is classified into a deceleration section where the absolute value decreases and a stop section where the command speed P21 is constant at 0 (r/min).
- the motion determining section 15 determines to which section the command speed P21 corresponds at a specific time, and outputs motion information P22, which is the determination result, to the data switching section 13.
- the motion determining section 15 outputs the motion information P22 for each time to the data switching section 13.
- FIG. 8 is a flowchart illustrating a processing procedure executed by a data switching section included in the abnormality diagnosis device according to the second embodiment. Among the processes shown in FIG. 8, the description of the processes that are the same as those executed by the abnormality diagnosis apparatus 1A of the first embodiment shown in FIG. 3 will be omitted.
- the abnormality diagnosis device 1B of the second embodiment executes the processes from steps S1 to S7 similarly to the abnormality diagnosis device 1A. That is, in steps S1 to S7, the abnormality diagnosis device 1B selects the type of data (selected time series data D5) based on the speed control band calculated from the speed gain and the threshold value calculated from the resonance frequency D3. do.
- the abnormality diagnosis device 1B executes steps S11 to S13. Specifically, the data switching unit 13 of the abnormality diagnosis device 1B acquires the operation information P22 output from the operation determination unit 15 (step S11).
- the data switching unit 13 determines whether the operating state indicated by the operating information P22 is an acceleration section or a deceleration section (step S12).
- the data switching unit 13 selects the acceleration section or the deceleration section as the data section to be selected from the selected time series data D5. (Step S13).
- the data switching section 13 cuts out (selects) the selected time series data D5 that includes the time of the acceleration section or the deceleration section from the selected time series data D5, and outputs it to the abnormality determination section 14.
- step S12 if the operating state indicated by the operating information P22 is neither an acceleration section nor a deceleration section (step S12, No), the data switching section 13 does not output the selected time series data D5 to the abnormality determining section 14. That is, the data switching section 13 does not output the selected time series data D5 to the abnormality determining section 14 when the operating state of the motor 2 or the drive machine 3 is neither in the acceleration section nor in the deceleration section.
- data on which disturbances associated with an abnormality are likely to be superimposed that is, data that is advantageous for the abnormality determination unit 14 to perform an abnormality determination (selected time series data D5) can be input to the abnormality determination unit 14. , the data selection was automatically switched.
- the abnormality diagnosis device 1B of the second embodiment not only selects the data type but also selects the data interval.
- the motor 2 and the drive machine 3 are performing steep operations. Therefore, a large excitation force is applied to the motor 2 and the driving machine 3. A large excitation force tends to excite vibrations, and disturbances associated with an abnormality tend to include large vibration components. Therefore, the data switching section 13 cuts out only the selected time series data D5 of the acceleration section or the deceleration section and outputs it to the abnormality judgment section 14, so that the abnormality judgment section 14 can perform a higher evaluation than in the first embodiment. It becomes possible to perform accurate abnormality determination.
- the abnormality diagnosis device 1B of the second embodiment determines whether the operating state is an acceleration section, a deceleration section, a constant speed section, or a stop section based on the command speed P21.
- the operating state may be determined based on data other than the above.
- the operation determination unit 15 determines whether the operation state is an acceleration section, a deceleration section, or a constant speed section based on data obtained by applying a filter to the actual speed P8, command speed P21, or actual speed P8 of the motor 2 or the drive machine 3. , or a stop section.
- the motion determination unit 15 may cut out only the data in either the acceleration section or the deceleration section, or may cut out the data in both the acceleration section and the deceleration section. That is, the motion determination unit 15 cuts out data in at least one of the acceleration section and the deceleration section.
- the motor 2 and drive machine 3 are described in which disturbances caused by abnormalities are likely to occur in the acceleration section or deceleration section, but there are also drive machines 3 in which disturbances caused by abnormalities act on friction phenomena. do.
- the abnormality diagnosis device 1B can perform highly accurate abnormality diagnosis by cutting out data of a constant speed section instead of an acceleration section or a deceleration section.
- the abnormality diagnosis device 1B performs abnormality diagnosis on the selected time series data D5 of the acceleration section, the deceleration section, the constant speed section, or the stop section. It is also possible to perform even more accurate abnormality diagnosis.
- Embodiment 3 will be described using FIGS. 9 to 13.
- the first embodiment an example was explained in which when some abnormality occurs in the drive machine 3, data advantageous for abnormality determination is selected using a threshold determined from the resonance frequency D3 of the drive machine 3.
- the third embodiment another example of the threshold value calculated from the drive machine 3 will be explained.
- FIG. 9 is a diagram showing a configuration example of an abnormality diagnosis device according to the third embodiment. Among the components shown in FIG. 9, the components that achieve the same functions as those of the abnormality diagnosis apparatus 1A of the first embodiment shown in FIG.
- the abnormality diagnosis apparatus 1C of the third embodiment differs from the abnormality diagnosis apparatus 1A in that it includes a data switching section 13C instead of the data switching section 13.
- the data switching unit 13C and the data switching unit 13 input different data.
- the control gain D1, the time series data D2, the actual speed P32 of the motor 2, and the number of teeth P31 of the drive machine 3 per rotation of the motor 2 are input to the data switching unit 13C of the abnormality diagnosis device 1C. .
- the control gain D1 and time series data D2 are input from the drive control section 12A to the data switching section 13C, and the actual speed P32 of the motor 2 is input from the state observation section 4.
- the number of teeth P31 is input to the data switching unit 13C from an external device.
- the number of teeth P31 is the number of teeth of the driving machine 3 that rotates when the motor 2 rotates once. Note that the number of teeth P31 may be input by the user to the data switching unit 13C.
- FIG. 9 is a drive machine with gears.
- FIG. 10 is a diagram showing an example of the configuration of gears included in a drive machine whose abnormality is diagnosed by the abnormality diagnosis device according to the third embodiment.
- a spur gear is shown as an example of a gear included in the drive machine 3.
- the power of the motor 2 is transmitted to the load side gear 43 via the drive side gear 44, thereby driving the mechanical load 41 connected to the load side gear 43.
- FIG. 11 is a flowchart illustrating the procedure of processing executed by the data switching section included in the abnormality diagnosis device according to the third embodiment.
- FIG. 11 descriptions of the same processes as those executed by the abnormality diagnosis apparatus 1A of the first embodiment shown in FIG. 3 will be omitted.
- the abnormality diagnosis apparatus 1C of the third embodiment executes the processes from steps S21 to S24 instead of steps S3 and S4. That is, the abnormality diagnosis device 1C executes the processes of steps S1 and S2, then executes the processes of steps S21 to S24, and then executes the processes of steps S5 to S7.
- the data switching unit 13C acquires the speed control gain P9 from the drive control unit 12A (step S1), and calculates the speed control band based on the speed control gain P9 (step S2).
- the data switching unit 13C obtains the number of teeth P31 of the drive machine 3 per rotation of the motor 2 (step S21).
- the number of teeth P31 is input in advance to the data switching unit 13C.
- the data switching unit 13C stores the input number of teeth P31, and acquires the number of teeth P31 by reading out the stored number of teeth P31.
- the number of teeth P31 is 16.
- the data switching unit 13C obtains the actual speed P32 of the motor 2 from the state observation unit 4 (step S22). Thereafter, the data switching unit 13C calculates the meshing frequency based on the acquired number of teeth P31 and the acquired actual speed P32 of the motor 2 (step S23).
- the meshing frequency is a frequency that indicates how many times teeth provided on mechanical parts collide with each other per unit time as the motor 2 operates. For example, the meshing frequency in the case of the drive side gear 44 and the load side gear 43 shown in FIG. 10 will be explained. Since the spur gear shown in FIG.
- the abnormality diagnosis device 1A of the first embodiment outputs data to the abnormality determination unit 14 based on the comparison result between the threshold value calculated from the resonance frequency D3 of the drive machine 3 and the speed control band determined from the speed control gain P9.
- the type selected time series data D5 was selected.
- the abnormality diagnosis device 1C of the third embodiment uses the threshold value calculated from the meshing frequency of the drive machine 3 and the speed control gain P9.
- the type of data (selected time series data D5) to be output to the abnormality determining section 14 is selected based on the comparison result with the speed control band determined from the following.
- the abnormality diagnosis device 1C calculates the meshing frequency, and based on the comparison result between the threshold value calculated from the meshing frequency and the control band calculated from the speed control gain P9, the data switching unit 13C is advantageous for abnormality determination. Select data. Thereby, the abnormality diagnosis device 1C can accurately detect abnormalities even when the drive machine 3 includes mechanical parts that transmit power using meshing in the transmission mechanism, such as the drive side gear 44 and the load side gear 43. It becomes possible to detect.
- the data switching unit 13C of the abnormality diagnosis device 1C uses a value obtained by multiplying the meshing frequency by a specific constant c (for example, about 0.5 ⁇ c ⁇ 2) as the threshold determined by the drive machine 3. Good too.
- the abnormality diagnosis device 1C calculates the meshing frequency
- the abnormality diagnosis device 1C may calculate the speed information of the motor 2 based on the command speed obtained by differentiating the position command P1, and may calculate the meshing frequency based on this speed information.
- the drive machine 3 has a spur gear as shown in FIG. It may be.
- the drive machine 3 includes information on the number of teeth per revolution P31 of the motor 2 and the speed of the motor 2, such as a drive machine with planetary gears or a drive machine with a pulley used for tensioning a timing belt. It may be a drive machine that can calculate the meshing frequency from.
- the meshing frequency fm [Hz] can also be determined by the above-mentioned formula (3).
- the data switching unit 13C changes the meshing frequency fm[ Hz] can be obtained.
- the transmission mechanism is not limited to a gear.
- a wave gear device may be used as an example other than the gear of the transmission mechanism.
- the transmission mechanism is a wave gear device.
- vibration occurs at a frequency twice the motor speed, that is, the frequency fm2 [Hz] of the following equation (4) due to the structure of the strain wave gear device. It is known.
- an abnormality occurs in the transmission mechanism, an abnormality also occurs in the frequency fm2 [Hz] of equation (4).
- a strain wave gearing device is used as a transmission mechanism, by determining the threshold value from equation (4), it becomes possible to detect an abnormality with high accuracy.
- rolling bearings may be used as the transmission mechanism. Rolling bearings are used not only inside the motor 2 but also in the drive machine 3. Here, a case where the transmission mechanism is a rolling bearing will be explained.
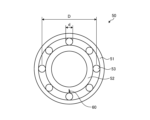
- FIG. 12 is a diagram illustrating a configuration example of a rolling bearing for which an abnormality diagnosis device according to the third embodiment diagnoses an abnormality.
- FIG. 13 is a diagram for explaining the contact angle of the rolling bearing shown in FIG. 12.
- the rolling bearing 50 is composed of an inner ring 52, rolling elements 53, an outer ring 51, a cage (not shown), and the like. It is known that the frequency at which an abnormality appears in the rolling bearing 50 differs depending on the malfunctioning parts (inner ring 52, rolling elements 53, outer ring 51, etc.) or failure factors (flaking 60, wear, etc.).
- n is the number of rolling elements 53
- d is the diameter of the balls (rolling elements 53)
- D is the pitch diameter
- ⁇ is the contact angle of the rolling bearing 50.
- the contact angle ⁇ is the angle between the line of action 56 in the rolling bearing 50 and a plane 57 perpendicular to the central axis of the rolling bearing 50.
- the rolling elements 53 are in contact with the outer raceway, which is the raceway of the outer ring 51, at one point 54, and are in contact with the inner raceway, which is the raceway of the inner ring 52, at one point 55.
- a load action line 56 is a line connecting these two points 54 and 55.
- the abnormality diagnosis device 1C calculates the frequency at which the abnormality occurs using a known formula and determines the threshold value. good. Further, even when another failure factor occurs, the abnormality diagnosis device 1C may calculate the frequency at which the abnormality occurs using a known formula and determine the threshold value.
- the transmission mechanism may be a transmission mechanism that combines gears, wave gearing, rolling bearings 50, belts, or the like. Even if the types or combinations of transmission mechanisms are different, what is common to the gears, strain wave gears, rolling bearings 50, etc. described above is the vibration proportional to the speed of the motor 2 due to their structure. That is, even if the types or combinations of transmission mechanisms are different, vibrations proportional to the rotational frequency of the motor 2 are likely to occur, and even when an abnormality occurs, vibrations proportional to the speed of the motor 2 will occur. In this case, by selecting a value proportional to the frequency calculated from the speed information of the motor 2 as the threshold value, it becomes possible to detect the abnormality with high accuracy.
- the abnormality diagnosis device 1C determines whether the abnormality determination unit 14, the type of data to be output is selected. Thereby, the abnormality diagnosis device 1C can easily and highly accurately perform abnormality diagnosis similarly to the first embodiment.
- Embodiment 4 will be described using FIGS. 14 and 15.
- data advantageous for abnormality determination is selected using a threshold determined from the resonance frequency D3 of the drive machine 3.
- data advantageous for abnormality determination is reselected based on the driving state of motor 2.
- FIG. 14 is a diagram showing a configuration example of an abnormality diagnosis device according to the fourth embodiment. Among the components shown in FIG. 14, the components that achieve the same functions as those of the abnormality diagnosis apparatus 1A of the first embodiment shown in FIG.
- the abnormality diagnosis device 1D of the fourth embodiment differs from the abnormality diagnosis device 1A in that it includes a data switching unit 13D instead of the data switching unit 13.
- the data switching unit 13D and the data switching unit 13 input different data.
- a control gain D1, time series data D2, an actual current P10 corresponding to the drive current P7 of the motor 2, and a current threshold P41 are input to the data switching unit 13D of the abnormality diagnosis device 1D.
- the control gain D1, time series data D2, and actual current P10 are input from the drive control unit 12 to the data switching unit 13D, and the current threshold P41 is input by the user.
- the actual current P10 may be input from the state observation section 4 to the data switching section 13D.
- the current threshold P41 is a threshold for the effective value of the actual current P10.
- the current threshold P41 is used to determine whether or not to change the type of data to be selected (selection target) from the actual current P10 to the actual position P11.
- FIG. 15 is a flowchart illustrating the procedure of processing executed by the data switching section included in the abnormality diagnosis device according to the fourth embodiment. Among the processes shown in FIG. 15, descriptions of the same processes as those executed by the abnormality diagnosis apparatus 1A of the first embodiment shown in FIG. 3 will be omitted.
- the abnormality diagnosis apparatus 1D of the fourth embodiment executes the processes from steps S41 to S44 after step S7.
- the abnormality diagnosis device 1D executes the same processes from steps S1 to S7 as the abnormality diagnosis device 1A.
- the abnormality diagnosis device 1D executes the processes from steps S1 to S7, it executes the processes from steps S41 to S44. That is, when the speed control band is larger than the threshold value, the data switching unit 13D selects the actual current P10 as the data type, and then executes the processes from steps S41 to S44.
- the data switching unit 13D acquires the effective value of the actual current P10 for the past N seconds from the drive control unit 12A (step S41).
- N is a real number larger than 0.
- the data switching unit 13D obtains the current threshold P41 (step S42).
- the current threshold value P41 is set in advance in the data switching unit 13D by the user.
- the data switching unit 13D stores the current threshold P41 set by the user, and acquires the current threshold P41 by reading out the stored current threshold P41.
- the data switching unit 13D compares the acquired effective value of the actual current P10 and the acquired current threshold value P41, and determines whether or not the effective value of the actual current P10 ⁇ current threshold value P41 (step S43 ). That is, the data switching unit 13D determines whether the effective value of the actual current P10 is smaller than the current threshold P41.
- the data switching unit 13D determines that the effective value of the actual current P10 is smaller than the current threshold P41 (Step S43, Yes)
- the data switching unit 13D selects the actual position P11 as the data type (Step S44), and selects the actual position P11 as the data type (Step S44). Output. That is, when the effective value of the actual current P10 is smaller than the current threshold P41, the data switching unit 13D changes the type of data to be selected from the actual current P10 to the actual position P11.
- the data switching unit 13D determines that the effective value of the real current P10 is larger than the current threshold P41 (step S43, No), the data switching unit 13D does not reselect the data type, and instead selects the real current P10 selected in step S7. is output as is to the abnormality determining section 14.
- the data switching unit 13D may select the actual position P11 as the data type, or may select the actual position P11 as the data type. You don't have to make a selection.
- the selected data is the actual current P10 or the actual position P11
- the actual current P10 to be selected can be any data included in the first data group. It may be. That is, the selected actual current P10 may be replaced with a current command P5, a torque command P12, an actual torque P13, a disturbance torque estimated value P14, a current deviation P6, or a torque deviation.
- the real position P11 may be any data included in the second data group. That is, the selected actual position P11 may be replaced with the speed command P3, actual speed P8, acceleration, position deviation P2, or speed deviation P4.
- At least one of the data included in the first data group is current-related information related to the actual current P10.
- the data switching unit 13D determines whether the effective value of the current-related information detected at a specific time in the past is the same as this effective value. It is determined whether the execution threshold value is smaller than the execution threshold value.
- the data switching unit 13D selects at least one data type included in the second data group and outputs it to the abnormality determining unit 14. On the other hand, if the effective value of the current-related information is larger than the execution threshold, the data switching unit 13D does not reselect the data type and selects at least one of the data included in the second data group selected in step S7. is output as is to the abnormality determining section 14.
- the abnormality diagnosis device 1A of the first embodiment outputs data to the abnormality determination unit 14 based on the comparison result between the threshold value calculated from the resonance frequency D3 of the drive machine 3 and the speed control band determined from the speed control gain P9.
- the type selected time series data D5 was selected.
- the abnormality diagnosis device 1D of the fourth embodiment when the actual current P10 is selected as the data type, the driving state of the motor 2, that is, the effective value of the actual current P10, and the current threshold value P41 determined by the user. is compared with. Then, the abnormality diagnosis device 1D reselects the type of data used for abnormality determination based on the comparison result. For example, when the friction of the driving machine 3 is small and the speed of the motor 2 needs to be maintained at a constant speed, the actual current P10 required for operation becomes small because the motor 2 does not accelerate or decelerate.
- the abnormality diagnosis device 1D selects the actual position P11 and performs abnormality diagnosis. It is more advantageous to perform abnormality determination.
- the abnormality diagnosis device 1D acquires the effective value of the actual current P10 for the past N seconds. Then, the abnormality diagnosis device 1D determines whether the effective value of the acquired real current P10 is smaller than the current threshold P41, and if the effective value of the real current P10 is smaller than the current threshold P41, the data type The actual position P11 is selected as the actual position P11. In this way, by reselecting the data type, the abnormality diagnosis device 1D can automatically generate data that is advantageous for abnormality determination even if the drive machine 3 operates with a small actual current P10 of the motor 2. This makes it possible to diagnose an abnormality in the driving machine 3.
- the abnormality diagnosis device 1D selects the actual position P11 as the data type and executes the abnormality diagnosis. Therefore, abnormality diagnosis can be performed with higher accuracy than in the first embodiment.
- the hardware configuration of the abnormality diagnostic devices 1A to 1D will be explained. Note that since the abnormality diagnostic devices 1A to 1D have similar hardware configurations, the hardware configuration of the abnormality diagnostic device 1A will be described here.
- FIG. 16 is a diagram showing an example of a hardware configuration for realizing the abnormality diagnosis device according to the first embodiment.
- the abnormality diagnosis device 1A can be realized by an input device 300, a processor 100, a memory 200, and an output device 400.
- An example of the processor 100 is a CPU (Central Processing Unit, also referred to as a central processing unit, a processing unit, an arithmetic unit, a microprocessor, a microcomputer, or a DSP (Digital Signal Processor)) or a system LSI (Large Scale Integration).
- Examples of the memory 200 are RAM (Random Access Memory) and ROM (Read Only Memory).
- the abnormality diagnosis device 1A is realized by the processor 100 reading out and executing a computer-executable abnormality diagnosis program D6 for executing the operations of the abnormality diagnosis device 1A stored in the memory 200. It can be said that the abnormality diagnosis program D6, which is a program for executing the operation of the abnormality diagnosis apparatus 1A, causes a computer to execute the procedure or method of the abnormality diagnosis apparatus 1A.
- the abnormality diagnosis program D6 executed by the abnormality diagnosis device 1A has a module configuration including a command generation section 11, a drive control section 12A, a data switching section 13, and an abnormality determination section 14, which are in the main memory. are loaded onto the device and these are created on main memory.
- the input device 300 receives time-series data D2 of the motor 2 or drive machine 3 from the state observation unit 4 and sends it to the processor 100.
- the memory 200 stores an abnormality diagnosis program D6, a control gain D1, a resonance frequency D3 of the driving machine 3, and the like.
- the control gain D1, the resonance frequency D3 of the driving machine 3, etc. are read out from the memory 200 by the processor 100. Furthermore, the memory 200 is used as a temporary memory when the processor 100 executes various processes.
- the output device 400 outputs a determination target for abnormality determination, determination items, and determination results to an external device such as the display device 5.
- the abnormality diagnosis program D6 is a file in an installable or executable format, and may be stored in a computer-readable storage medium and provided as a computer program product. Further, the abnormality diagnosis program D6 may be provided to the abnormality diagnosis apparatus 1A via a network such as the Internet. Note that some of the functions of the abnormality diagnosis device 1A may be realized by dedicated hardware such as a dedicated circuit, and some may be realized by software or firmware.
- 1A to 1D Abnormality diagnosis device 2 Motor, 3 Drive machine, 4 Status observation unit, 5 Display device, 11 Command generation unit, 12A, 12B Drive control unit, 13, 13C, 13D Data switching unit, 14 Abnormality determination unit, 15 Operation determination unit, 21 to 24 subtractor, 41 mechanical load, 43 load side gear, 44 drive side gear, 50 rolling bearing, 51 outer ring, 52 inner ring, 53 rolling element, 54, 55 points, 56 line of action, 57 plane, 60 flaking, 100 processor, 121 position control unit, 122 speed control unit, 123 current control unit, 124 speed conversion unit, 125 disturbance observer, 200 memory, 300 input device, 400 output device, D1 control gain, D2 time series data , D3 Resonance frequency, D5 Selected time series data, D6 Abnormality diagnosis program, P1 Position command, P2 Position deviation, P3 Speed command, P4 Speed deviation, P5 Current command, P6 Current deviation, P7 Drive current, P8, P8x, P32 Actual Speed, P9 Speed control gain, P10 Actual current
Landscapes
- Engineering & Computer Science (AREA)
- Human Computer Interaction (AREA)
- Manufacturing & Machinery (AREA)
- Physics & Mathematics (AREA)
- General Physics & Mathematics (AREA)
- Automation & Control Theory (AREA)
- Power Engineering (AREA)
- Control Of Electric Motors In General (AREA)
Abstract
Description
図1は、実施の形態1にかかる異常診断装置の構成例を示す図である。異常診断装置1Aは、モータ2または駆動機械3の異常を診断する装置である。駆動機械3は、モータ2に接続されており、モータ2を駆動源(動力源)として動作する。モータ2および駆動機械3は、状態観測部4に接続されている。異常診断装置1Aは、状態観測部4およびモータ2に接続されている。


つぎに、図6から図8を用いて実施の形態2について説明する。実施の形態2では、異常に伴う外乱の重畳しやすい選択時系列データD5のうち、異常判定にさらに有利なデータとして、モータ2または駆動機械3の動作状態が加速区間または減速区間であるデータが選択されて異常診断が実行される。
つぎに、図9から図13を用いて実施の形態3について説明する。実施の形態1では、駆動機械3に何らかの異常が発生した場合、駆動機械3の共振周波数D3から決まる閾値を用いて異常判定に有利なデータを選択する例について説明したが、実施の形態3では、駆動機械3から算出する閾値の他の例について説明する。



つぎに、図14および図15を用いて実施の形態4について説明する。実施の形態1では、駆動機械3に何らかの異常が発生した場合、駆動機械3の共振周波数D3から決まる閾値を用いて異常判定に有利なデータを選択する例について説明したが、実施の形態4では、実施の形態1において実電流P10が選択された場合に、モータ2の駆動状態に基づいて、異常判定に有利なデータが再選択される。
Claims (13)
- モータまたは前記モータによって駆動される駆動機械の動作を規定する指令値を生成する指令生成部と、
前記指令値に前記モータまたは前記駆動機械の動作が追従するように、制御ゲインに基づいて前記モータをフィードバック制御する駆動制御部と、
前記制御ゲインから決まる制御帯域と、前記駆動機械から決まる閾値との比較結果に基づいて、前記モータまたは前記駆動機械の状態を示す時系列データの中から選択して選択時系列データを切り替えるデータ切替部と、
前記選択時系列データに基づいて、前記モータまたは前記駆動機械の異常状態を判定する異常判定部と、
を備える、
ことを特徴とする異常診断装置。 - 前記データ切替部は、前記閾値よりも前記制御帯域が大きい場合、前記時系列データのうちの第1のデータ群の中から前記異常判定部に出力する前記選択時系列データを選択し、前記閾値よりも前記制御帯域が小さい場合、前記時系列データのうちの第2のデータ群の中から前記異常判定部に出力する前記選択時系列データを選択し、
前記第1のデータ群は、
前記モータを駆動するための電流指令、前記モータまたは前記駆動機械を駆動するためのトルク指令、前記モータから検出される実電流、前記モータまたは前記駆動機械から検出される実トルク、前記モータまたは前記駆動機械の外乱トルクの推定値である外乱トルク推定値、前記電流指令と前記実電流との差である電流偏差、および前記トルク指令と前記実トルクとの差であるトルク偏差を含み、
前記第2のデータ群は、
前記モータまたは前記駆動機械の実位置、前記モータまたは前記駆動機械への速度指令、前記モータまたは前記駆動機械の実速度、前記モータまたは前記駆動機械の加速度、前記実位置に対応する位置指令と前記実位置との差である位置偏差、および前記速度指令と前記実速度との差である速度偏差を含む、
ことを特徴とする請求項1に記載の異常診断装置。 - 前記指令値に基づいて、前記時系列データが、前記モータまたは前記駆動機械の加速区間または減速区間に該当するか否かを判定し、判定結果を動作情報として出力する動作判定部をさらに備え、
前記データ切替部は、前記動作情報に基づいて、前記選択時系列データのうち前記加速区間および前記減速区間の少なくとも一方を含むデータを前記時系列データから選択して前記異常判定部に出力する、
ことを特徴とする請求項1または2に記載の異常診断装置。 - 前記指令値に基づいて、前記時系列データが、前記モータまたは前記駆動機械の一定速区間に該当するか否かを判定し、判定結果を動作情報として出力する動作判定部をさらに備え、
前記データ切替部は、前記動作情報に基づいて、前記選択時系列データのうち前記一定速区間を含むデータを前記時系列データから選択して前記異常判定部に出力する、
ことを特徴とする請求項1または2に記載の異常診断装置。 - 前記指令値に基づいて、前記時系列データが、前記モータまたは前記駆動機械の停止区間に該当するか否かを判定し、判定結果を動作情報として出力する動作判定部をさらに備え、
前記データ切替部は、前記動作情報に基づいて、前記選択時系列データのうち前記停止区間を含むデータを前記時系列データから選択して前記異常判定部に出力する、
ことを特徴とする請求項1または2に記載の異常診断装置。 - 前記閾値は、前記駆動機械の共振周波数に基づいて算出された値である、
ことを特徴とする請求項1から5の何れか1つに記載の異常診断装置。 - 前記駆動機械が、歯同士の噛合いを利用して動力を伝達する機械部品を含む場合に、前記閾値は、前記モータの速度の情報と前記機械部品の歯数とを用いて算出された噛合周波数に基づいて算出された値である、
ことを特徴とする請求項1から5の何れか1つに記載の異常診断装置。 - 前記閾値は、前記モータの速度の情報から算出された周波数に比例した値である、
ことを特徴とする請求項1から5の何れか1つに記載の異常診断装置。 - 前記データ切替部は、前記閾値よりも前記制御帯域が大きい場合において、過去の特定時間に前記モータから検出された実電流に関連する電流関連情報の実効値が、前記実効値の閾値である実行閾値よりも小さい場合、前記時系列データのうちの第2のデータ群の中から前記異常判定部に出力する前記選択時系列データを選択することで選択対象を変更する、
ことを特徴とする請求項2に記載の異常診断装置。 - 前記時系列データは、前記モータまたは前記駆動機械の状態を観測する状態観測部が取得した第1のデータ、前記駆動制御部が生成する第2のデータ、および前記指令生成部が生成する第3のデータの少なくとも1つを含んでいる、
ことを特徴とする請求項1から9の何れか1つに記載の異常診断装置。 - 前記時系列データは、前記第1のデータ、前記第2のデータ、および前記第3のデータの少なくとも1つに対して、四則演算、積分演算、微分処理、およびフィルタ処理の少なくとも1つが実行されることで得られるデータを含んでいる、
ことを特徴とする請求項10に記載の異常診断装置。 - モータまたは前記モータによって駆動される駆動機械の動作を診断する異常診断装置が、前記モータまたは前記駆動機械の動作を規定する指令値を生成する指令生成ステップと、
前記異常診断装置が、前記指令値に前記モータまたは前記駆動機械の動作が追従するように、制御ゲインに基づいて前記モータをフィードバック制御する駆動制御ステップと、
前記異常診断装置が、前記制御ゲインから決まる制御帯域と、前記駆動機械から決まる閾値との比較結果に基づいて、前記モータまたは前記駆動機械の状態を示す時系列データの中から選択して選択時系列データを切り替えるデータ切替ステップと、
前記異常診断装置が、前記選択時系列データに基づいて、前記モータまたは前記駆動機械の異常状態を判定する異常判定ステップと、
を含む、
ことを特徴とする異常診断方法。 - 前記データ切替ステップでは、前記閾値よりも前記制御帯域が大きい場合、前記異常診断装置が、前記時系列データのうちの第1のデータ群の中から出力する前記選択時系列データを選択し、前記閾値よりも前記制御帯域が小さい場合、前記時系列データのうちの第2のデータ群の中から出力する前記選択時系列データを選択し、
前記第1のデータ群は、
前記モータを駆動するための電流指令、前記モータまたは前記駆動機械を駆動するためのトルク指令、前記モータから検出される実電流、前記モータまたは前記駆動機械から検出される実トルク、前記モータまたは前記駆動機械の外乱トルクの推定値である外乱トルク推定値、前記電流指令と前記実電流との差である電流偏差、および前記トルク指令と前記実トルクとの差であるトルク偏差を含み、
前記第2のデータ群は、
前記モータまたは前記駆動機械の実位置、前記モータまたは前記駆動機械への速度指令、前記モータまたは前記駆動機械の実速度、前記モータまたは前記駆動機械の加速度、前記モータまたは前記実位置に対応する位置指令と前記実位置との差である位置偏差、および前記速度指令と前記実速度との差である速度偏差を含む、
ことを特徴とする請求項12に記載の異常診断方法。
Priority Applications (5)
| Application Number | Priority Date | Filing Date | Title |
|---|---|---|---|
| PCT/JP2022/019769 WO2023218516A1 (ja) | 2022-05-10 | 2022-05-10 | 異常診断装置および異常診断方法 |
| DE112022007172.9T DE112022007172T5 (de) | 2022-05-10 | 2022-05-10 | Gerät zur Diagnose von Anomalien und Verfahren zur Diagnose von Anomalien |
| CN202280074698.4A CN119072845A (zh) | 2022-05-10 | 2022-05-10 | 异常诊断装置及异常诊断方法 |
| US18/704,570 US20240411283A1 (en) | 2022-05-10 | 2022-05-10 | Anomaly diagnosis apparatus and anomaly diagnosis method |
| JP2022554518A JP7170956B1 (ja) | 2022-05-10 | 2022-05-10 | 異常診断装置および異常診断方法 |
Applications Claiming Priority (1)
| Application Number | Priority Date | Filing Date | Title |
|---|---|---|---|
| PCT/JP2022/019769 WO2023218516A1 (ja) | 2022-05-10 | 2022-05-10 | 異常診断装置および異常診断方法 |
Publications (1)
| Publication Number | Publication Date |
|---|---|
| WO2023218516A1 true WO2023218516A1 (ja) | 2023-11-16 |
Family
ID=84027177
Family Applications (1)
| Application Number | Title | Priority Date | Filing Date |
|---|---|---|---|
| PCT/JP2022/019769 Ceased WO2023218516A1 (ja) | 2022-05-10 | 2022-05-10 | 異常診断装置および異常診断方法 |
Country Status (5)
| Country | Link |
|---|---|
| US (1) | US20240411283A1 (ja) |
| JP (1) | JP7170956B1 (ja) |
| CN (1) | CN119072845A (ja) |
| DE (1) | DE112022007172T5 (ja) |
| WO (1) | WO2023218516A1 (ja) |
Families Citing this family (1)
| Publication number | Priority date | Publication date | Assignee | Title |
|---|---|---|---|---|
| US20230367760A1 (en) * | 2022-05-12 | 2023-11-16 | Visa International Service Association | Policy-guided domain adaptation for anomaly detection |
Citations (3)
| Publication number | Priority date | Publication date | Assignee | Title |
|---|---|---|---|---|
| JP2000134966A (ja) * | 1998-10-21 | 2000-05-12 | Toyota Motor Corp | モータ異常検出装置 |
| JP2001290501A (ja) * | 2000-04-11 | 2001-10-19 | Ishikawajima Harima Heavy Ind Co Ltd | サーボ制御方法及び装置 |
| JP2019110628A (ja) * | 2017-12-15 | 2019-07-04 | オムロン株式会社 | サーボモータの負荷状態診断装置及び負荷状態診断方法 |
Family Cites Families (3)
| Publication number | Priority date | Publication date | Assignee | Title |
|---|---|---|---|---|
| WO2005021359A1 (ja) * | 2003-08-28 | 2005-03-10 | Nsk Ltd. | 電動パワーステアリング装置の制御装置 |
| JP6451662B2 (ja) * | 2016-02-23 | 2019-01-16 | 株式会社安川電機 | 異常判定装置、異常判定プログラム、異常判定システム、及びモータ制御装置 |
| JP6721012B2 (ja) | 2018-08-10 | 2020-07-08 | 株式会社安川電機 | モータ制御システム |
-
2022
- 2022-05-10 US US18/704,570 patent/US20240411283A1/en active Pending
- 2022-05-10 CN CN202280074698.4A patent/CN119072845A/zh active Pending
- 2022-05-10 WO PCT/JP2022/019769 patent/WO2023218516A1/ja not_active Ceased
- 2022-05-10 DE DE112022007172.9T patent/DE112022007172T5/de active Pending
- 2022-05-10 JP JP2022554518A patent/JP7170956B1/ja active Active
Patent Citations (3)
| Publication number | Priority date | Publication date | Assignee | Title |
|---|---|---|---|---|
| JP2000134966A (ja) * | 1998-10-21 | 2000-05-12 | Toyota Motor Corp | モータ異常検出装置 |
| JP2001290501A (ja) * | 2000-04-11 | 2001-10-19 | Ishikawajima Harima Heavy Ind Co Ltd | サーボ制御方法及び装置 |
| JP2019110628A (ja) * | 2017-12-15 | 2019-07-04 | オムロン株式会社 | サーボモータの負荷状態診断装置及び負荷状態診断方法 |
Also Published As
| Publication number | Publication date |
|---|---|
| JP7170956B1 (ja) | 2022-11-14 |
| DE112022007172T5 (de) | 2025-02-27 |
| CN119072845A (zh) | 2024-12-03 |
| JPWO2023218516A1 (ja) | 2023-11-16 |
| US20240411283A1 (en) | 2024-12-12 |
Similar Documents
| Publication | Publication Date | Title |
|---|---|---|
| JP6140331B1 (ja) | 主軸または主軸を駆動するモータの故障予知を学習する機械学習装置および機械学習方法、並びに、機械学習装置を備えた故障予知装置および故障予知システム | |
| JP5482699B2 (ja) | 減速機異常診断装置および減速機異常診断方法 | |
| US9146175B2 (en) | Method and a device for detecting abnormal changes in play in a transmission unit of a movable mechanical unit | |
| KR101889248B1 (ko) | 고장 진단 장치 및 고장 진단 방법 | |
| US20240139953A1 (en) | Examination method for examining robot apparatus, control apparatus, and storage medium | |
| RU2683151C1 (ru) | Устройство диагностики неисправностей и способ диагностики неисправностей | |
| JP6330864B2 (ja) | モータの監視装置および方法 | |
| JP2008503811A (ja) | インテリジェント駆動装置 | |
| JP7170956B1 (ja) | 異常診断装置および異常診断方法 | |
| CN113767268B (zh) | 异常诊断系统以及异常诊断方法 | |
| US11268884B2 (en) | Abnormality diagnostic method and abnormality diagnostic device for feed axis device | |
| Desforges et al. | Design methodology for smart actuator services for machine tool and machining control and monitoring | |
| JP2755782B2 (ja) | 圧延ラインの総合診断システム | |
| JP2020038172A (ja) | 機械診断装置及び機械診断プログラム | |
| KR101223756B1 (ko) | 엔코더를 이용한 벨트와 모터 상태 진단시스템 | |
| JPH1039908A (ja) | 産業用ロボットの故障予知方法 | |
| US12379283B2 (en) | Method for identifying faults in a drive | |
| JPH10333743A (ja) | 負荷変動を伴う設備の簡易異常診断方法及びその簡易異常診断装置 | |
| JP2020038174A (ja) | 機械診断装置及び機械診断プログラム | |
| JP7278803B2 (ja) | 情報処理方法、情報処理装置、ロボットシステム、ロボットシステムの制御方法、ロボットシステムを用いた物品の製造方法、プログラム及び記録媒体 | |
| JP2021012032A (ja) | 異常診断装置およびロボット制御装置 | |
| JP6899979B2 (ja) | 電動機駆動装置及び電動機駆動システム | |
| JP2023106744A (ja) | 故障診断方法及び故障診断装置 | |
| JP2021185724A (ja) | サーボモータ減速機故障予知構造、減速機付きサーボモータ、および減速機付きサーボモータ制御システム | |
| JP2020122762A (ja) | 診断システム |
Legal Events
| Date | Code | Title | Description |
|---|---|---|---|
| ENP | Entry into the national phase |
Ref document number: 2022554518 Country of ref document: JP Kind code of ref document: A |
|
| 121 | Ep: the epo has been informed by wipo that ep was designated in this application |
Ref document number: 22941598 Country of ref document: EP Kind code of ref document: A1 |
|
| WWE | Wipo information: entry into national phase |
Ref document number: 18704570 Country of ref document: US |
|
| WWE | Wipo information: entry into national phase |
Ref document number: 202280074698.4 Country of ref document: CN |
|
| WWE | Wipo information: entry into national phase |
Ref document number: 112022007172 Country of ref document: DE |
|
| WWP | Wipo information: published in national office |
Ref document number: 112022007172 Country of ref document: DE |
|
| 122 | Ep: pct application non-entry in european phase |
Ref document number: 22941598 Country of ref document: EP Kind code of ref document: A1 |