WO2022138736A1 - Procédé de détection du nombre de copies d'un acide nucléique spécifique par cellule unique - Google Patents
Procédé de détection du nombre de copies d'un acide nucléique spécifique par cellule unique Download PDFInfo
- Publication number
- WO2022138736A1 WO2022138736A1 PCT/JP2021/047619 JP2021047619W WO2022138736A1 WO 2022138736 A1 WO2022138736 A1 WO 2022138736A1 JP 2021047619 W JP2021047619 W JP 2021047619W WO 2022138736 A1 WO2022138736 A1 WO 2022138736A1
- Authority
- WO
- WIPO (PCT)
- Prior art keywords
- chromosome
- cell
- pcr
- single cell
- deletion
- Prior art date
Links
- 108020004707 nucleic acids Proteins 0.000 title claims abstract description 30
- 102000039446 nucleic acids Human genes 0.000 title claims abstract description 30
- 150000007523 nucleic acids Chemical class 0.000 title claims abstract description 30
- 238000000034 method Methods 0.000 title claims abstract description 23
- 238000006243 chemical reaction Methods 0.000 claims abstract description 137
- 108020004414 DNA Proteins 0.000 claims abstract description 114
- 238000003199 nucleic acid amplification method Methods 0.000 claims abstract description 61
- 230000003321 amplification Effects 0.000 claims abstract description 52
- 108091093088 Amplicon Proteins 0.000 claims abstract description 41
- 210000004027 cell Anatomy 0.000 claims description 322
- 210000000349 chromosome Anatomy 0.000 claims description 211
- 239000000523 sample Substances 0.000 claims description 172
- 238000001514 detection method Methods 0.000 claims description 59
- 108020005196 Mitochondrial DNA Proteins 0.000 claims description 43
- 239000000126 substance Substances 0.000 claims description 41
- 238000012217 deletion Methods 0.000 claims description 38
- 206010061765 Chromosomal mutation Diseases 0.000 claims description 27
- 208000036878 aneuploidy Diseases 0.000 claims description 27
- 231100001075 aneuploidy Toxicity 0.000 claims description 23
- 206010028980 Neoplasm Diseases 0.000 claims description 21
- 230000001605 fetal effect Effects 0.000 claims description 20
- 210000004369 blood Anatomy 0.000 claims description 18
- 239000008280 blood Substances 0.000 claims description 18
- 201000011510 cancer Diseases 0.000 claims description 17
- 230000008774 maternal effect Effects 0.000 claims description 14
- 208000011580 syndromic disease Diseases 0.000 claims description 13
- 206010035226 Plasma cell myeloma Diseases 0.000 claims description 11
- 210000003855 cell nucleus Anatomy 0.000 claims description 11
- 102100034343 Integrase Human genes 0.000 claims description 9
- 108010092799 RNA-directed DNA polymerase Proteins 0.000 claims description 9
- 238000002156 mixing Methods 0.000 claims description 9
- 201000003793 Myelodysplastic syndrome Diseases 0.000 claims description 8
- 210000004381 amniotic fluid Anatomy 0.000 claims description 8
- 230000035772 mutation Effects 0.000 claims description 8
- 238000012224 gene deletion Methods 0.000 claims description 7
- 230000004544 DNA amplification Effects 0.000 claims description 6
- 238000003745 diagnosis Methods 0.000 claims description 6
- 239000007850 fluorescent dye Substances 0.000 claims description 6
- 239000000463 material Substances 0.000 claims description 6
- 208000031261 Acute myeloid leukaemia Diseases 0.000 claims description 5
- 208000034578 Multiple myelomas Diseases 0.000 claims description 5
- 208000033776 Myeloid Acute Leukemia Diseases 0.000 claims description 5
- 206010014950 Eosinophilia Diseases 0.000 claims description 4
- 208000026817 47,XYY syndrome Diseases 0.000 claims description 3
- 208000009575 Angelman syndrome Diseases 0.000 claims description 3
- 208000010839 B-cell chronic lymphocytic leukemia Diseases 0.000 claims description 3
- 206010005003 Bladder cancer Diseases 0.000 claims description 3
- 208000003174 Brain Neoplasms Diseases 0.000 claims description 3
- 206010006187 Breast cancer Diseases 0.000 claims description 3
- 208000026310 Breast neoplasm Diseases 0.000 claims description 3
- 206010008342 Cervix carcinoma Diseases 0.000 claims description 3
- 206010009944 Colon cancer Diseases 0.000 claims description 3
- 201000010374 Down Syndrome Diseases 0.000 claims description 3
- 201000006360 Edwards syndrome Diseases 0.000 claims description 3
- 208000000461 Esophageal Neoplasms Diseases 0.000 claims description 3
- 241000282326 Felis catus Species 0.000 claims description 3
- 101001012157 Homo sapiens Receptor tyrosine-protein kinase erbB-2 Proteins 0.000 claims description 3
- 208000008839 Kidney Neoplasms Diseases 0.000 claims description 3
- 208000031422 Lymphocytic Chronic B-Cell Leukemia Diseases 0.000 claims description 3
- 101150105382 MET gene Proteins 0.000 claims description 3
- 108700012912 MYCN Proteins 0.000 claims description 3
- 101150022024 MYCN gene Proteins 0.000 claims description 3
- 108700026495 N-Myc Proto-Oncogene Proteins 0.000 claims description 3
- 102100030124 N-myc proto-oncogene protein Human genes 0.000 claims description 3
- 206010029260 Neuroblastoma Diseases 0.000 claims description 3
- 206010030155 Oesophageal carcinoma Diseases 0.000 claims description 3
- 206010033128 Ovarian cancer Diseases 0.000 claims description 3
- 206010061535 Ovarian neoplasm Diseases 0.000 claims description 3
- 206010061902 Pancreatic neoplasm Diseases 0.000 claims description 3
- 201000009928 Patau syndrome Diseases 0.000 claims description 3
- 102100030086 Receptor tyrosine-protein kinase erbB-2 Human genes 0.000 claims description 3
- 206010038389 Renal cancer Diseases 0.000 claims description 3
- 206010041067 Small cell lung cancer Diseases 0.000 claims description 3
- 208000024770 Thyroid neoplasm Diseases 0.000 claims description 3
- 206010044686 Trisomy 13 Diseases 0.000 claims description 3
- 208000006284 Trisomy 13 Syndrome Diseases 0.000 claims description 3
- 208000007159 Trisomy 18 Syndrome Diseases 0.000 claims description 3
- 206010044688 Trisomy 21 Diseases 0.000 claims description 3
- 208000026928 Turner syndrome Diseases 0.000 claims description 3
- 208000007097 Urinary Bladder Neoplasms Diseases 0.000 claims description 3
- 208000006105 Uterine Cervical Neoplasms Diseases 0.000 claims description 3
- 206010056894 XYY syndrome Diseases 0.000 claims description 3
- 201000010881 cervical cancer Diseases 0.000 claims description 3
- 230000001684 chronic effect Effects 0.000 claims description 3
- 208000032852 chronic lymphocytic leukemia Diseases 0.000 claims description 3
- 208000029742 colonic neoplasm Diseases 0.000 claims description 3
- 230000007812 deficiency Effects 0.000 claims description 3
- 201000004101 esophageal cancer Diseases 0.000 claims description 3
- 201000010536 head and neck cancer Diseases 0.000 claims description 3
- 208000014829 head and neck neoplasm Diseases 0.000 claims description 3
- 201000010982 kidney cancer Diseases 0.000 claims description 3
- 201000007270 liver cancer Diseases 0.000 claims description 3
- 208000014018 liver neoplasm Diseases 0.000 claims description 3
- 208000015486 malignant pancreatic neoplasm Diseases 0.000 claims description 3
- 208000036282 monosomy chromosome 8 Diseases 0.000 claims description 3
- 208000002154 non-small cell lung carcinoma Diseases 0.000 claims description 3
- 201000002528 pancreatic cancer Diseases 0.000 claims description 3
- 208000008443 pancreatic carcinoma Diseases 0.000 claims description 3
- 208000000587 small cell lung carcinoma Diseases 0.000 claims description 3
- 201000002510 thyroid cancer Diseases 0.000 claims description 3
- 206010053884 trisomy 18 Diseases 0.000 claims description 3
- 208000026485 trisomy X Diseases 0.000 claims description 3
- 208000029729 tumor suppressor gene on chromosome 11 Diseases 0.000 claims description 3
- 201000005112 urinary bladder cancer Diseases 0.000 claims description 3
- 208000000398 DiGeorge Syndrome Diseases 0.000 claims description 2
- 206010014958 Eosinophilic leukaemia Diseases 0.000 claims description 2
- 208000017924 Klinefelter Syndrome Diseases 0.000 claims description 2
- 201000007224 Myeloproliferative neoplasm Diseases 0.000 claims description 2
- 230000008569 process Effects 0.000 claims description 2
- 238000012360 testing method Methods 0.000 description 37
- 210000004748 cultured cell Anatomy 0.000 description 32
- 238000005259 measurement Methods 0.000 description 32
- 230000037430 deletion Effects 0.000 description 20
- 208000026487 Triploidy Diseases 0.000 description 18
- 208000020584 Polyploidy Diseases 0.000 description 17
- 101000738771 Homo sapiens Receptor-type tyrosine-protein phosphatase C Proteins 0.000 description 13
- 102100037422 Receptor-type tyrosine-protein phosphatase C Human genes 0.000 description 13
- 206010064571 Gene mutation Diseases 0.000 description 11
- 108090000623 proteins and genes Proteins 0.000 description 11
- 210000004180 plasmocyte Anatomy 0.000 description 10
- 108091032973 (ribonucleotides)n+m Proteins 0.000 description 8
- 239000003153 chemical reaction reagent Substances 0.000 description 8
- 230000001461 cytolytic effect Effects 0.000 description 8
- 238000010586 diagram Methods 0.000 description 8
- 239000000203 mixture Substances 0.000 description 7
- 239000007787 solid Substances 0.000 description 7
- 208000030454 monosomy Diseases 0.000 description 6
- 201000000050 myeloid neoplasm Diseases 0.000 description 6
- 230000035945 sensitivity Effects 0.000 description 6
- 208000007660 Residual Neoplasm Diseases 0.000 description 5
- DBMJMQXJHONAFJ-UHFFFAOYSA-M Sodium laurylsulphate Chemical compound [Na+].CCCCCCCCCCCCOS([O-])(=O)=O DBMJMQXJHONAFJ-UHFFFAOYSA-M 0.000 description 5
- 230000002759 chromosomal effect Effects 0.000 description 5
- 238000012937 correction Methods 0.000 description 5
- 238000009826 distribution Methods 0.000 description 5
- XLYOFNOQVPJJNP-UHFFFAOYSA-N water Substances O XLYOFNOQVPJJNP-UHFFFAOYSA-N 0.000 description 5
- 230000002159 abnormal effect Effects 0.000 description 4
- 238000004458 analytical method Methods 0.000 description 4
- 210000000601 blood cell Anatomy 0.000 description 4
- 239000006285 cell suspension Substances 0.000 description 4
- 230000008859 change Effects 0.000 description 4
- 239000012153 distilled water Substances 0.000 description 4
- 108020004999 messenger RNA Proteins 0.000 description 4
- 238000003757 reverse transcription PCR Methods 0.000 description 4
- 206010068532 5q minus syndrome Diseases 0.000 description 3
- 101150076800 B2M gene Proteins 0.000 description 3
- 206010008805 Chromosomal abnormalities Diseases 0.000 description 3
- 208000031404 Chromosome Aberrations Diseases 0.000 description 3
- 208000005443 Circulating Neoplastic Cells Diseases 0.000 description 3
- 101150112014 Gapdh gene Proteins 0.000 description 3
- 230000002950 deficient Effects 0.000 description 3
- 238000007847 digital PCR Methods 0.000 description 3
- 201000010099 disease Diseases 0.000 description 3
- 208000037265 diseases, disorders, signs and symptoms Diseases 0.000 description 3
- 210000003743 erythrocyte Anatomy 0.000 description 3
- 238000002474 experimental method Methods 0.000 description 3
- 210000005260 human cell Anatomy 0.000 description 3
- 210000000265 leukocyte Anatomy 0.000 description 3
- 230000002934 lysing effect Effects 0.000 description 3
- 238000000691 measurement method Methods 0.000 description 3
- 101150015830 nd1 gene Proteins 0.000 description 3
- 238000003793 prenatal diagnosis Methods 0.000 description 3
- 108700028369 Alleles Proteins 0.000 description 2
- 206010057248 Cell death Diseases 0.000 description 2
- 208000037280 Trisomy Diseases 0.000 description 2
- 239000000427 antigen Substances 0.000 description 2
- 108091007433 antigens Proteins 0.000 description 2
- 102000036639 antigens Human genes 0.000 description 2
- 238000004364 calculation method Methods 0.000 description 2
- 210000001175 cerebrospinal fluid Anatomy 0.000 description 2
- 230000009089 cytolysis Effects 0.000 description 2
- 238000005516 engineering process Methods 0.000 description 2
- 210000003527 eukaryotic cell Anatomy 0.000 description 2
- 238000001917 fluorescence detection Methods 0.000 description 2
- 238000013412 genome amplification Methods 0.000 description 2
- 201000005787 hematologic cancer Diseases 0.000 description 2
- 208000019691 hematopoietic and lymphoid cell neoplasm Diseases 0.000 description 2
- 208000024200 hematopoietic and lymphoid system neoplasm Diseases 0.000 description 2
- 239000000138 intercalating agent Substances 0.000 description 2
- GOTYRUGSSMKFNF-UHFFFAOYSA-N lenalidomide Chemical compound C1C=2C(N)=CC=CC=2C(=O)N1C1CCC(=O)NC1=O GOTYRUGSSMKFNF-UHFFFAOYSA-N 0.000 description 2
- 229960004942 lenalidomide Drugs 0.000 description 2
- 210000005259 peripheral blood Anatomy 0.000 description 2
- 239000011886 peripheral blood Substances 0.000 description 2
- 210000001850 polyploid cell Anatomy 0.000 description 2
- 238000010839 reverse transcription Methods 0.000 description 2
- 230000008685 targeting Effects 0.000 description 2
- 230000001225 therapeutic effect Effects 0.000 description 2
- 210000004881 tumor cell Anatomy 0.000 description 2
- 206010069754 Acquired gene mutation Diseases 0.000 description 1
- 108091007741 Chimeric antigen receptor T cells Proteins 0.000 description 1
- 206010061764 Chromosomal deletion Diseases 0.000 description 1
- 208000031639 Chromosome Deletion Diseases 0.000 description 1
- 238000007400 DNA extraction Methods 0.000 description 1
- 230000006820 DNA synthesis Effects 0.000 description 1
- 108010014303 DNA-directed DNA polymerase Proteins 0.000 description 1
- 102000016928 DNA-directed DNA polymerase Human genes 0.000 description 1
- 102000004190 Enzymes Human genes 0.000 description 1
- 108090000790 Enzymes Proteins 0.000 description 1
- 102100031181 Glyceraldehyde-3-phosphate dehydrogenase Human genes 0.000 description 1
- 206010018910 Haemolysis Diseases 0.000 description 1
- 241000713772 Human immunodeficiency virus 1 Species 0.000 description 1
- 206010020631 Hypergammaglobulinaemia benign monoclonal Diseases 0.000 description 1
- 238000012313 Kruskal-Wallis test Methods 0.000 description 1
- JLVVSXFLKOJNIY-UHFFFAOYSA-N Magnesium ion Chemical compound [Mg+2] JLVVSXFLKOJNIY-UHFFFAOYSA-N 0.000 description 1
- 240000007594 Oryza sativa Species 0.000 description 1
- 235000007164 Oryza sativa Nutrition 0.000 description 1
- 238000002944 PCR assay Methods 0.000 description 1
- 208000002774 Paraproteinemias Diseases 0.000 description 1
- 241001494479 Pecora Species 0.000 description 1
- 101150059736 SRY gene Proteins 0.000 description 1
- 240000004808 Saccharomyces cerevisiae Species 0.000 description 1
- 229910000831 Steel Inorganic materials 0.000 description 1
- 210000001744 T-lymphocyte Anatomy 0.000 description 1
- 241000700605 Viruses Species 0.000 description 1
- 230000001154 acute effect Effects 0.000 description 1
- 230000003322 aneuploid effect Effects 0.000 description 1
- 101150047086 arm gene Proteins 0.000 description 1
- 230000037429 base substitution Effects 0.000 description 1
- 230000015572 biosynthetic process Effects 0.000 description 1
- 210000001185 bone marrow Anatomy 0.000 description 1
- 230000000711 cancerogenic effect Effects 0.000 description 1
- 231100000315 carcinogenic Toxicity 0.000 description 1
- 238000005119 centrifugation Methods 0.000 description 1
- 239000013611 chromosomal DNA Substances 0.000 description 1
- 239000003086 colorant Substances 0.000 description 1
- 230000001419 dependent effect Effects 0.000 description 1
- 210000001840 diploid cell Anatomy 0.000 description 1
- 238000006073 displacement reaction Methods 0.000 description 1
- 238000011304 droplet digital PCR Methods 0.000 description 1
- 239000003814 drug Substances 0.000 description 1
- 230000000694 effects Effects 0.000 description 1
- 239000000839 emulsion Substances 0.000 description 1
- 238000011156 evaluation Methods 0.000 description 1
- 238000000605 extraction Methods 0.000 description 1
- 210000003754 fetus Anatomy 0.000 description 1
- GNBHRKFJIUUOQI-UHFFFAOYSA-N fluorescein Chemical compound O1C(=O)C2=CC=CC=C2C21C1=CC=C(O)C=C1OC1=CC(O)=CC=C21 GNBHRKFJIUUOQI-UHFFFAOYSA-N 0.000 description 1
- 239000012634 fragment Substances 0.000 description 1
- 230000002068 genetic effect Effects 0.000 description 1
- 210000004602 germ cell Anatomy 0.000 description 1
- 108020004445 glyceraldehyde-3-phosphate dehydrogenase Proteins 0.000 description 1
- 210000003783 haploid cell Anatomy 0.000 description 1
- 238000010438 heat treatment Methods 0.000 description 1
- 210000003958 hematopoietic stem cell Anatomy 0.000 description 1
- 230000008588 hemolysis Effects 0.000 description 1
- 238000007901 in situ hybridization Methods 0.000 description 1
- 238000003780 insertion Methods 0.000 description 1
- 230000037431 insertion Effects 0.000 description 1
- 238000007689 inspection Methods 0.000 description 1
- 230000010354 integration Effects 0.000 description 1
- 230000003902 lesion Effects 0.000 description 1
- 208000032839 leukemia Diseases 0.000 description 1
- 238000012886 linear function Methods 0.000 description 1
- 239000007788 liquid Substances 0.000 description 1
- 229910001425 magnesium ion Inorganic materials 0.000 description 1
- 244000005700 microbiome Species 0.000 description 1
- 230000002438 mitochondrial effect Effects 0.000 description 1
- 201000005328 monoclonal gammopathy of uncertain significance Diseases 0.000 description 1
- 210000003924 normoblast Anatomy 0.000 description 1
- 230000002093 peripheral effect Effects 0.000 description 1
- 238000010837 poor prognosis Methods 0.000 description 1
- 238000002360 preparation method Methods 0.000 description 1
- 238000012545 processing Methods 0.000 description 1
- 238000004393 prognosis Methods 0.000 description 1
- 210000001236 prokaryotic cell Anatomy 0.000 description 1
- 230000002062 proliferating effect Effects 0.000 description 1
- 230000035755 proliferation Effects 0.000 description 1
- 238000011002 quantification Methods 0.000 description 1
- 230000036647 reaction Effects 0.000 description 1
- 238000003753 real-time PCR Methods 0.000 description 1
- 239000013074 reference sample Substances 0.000 description 1
- 230000002441 reversible effect Effects 0.000 description 1
- 235000009566 rice Nutrition 0.000 description 1
- 229920006395 saturated elastomer Polymers 0.000 description 1
- 210000003765 sex chromosome Anatomy 0.000 description 1
- 230000001568 sexual effect Effects 0.000 description 1
- 230000037439 somatic mutation Effects 0.000 description 1
- 238000007619 statistical method Methods 0.000 description 1
- 239000010959 steel Substances 0.000 description 1
- 210000000130 stem cell Anatomy 0.000 description 1
- 239000000725 suspension Substances 0.000 description 1
- ABZLKHKQJHEPAX-UHFFFAOYSA-N tetramethylrhodamine Chemical compound C=12C=CC(N(C)C)=CC2=[O+]C2=CC(N(C)C)=CC=C2C=1C1=CC=CC=C1C([O-])=O ABZLKHKQJHEPAX-UHFFFAOYSA-N 0.000 description 1
- 229940124597 therapeutic agent Drugs 0.000 description 1
- 235000011178 triphosphate Nutrition 0.000 description 1
- 239000001226 triphosphate Substances 0.000 description 1
- UNXRWKVEANCORM-UHFFFAOYSA-N triphosphoric acid Chemical compound OP(O)(=O)OP(O)(=O)OP(O)(O)=O UNXRWKVEANCORM-UHFFFAOYSA-N 0.000 description 1
- GPRLSGONYQIRFK-MNYXATJNSA-N triton Chemical compound [3H+] GPRLSGONYQIRFK-MNYXATJNSA-N 0.000 description 1
- 239000007762 w/o emulsion Substances 0.000 description 1
Images


Classifications
-
- C—CHEMISTRY; METALLURGY
- C12—BIOCHEMISTRY; BEER; SPIRITS; WINE; VINEGAR; MICROBIOLOGY; ENZYMOLOGY; MUTATION OR GENETIC ENGINEERING
- C12Q—MEASURING OR TESTING PROCESSES INVOLVING ENZYMES, NUCLEIC ACIDS OR MICROORGANISMS; COMPOSITIONS OR TEST PAPERS THEREFOR; PROCESSES OF PREPARING SUCH COMPOSITIONS; CONDITION-RESPONSIVE CONTROL IN MICROBIOLOGICAL OR ENZYMOLOGICAL PROCESSES
- C12Q1/00—Measuring or testing processes involving enzymes, nucleic acids or microorganisms; Compositions therefor; Processes of preparing such compositions
- C12Q1/68—Measuring or testing processes involving enzymes, nucleic acids or microorganisms; Compositions therefor; Processes of preparing such compositions involving nucleic acids
- C12Q1/6876—Nucleic acid products used in the analysis of nucleic acids, e.g. primers or probes
- C12Q1/6883—Nucleic acid products used in the analysis of nucleic acids, e.g. primers or probes for diseases caused by alterations of genetic material
-
- C—CHEMISTRY; METALLURGY
- C12—BIOCHEMISTRY; BEER; SPIRITS; WINE; VINEGAR; MICROBIOLOGY; ENZYMOLOGY; MUTATION OR GENETIC ENGINEERING
- C12Q—MEASURING OR TESTING PROCESSES INVOLVING ENZYMES, NUCLEIC ACIDS OR MICROORGANISMS; COMPOSITIONS OR TEST PAPERS THEREFOR; PROCESSES OF PREPARING SUCH COMPOSITIONS; CONDITION-RESPONSIVE CONTROL IN MICROBIOLOGICAL OR ENZYMOLOGICAL PROCESSES
- C12Q1/00—Measuring or testing processes involving enzymes, nucleic acids or microorganisms; Compositions therefor; Processes of preparing such compositions
- C12Q1/68—Measuring or testing processes involving enzymes, nucleic acids or microorganisms; Compositions therefor; Processes of preparing such compositions involving nucleic acids
- C12Q1/6844—Nucleic acid amplification reactions
- C12Q1/6851—Quantitative amplification
-
- C—CHEMISTRY; METALLURGY
- C12—BIOCHEMISTRY; BEER; SPIRITS; WINE; VINEGAR; MICROBIOLOGY; ENZYMOLOGY; MUTATION OR GENETIC ENGINEERING
- C12Q—MEASURING OR TESTING PROCESSES INVOLVING ENZYMES, NUCLEIC ACIDS OR MICROORGANISMS; COMPOSITIONS OR TEST PAPERS THEREFOR; PROCESSES OF PREPARING SUCH COMPOSITIONS; CONDITION-RESPONSIVE CONTROL IN MICROBIOLOGICAL OR ENZYMOLOGICAL PROCESSES
- C12Q1/00—Measuring or testing processes involving enzymes, nucleic acids or microorganisms; Compositions therefor; Processes of preparing such compositions
- C12Q1/68—Measuring or testing processes involving enzymes, nucleic acids or microorganisms; Compositions therefor; Processes of preparing such compositions involving nucleic acids
- C12Q1/6844—Nucleic acid amplification reactions
- C12Q1/686—Polymerase chain reaction [PCR]
-
- C—CHEMISTRY; METALLURGY
- C12—BIOCHEMISTRY; BEER; SPIRITS; WINE; VINEGAR; MICROBIOLOGY; ENZYMOLOGY; MUTATION OR GENETIC ENGINEERING
- C12Q—MEASURING OR TESTING PROCESSES INVOLVING ENZYMES, NUCLEIC ACIDS OR MICROORGANISMS; COMPOSITIONS OR TEST PAPERS THEREFOR; PROCESSES OF PREPARING SUCH COMPOSITIONS; CONDITION-RESPONSIVE CONTROL IN MICROBIOLOGICAL OR ENZYMOLOGICAL PROCESSES
- C12Q1/00—Measuring or testing processes involving enzymes, nucleic acids or microorganisms; Compositions therefor; Processes of preparing such compositions
- C12Q1/68—Measuring or testing processes involving enzymes, nucleic acids or microorganisms; Compositions therefor; Processes of preparing such compositions involving nucleic acids
- C12Q1/6806—Preparing nucleic acids for analysis, e.g. for polymerase chain reaction [PCR] assay
-
- C—CHEMISTRY; METALLURGY
- C12—BIOCHEMISTRY; BEER; SPIRITS; WINE; VINEGAR; MICROBIOLOGY; ENZYMOLOGY; MUTATION OR GENETIC ENGINEERING
- C12Q—MEASURING OR TESTING PROCESSES INVOLVING ENZYMES, NUCLEIC ACIDS OR MICROORGANISMS; COMPOSITIONS OR TEST PAPERS THEREFOR; PROCESSES OF PREPARING SUCH COMPOSITIONS; CONDITION-RESPONSIVE CONTROL IN MICROBIOLOGICAL OR ENZYMOLOGICAL PROCESSES
- C12Q2600/00—Oligonucleotides characterized by their use
- C12Q2600/156—Polymorphic or mutational markers
Definitions
- the present invention relates to a method for detecting the number of copies of a specific nucleic acid for each single cell.
- Non-Patent Document 1 discloses that genomic DNA extracted from cells is encapsulated in a droplet and amplified by PCR, although it is not a single cell analysis.
- the target sample and the reference sample are independently quantified in the same droplet. This is achieved by distinguishing the fluorescent signal of the intercalator and the length of the amplicon.
- Non-Patent Document 2 discloses single-cell RT-PCR (reverse transcription PCR) targeting mRNA of a specific gene.
- RT-PCR reverse transcription PCR
- Non-Patent Document 3 the presence of HIV-1 in CD4 + T cells is detected at high throughput by reverse transcription reaction and single-cell-in-droplet (scd) PCR assay.
- Non-Patent Document 4 discloses a single cell-droplet digital PCR (sc-ddPCR) method. In this method, a single cell is encapsulated in a droplet and PCR is performed in the droplet using gene-specific primers and probes. One copy of the gene has been artificially introduced into the cell.
- sc-ddPCR single cell-droplet digital PCR
- Non-Patent Document 5 discloses that a single cell is dissolved in a droplet and the droplet in which the single cell is dissolved is integrated with the droplet of the reaction solution of RT-PCT.
- Patent Document 1 discloses that the genetic state is determined by analyzing the characteristics of DNA obtained from fetal cells concentrated from maternal blood, although it is not a single cell analysis. Patent Document 1 discloses that the concentrated DNA of fetal cells is amplified and the amplified DNA is analyzed by using digital PCR. Further, Patent Document 1 discloses that chromosome 21 is detected.
- Patent Document 2 blood cells containing potential fetal cells are separated at the single cell level, and each of the separated blood cells is independently subjected to chromosomal DNA extraction processing, and the chromosome derived from the fetus is ex post facto. It discloses identifying a fraction containing DNA.
- Non-Patent Document 6 discloses that the SRY gene on the genomic DNA of fetal cells circulating in maternal blood is detected by the above-mentioned sc-ddPCR method.
- Non-Patent Document 7 discloses a quantitative PCR using a yeast genome as a template, which is a 1, 2, 4, ... copy measured by using a piezoelectric effect.
- Non-patent documents 8 and 9 will be described later.
- Digital PCR qualitatively presents whether or not there is a template in a small compartment (eg, droplet). Therefore, digital PCR is not suitable for detecting discrete copy number variations (CNV) for a particular nucleic acid within a microsection.
- CNV discrete copy number variations
- An object of the present invention is to provide a method capable of detecting the number of copies of a specific nucleic acid per single cell in a cell population.
- the present invention relates to the following method for detecting the number of copies of a specific nucleic acid for each single cell.
- a method for detecting the number of copies of a specific nucleic acid for each single cell in a cell population wherein the sample is contained in a reaction compartment containing a sample DNA derived from the nucleic acid in the single cell and a PCR reaction system.
- a detection method comprising a step of amplifying a target contained in DNA by PCR and a step of quantifying the amplicon of the PCR for each reaction compartment in an exponential amplification period.
- the sample DNA is a set of genomic DNA in a single cell, a reverse transcriptase of RNA in a single cell, or mitochondrial DNA in a single cell.
- the PCR reaction system comprises a plurality of probes each having a fluorescent substance having a different fluorescent wavelength, which is assigned to each different region on the sample DNA, and the region contains one or more of the targets.
- the step of quantifying the amplicon the cell-free nucleic acid contaminated with the reaction compartment amplified by the target contained in the sample DNA by detecting fluorescence of a plurality of wavelengths from one reaction compartment.
- the detection method according to [3] which distinguishes the reaction compartment from which only the amplified reaction compartment is present.
- the region includes a plurality of targets to which a plurality of probes having fluorescent substances having the same fluorescence wavelength are assigned to each other, and in the step of quantifying the amplicon, the regions are separated from the plurality of probes.
- the sample DNA contains a set of genomic DNA in the single cell and mitochondrial DNA in the single cell, and the PCR reaction system is a fluorescence of a first fluorescence wavelength assigned to a region on the genomic DNA.
- the region comprises a probe having a substance and a probe having a fluorescent substance having a second fluorescence wavelength assigned on the mitochondrial DNA, the region containing one or more of the targets, and PCR of the targets contained in the sample DNA.
- the target contained in the genomic DNA set and the target contained in the mitochondrial DNA are amplified by PCR in the reaction compartment, and in the step of quantifying the amplicon, the target is contained in the mitochondrial DNA.
- the genomic DNA and the amplicon of the mitochondrial DNA are quantified for each reaction compartment, and the amplifier is used.
- the target contained in the genomic DNA and the target contained in the mitochondrial DNA are amplified by detecting the fluorescence of the first and second fluorescence wavelengths from one reaction compartment.
- the detection method according to [3] which distinguishes the reaction compartment from the reaction compartment in which only the contaminated cell-free nucleic acid is amplified.
- the steps of [1] to [6] further comprising the step of generating the reaction compartment by lysing the single cell in a compartment containing the single cell, the cytolytic reagent, and the PCR premix.
- the detection method according to any one.
- [8] A step of lysing the single cell in a compartment containing the single cell, and a step of generating the reaction compartment by integrating the lysed compartment containing the single cell and the compartment containing the PCR premix.
- the detection method according to any one of [1] to [6], further comprising.
- [9] A step of mixing a population of cell nuclei and a PCR premix in bulk, and a step of creating the reaction compartment by individualizing individual cell nuclei in the population of cell nuclei together with the premix.
- the detection method according to any one of [1] to [9], wherein the reaction compartment is a reaction droplet which is a droplet containing the sample DNA and the PCR reaction system.
- the sample DNA contains a set of genomic DNA in the single cell, and the detection method is based on the quantitative result of the amplicon, variability over the entire length of the chromosome, partial variability of the chromosome, and so on.
- Populations were isolated from sheep water or maternal blood to include fetal cells, and the data are for trisomy 13, trisomy 18, trisomy 21, Turner syndrome, triple X syndrome, XYY syndrome, Kleinfelder syndrome, di.
- [14] Further comprising the step of generating data including information on whether or not a single cell having the chromosomal mutation was detected, the population of the cells was isolated from the patient, the data being said.
- Data include myelodystrophy syndrome, multiple myeloma, idiopathic eosinophilia, chronic eosinophilia, acute non-lymphocytic leukemia, myeloproliferative tumor, chronic lymphocytic leukemia, acute myeloid leukemia, Brain tumor, neuroblastoma, colon cancer, breast cancer, ovarian cancer, cervical cancer, uterine body cancer, small cell lung cancer, non-small cell lung cancer, bladder cancer, kidney cancer, liver cancer, pancreatic cancer, esophageal cancer, thyroid cancer or The detection method according to [11], which is used for diagnosing head and neck cancer.
- the present invention it is possible to detect the number of copies of a specific nucleic acid for each single cell in a cell population. For example, according to the present invention, it is possible to detect a variation (CNV) in the copy number of a specific nucleic acid per single cell.
- CNV a variation
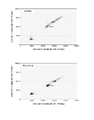
- FIG. 1 is a conceptual diagram of detection.
- FIG. 2 is a flowchart showing an example of detection.
- FIG. 3 is a diagram showing an outline of droplet preparation.
- FIG. 4 is a diagram showing probe allocation.
- FIG. 5 is a scatter of detection events.
- FIG. 6 is a diagram showing the allocation of a plurality of probes.
- FIG. 7 is a scatter of a detection event with enhanced fluorescence.
- FIG. 8 is a plateau droplet scatter.
- FIG. 9 is a droplet scatter in the exponential amplification period.
- FIG. 10 is a droplet scatter with enhanced fluorescence.
- FIG. 11 is a droplet scatter of a heterozygous cell population.
- FIG. 12 is a droplet scatter of a heterozygous cell population.
- FIG. 11 is a droplet scatter of a heterozygous cell population.
- FIG. 22 is a diagram showing the position shift of the cluster for each measurement.
- FIG. 23 is a graph showing variations in measured values after correction.
- FIG. 24 is a diagram illustrating the calculation of the cutoff value using the corrected measured value.
- FIG. 25 is a droplet scatter containing genomic DNA derived from human blood.
- FIG. 26 is a droplet scatter containing CD45 cells.
- FIG. 27 is a droplet scatter of a homozygous cell population.
- FIG. 28 is a droplet scatter of a heterozygous cell population.
- FIG. 29 shows the droplet scatter of each cell population.
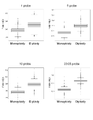
- FIG. 30 is a boxplot showing the detection results of abnormal droplets for each cell population.
- FIG. 31 is a droplet scatter containing a reverse transcriptase of RNA.
- FIG. 32 is a droplet scatter containing mitochondrial DNA.
- FIG. 1 is a diagram conceptually showing how to detect the copy number of a specific nucleic acid per single cell in a cell population, for example, CNV at a specific position on genomic DNA.
- the cell is a human cell.
- the term "monosomy” includes the whole monosomy of a specific chromosome and the partial monosomy state due to deletion. It is included in CNV that the whole or part of a haploid chromosome becomes haploid.
- triploid includes the entire triple (ie, trisomy) of a particular chromosome and the partial triplet state due to duplication. It is included in CNV that the whole or part of the diploid chromosome becomes triploid. It is included in CNV that the whole or part of a diploid chromosome becomes ploidy greater than triploid.
- CNV also includes polyploid changes due to duplication of whole or partial sex chromosomes in boys who are normally monoploid.
- ploidy may be used to include haploidy, diploidy, triploidy and other ploidy.
- CNV also includes changes in which all or part of the polyploid chromosome is completely eliminated (both allele deletions). Also included in CNV are changes that result in whole or part of a chromosome that would not normally exist.
- a population of cells containing a cell having a positive ploidy chromosome further includes a cell having an aneuploidy chromosome. Includes detecting.
- a population of cells containing a cell having a positive multiple chromosome is a cell containing no cell having an aneuploidy chromosome. Includes detection of being a population or containing aneuploid cells below the detection limit.
- a cell having an aneuploidy chromosome it is possible to detect that it is a population of cells having an aneuploidy chromosome, which does not include a cell having a aneuploidy chromosome. included.
- a cell population 17 is prepared.
- the cell population 17 is a collection of single cells 18.
- the cell is a eukaryotic cell or a prokaryotic cell.
- the cell is a eukaryotic cell with one cell nucleus.
- a reaction compartment containing a sample DNA derived from nucleic acid in a single cell 18 and a PCR reaction system is prepared.
- a droplet 20 is formed in the oil 19 as a reaction compartment.
- the figure shows one aspect of the droplet.
- the droplet 20 is a water-in-oil emulsion type droplet.
- the volume of the reaction compartment (droplet 20) is 1 pL (picolitre) to 1 ⁇ L (microliter) or 1 pL (picoliter) to 10 nL (nanoliter).
- the volume of the reaction compartment (droplet 20) is 10 pL, 100 pL, 1 nL, 10 nL or 100 nL.
- the composition of the reaction compartment is not particularly limited as long as it is a micro-compartment containing the sample DNA and the PCR reaction system, and may be, for example, microwells.
- the sample DNA is, for example, a set of genomic DNA in a single cell, a reverse transcript of RNA in a single cell, or DNA of a mitochondrial genome in a single cell (hereinafter referred to as "mitochondrial DNA").
- the droplet 20 contains a set of genomic DNA 21 in a single cell 18 as sample DNA.
- the droplet 20 further contains a PCR reaction system.
- the droplet 20 may be referred to as a reaction droplet.
- the sample DNA is a set of genomic DNA in a single cell.
- the "set of genomic DNA” may be interpreted as raw genomic DNA. In one embodiment, whole genome amplification is not performed on a set of genomic DNA. This avoids allelic dropouts due to whole genome amplification.
- the "set of genomic DNA” also includes those that have been unintentionally lost in part during cytolysis or other extraction operations. In one embodiment, the "set of genomic DNA” does not include mitochondrial DNA. However, when a set of genomic DNA is used as the sample DNA, mitochondrial DNA may be mixed in the reaction compartment.
- the sample DNA is a reverse transcriptase of RNA in a single cell.
- the sample DNA is mitochondrial DNA in a single cell.
- the sample DNA is a set of genomic DNA in a single cell and mitochondrial DNA in the same single cell.
- the mitochondrial DNA may be used as a control for detecting the number of copies of the chromosomal genomic DNA.
- the sample DNA is a nucleic acid of a microorganism or virus that has invaded the cell, or a nucleic acid that has been introduced into the cell.
- the reaction compartment is subjected to a thermal cycle. That is, the target contained in the sample DNA is amplified by PCR in the reaction compartment containing the sample DNA derived from the nucleic acid in the single cell and the PCR reaction system.
- the target contained in the genomic DNA set 21 is amplified by PCR in the droplet 20.
- sample DNA eg genomic DNA
- the droplets 22a and 22b are reaction droplets in the exponential amplification phase.
- the amplicon is quantified for each reaction droplet. That is, the PCR amplicon is quantified for each reaction compartment (eg, reaction droplet) during the exponential amplification phase.
- the quantification of amplicon is performed by a fluorescent probe method.
- the droplet 22b exhibits a stronger signal than the droplet 22a. Therefore, the number of copies of the target genomic region of the single cell corresponding to the droplet 22b is larger than the number of copies of the target genomic region of the single cell corresponding to the droplet 22a. Therefore, the copy number and CNV of genomic DNA at a specific position (target position) on the genome can be detected.
- FIG. 2 is a flowchart showing an example of detecting the number of copies of nucleic acid.
- a droplet is used as the reaction compartment and a set of genomic DNA in a single cell is used as the sample DNA will be described.
- a PCR premix is prepared.
- the premix contains primers, DNA polymerase, deoxynucleoside triphosphate (dNTP), buffer and necessary cofactors.
- the cofactor comprises magnesium ions.
- the premix is premixed with a cytolytic reagent. Examples of cytolytic reagents include sodium dodecyl sulfate, TRITONX-100 (TRITON is a registered trademark), NP-40 TM.
- the premix contains the required probes.
- step 26 shown in FIG. 2 as shown in the upper part of FIG. 3, the cell population 17 is suspended in the premix 31.
- the process from suspension to droplet formation is carried out promptly so that the cytolytic reagent does not react with the cells.
- step 27 shown in FIG. 2 individual single cells 18 are made into droplets together with the premix 31 as shown in the lower part of FIG. This results in a droplet 33a containing the single cell 18.
- QX200 Droplet Generator BioRad
- BioRad QX200 Droplet Generator
- the droplet 33a contains a cytolytic reagent.
- the single cell 18 in the droplet 33a is lysed in the droplet 33a with the cytolytic reagent described above.
- a reaction droplet is obtained by cytolysis. That is, the reaction compartment (reaction droplet) is generated by lysing the single cell 18 in the compartment (droplet 33a) containing the single cell 18, the cytolytic reagent, and the PCR premix. The reaction of the cytolytic reagent proceeds efficiently by heating.
- the single cell is dissolved in a compartment (droplet) containing the single cell prior to mixing with the premix.
- the compartment containing the lysed single cell (droplet) and the compartment containing the PCR premix (droplet) are integrated.
- a reaction compartment (reaction droplet) can be obtained by integration.
- step 27 shown in FIG. 2 bulk cells are lysed to obtain a population of bulk cell nuclei prior to mixing the single cell with the premix.
- a population of bulk cell nuclei is mixed with the PCR premix.
- a reaction compartment is created by individualizing individual cell nuclei in a population of cell nuclei together with a premix.
- PCR proceeds in the reaction droplet by the thermal cycle.
- the thermal cycle is stopped at the exponential amplification phase of PCR.
- "exponential amplification phase” means that template-dependent DNA synthesis is not restricted because dNTPs, primer sets, probe pairs and active enzymes have not been depleted.
- the "exponential amplification phase” means that the plateau of the chain reaction has not been reached.
- step 29 shown in FIG. 2 the number of copies of the target in the reaction droplet is quantified by analyzing the signal from the reaction compartment (reaction droplet). This is the end.
- the premix further comprises a fluorescent probe that hybridizes to the target or the amplicon obtained from the target.
- the premix further comprises a fluorescent intercalator that binds to the DNA.
- the target of the probe contained in the amplicon is one.
- the probe contained in the amplicon has two or more targets.
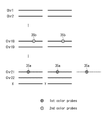
- FIG. 4 shows an example of two-color probe assignment.
- a probe 35a (1st color) having a fluorescent substance having a first fluorescence wavelength is assigned to any target on chromosome 21.
- a probe 35b (2nd color) having a second fluorescence wavelength is assigned to any target on chromosome 18. These chromosomal types are merely examples. These probes are mixed with each other in the reaction compartment (reaction droplet).
- the target to which the probe of the first fluorescence wavelength is assigned or the region containing the probe is targeted for copy number (CNV) detection.
- the target to which the probe of the second fluorescence wavelength is assigned or the region containing the target is used as the control.
- the control is a region where CNV is relatively small.
- the PCR reaction system contains a plurality of probes each having a fluorescent substance having a different fluorescent wavelength, which is assigned to each different region on the sample DNA.
- the region referred to in this example is the total length of each chromosome.
- the region may be a part of each chromosome or may straddle the chromosome.
- one target is included in each region.
- the region may contain two or more targets.
- the fluorescence of each fluorescence wavelength assigned to each region is detected from one reaction compartment (reaction droplet).
- the intensity of the first fluorescence wavelength is that of chromosome 21 as a whole or in the detection. It is 1.5 times the intensity of the first fluorescence wavelength when it is diploid in the target portion. If chromosome 21 is haploid in its entirety or in the part to be detected, then the intensity of the first fluorescence wavelength is haploid if chromosome 21 is in whole or in the part to be detected. It is 0.5 times the intensity of the fluorescence wavelength of 1. The situation is shown in FIG.
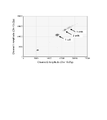
- FIG. 5 shows a scatter plot of fluorescence detection events emitted from the reaction compartment (reaction droplet).
- the vertical axis represents the first fluorescence wavelength assigned to chromosome 21, and the horizontal axis represents the second fluorescence wavelength assigned to chromosome 18.
- Each circle shows near the center of the fluorescence intensity distribution of the detection event on the plot. Since most of the events are accumulated in this circle, the accumulated events are hereinafter referred to as "clusters".
- the cluster 39 shows that the fluorescence intensity was not different from the background at any fluorescence wavelength.
- the clusters 40a to 40c indicate that the fluorescence intensity was different from the background at any fluorescence wavelength.
- the intensity of the first fluorescence wavelength indicates that chromosome 21 is haploid in its entirety or in the portion to be detected.
- the intensity of the second fluorescence wavelength indicates that chromosome 18 is haploid in its entirety or in the part to be detected.
- the intensity of the first fluorescence wavelength indicates that chromosome 21 is triple in its entirety or in the portion to be detected.
- the intensity of the second fluorescence wavelength indicates that chromosome 18 is haploid in its entirety or in the part to be detected.
- the intensity of the first fluorescence wavelength indicates that chromosome 21 is monochromatic in the whole or in the part to be detected. Also, the intensity of the second fluorescence wavelength indicates that chromosome 18 is haploid in its entirety or in the part to be detected.
- each point is shifted from the position of the cluster 40a to the position of the cluster 40b.
- the intensity of the first fluorescence wavelength is increased.
- the intensity of the second fluorescence wavelength does not change.
- Such a shift indicates the presence of a single cell in the cell population in which chromosome 21 is tripled in its entirety or in the portion to be detected.
- each point is shifted from the position of the cluster 40a to the position of the cluster 40c.
- the intensity of the first fluorescence wavelength is reduced.
- the intensity of the second fluorescence wavelength does not change.
- Such a shift indicates the presence of a single cell in the cell population in which chromosome 21 is monolithic in its entirety or in the area to be detected.
- the magnitude of the shift on these scatter plots may be estimated by preliminary experiments.
- the ploidy of the cells of each cluster on these scatter plots may be estimated by preliminary experiments.
- cell-free nucleic acid may be involved in the droplet.
- Cell-free nucleic acids are, for example, fragments of genomic DNA released from broken cells.
- An amplicon may also be produced by PCR from a droplet 33b containing such cell-free genomic DNA.
- amplicon derived from such a cell-free molecule yields clusters 44a and 44b.
- the signal of the amplicon derived from the cell-free molecule does not easily overlap with the cluster 40a. This is because it is unlikely that two or more targets on different regions will be simultaneously amplified in the droplets derived from the cell-free molecule. Also, usually, the number of copies of the target contained in the droplet containing the cell-free molecule is 1.
- the PCR reaction system contains a plurality of probes each having a fluorescent substance having a different fluorescent wavelength, which is assigned to each different region on the sample DNA.
- the region also includes one or more of the targets.
- the type of fluorescent substance (fluorescent dye) and quencher added to the probe is not particularly limited.
- the fluorescent substance having the first fluorescence wavelength is FAM (trademark, Fluorescein amidite), and the fluorescent substance having the second fluorescence wavelength is HEX (trademark, Hexachloro-fluorescein).
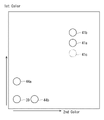
- FIG. 6 shows an example in which a plurality of types of probes are assigned to each color.
- Three types of probes (1st color) having a fluorescent substance having a first fluorescence wavelength are assigned to each of the three types of targets on chromosome 21.
- Three types of probes (2nd color) having a fluorescent substance having a second fluorescence wavelength are assigned to each of the three types of targets on chromosome 18. These chromosomal types are merely examples.
- the PCR reaction system comprises a plurality of probes each having a fluorescent substance having a different fluorescent wavelength, which is assigned to each different region on the sample DNA. These have different target sequences. These probes are mixed with each other in the droplet.
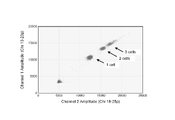
- FIG. 7 shows a scatter plot of fluorescence detection events emitted from the reaction compartment (reaction droplet).
- the clusters 41a to 41c show that the fluorescence intensity was different from the background at any fluorescence wavelength. A shift similar to that in FIG. 5 can be seen.
- the intensity of the first fluorescence wavelength indicates that chromosome 21 is haploid in its entirety or in the portion to be detected.
- the intensity of the second fluorescence wavelength indicates that chromosome 18 is haploid in its entirety or in the part to be detected.
- the intensity of the first fluorescence wavelength indicates that chromosome 21 is triple in its entirety or in the portion to be detected.
- the intensity of the second fluorescence wavelength indicates that chromosome 18 is haploid in its entirety or in the part to be detected.
- the intensity of the first fluorescence wavelength indicates that chromosome 21 is monochromatic in the whole or in the part to be detected. Also, the intensity of the second fluorescence wavelength indicates that chromosome 18 is haploid in its entirety or in the part to be detected.
- each point is shifted from the position of the cluster 41a to the position of the cluster 41b.
- the intensity of the first fluorescence wavelength is increased.
- the intensity of the second fluorescence wavelength does not change.
- Such a shift indicates the presence of a single cell in the cell population that is triplicate in the entire chromosome 21 or in the portion to be detected.
- each point is shifted from the position of the cluster 41a to the position of the cluster 41c.
- the intensity of the first fluorescence wavelength is increased.
- the intensity of the second fluorescence wavelength does not change.
- Such a shift indicates the presence of a single cell in the cell population in which chromosome 21 is monolithic in its entirety or in the area to be detected.
- the magnitude of the shift on these scatter plots may be estimated by preliminary experiments.
- the clusters 44a and 44b shown in FIG. 7 are the same as those shown in FIG. These clusters can be distinguished from the clusters 41a-41c by using a technique for detecting probes with different fluorescence wavelengths in the same droplet. This point is also the same as in FIG.
- the clusters 41a to 41c are more likely to be separated from the cluster 39, the cluster 44a, and the cluster 44b.
- each region includes a plurality of targets to which a plurality of probes having fluorescent substances having the same fluorescence wavelength are assigned to each other. Further, when quantifying the amplicon, the fluorescence from a plurality of probes is collectively measured for each color regardless of the difference in the targets for each region, and the amplicon is quantified. As a result, the fluorescence derived from the assigned region of these targets is enhanced. Therefore, it becomes easier to separate the target signal from the background noise.
- the number of targets in one region is 1 to 1,000. In one embodiment, the number of targets in one region is 1, 2, 3, 4, 5, 6, 7, 8, 9, 10, 11, 12, 13, 14, 15, 16, 17, 18, 19, 20, 21, 22, 23, 24, 25, 26, 27, 28, 29, 30, 31, 32, 33, 34, 35, 36, 37, 38, 39, 40, 41, 42, 43, 44, 45, 46, 47, 48, 49, 50, 51, 52, 53, 54, 55, 56, 57, 58, 59, 60, 61, 62, 63, 64, 65, 66, 67, 68, 69, 70, 71, 72, 73, 74, 75, 76, 77, 78, 79, 80, 81, 82, 83, 84, 85, 86, 87, 88, 89, 90, 91, 92, 93, 94, 95, 96, 97, 98, 99 or 100.
- the number of targets may be uniform or different between regions. In each region, use as many types of probes as there are
- n targets are detected in the same region.
- ⁇ Assignment of 3 or more colors to 3 or more areas> In the above embodiment, two fluorescence wavelengths are used. Further, the number of regions may be increased, and other fluorescence wavelengths may be assigned to the added regions. In one embodiment, a third fluorescence wavelength may be assigned to chromosomes other than chromosomes 18 and 21.
- the number of regions and fluorescence wavelength pairs is 2, 3, 4, 5, 6, 7, 8, 9, 10, 11, 12, 13, 14, 15, 16, 17, 18, 19, 20, 21, 22, 23 or 24. In another embodiment, there is one set of region and fluorescence wavelength.
- fluorescent substance fluorescent dye
- quencher added to the probe is not particularly limited.
- fluorescent materials include FAM, HEX, VIC, TAMRA, ROX, Cy5 and Cy5.5 (all trademarks).
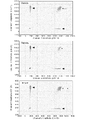
- FIG. 8 shows a plateau droplet scatter.
- One type of probe having a fluorescent substance (FAM) having a first fluorescence wavelength was assigned to one target on chromosome 21.
- one type of probe having a fluorescent substance (HEX) having a second fluorescence wavelength was assigned to one target on chromosome 18. These probes were mixed with each other in one droplet.
- FIG. 8 shows the scatter after single cell-droplet PCR.
- FIG. 8 shows the results of single cell-droplet PCR on a human cultured cell GM22948 strain.
- chromosomes 21 and 18 are ploidy, that is, diploid (solid arrow).
- the solid arrow indicates the center of the cluster.
- Arrowheads are clusters of cell-free DNA. The same applies to the following figure.
- FIG. 8 shows the results of single cell-droplet PCR on human cultured cell AG17487 strain.
- chromosome 21 is triploid (triploidy, broken arrow) and chromosome 18 is ploidy.
- FIG. 8 shows the result of adding the scatters of both stocks. There was no difference in the signal intensity of the droplets between the diploid and triploid of chromosome 21.
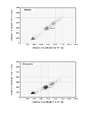
- FIG. 9 shows a droplet scatter during the exponential amplification period. Unlike Test Example 1, the number of PCR cycles was 24. The PCR reaction was in an exponential amplification phase. In other respects, it was the same as Test Example 1.
- FIG. 9 shows the results of single cell-droplet PCR on human cultured cell AG17487 strain.
- FIG. 9 shows the result of adding the scatters of both stocks. There was a difference in the signal intensity of the droplet between the diploid and triploid of chromosome 21. By quantifying the fluorescence of the droplets during the exponential amplification period, it was possible to distinguish between diploid and triploid. Therefore, in the following test examples, the fluorescence intensity of the droplet was measured during the exponential amplification period.
- a plurality of events in which chromosome 21 is haploid and chromosome 21 is haploid or triploid at the upper right of the cluster is a droplet signal containing a plurality of cells. It is thought that it indicates.
- FIG. 10 shows a droplet scatter with enhanced fluorescence.
- eight types of probes having a fluorescent substance having a first fluorescent wavelength were assigned to chromosome 21.
- Eight targets on chromosome 21 were assigned one probe each with a fluorescent substance having a first fluorescent wavelength.
- eight types of probes having a fluorescent substance having a second fluorescent wavelength were assigned to chromosome 18.
- Eight targets on chromosome 18 were assigned one probe each with a fluorescent substance having a second fluorescent wavelength. In other respects, it was the same as Test Example 2.
- FIG. 10 shows the results of single cell-droplet PCR on a human cultured cell GM22948 strain.
- FIG. 10 shows the results of single cell-droplet PCR on human cultured cell AG17487 strain.
- FIG. 10 shows the result of adding the scatters of both stocks.
- the diploid cluster of chromosome 21 and the triploid cluster were more clearly separated. This makes it easier to detect the cluster shift itself. This is because increasing the number of targets in one region corresponding to probes of the same fluorescence wavelength enhances the fluorescence of the droplets and reduces the variation in fluorescence intensity. In the following test examples, fluorescence was enhanced by assigning multiple targets to one region.
- a plurality of events in which chromosome 21 is haploid and chromosome 21 is haploid or triploid in the upper right of the cluster are signals of a droplet containing a plurality of cells. It is thought that it indicates.
- ⁇ Test Example 4 Detection of CNV in Heterogeneous Cell Populations> 11 and 12 show droplet scatters of heterozygous cell populations.
- FIG. 13 shows a droplet scatter of a homozygous cell population. Chr13-8p on the vertical axis indicates that eight types of probes are assigned to eight targets on chromosome 13. Chr18-8p on the horizontal axis indicates that eight types of probes are assigned to eight targets on chromosome 18. These probes were mixed with each other in one droplet.
- FIG. 13 shows the results of single cell-droplet PCR on a human cultured cell GM22948 strain.
- chromosomes 13 and 18 are ploidy, that is, diploid (solid arrow).
- FIG. 13 shows the results of single cell-droplet PCR on human cultured cell NCI-H929 strain.
- chromosome 13 is haploid (Monoploidy, arrow with a broken line), and chromosome 18 is haploid.
- FIG. 14 shows the result of adding the scatters of both stocks. There was a difference in the signal intensity of the droplets between haploid and haploid chromosome 13. By quantifying the fluorescence of the droplets during the exponential amplification period, it was possible to distinguish between haploid and haploid.
- FIG. 14 shows the scatter of the droplet of the heterozygous cell population.
- Human cultured cell GM22948 strain (Diploidy) and human cultured cell NCI-H929 strain (Monoploidy) were mixed to obtain a heterogeneous cell population. The mixing ratio was 50/50. Single cell-droplet PCR was performed on these cell populations. The shift of clusters from diploid to haploid reflected the ratio of cell numbers.
- a PCR reaction was prepared by adding 10000 cells (GM22948 strain or GM13721 strain) and 2 ⁇ L of cell suspension containing PBS to a PCR premix containing sodium dodecyl sulfate.
- concentrations of primers and probes in the PCR reaction solution are as follows. ⁇ 1X ddPCR Multiplex Super Mix (BioRad) ⁇ 500nM / 575nM chromosome 13-FAM probe ⁇ 1 ⁇ M chromosome 13 primer ⁇ 1000nM / 1250nM chromosome 18-HEX probe ⁇ 1 ⁇ M chromosome 18 primer ⁇ Distilled water (for female up)
- the above PCR reaction solution was made into droplets using QX200 Droplet Generator (BioRad), and cells were further lysed in each droplet. Then, PCR was performed in each droplet under general conditions. The number of PCR cycles was 23. The PCR reaction was in an exponential amplification phase.
- 1, 5, 10 or 23 types of probes having the first fluorescent wavelength fluorescent substance (FAM) were assigned to chromosome 13.
- One probe each having a fluorescent substance having a first fluorescence wavelength was assigned to targets 1, 5, 10 or 23 on chromosome 13.
- the concentration of each probe is the same, and the concentration of the above-mentioned probe (1, 5 or 10 types: 500 nM, 23 types: 575 nM) is the total concentration of the plurality of types of probes.
- 1, 5, 10 or 25 types of probes having a fluorescent substance (HEX) having a second fluorescence wavelength were assigned to chromosome 18.
- One probe each with a fluorescent substance having a second fluorescence wavelength was assigned to targets 1, 5, 10 or 25 on chromosome 18.
- concentration of each probe is the same, and the concentration of the above-mentioned probe (1, 5 or 10 types: 1000 nM, 25 types: 1250 nM) is the total concentration of the plurality of types of probes.
- FIGS. 15-18 show the droplet scatter in the exponential amplification period.
- FIGS. 15 to 18 shows the results of single cell-droplet PCR on the human cultured cell GM22948 strain.
- chromosomes 13 and 18 are ploidy, that is, diploid (solid arrow).
- the solid arrow indicates the center of the cluster.
- FIGS. 15 to 18 shows the results of single cell-droplet PCR on the human cultured cell GM13721 strain.
- a part of one long arm of chromosome 13 is haploid (Monoploidy, broken arrow), and chromosome 18 is haploid. All the probes having the fluorescent substance (FAM) having the first fluorescent wavelength are assigned to the defective region of chromosome 13.
- FAM fluorescent substance
- FIG. 15 shows the results when one type of probe is assigned to each of chromosome 13 and chromosome 18.
- FIG. 16 shows the results when 5 types of probes are assigned to chromosomes 13 and 18 respectively.
- FIG. 17 shows the results when 10 types of probes are assigned to chromosomes 13 and 18 respectively.
- FIG. 18 shows the results when 23 types of probes are assigned to chromosome 13 and 25 types of probes are assigned to chromosome 18.
- a plurality of events existing in the upper right of a cluster in which chromosome 18 is haploid and chromosome 13 is haploid or haploid is a drop containing a plurality of cells. It is thought to indicate the signal of the let.
- the difference in the number of copies is obtained by increasing the number of targets in one region corresponding to the probes of the same fluorescence wavelength. Can be determined more easily.
- FIG. 19 is a box plot for each scatter.
- FIG. 20 shows the GM22948 strain (cells having a doubled chromosome 13) and the GM13728 strain (cells having a doubled chromosome 13) using "FAM / HEX" when 23 types of probes are used as explanatory variables.
- the result of ROC analysis of the ability to detect the GM13728 strain (cells having a single chromosome 13) from the cell population containing the above is shown.
- the Yoden Index was 0.743.
- the sensitivity when cut off by Yoden Index was 0.997 (99.7%), and the specificity was 0.994 (99.4%).
- the AUC was 0.997 (95% CI: 0.996 to 0.999), which was an extremely high value.
- ploidy measurements are made by an internal standard.
- cells that are positive polyploid in the region of interest are the internal standard for CNV.
- Test Example 4 and the latter half of Test Example 5 the number of copies of the region to be detected in the heterozygous cell population was measured.
- the proportion of cells that are positive polyploid in the assigned region of the target is greater than 0% and less than 100%.
- the ratio of cells that are positive polyploid in a heterogeneous population is, for example, 0.01, 0.02, 0.03, 0.04, 0.05, 0.1, 0.2, 0.3, 0.4, 0.5, 1, 2, 3, 4, 5, 10, 15, 20, 25, 30, 40, 50, 60, 70, 75, 80, 85, 90, 95, 96, 97, 98, 99, 99.5, 99.6, 99.7, 99.8, 99.9, 99.95, 99.96, 99.97, 99.98 or 99.99%.
- the composition ratio of cells with CNV of interest in the assigned region of the target is greater than 0% and less than 100%.
- the ratio of cells with CNV in a heterogeneous population is, for example, 99.99, 99.98, 99.97, 99.96, 99.95, 99.9, 99.8, 99.7, 99. 6, 99.5, 99, 98, 97, 96, 95, 90, 85, 80, 75, 70, 60, 50, 40, 30, 25, 20, 15, 10, 5, 4, 3, 2, 1, 0.5, 0.4, 0.3, 0.2, 0.1, 0.05, 0.04, 0.03, 0.02 or 0.01%.
- ploidy measurement is performed by an external standard.
- PCR is performed simultaneously or before and after using the genomic DNA of cells whose ploidy is known in advance as a template, and the fluorescence intensity of the amplicon is measured.
- the coordinates of the cluster obtained from the fluorescence intensity are compared with the coordinates of the sample cluster.
- Examples of such external standard test examples are the upper (diploid) and middle (triploid) of FIG. 9, the upper (diploid) and middle (triploid) of FIG. 10, and the upper (triploid) of FIG. It is shown in (diploid) and lower (ploid).
- aneuploidy cluster it is a homogeneous population of cells having a specific ploidy of the region to be measured. Alternatively, it becomes a heterogeneous population of cells with various ploidies.
- the ploidy of the genome of a tumor cell of a cancer patient is measured using an external standard of ploidy.
- an external standard cell polyploidy can be measured without relying on the internal standard of positive ploidy cells (healthy non-cancerous cells) that should originally be included in the cell population. .. More accurate information on these ploidies can help determine the need for treatment in cancer treatment or to make a diagnosis of complete remission.
- fetal cells in amniotic fluid as an example. If the fetal cells in the amniotic fluid are not contaminated with maternally derived cells, then only fetal cells are included in the normal population of such cells.
- the cell population is a homogenic population with respect to genomic ploidy.
- the ploidy of the fetal cell genome is measured with a ploidy external standard.
- a ploidy external standard cell polyploidy can be measured without relying on an internal standard of positive ploidy cells that should originally be included in the cell population, in this case maternal origin cells. ..
- the population of the fetal cells is heterogeneous or homozygous with respect to the ploidy of the genome by using the above measurement method. You can find out if it is a genius. That is, the presence or absence of a polyploid mosaic of the chromosomes of fetal cells can be confirmed.
- the number of copies of the genomic region to be measured and the center of the fluorescence intensity of the cluster have a very clear linear relationship. Therefore, it is not necessary to obtain fluorescence intensity from external standard cells each time a sample is measured. That is, the ploidy of the region to be measured in the genome of the sample can be determined by comparing the information on the fluorescence intensity of the external standard obtained in advance with the information on the fluorescence intensity of the sample.
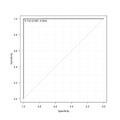
- FIG. 21 shows a scatter including a straight line corresponding to the cutoff value to be set in this test example.
- a cell in which a part of one long arm of chromosome 13 is haploid (Monoploidy) and a cell in which chromosome 13 is diploid (Diploidy) are separated.
- a PCR reaction was prepared by adding 10000 cells (GM22948 strain) and 2 ⁇ L of cell suspension containing PBS to a PCR premix containing sodium dodecyl sulfate.
- concentrations of primers and probes in the PCR reaction solution are as follows. ⁇ 1X ddPCR Multiplex Super Mix (BioRad) 25nM Chromosome 13-FAM probe x 23 types (total concentration: 575nM) ⁇ 1 ⁇ M Chromosome 13 primer x 23 types ⁇ 50 nM Chromosome 18-HEX probe x 25 types (total concentration: 1250 nM) ⁇ 1 ⁇ M chromosome 18 primer x 25 types ⁇ Distilled water (for volumetric flask)
- the above PCR reaction solution was made into droplets using QX200 Droplet Generator (BioRad), and cells were further lysed in each droplet. Then, PCR was performed in each droplet under general conditions. The number of PCR cycles was 23. The PCR reaction was in an exponential amplification phase. PCR was performed separately using the 23 above PCR reaction solutions prepared separately.
- FIG. 22 shows the displacement of the cluster for each measurement.
- the upper and middle rows of FIG. 22 show the results of single cell-droplet PCR on the human cultured cell GM22948 strain.
- chromosomes 13 and 18 are ploidy, that is, diploid (solid arrow).
- solid arrow shows the direction in which each cluster shifts.
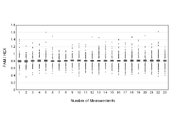
- the lower part of FIG. 22 is a graph showing the variation in the measured values when the measurement is performed 23 times.
- FAM / HEX is used as the measured value.
- the measurement results vary.
- the median fluorescence intensity of the first fluorescence wavelength (FAM) of the negative cluster (the cluster located at the lower left in the scatter) (hereinafter also referred to as “FAM measurement value”).
- the median fluorescence intensity of the second fluorescence wavelength (HEX) (hereinafter also referred to as “HEX measurement value”) was calculated.
- the average value of the FAM measurement values of 23 was used as the FAM reference value of the negative cluster, and the average value of the HEX measurement values of 23 was used as the HEX reference value of the negative cluster.
- FIG. 23 is a graph showing variations in measured values after correction.
- the measurement numbers correspond to the lower graph in FIG. 22. It can be seen that the variation in the measurement results (cluster shift) is significantly reduced. The cutoff value was set using these corrected measurements.
- FIG. 24 is a diagram illustrating the calculation of the cutoff value using the corrected measured value.
- the upper part of FIG. 24 is a scatter showing 95341 corrected measured values.
- Each measured value was substituted into x (fluorescence intensity of the second fluorescence wavelength (HEX)) and y (fluorescence intensity of the first fluorescence wavelength (FAM)) to obtain the value of b for each measured value.
- the graph in the middle of FIG. 24 shows the calculated distribution of 95341 b values. This time, with an emphasis on specificity, the value corresponding to -3SD (standard deviation) of the distribution shown in this graph was set for cells with haploid chromosome 13 and cells with haploid chromosome 13. The cutoff value to be divided was used.
- Table 1 shows the results of determining the measurement results using the obtained cutoff values. From a cell population containing GM22948 strain (cells with doubled chromosome 13) and GM13721 strains (cells with doubled chromosome 13), GM13721 strain (partial region of one long arm of chromosome 13 is multiplied by 1). The sensitivity for detecting sex cells) was 84.1%, and the specificity was 99.3%. As described above, the cutoff value set this time emphasizes specificity, and it is of course possible to set the cutoff value with an emphasis on sensitivity.
- the cutoff value setting method is not limited to the above example.
- ROC analysis may be used to calculate the cutoff value that maximizes sensitivity and specificity.
- ⁇ Mutation detection> by detecting CNV, the presence of a single cell with a mutation is detected in the cell population.
- the mutation is a somatic mutation or a germ cell mutation.
- the mutation is a chromosomal or gene mutation.
- chromosomal mutation when the sample DNA contains a set of genomic DNA in a single cell, the presence of a single cell with a chromosomal mutation is detected in the cell population by detecting CNV from the quantitative results of PCR amplicon. do.
- the chromosomal mutation is at least one of full-length aneuploidy of the chromosome, partial aneuploidy of the chromosome, gene amplification and gene deletion.
- FIGS. 4 to 7 described above are aspects of detecting aneuploidy over the entire length of a chromosome.
- Gene amplification is the proliferation of genes due to partial duplication of chromosomes. In one aspect, there is no limit to the number of times duplication occurs.
- Gene deletion is the loss of a gene due to a partial deletion of the chromosome. In one embodiment, the gene deletion is haplo or null. In one embodiment, gene amplification and gene deletion are polymorphic.
- the cell population is contaminated with positive polyploid cells.
- Populations of cells contain normal single cells without chromosomal mutations at target genomic locations.
- One of the single cells assigned to each of the reaction compartments (reaction droplets) described above has a ploidy chromosome in the region targeted for aneuploidy detection.
- reaction droplets reaction droplets
- single-cell clusters with chromosomal mutations shift from the location of the clusters produced by normal single-cells.
- the cluster 40a shown in FIG. 5 and the cluster 41a shown in FIG. 7 described above are examples of the shift.
- the cluster 40a functions as a kind of internal standard.
- the ploidy of the cluster can be absolutely quantified by using the above-mentioned external standard.
- External standards can also be applied to heterogeneous cell populations consisting of positive polyploid cells and aneuploid cells.
- Detect reaction droplets that lead to an amplicon amount that is different from the amplicon amount of a single cell reaction droplet that does not have a chromosomal mutation at a position on the target genome Hereinafter, this is referred to as an aneuploidy droplet.
- the clusters 40b and 40c shown in FIG. 5 and the clusters 41b and 41c shown in FIG. 7 described above are examples of detection.
- chromosomal mutations that give rise to aneuploidy droplets are: That is, a single cell having a detectable chromosomal mutation comprises, for example, genomic DNA having any of the following chromosomal mutations: -Chromosome 21 variability-Chromosome 18 variability-Chromosome 13 variability-Y chromosome variability-X chromosome anequality-Chromosome 22 long arm 22q11.2 region deficiency Loss-Chromosome 5 short arm 5q region deletion-Chromosome 15 long arm 15q11-q13 region deletion-Chromosome 1 long arm amplification-Chromosome 17 short arm deletion-Chromosome 13 long arm missing Loss-Deletion of Chromosome 4 Long Arm-Deletion of Chromosome 5 Long Arm-Deletion of Chromosome 7 Long Arm-Amplification of Chromosome 8-Deletion of Chromosome 11-Difference of Chromosome 12- Chromosome 20 long arm deletion-Chromosome 19
- both allelic deletions are excluded from the deletions.
- the detection target is a pair of a chromosome in which a part thereof is deleted and a chromosome in which the part is normal.
- a single cell is obtained from either amniotic fluid or maternal blood.
- a population of bulk cells is obtained from amniotic fluid or maternal blood.
- Populations of cells include fetal cells.
- fetal cells in a cell population are enriched.
- Populations of cells include maternal cells.
- the maternal cell is positive polyploid in the region on the genomic DNA to be detected.
- the fetal cell is a fetal nucleated red blood cell (fetal nucleated erythroblast, fNRBC) that circulates in the maternal blood
- the maternal cell is a leukocyte that circulates in the maternal blood.
- the fetal cell is a fetal cell that floats in amniotic fluid
- the maternal cell is a maternal cell that floats in amniotic fluid.
- the data are diagnostics of trisomy 13, trisomy 18, trisomy 21, Turner syndrome, trisomy X syndrome, XYY syndrome, Klinefelter syndrome, Di George syndrome, Angelman syndrome, Prader Willy syndrome, or cat snarling syndrome. It is intended to be used for.
- a single cell is obtained from the blood of a cancer patient.
- a population of bulk cells is isolated from the blood of a cancer patient.
- Populations of cells include cancer cells consisting of at least one of peripheral circulating tumor cells (CTCs) and cancerous blood cells.
- the cell population is a cell obtained by biopsying a solid tumor and further dispersing it with a given chemical and / or physical treatment.
- the cancerous blood cells are cancerous plasma cells.
- these cancer cells in a cell population are enriched.
- Populations of cells further include cells that are not cancer cells.
- cells that are not cancer cells are positive polyploid in the region on genomic DNA to be detected.
- non-cancerous cells are normal white blood cells that circulate in the blood of a cancer patient.
- normal leukocytes are normal plasma cells.
- the data include myelodystrophy syndrome, multiple myeloma, idiopathic eosinophilia, chronic eosinophil leukemia, acute non-lymphocytic leukemia, myeloid proliferative tumor, chronic lymphocytic leukemia, acute bone marrow.
- sexual leukemia brain tumor, neuroblastoma, colon cancer, breast cancer, ovarian cancer, cervical cancer, uterine body cancer, small cell lung cancer, non-small cell lung cancer, bladder cancer, kidney cancer, liver cancer, pancreatic cancer, esophageal cancer, It is used for the diagnosis of thyroid cancer or head and neck cancer.
- multiple myeloma is a type of hematopoietic tumor and is a disease in which plasma cells become tumorous. Chromosomal abnormalities are found in the majority of cases of MM. Trisomy has been frequently reported on chromosomes 3, 5, 7, 9, 11, 15, and 19. Monosomy is frequently found on chromosomes 13, 14, 16 and 22. Of these, the monosomy of chromosome 13 and the deletion of the long arm of chromosome 13 (13q deletion) are examples of the most frequent chromosome mutations. These chromosomal mutations are found in about 50% of new patients.
- the amount of tumor remaining in patients with these chromosomal abnormalities is monitored. Specifically, in the post-treatment period, the extent to which plasma cells having these chromosomal mutations (carcinogenic plasma cells) remain in the body is periodically measured.
- MRD minimal residual disease
- the sample is cerebrospinal fluid or blood collected from a patient. Remove red blood cells from these liquids. Hemolysis, centrifugation and hydraulic classification chips are used to remove red blood cells.
- the probe-primer set to be detected is selected to have a target in the region of 13q.
- the control probe-primer set is selected to have a target anywhere on chromosome 18.
- 13q deletion of chromosome 13, that is, partial unipolarization is detected by cluster shift as shown in FIGS. 5 and 7. Events within the cluster have a fluorescence intensity distribution. Combined with the required statistical analysis, cells with a 13q deletion on chromosome 13 present in the 0-100% range of the sample cell population are detected. In one embodiment, the abundance ratio of cells with a 13q deletion on chromosome 13 detected is 10, 1, 0.1, 0.05, 0.04, 0.03, 0.02 in the sample cell population. And either 0.01%. As mentioned above, cells lacking 13q on chromosome 13 are expected to be cancerous plasma cells. In another embodiment, the target is assigned to a region where both the 13q deletion and the monosomy of chromosome 13 can be detected.
- plasma cells including circulating tumor cells, are enriched using an antibody against an antigen specific to the plasma cells before being subjected to measurement.
- cancerous plasma cells present in cerebrospinal fluid or blood that is, plasma cells forming tumors, are detected with higher sensitivity.
- information is obtained from the cluster shift whether the cells in the sample have at least one of 17p13 deletion and 1q21 amplification. This information is useful in predicting the prognosis of MM.
- Myelodysplastic syndrome is a type of hematopoietic tumor. At least 50% of MDS is caused by chromosomal mutations that occur in hematopoietic stem cells, specifically, aneuploidy over the entire length of the chromosome, partial aneuploidy of the chromosome, gene amplification, and gene deletion. Typical MDS chromosome mutations are the deletion of the long arm of chromosome 5 (5q), the monosomy of chromosome 7 and the deletion of the long arm of chromosome 20 (20q). MRD is measured regularly by detecting cells with chromosomal mutations present in the sample.
- detection of chromosomal aneuploidy is performed by shifting the above clusters.
- CNV is detected to detect the presence of a single cell carrying a gene mutation.
- a gene mutation is at least one of base substitution, base insertion and base deletion.
- any of the single cells assigned to each of the above reaction compartments is an internal standard that does not have a gene mutation to be detected, at least at a position on the target genome.
- the clusters of reaction droplets that lead to having an amount of amplicon different from the amount of amplicon of such reaction droplets shift from the position of the cluster without the gene mutation. These are detected as mutant droplets.
- the fluorescence intensity of the external standard is measured in advance at another well or at another time.
- the information on the fluorescence intensity is compared with the information on the fluorescence intensity at the center of each cluster. Based on such comparisons, the number of copies of gene mutations in each cluster is measured. The number of copies of a gene mutation can be measured even when the cell population is occupied by cells that have undergone gene mutation and cells having only wild-type genes cannot be used as an internal standard.
- a gene mutation is introduced into an unspecified region of the genome by a lentiviral vector or other vector.
- cells having a gene mutation caused by a vector are CAR-T cells (Chimeric antigen receptor T cells) and TCR-T cells.
- the target may be DNA introduced by the vector.
- the number of copies of DNA introduced by the vector may be detected.
- PCR reaction solution Peripheral blood of a healthy subject was hemolyzed and added to a PCR premix to prepare a PCR reaction solution.
- the above PCR reaction solution was made into droplets using a QX200 Droplet Generator (BioRad), and cells were further lysed in each droplet. Then, PCR was performed in each droplet under general conditions. The number of PCR cycles was 23. The PCR reaction was in an exponential amplification phase.
- FIG. 25 shows the results of single cell-droplet PCR on human blood.
- the cluster in the center is the measurement result corresponding to the droplet containing one cell.
- the cluster in the upper right is the measurement result corresponding to the droplet containing two cells.
- the peripheral blood of a healthy subject was hemolyzed, and CD45-positive cells were isolated using EasySep Human CD45 Depletion Kit II (STEMCELL Technologies).
- the obtained CD45 cells were added to the PCR premix to prepare a PCR reaction solution.
- the above PCR reaction solution was made into droplets using QX200 Droplet Generator (BioRad), and cells were further lysed in each droplet. Then, PCR was performed in each droplet under general conditions. The number of PCR cycles was 23. The PCR reaction was in an exponential amplification phase.
- FIG. 26 shows the results of single cell-droplet PCR on CD45 cells derived from human blood.
- the cluster in the center is the measurement result corresponding to the droplet containing one cell.
- the cluster in the upper right is the measurement result corresponding to the droplet containing two cells.
- a cell population obtained by mixing the above CD45-positive cells and cells of the human cultured cell GM13721 strain at a predetermined ratio was added to the PCR premix to prepare a PCR reaction solution.
- the above PCR reaction solution was made into droplets using QX200 Droplet Generator (BioRad), and cells were further lysed in each droplet. Then, PCR was performed in each droplet under general conditions. The number of PCR cycles was 23. The PCR reaction was in an exponential amplification phase.
- chromosomes 13 and 18 are ploidy, or diploidy.
- a part of one long arm of chromosome 13 is monoploidy
- chromosome 18 is positive polyploid.
- FIG. 27 shows a droplet scatter of a homozygous cell population.
- the upper part of FIG. 27 shows the results of single-cell-droplet PCR on CD45-positive cells.
- the lower part of FIG. 27 shows the results of single cell-droplet PCR on human cultured cell GM13721 strain.
- FIG. 28 shows a droplet scatter of a heterozygous cell population.
- the upper part of FIG. 28 shows the results of single cell-droplet PCR on a cell population in which the mixing ratio of CD45-positive cells and human cultured cell GM13721 strain is 75/25.
- the lower part of FIG. 28 shows the results of single cell-droplet PCR on a cell population in which the mixing ratio of CD45-positive cells and human cultured cell GM13721 strain is 95/5.
- ⁇ Test Example 9 Evaluation of detection sensitivity when using human specimens> A cell population in which CD45-positive cells and cells of the human cultured cell GM13721 strain were mixed at a predetermined ratio was prepared by the same procedure as in Test Example 8. The proportion of cells of the GM13721 strain in the cell population was 0%, 0.1% or 3%. Each cell population was added to the PCR premix to prepare a PCR reaction solution. The above PCR reaction solution was made into droplets using a QX200 Droplet Generator (BioRad), and cells were further lysed in each droplet. Then, PCR was performed in each droplet under general conditions. The number of PCR cycles was 23. The PCR reaction was in an exponential amplification phase.
- BioRad QX200 Droplet Generator
- chromosomes 13 and 18 are ploidy, or diploidy.
- a part of one long arm of chromosome 13 is monoploidy, and chromosome 18 is positive polyploid.
- FIG. 29 shows the droplet scatter of each cell population.
- the upper part of FIG. 29 shows the results of single-cell-droplet PCR on a cell population in which the proportion of cells of the GM13721 strain is 0%.
- the middle part of FIG. 29 shows the results of single-cell-droplet PCR on a cell population in which the proportion of cells of the GM13721 strain was 0.1%.
- the lower part of FIG. 29 shows the results of single-cell-droplet PCR on a cell population in which the proportion of cells of the GM13721 strain is 3%.
- dots having a fluorescence intensity of 5000 or more at the first fluorescence wavelength (FAM) or a fluorescence intensity of 9000 or more at the second fluorescence wavelength (HEX) were designated as positive droplets to be evaluated.
- FIG. 30 is a boxplot showing the detection results of abnormal droplets for each cell population.
- Asterisks indicate p ⁇ 0.05 (results of the Steel test compared to the controls (0%), respectively, after confirming that the results of the Kruskal-Wallis test were significant). From this graph, it can be seen that the detection result of the cell population having a cell ratio of GM13721 strain of 3% or 0.1% is significantly different from the detection result of the cell population having a cell ratio of GM13721 strain of 0%. Therefore, it can be seen that at least 0.1% can be detected.
- RNA reverse transcriptase Using the reverse transcriptase of RNA in a single cell as sample DNA, the number of copies of B2M gene mRNA and the number of copies of GAPDH gene mRNA were detected.
- single cell-droplet RT-PCR was performed on the human cultured cell GM22948 strain.
- the premix includes a primer for the B2M gene, a primer for the GAPDH gene, a probe for the B2M gene (FAM-labeled), a probe for the GAPDH gene (HEX-labeled), a reverse transcriptase (SuperScriptIV), and the like. Primers for both genes were designed to sandwich an intron in order to amplify the mRNA of that gene by PCR rather than the gene in genomic DNA.
- PCR reaction solution 10000 cells (GM22948 strain) and 2 ⁇ L of a cell suspension containing PBS were added to a PCR premix containing sodium dodecyl sulfate to prepare a PCR reaction solution.
- concentrations of primers and probes in the PCR reaction solution are as follows. ⁇ 1X SuperScriptIV (Thermo Fisher Scientific) ⁇ 1X ddPCR Multiplex Super Mix (BioRad) ⁇ 200nM B2M-FAM probe ⁇ 400nM B2M primer ⁇ 200nM GAPDH-HEX probe ⁇ 400nM GAPDH primer ⁇ Distilled water (for volumetric flask)
- PCR reaction solution is made into droplets using QX200 Droplet Generator (BioRad), cells are further lysed in each droplet, allowed to stand at 50 ° C. for 10 minutes for reverse transcription, and DNA at 95 ° C. for 10 minutes. After denaturing, PCR was performed under general conditions. The number of PCR cycles was 23. The PCR reaction was in an exponential amplification phase.
- QX200 Droplet Generator BioRad
- FIG. 31 shows the results of single cell-droplet RT-PCR performed on the human cultured cell GM22948 strain. From this result, it can be seen that the number of copies of RNA can be detected even when a reverse transcriptase of RNA is used as the sample DNA.
- the premix did not contain reverse transcriptase, no positive droplets were detected. That is, as described above, since the primers were designed so as to sandwich the intron, both genes in the genomic DNA were hardly amplified.
- single cell-droplet PCR was performed on the GM22948 strain of cultured human cells. Each droplet contains genomic DNA as well as mitochondrial DNA within a single cell.
- the premix includes a primer for chromosome 13 (23 types), a primer for the ND1 gene of mitochondrial DNA, a probe for chromosome 13 (23 types, FAM label), a probe for the ND1 gene (HEX label), and the like.
- PCR reaction solution 10000 cells (GM22948 strain) and 2 ⁇ L of a cell suspension containing PBS were added to a PCR premix containing sodium dodecyl sulfate to prepare a PCR reaction solution.
- concentrations of primers and probes in the PCR reaction solution are as follows. ⁇ 1X ddPCR Multiplex Super Mix (BioRad) ⁇ 25nM chromosome 13-FAM probe ⁇ 1 ⁇ M chromosome 13 primer ⁇ 500nM ND1-HEX probe ⁇ 1 ⁇ M ND1 primer ⁇ Distilled water (for volumetric flask)
- the above PCR reaction solution is made into droplets using QX200 Droplet Generator (BioRad), cells are further lysed in each droplet, DNA is denatured at 95 ° C. for 10 minutes, and then PCR is performed under general conditions. rice field. The number of PCR cycles was 23. The PCR reaction was in an exponential amplification phase.
- FIG. 32 shows the results of single cell-droplet PCR on human cultured cell GM22948 strain.
- the cluster slightly to the right of the center is the measurement result corresponding to the droplet containing one cell (containing about 1X mitochondrial DNA).
- the cluster in the upper right is the measurement result corresponding to the droplet containing 2 cells (containing about 2X mitochondrial DNA).
- the clusters shifted to the right From this result, it can be seen that the number of copies of the gene in the mitochondrial DNA can be detected even if the mitochondrial DNA is used as the sample DNA.
- control is assigned to the area where the CNV is poor and considered to be positive polyploid. It may not be possible to find a suitable chromosome as a control in cells with frequent chromosomal abnormalities, such as cancer cells.
- mitochondrial DNA may be used as a control. That is, one of the fluorescence wavelengths is selected, and a probe having a fluorescent substance having the selected fluorescence wavelength is assigned to the mitochondrial DNA.
- the sample DNA contains a set of genomic DNA in a single cell and mitochondrial DNA in a single cell.
- the PCR reaction system includes a probe having a first fluorescence wavelength fluorescent material assigned to a region on the genomic DNA and a probe having a second fluorescence wavelength fluorescent material assigned to the mitochondrial DNA.
- the region comprises one or more targets.
- the targets contained in the genomic DNA set and the targets contained in the mitochondrial DNA are amplified by PCR.
- the amplicon of the genomic DNA and the mitochondrial DNA is quantified for each reaction compartment.
- the cell-free nucleic acid contaminated with the reaction compartment in which the target contained in the genomic DNA and the target contained in the mitochondrial DNA are amplified. Only amplified reaction compartments can be distinguished.
- amplification using mitochondrial DNA as a template proceeds at an early stage. Therefore, the primer or probe is depleted early. This is because the number of copies of mitochondrial DNA per cell is larger than the number of copies of genomic DNA per cell. Therefore, PCR is stopped at the number of cycles that reach the plateau for mitochondrial DNA. However, in the number of cycles, the amplification using the genomic DNA of the chromosome as a template is in the exponential amplification period.
- the detection method of the present invention is useful for, for example, prenatal diagnosis and cancer diagnosis.
Abstract
Priority Applications (6)
| Application Number | Priority Date | Filing Date | Title |
|---|---|---|---|
| CA3206327A CA3206327A1 (fr) | 2020-12-25 | 2021-12-22 | Procede de detection du nombre de copies d'un acide nucleique specifique par cellule unique |
| JP2022571563A JPWO2022138736A1 (fr) | 2020-12-25 | 2021-12-22 | |
| US18/258,836 US20240043929A1 (en) | 2020-12-25 | 2021-12-22 | Method for detecting copy number of specific nucleic acid per single cell |
| KR1020237020216A KR20230107662A (ko) | 2020-12-25 | 2021-12-22 | 싱글 셀마다의 특정 핵산의 카피수의 검출 방법 |
| CN202180086085.8A CN116802314A (zh) | 2020-12-25 | 2021-12-22 | 每个单细胞的特定核酸的拷贝数的检测方法 |
| EP21910876.8A EP4269614A1 (fr) | 2020-12-25 | 2021-12-22 | Procédé de détection du nombre de copies d'un acide nucléique spécifique par cellule unique |
Applications Claiming Priority (2)
| Application Number | Priority Date | Filing Date | Title |
|---|---|---|---|
| JP2020216149 | 2020-12-25 | ||
| JP2020-216149 | 2020-12-25 |
Publications (1)
| Publication Number | Publication Date |
|---|---|
| WO2022138736A1 true WO2022138736A1 (fr) | 2022-06-30 |
Family
ID=82157024
Family Applications (1)
| Application Number | Title | Priority Date | Filing Date |
|---|---|---|---|
| PCT/JP2021/047619 WO2022138736A1 (fr) | 2020-12-25 | 2021-12-22 | Procédé de détection du nombre de copies d'un acide nucléique spécifique par cellule unique |
Country Status (8)
| Country | Link |
|---|---|
| US (1) | US20240043929A1 (fr) |
| EP (1) | EP4269614A1 (fr) |
| JP (1) | JPWO2022138736A1 (fr) |
| KR (1) | KR20230107662A (fr) |
| CN (1) | CN116802314A (fr) |
| CA (1) | CA3206327A1 (fr) |
| TW (1) | TW202239967A (fr) |
| WO (1) | WO2022138736A1 (fr) |
Cited By (1)
| Publication number | Priority date | Publication date | Assignee | Title |
|---|---|---|---|---|
| CN116356005A (zh) * | 2023-04-28 | 2023-06-30 | 宁波熙宁检测技术有限公司 | 一种检测car-t细胞拷贝数的组合物及其用途 |
Citations (8)
| Publication number | Priority date | Publication date | Assignee | Title |
|---|---|---|---|---|
| US20140134613A1 (en) * | 2009-12-22 | 2014-05-15 | The Board Of Trustees Of The Leland Stanford Junior University | Direct Molecular Diagnosis of Fetal Aneuploidy |
| JP2014533509A (ja) | 2011-11-17 | 2014-12-15 | セルスケープ・コーポレーション | 細胞を取得し、解析するための方法、装置及びキット |
| JP2015508655A (ja) * | 2012-02-14 | 2015-03-23 | コーネル ユニバーシティー | 組み合わせたヌクレアーゼ反応、連結反応、およびポリメラーゼ反応を用いて核酸配列、発現、またはコピー変化を相対的に定量するための方法 |
| JP2015533079A (ja) * | 2012-08-13 | 2015-11-19 | ザ リージェンツ オブ ザ ユニバーシティ オブ カリフォルニア | 生物学的成分を検出するための方法およびシステム |
| WO2018025856A1 (fr) * | 2016-08-02 | 2018-02-08 | 学校法人武庫川学院 | Procédé de dépistage génétique simple, procédé de mesure du nombre de copies, et technologie de support associée |
| WO2018123220A1 (fr) * | 2016-12-27 | 2018-07-05 | 株式会社 TL Genomics | Procédé d'obtention d'acides nucléiques de cellules foetales |
| JP2020000011A (ja) * | 2018-06-25 | 2020-01-09 | 株式会社理研ジェネシス | ゲノムdna中の標的領域のコピー数検出方法及び試薬キット |
| WO2021200749A1 (fr) * | 2020-04-01 | 2021-10-07 | 株式会社 TL Genomics | Procédé de détection du nombre de copies d'un chromosome de cellule ou d'une partie de celui-ci |
Family Cites Families (1)
| Publication number | Priority date | Publication date | Assignee | Title |
|---|---|---|---|---|
| KR20180102242A (ko) | 2017-03-06 | 2018-09-17 | 주식회사 우리은행 | 금융 자동화 기기의 비대면 채널 사용자 인증 방법 및 시스템 |
-
2021
- 2021-12-22 WO PCT/JP2021/047619 patent/WO2022138736A1/fr active Application Filing
- 2021-12-22 EP EP21910876.8A patent/EP4269614A1/fr active Pending
- 2021-12-22 JP JP2022571563A patent/JPWO2022138736A1/ja active Pending
- 2021-12-22 US US18/258,836 patent/US20240043929A1/en active Pending
- 2021-12-22 CA CA3206327A patent/CA3206327A1/fr active Pending
- 2021-12-22 CN CN202180086085.8A patent/CN116802314A/zh active Pending
- 2021-12-22 KR KR1020237020216A patent/KR20230107662A/ko active Search and Examination
- 2021-12-23 TW TW110148433A patent/TW202239967A/zh unknown
Patent Citations (9)
| Publication number | Priority date | Publication date | Assignee | Title |
|---|---|---|---|---|
| US20140134613A1 (en) * | 2009-12-22 | 2014-05-15 | The Board Of Trustees Of The Leland Stanford Junior University | Direct Molecular Diagnosis of Fetal Aneuploidy |
| JP2014533509A (ja) | 2011-11-17 | 2014-12-15 | セルスケープ・コーポレーション | 細胞を取得し、解析するための方法、装置及びキット |
| JP2015508655A (ja) * | 2012-02-14 | 2015-03-23 | コーネル ユニバーシティー | 組み合わせたヌクレアーゼ反応、連結反応、およびポリメラーゼ反応を用いて核酸配列、発現、またはコピー変化を相対的に定量するための方法 |
| JP2015533079A (ja) * | 2012-08-13 | 2015-11-19 | ザ リージェンツ オブ ザ ユニバーシティ オブ カリフォルニア | 生物学的成分を検出するための方法およびシステム |
| WO2018025856A1 (fr) * | 2016-08-02 | 2018-02-08 | 学校法人武庫川学院 | Procédé de dépistage génétique simple, procédé de mesure du nombre de copies, et technologie de support associée |
| WO2018123220A1 (fr) * | 2016-12-27 | 2018-07-05 | 株式会社 TL Genomics | Procédé d'obtention d'acides nucléiques de cellules foetales |
| JP2018102242A (ja) | 2016-12-27 | 2018-07-05 | 株式会社 TL Genomics | 胎児細胞由来染色体dnaの取得方法 |
| JP2020000011A (ja) * | 2018-06-25 | 2020-01-09 | 株式会社理研ジェネシス | ゲノムdna中の標的領域のコピー数検出方法及び試薬キット |
| WO2021200749A1 (fr) * | 2020-04-01 | 2021-10-07 | 株式会社 TL Genomics | Procédé de détection du nombre de copies d'un chromosome de cellule ou d'une partie de celui-ci |
Non-Patent Citations (9)
| Title |
|---|
| DENNIS J. EASTBURN ET AL.: "Identification and genetic analysis of cancer cells with PCR-activated cell sorting", NUCLEIC ACIDS RESEARCH, vol. 42, no. 16, pages e128, XP055527394, DOI: 10.1093/nar/gku606 |
| ICHIRO HANAMURA ET AL.: "Frequent gain of chromosome band 1q21 in plasma-cell dyscrasias detected by fluorescence in situ hybridization: incidence increases from MGUS to relapsed myeloma and is related to prognosis and disease progression following tandem stem-cell transplantation", BLOOD, vol. 108, no. 5, pages 1724 - 1732, XP002638020 |
| ISHIDA TADAO: "Tahatusei-kotujuishu: Senshokutai ijou to Rinshou byougata Yogo (Multiple myeloma: chromosomal abnormalities, clinical forms, and prognosis", CLINICAL HEMATOLOGY, vol. 54, no. 2, 21 September 2013 (2013-09-21), pages 1856 - 1866, Retrieved from the Internet <URL:https://doi.org/10.11406/rinketsu.54.1856> |
| ROBERT W. YUCHA ET AL.: "High-throughput Characterization of HIV-1 Reservoir Reactivation Using a Single-Cell-in-Droplet PCR Assay", EBIOMEDICINE, vol. 20, pages 217 - 229, XP055514948, DOI: 10.1016/j.ebiom.2017.05.006 |
| SAMUEL C. KIM ET AL.: "Single-Cell RT-PCR in Microfluidic Droplets with Integrated Chemical Lysis", ANALYTICAL CHEMISTRY, vol. 90, no. 2, pages 1273 - 1279, XP055586668, DOI: 10.1021/acs.analchem.7b04050 |
| SATO TAISUKE, ITO YUKI, SAMURA OSAMU, AOKI HIROAKI, UCHIYAMA TORU, OKAMOTO AIKOU, HATA KENICHIRO: "Direct Assessment of Single-Cell DNA Using Crudely Purified Live Cells: A Proof of Concept for Noninvasive Prenatal Definitive Diagnosis", THE JOURNAL OF MOLECULAR DIAGNOSTICS, vol. 22, no. 2, 1 February 2020 (2020-02-01), pages 132 - 140, XP009536932, ISSN: 1525-1578, DOI: 10.1016/j.jmoldx.2019.10.006 * |
| TAISUKE SATO ET AL.: "Direct Assessment of Single-Cell DNA Using Crudely Purified Live Cells: A Proof of Concept for Noninvasive Prenatal Definitive Diagnosis", THE JOURNAL OF MOLECULAR DIAGNOSTICS, vol. 22, no. 2, pages 132 - 140, XP009536932, DOI: 10.1016/j.jmoldx.2019.10.006 |
| UNOH KI ET AL.: "A Novel Bioprinting Application for the Production of Reference Material Containing a Defined Copy Number of Target DNA", RICOH TECHNICAL REPORT, vol. 44, 2020, pages 14 - 26, Retrieved from the Internet <URL:https://jp.ricoh.com/technology/techreport/44> |
| YUKA IGARASHI ET AL.: "Single Cell-Based Vector Tracing in Patients with ADA-SCID Treated with Stem Cell Gene Therapy", MOLECULAR THERAPY, METHODS & CLINICAL DEVELOPMENT, vol. 6, pages 8 - 16 |
Cited By (2)
| Publication number | Priority date | Publication date | Assignee | Title |
|---|---|---|---|---|
| CN116356005A (zh) * | 2023-04-28 | 2023-06-30 | 宁波熙宁检测技术有限公司 | 一种检测car-t细胞拷贝数的组合物及其用途 |
| CN116356005B (zh) * | 2023-04-28 | 2023-09-26 | 宁波熙宁检测技术有限公司 | 一种检测car-t细胞拷贝数的组合物及其用途 |
Also Published As
| Publication number | Publication date |
|---|---|
| US20240043929A1 (en) | 2024-02-08 |
| KR20230107662A (ko) | 2023-07-17 |
| EP4269614A1 (fr) | 2023-11-01 |
| CN116802314A (zh) | 2023-09-22 |
| TW202239967A (zh) | 2022-10-16 |
| JPWO2022138736A1 (fr) | 2022-06-30 |
| CA3206327A1 (fr) | 2022-06-30 |
Similar Documents
| Publication | Publication Date | Title |
|---|---|---|
| US9719140B2 (en) | Direct molecular diagnosis of fetal aneuploidy | |
| US9115391B2 (en) | Method of detecting a polymorphism at a polymorphism site | |
| CN111020031A (zh) | 序列特异性阻断剂结合特定pcr程序检测肿瘤基因突变的方法 | |
| JP2013090622A (ja) | 多型検出用プローブ、多型検出方法、薬効判定方法及び多型検出用キット | |
| WO2022138736A1 (fr) | Procédé de détection du nombre de copies d'un acide nucléique spécifique par cellule unique | |
| Sueki et al. | Rapid detection of PML–RARA fusion gene by novel high-speed droplet-reverse transcriptase-polymerase chain reaction: Possibility for molecular diagnosis without lagging behind the morphological analyses | |
| EP2450443A1 (fr) | Procédé d'amplification de séquences cibles, procédé de détection de polymorphisme, et réactifs convenant à ces procédés | |
| CN110295218B (zh) | 量化靶基因的突变型等位基因负担的方法 | |
| EP2990493B1 (fr) | Réactif d'amorces pour l'amplification du gène de fusion alk, kit réactif d'amplification du gène de fusion alk comprenant celui-ci et procédé d'amplification du gène de fusion alk et procédé d'analyse du gène de fusion alk utilisant celui-ci | |
| US20100267015A1 (en) | Nucleic acid detection | |
| US20210079456A1 (en) | Method for detecting mutant gene | |
| US11530455B2 (en) | Penta E polymorphisms for human identification | |
| CN104395468A (zh) | 检测hla-a*24:02的方法及检测试剂盒 | |
| US11629375B2 (en) | Methods and kits for determining the efficiency of plasma separation from whole blood | |
| JP6205216B2 (ja) | 変異検出用プローブ、変異検出方法、薬効判定方法及び変異検出用キット | |
| CN102453766A (zh) | 多态性检测用探针、多态性检测方法、药效评价方法及多态性检测用试剂盒 | |
| US20210340611A1 (en) | Digital polymerase chain reaction method for detecting nucleic acids in samples | |
| JP5570657B2 (ja) | 遺伝子存在量の測定方法 | |
| CN110964814B (en) | Primers, compositions and methods for nucleic acid sequence variation detection | |
| US9169518B2 (en) | Primer set for detecting EGFR exon 21 polymorphism and application thereof | |
| EP2407560B1 (fr) | Sonde pour la détection de polymorphisme dans le gène abl, et utilisation associée | |
| JP6533128B2 (ja) | Alk融合遺伝子を増幅するためのプライマー試薬、それを含むalk融合遺伝子の増幅試薬キット、それを用いたalk融合遺伝子の増幅方法および分析方法 | |
| Menif et al. | Quantitative detection of bcr-abl transcripts in chronic myeloid leukemia | |
| CN110964814A (zh) | 用于核酸序列变异检测的引物、组合物及方法 | |
| JP2023036344A (ja) | SARS-CoV-2の型を判定する方法、前記方法に用いるプローブセット及び前記方法に用いるプライマープローブセット |
Legal Events
| Date | Code | Title | Description |
|---|---|---|---|
| 121 | Ep: the epo has been informed by wipo that ep was designated in this application |
Ref document number: 21910876 Country of ref document: EP Kind code of ref document: A1 |
|
| ENP | Entry into the national phase |
Ref document number: 20237020216 Country of ref document: KR Kind code of ref document: A |
|
| WWE | Wipo information: entry into national phase |
Ref document number: 202180086085.8 Country of ref document: CN |
|
| ENP | Entry into the national phase |
Ref document number: 2022571563 Country of ref document: JP Kind code of ref document: A |
|
| ENP | Entry into the national phase |
Ref document number: 3206327 Country of ref document: CA |
|
| WWE | Wipo information: entry into national phase |
Ref document number: 18258836 Country of ref document: US |
|
| NENP | Non-entry into the national phase |
Ref country code: DE |
|
| ENP | Entry into the national phase |
Ref document number: 2021910876 Country of ref document: EP Effective date: 20230725 |