WO2021130936A1 - 時系列データ処理方法 - Google Patents
時系列データ処理方法 Download PDFInfo
- Publication number
- WO2021130936A1 WO2021130936A1 PCT/JP2019/050988 JP2019050988W WO2021130936A1 WO 2021130936 A1 WO2021130936 A1 WO 2021130936A1 JP 2019050988 W JP2019050988 W JP 2019050988W WO 2021130936 A1 WO2021130936 A1 WO 2021130936A1
- Authority
- WO
- WIPO (PCT)
- Prior art keywords
- series data
- time
- period
- time series
- abnormal
- Prior art date
- Legal status (The legal status is an assumption and is not a legal conclusion. Google has not performed a legal analysis and makes no representation as to the accuracy of the status listed.)
- Ceased
Links
Images





Classifications
-
- G—PHYSICS
- G05—CONTROLLING; REGULATING
- G05B—CONTROL OR REGULATING SYSTEMS IN GENERAL; FUNCTIONAL ELEMENTS OF SUCH SYSTEMS; MONITORING OR TESTING ARRANGEMENTS FOR SUCH SYSTEMS OR ELEMENTS
- G05B23/00—Testing or monitoring of control systems or parts thereof
- G05B23/02—Electric testing or monitoring
- G05B23/0205—Electric testing or monitoring by means of a monitoring system capable of detecting and responding to faults
- G05B23/0218—Electric testing or monitoring by means of a monitoring system capable of detecting and responding to faults characterised by the fault detection method dealing with either existing or incipient faults
- G05B23/0243—Electric testing or monitoring by means of a monitoring system capable of detecting and responding to faults characterised by the fault detection method dealing with either existing or incipient faults model based detection method, e.g. first-principles knowledge model
- G05B23/0254—Electric testing or monitoring by means of a monitoring system capable of detecting and responding to faults characterised by the fault detection method dealing with either existing or incipient faults model based detection method, e.g. first-principles knowledge model based on a quantitative model, e.g. mathematical relationships between inputs and outputs; functions: observer, Kalman filter, residual calculation, Neural Networks
-
- G—PHYSICS
- G05—CONTROLLING; REGULATING
- G05B—CONTROL OR REGULATING SYSTEMS IN GENERAL; FUNCTIONAL ELEMENTS OF SUCH SYSTEMS; MONITORING OR TESTING ARRANGEMENTS FOR SUCH SYSTEMS OR ELEMENTS
- G05B23/00—Testing or monitoring of control systems or parts thereof
- G05B23/02—Electric testing or monitoring
- G05B23/0205—Electric testing or monitoring by means of a monitoring system capable of detecting and responding to faults
- G05B23/0218—Electric testing or monitoring by means of a monitoring system capable of detecting and responding to faults characterised by the fault detection method dealing with either existing or incipient faults
- G05B23/0221—Preprocessing measurements, e.g. data collection rate adjustment; Standardization of measurements; Time series or signal analysis, e.g. frequency analysis or wavelets; Trustworthiness of measurements; Indexes therefor; Measurements using easily measured parameters to estimate parameters difficult to measure; Virtual sensor creation; De-noising; Sensor fusion; Unconventional preprocessing inherently present in specific fault detection methods like PCA-based methods
-
- G—PHYSICS
- G05—CONTROLLING; REGULATING
- G05B—CONTROL OR REGULATING SYSTEMS IN GENERAL; FUNCTIONAL ELEMENTS OF SUCH SYSTEMS; MONITORING OR TESTING ARRANGEMENTS FOR SUCH SYSTEMS OR ELEMENTS
- G05B23/00—Testing or monitoring of control systems or parts thereof
- G05B23/02—Electric testing or monitoring
- G05B23/0205—Electric testing or monitoring by means of a monitoring system capable of detecting and responding to faults
- G05B23/0218—Electric testing or monitoring by means of a monitoring system capable of detecting and responding to faults characterised by the fault detection method dealing with either existing or incipient faults
- G05B23/0224—Process history based detection method, e.g. whereby history implies the availability of large amounts of data
- G05B23/024—Quantitative history assessment, e.g. mathematical relationships between available data; Functions therefor; Principal component analysis [PCA]; Partial least square [PLS]; Statistical classifiers, e.g. Bayesian networks, linear regression or correlation analysis; Neural networks
Definitions
- the present invention relates to a time series data processing method, a time series data processing system, and a program.
- Patent Document 1 describes a method for detecting a failure of mechanical equipment.
- a normal model is generated from sensor data in a normal state
- an abnormal model is generated from sensor data in an abnormal state. Then, by inputting the sensor data into the normal model or the abnormal model, the abnormal state is discriminated.
- the sign of the abnormal state is appropriately detected in the boundary state, which is the period during which the time series data is transitioning from the normal state to the abnormal state.
- the problem arises that it cannot be done. That is, it is not possible to detect which state the monitoring target is in the boundary period between the normal state and the abnormal state of the time series data.
- an object of the present invention is a time-series data processing method, a time-series data processing system, a program, which can solve the above-mentioned problems that a sign of an abnormal state cannot be detected more appropriately. Is to provide.
- the time series data processing method which is one embodiment of the present invention, is Of the time-series data measured from the measurement target, the boundary between the normal period, which is the period during which the measurement target is determined to be in the normal state, and the abnormal period, which is the period during which the measurement target is determined to be in the abnormal state. Learned to generate a model that takes the boundary period time series data, which is the time series data of the period, as input and outputs the teacher signal determined by the preset function according to the time change of the boundary period time series data. To do It takes the configuration.
- the time series data processing system which is one form of the present invention, is Of the time-series data measured from the measurement target, the boundary between the normal period, which is the period during which the measurement target is determined to be in the normal state, and the abnormal period, which is the period during which the measurement target is determined to be in the abnormal state.
- the program which is one form of the present invention is For information processing equipment Of the time-series data measured from the measurement target, the boundary between the normal period, which is the period during which the measurement target is determined to be in the normal state, and the abnormal period, which is the period during which the measurement target is determined to be in the abnormal state.
- the present invention is configured as described above, so that it is possible to more appropriately detect a sign that the subject is in an abnormal state.
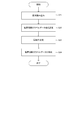
- FIG. 1 It is a block diagram which shows the structure of the time series data processing system in Embodiment 1 of this invention. It is a figure which shows the state of processing of the time-series data by the time-series data processing system disclosed in FIG. It is a figure which shows the state of processing of the time-series data by the time-series data processing system disclosed in FIG. It is a figure which shows the state of processing of the time-series data by the time-series data processing system disclosed in FIG. It is a figure which shows the state of processing of the time-series data by the time-series data processing system disclosed in FIG. It is a flowchart which shows the operation of the time series data processing system disclosed in FIG.
- FIG. 1 is a diagram for explaining the configuration of a time-series data processing system
- FIGS. 2 to 12 are diagrams for explaining a processing operation of the time-series data processing system.
- the time-series data processing system 10 in the present invention is connected to a measurement target P such as a plant. Then, the time-series data processing system 10 acquires and analyzes the measured values of at least one or more data items of the measurement target P, monitors the state of the measurement target P based on the analysis result, and detects a predetermined state. Is what you do.
- machine learning which is supervised learning such as neural network or deep learning, is performed using past measured values, and a new model generated by such learning is used.
- the state of the measurement target P is detected from the measurement value of the measurement target P.
- the measurement target P is a plant such as a manufacturing factory or a processing facility
- the measured values of each data item are the temperature, pressure, flow rate, power consumption value, raw material supply amount, remaining amount, etc. in the plant.
- the measurement target P whose state is monitored by the time-series data processing system 10 of the present invention is not limited to the plant, and may be any equipment such as an information processing system or a large machine.
- the CPU Central Processing Unit
- the measurement target P is an information processing system
- the CPU Central Processing Unit
- the number of packets, the input / output packet rate, the power consumption value, and the like may be measured as measured values of each data item, and the measured values may be analyzed to detect the state of the information processing system. Further, when the measurement target P is a machine, the state of the machine may be detected by measuring measured values such as torque and rotation speed generated by the operation of the components of the machine.
- the time-series data processing system 10 in the present embodiment detects not only the normal state and the abnormal state of the measurement target P as the state of the measurement target P, but also detects a sign of the abnormal state in particular. Is configured. Hereinafter, the configuration of the time series data processing system 10 will be described in detail.
- the time-series data processing system 10 is composed of one or a plurality of information processing devices including an arithmetic unit and a storage device. Then, as shown in FIG. 1, the time-series data processing system 10 includes a measurement unit 11, a label creation unit 12, a learning unit 13, a threshold value determination unit 14, a prediction unit 15, and a determination unit 16. The functions of the measurement unit 11, the label creation unit 12, the learning unit 13, the threshold value determination unit 14, the prediction unit 15, and the determination unit 16 execute a program for the arithmetic unit to realize each function stored in the storage device. By doing so, it can be realized. Further, the time-series data processing system 10 includes a measurement data storage unit 17, a label storage unit 18, a model storage unit 19, and a requirement storage unit 20. The measurement data storage unit 17, the label storage unit 18, the model storage unit 19, and the requirement storage unit 20 are composed of a storage device. Hereinafter, each configuration will be described in detail.
- the measurement unit 11 acquires each sensor value measured by various sensors installed in the measurement target P as time-series data at predetermined time intervals and stores it in the measurement data storage unit 17.
- FIG. 2 shows an example of time-series data acquired by the measurement unit 11 and processed by the time-series data processing system 10.
- the time-series data processing system 10 in the present embodiment targets the time-series data of one sensor value measured by one sensor as a processing target.
- the time-series data processing system 10 may process a time-series data set composed of time-series data of a plurality of types of data items.
- the measurement unit 11 constantly acquires time-series data. Then, the measurement unit 11 stores the acquired time-series data in the measurement data storage unit 17 as learning data used to generate a model for detecting a sign of an abnormal state of the measurement target P, as will be described later. It is acquired as prediction data to be stored or used when predicting the state of the measurement target P, and is passed to the prediction unit 15.
- the label creating unit 12 (creating means) reads out time-series data, which is learning data measured in the past, from the measurement data storage unit 17, and performs a process for generating a model. Specifically, the label creation unit 12 first reads the past time-series data as shown in the upper figure of FIG. 2, and represents each period corresponding to each state of the measurement target P with respect to the time-series data. Set the label. At this time, the label creation unit 12 specifies, among the time-series data, the normal period in which the measurement target P is determined to be in the normal state and the abnormal period in which the measurement target P is determined to be in the abnormal state. The input of the time information is accepted, and as shown in the lower figure of FIG.
- the normal period label and the abnormal period label are set in the time series data of the time corresponding to each period. Then, when the label creation unit 12 has another period between the label of the normal period and the label of the abnormal period in the time series data, the measurement target P measures the other period during that period. Is determined as the boundary period, which is the boundary state in which is transitioning from the normal state to the abnormal state, and the label of the boundary period is set.
- the label creation unit 12 extracts partial time-series data having a predetermined time width from the time-series data within each period, and associates the partial time-series data with the weight of the category representing the state of the measurement target P.
- Create label data For
- "normal state” and “abnormal state” are set as “categories” representing the state of the measurement target P, and “certainty indicating the degree of certainty of being in the normal state” is set as the "weight” of each category. Both “certainty indicating the degree of certainty in an abnormal state” and “certainty indicating the degree of certainty” are set.
- the label creating unit 12 first sets a window w having a predetermined time width for the time series data of each period, as shown in the upper figure of FIG. The time width, number, and slide width of the window w will be described later. Then, the label creation unit 12 creates label data by associating the weights of each category with the partial time series data in each window w according to the criteria set according to each period.
- the label creation unit 12 sets the certainty of the normal state "1.0” and the certainty of the abnormal state "0.0" at any time for the partial time series data belonging to the "normal period”. Set to generate label data associated with the partial time series data. Further, the label creation unit 12 sets the certainty of the normal state "0.0” and the certainty of the abnormal state "1.0” at any time for the partial time series data belonging to the "abnormal period”. Set to generate label data associated with the partial time series data. At this time, the certainty degree "1.0" of the abnormal state is assumed to be an "abnormal value" indicating the abnormal state.
- the label creation unit 12 creates label data for the partial time series data belonging to the "boundary period" as follows.
- the label creation unit 12 creates four partial time series data corresponding to the four label data from the time series data of the "boundary period", and sets the weight of the category in each partial time series data.
- the partial time-series data corresponding to the four label data of the boundary period generated here is the time-series data having a predetermined time width, it also includes a part of the time-series data of the adjacent normal period and abnormal period. sell.
- the label creation unit 12 sets a value determined according to a preset "function f (x)" with the passage of time of the partial time series data as the weight of each category.
- the label creation unit 12 increases the value of the "weight” of the category "abnormal state” as the time of the partial time series data constituting the label data in the boundary period approaches the abnormal period.
- the function f (x) for determining the "weight" of the category "abnormal state” is a monotonically increasing function whose value increases with the passage of time of the partial time series data, and in particular, It is a linear function.
- the function f (x) may be another function such as a sigmoid function, and is not necessarily limited to an increasing function.
- the function f (x) is set to the value of the "weight" of the category "abnormal state” set for the partial time series data of the label data in the "abnormal period” with the passage of time in the "boundary period". It may be a function that determines a value that increases or decreases so as to approach.
- the function f (x) may be a function whose value changes in any way according to the time until the "abnormal period" with the passage of time in the "boundary period".
- the function f (x) is specified in advance by the user and stored in the requirement storage unit 20.
- the label creation unit 12 stores the label data composed of the partial time series data created according to each period and the weights of each category associated with the partial time series data. Store in part 18.
- the label creation unit 12 also creates label data for other learning data stored in the measurement data storage unit 17 in the same manner as described above, and stores the created label data in the label storage unit 18.
- the learning unit 13 (learning means) reads label data from the label storage unit 18 and learns the label data to generate a model. Specifically, the learning unit 13 uses the partial time-series data constituting the label data as input data, and has the "weight" of the category "normal state” and the "abnormal state” of the category “abnormal state” associated with the partial time-series data. Machine learning is performed to generate a model that outputs a set of "weights" as a teacher signal.
- the threshold value determination unit 14 determines a threshold value to be used when predicting the state of the measurement target P later using the model described above using the label data stored in the label storage unit 18.
- a threshold value for detecting a sign that the measurement target P becomes an abnormal state is set.
- the time requirement until the measurement target P becomes an abnormal state is stored in the requirement storage unit 20 in advance, and a threshold value that satisfies the time requirement is determined.
- the threshold determination unit 14 first, as shown in the upper figure of FIG. 5, " From the partial time-series data that composes the label data of the "boundary period", the "weight” of the category "abnormal state” associated with the partial time-series data at the time 10 seconds before the "abnormal period” is read out and the "weight” is read out. Create frequency statistics. Then, as shown in the upper figure of FIG. 5, an average value is calculated from the statistical information of the frequency of such "weights", and the calculated average value "0.5" is used as a threshold value.
- the threshold value determination unit 14 is shown in the lower figure of FIG. 5 in the same manner as described above.
- the "weight” of the category "abnormal state” associated with the partial time-series data at the time 10 seconds before the "abnormal period”. And create statistics on its frequency. Then, from the statistical information of the frequency of the "weight”, as shown in the lower figure of FIG. 5, the minimum value "0.2" of the "weight” is determined as a threshold value.
- the prediction unit 15 acquires newly measured time-series data from the measurement target P and predicts the state of the measurement target P using the model generated as described above. Specifically, the prediction unit 15 first reads out the model stored in the model storage unit 19, acquires the time series data newly measured from the measurement target P by the measurement unit 11, and obtains such time series data. Input partial time series data of a predetermined time width into the model. Then, the prediction unit 15 acquires the value of the "weight" of the category "abnormal state” corresponding to the input partial time series data as the value output from the model, and sets the value of the weight to the state of the measurement target P. Predict as. Then, the prediction unit 15 passes the acquired weight value to the determination unit 16.
- the determination unit 16 determines the measurement target P from the value of the “weight” of the category “abnormal state” output from the model corresponding to the time series data measured from the measurement target P as described above. Determine the state. Specifically, the determination unit 16 determines that the measurement target P is in the normal state when the weight value is "0", and determines that the measurement target P is in the normal state, and when the weight value is "1", the measurement target P Is determined to be in an abnormal state. Further, when the weight value is "greater than 0 and less than 1", the determination unit 16 compares the weight value with the threshold value.
- the determination unit 16 determines that the measurement target P has detected a sign that the measurement target P is in an abnormal state. As a result of comparison between the weight value and the threshold value, the determination unit 16 determines that the measurement target P is in an "abnormal state" when the weight value is equal to or greater than the threshold value and the weight value is less than the threshold value. May determine that the measurement target P is in the "normal state".
- the determination unit 16 performs processing according to the determination result. For example, when it is determined that the measurement target P has detected a sign of an abnormal state, a notification to that effect is notified to a preset notification destination such as an administrator.
- the above-mentioned threshold value determination unit 14 may determine the threshold value by a method different from the above-mentioned method. For example, the threshold determination unit 14 requests the prediction unit 15 described above to input time-series data, which is learning data that is a source of label data stored in the measurement data storage unit 17, into the model. Then, the value of the "weight” of the category "abnormal state” which is the output is acquired. In particular, the prediction unit 15 is requested to input the partial time series data constituting the label data of the boundary period to the model, and acquire the "weight” of the category "abnormal state” which is the output. Then, as shown in FIG.
- the threshold value determination unit 14 may determine the threshold value by any method.
- the time-series data processing system 10 acquires the detection requirement input from the administrator of the measurement target P or the like and stores it in the requirement storage unit 20 (step S1 in FIG. 6).
- the detection requirement for example, when creating label data as described above, there is information representing a criterion for determining the "weight" of the category "abnormal state" associated with the partial time series data, and in particular, the "boundary period".
- the function f (x) determines the weights associated with the partial time series data of.
- a detection requirement there is information indicating a requirement for detecting a sign of an abnormal state when predicting the state of the measurement target P, and in particular, a time requirement for detecting a sign that the measurement target P is in an abnormal state.
- the detection requirement there is information necessary for creating label data as described later. For example, the size W of the window w, the slide width S, and the calculation formula of the number of label data with respect to the number of samples of time series data. There is information such as.
- the time-series data processing system 10 learns the time-series data acquired as learning data from the measurement target P (step S2 in FIG. 6).
- the details of the learning operation by the time-series data processing system 10 will be described with reference to the flowcharts of FIGS. 7 to 9.
- the time-series data processing system 10 reads out the time-series data which is the learning data, and checks whether the time-series data includes a plurality of labels set (step S11 in FIG. 7). Then, in the time-series data processing system 10, for example, as shown in the lower figure of FIG. 2, the time-series data includes a plurality of labels such as a label of a normal period and a label of an abnormal period (in step S11 of FIG. 7). Yes), if these labels are separated (Yes in step S12 of FIG. 7), the label of the boundary period is set in the time series data between them. Then, the time-series data processing system 10 creates label data for the time-series data in the boundary period (step S13 in FIG. 7).
- the time series data processing system 10 creates label data for the boundary period as shown in the flowchart of FIG.
- the time-series data processing system 10 reads the requirement information required when creating the label data from the requirement storage unit 20 (step S21 in FIG. 8), and uses the requirement information to create the label in the boundary period. The number of data is set (step S22 in FIG. 8).
- the time-series data processing system 10 determines a function f (x) for determining the "weight" of the category "abnormal state" associated with each partial time-series data constituting the label data of the boundary period from the requirement information ( In step S23 of FIG. 8, label data is generated by associating each partial time series data with a “weight” (step S24 of FIG. 8).
- the time-series data processing system 10 also creates label data for time-series data in a normal period or an abnormal period. In this way, the time-series data processing system 10 generates label data for each period as shown in the lower figure of FIG. 3 and the lower figure of FIG.
- the time-series data processing system 10 selects a section to be learned, such as a normal period, an abnormal period, and a boundary period, from the time-series data of the learning data (step S31 in FIG. 9), and the section is Machine learning is performed using label data.
- the time-series data processing system 10 uses the partial time-series data constituting the label data as input data, and outputs the "weight" of the category "abnormal state" associated with the partial time-series data as a teacher signal.
- Machine learning is performed to generate such a model, and the model is updated as needed (step S32 in FIG. 9). Then, when the machine learning is completed (Yes in step S33 of FIG.
- the time-series data processing system 10 stores and stores the model in the model storage unit 19. As described above, the time-series data processing system 10 performs learning (step S15 in FIG. 7), and stores and stores the created label data in the label storage unit 18 (step S16 in FIG. 7).
- the time-series data processing system 10 predicts the state of the measurement target P using the created model (step S3 in FIG. 6). Specifically, the time-series data processing system 10 detects a sign that the measurement target P is in an abnormal state, as shown in the flowchart of FIG. Here, the time-series data processing system 10 first determines a threshold value to be compared with a value output from the model as described later (step S41 in FIG. 10).
- the time series data processing system 10 In order to determine the threshold value, the time series data processing system 10 first reads the requirement information (step S51 in FIG. 11), and also reads the label data of the boundary period. Then, the time-series data processing system 10 creates statistics on the frequency of the "weight” of the category "abnormal state” associated with the partial time-series data of the time corresponding to the requirement information (step S52 in FIG. 11). .. Then, the threshold value corresponding to the requirement information is determined from the statistical information of the frequency of the "weight” (step S53 in FIG. 11). As an example, when the time-series data processing system 10 is set with the requirement information that "a sign is detected 10 seconds before an abnormal state occurs on average", first, as shown in the upper figure of FIG.
- the time-series data processing system 10 may determine the threshold value by another method as shown in the flowchart shown in FIG.
- the time-series data processing system 10 first reads the requirement information (step S61 in FIG. 12), and at the same time, reads the label data of the boundary period and the model, and inputs the partial time-series data constituting the label data of the boundary period to the model. Input and get its output value. Then, the time series data processing system 10 treats the output value from the model in the same manner as the "weight" included in the label data described above. That is, the time-series data processing system 10 creates statistics on the frequency of output values with the partial time-series data of the time corresponding to the requirement information as an input (step S62 in FIG. 12). Then, the threshold value corresponding to the requirement information is determined from the statistical information of the frequency of the output value (step S63 in FIG. 12).
- the time-series data processing system 10 acquires newly measured time-series data from the measurement target P and predicts the state of the measurement target P using the model generated as described above (FIG. 10). Step S41). Specifically, the time-series data processing system 10 sets a window w having a predetermined time width in the measured time-series data, inputs the partial time-series data in the window w into the model, and outputs the window w from the model. Acquires the value of "weight" of the category "abnormal state" corresponding to the input partial time series data which is the output value.
- the time-series data processing system 10 compares the output value with the threshold value, and if the output value is equal to or greater than the threshold value, determines that the measurement target P has detected a sign of an abnormal state (step in FIG. 10). S43).
- the time-series data processing system 10 performs the above-mentioned prediction processing until the time-series data is completed by sliding the window w set on the time-series data (steps S44 and S45 in FIG. 10).
- the time-series data processing system 10 of the present invention it is possible to more appropriately detect a sign that the measurement target P is in an abnormal state. In particular, even when the boundary period between the normal period and the abnormal period of the measurement target P is long, it is possible to detect a desired timing before the abnormal state occurs.
- FIGS. 13 to 15 are block diagrams showing the configuration of the time series data processing system according to the second embodiment
- FIG. 15 is a flowchart showing the operation of the time series data processing system.
- the outline of the configuration of the time-series data processing system and the time-series data processing method described in each of the above-described embodiments is shown.
- the time-series data processing system 100 is composed of a general information processing device, and is equipped with the following hardware configuration as an example.
- -CPU Central Processing Unit
- -ROM Read Only Memory
- RAM Random Access Memory
- 103 storage device
- -Program group 104 loaded into RAM 303
- a storage device 105 that stores the program group 304.
- a drive device 106 that reads and writes the storage medium 110 external to the information processing device.
- -Communication interface 107 that connects to the communication network 111 outside the information processing device -I / O interface 108 for inputting / outputting data -Bus 109 connecting each component
- the time-series data processing system 100 can construct and equip the learning means 121 shown in FIG. 14 by the CPU 101 acquiring the program group 104 and executing the program group 104.
- the program group 104 is stored in, for example, a storage device 105 or a ROM 102 in advance, and the CPU 101 loads the program group 104 into the RAM 103 and executes the program group 104 as needed. Further, the program group 104 may be supplied to the CPU 101 via the communication network 111, or may be stored in the storage medium 110 in advance, and the drive device 106 may read the program and supply the program to the CPU 101.
- the learning means 121 described above may be constructed by an electronic circuit.
- FIG. 13 shows an example of the hardware configuration of the information processing device which is the time series data processing system 100, and the hardware configuration of the information processing device is not limited to the above case.
- the information processing device may be configured from a part of the above-described configuration, such as not having the drive device 106.
- the time-series data processing system 100 executes the time-series data processing method shown in the flowchart of FIG. 15 by the function of the learning means 121 constructed by the program as described above.
- the time series data processing system 100 is Of the time-series data measured from the measurement target, the boundary period between the normal period, which is the period when the measurement target is determined to be in the normal state, and the abnormal period, which is the period when the measurement target is determined to be in the abnormal state.
- the present invention inputs the boundary period time series data which is the time series data of the boundary period in which the measurement target is the state between the normal state and the abnormal state, and the time of the boundary period time series data.
- a model is generated that outputs a teacher signal determined by a preset function according to the change. Therefore, by inputting the time series data newly measured from the measurement target to the model, the output value corresponding to the change in the time of the boundary period can be obtained, and the abnormal state is obtained based on the output value. It is possible to detect the sign of becoming more appropriately.
- Appendix 2 The time-series data processing method described in Appendix 1 Label data in which the teacher signal corresponding to the state of the measurement target is associated with the partial time series data consisting of the time series data having a predetermined time width is created, and the partial time in the boundary period time series data is created.
- the label data in which the teacher signal determined by the function set corresponding to the boundary period is associated with the series data according to the time change of the boundary period time series data is created.
- the model is generated by learning using the label data. Time series data processing method.
- Appendix 3 The time-series data processing method described in Appendix 2, As the partial time-series data approaches the abnormal period from the normal period to the partial time-series data in the boundary period time-series data, the teacher signal associated with the partial time-series data in the abnormal period The label data is generated by associating the value determined by the function with the teacher signal so as to approach the value. Time series data processing method.
- Appendix 4 The time-series data processing method described in Appendix 3,
- the label data is generated by associating the partial time series data in the abnormal period with an abnormal value indicating that the abnormal state is indicated as the teacher signal, and the partial time series in the boundary period time series data.
- the label data is generated by associating the data with a value determined by the function as the teacher signal so that the closer the partial time series data is from the normal period to the abnormal period, the closer to the abnormal value. Time series data processing method.
- the time-series data processing method described in Appendix 4 The label data is generated by associating the partial time series data in the normal period with a value lower than the abnormal value as the teacher signal, and the partial time series data in the boundary period time series data is linked to the partial time series data. As the partial time series data approaches the abnormal period from the normal period, the function determines that the value associated with the partial time series data in the normal period as the teacher signal increases toward the abnormal value.
- the label data is generated by associating the values as the teacher signals. Time series data processing method.
- Appendix 6 The time-series data processing method described in Appendix 5.
- a value associated with the partial time series data in the boundary period time series data as a teacher signal as the partial time series data approaches the abnormal period from the normal period.
- the label data is generated by associating the value determined by the function so as to monotonically increase from the above to the abnormal value as the teacher signal. Time series data processing method.
- Appendix 8 The time-series data processing method according to any one of Appendix 2 to 6.
- a threshold value is set based on the label data created from the boundary period time series data and the time of the partial time series data constituting the label data with respect to the abnormal period.
- Time-series data newly measured from the measurement target is input to the generated model, and the measurement target is in the abnormal state based on the comparison result between the value output from the model and the threshold value. Detecting signs of becoming, Time series data processing method.
- Appendix 9 The time-series data processing method described in Appendix 8 Of the partial time-series data constituting the label data generated from the boundary period time-series data, based on the teacher signal associated with the partial time-series data at a preset time up to the abnormal period. Set the threshold, Time series data processing method.
- Appendix 10 The time-series data processing method described in Appendix 8 The partial time series data constituting the label data generated from the boundary period time series data is input to the model, and the threshold value is set based on the value output from the model. Time series data processing method.
- the time-series data processing system described in Appendix 12 associates the partial time series data in the boundary period time series data with the partial time series data in the abnormal period as the partial time series data approaches the abnormal period from the normal period.
- the label data is generated by associating the value determined by the function with the teacher signal so as to approach the value of the teacher signal. Time series data processing system.
- the time-series data processing system described in Appendix 13 The creating means associates the partial time-series data within the abnormal period with an abnormal value indicating that the abnormal state is indicated as the teacher signal to generate the label data, and also within the boundary period time-series data.
- the label data is associated with the partial time-series data of the above as a teacher signal by associating a value determined by the function so that the closer the partial time-series data is from the normal period to the abnormal period, the closer to the abnormal value.
- the time-series data processing system described in Appendix 14 The time-series data processing system described in Appendix 14, The creating means associates the partial time series data within the normal period with a value lower than the abnormal value as the teacher signal to generate the label data, and at the same time, the partial time in the boundary period time series data.
- the label data is generated by associating the value determined by the function with the teacher signal. Time series data processing system.
- the time-series data processing system according to Appendix 15.
- the creating means applies the teacher signal to the partial time series data in the boundary period time series data as the partial time series data approaches the abnormal period from the normal period to the partial time series data in the normal period.
- the label data is generated by associating the value determined by the function so as to monotonically increase from the value associated with the above as the teacher signal. Time series data processing system.
- Appendix 17 The time-series data processing system according to any one of Appendix 11 to 16.
- Time-series data newly measured from the measurement target is input to the generated model, and the measurement target is in the abnormal state based on the comparison result between the value output from the model and the threshold value.
- the threshold value setting means is associated with the partial time series data at a preset time up to the abnormal period among the partial time series data constituting the label data generated from the boundary period time series data.
- the threshold is set based on the teacher signal. Time series data processing system.
- the threshold value setting means inputs the partial time series data constituting the label data generated from the boundary period time series data to the model, and sets the threshold value based on the value output from the model. , Time series data processing system.
- Appendix 22 The program described in Appendix 21.
- Label data in which the teacher signal corresponding to the state of the measurement target is associated with the partial time series data consisting of the time series data having a predetermined time width is created, and the partial time in the boundary period time series data is created.
- a means for creating the label data in which the teacher signal determined by the function set corresponding to the boundary period is associated with the series data according to the time change of the boundary period time series data.
- the learning means learns using the label data to generate the model. A program to make that happen.
- a threshold setting means for setting a threshold value based on the label data created from the boundary period time series data and the time of the partial time series data constituting the label data with respect to the abnormal period. Time-series data newly measured from the measurement target is input to the generated model, and the measurement target is in the abnormal state based on the comparison result between the value output from the model and the threshold value. Detection means to detect the sign of A program to realize.
- Non-temporary computer-readable media include various types of tangible storage media.
- Examples of non-temporary computer-readable media include magnetic recording media (eg, flexible disks, magnetic tapes, hard disk drives), magneto-optical recording media (eg, magneto-optical disks), CD-ROMs (Read Only Memory), CD-Rs, It includes a CD-R / W and a semiconductor memory (for example, a mask ROM, a PROM (Programmable ROM), an EPROM (Erasable PROM), a flash ROM, and a RAM (RandomAccessMemory)).
- a semiconductor memory for example, a mask ROM, a PROM (Programmable ROM), an EPROM (Erasable PROM), a flash ROM, and a RAM (RandomAccessMemory)
- the program may also be supplied to the computer by various types of temporary computer readable medium.
- temporary computer-readable media include electrical, optical, and electromagnetic waves.
- the temporary computer-readable medium can supply the program to the computer via a wired communication path such as an electric wire and an optical fiber, or a wireless communication path.
- the present invention is not limited to the above-described embodiment.
- Various changes that can be understood by those skilled in the art can be made to the structure and details of the present invention within the scope of the present invention.
- at least one or more of the functions of the measurement unit, label creation unit, learning unit, threshold determination unit, prediction unit, judgment unit, measurement data storage unit, label storage unit, model storage unit, and requirement storage unit described above. May be executed by an information processing device installed and connected to any place on the network, that is, may be executed by so-called cloud computing.
- Time-series data processing system 11 Measurement unit 12 Label creation unit 13 Learning unit 14 Threshold determination unit 15 Prediction unit 16 Judgment unit 17 Measurement data storage unit 18 Label storage unit 19 Model storage unit 20 Requirement storage unit 100 Time-series data processing system 101 CPU 102 ROM 103 RAM 104 Program group 105 Storage device 106 Drive device 107 Communication interface 108 Input / output interface 109 Bus 110 Storage medium 111 Communication network 121 Learning means
Landscapes
- Physics & Mathematics (AREA)
- Engineering & Computer Science (AREA)
- General Physics & Mathematics (AREA)
- Automation & Control Theory (AREA)
- Artificial Intelligence (AREA)
- Evolutionary Computation (AREA)
- Mathematical Physics (AREA)
- Testing And Monitoring For Control Systems (AREA)
Priority Applications (3)
| Application Number | Priority Date | Filing Date | Title |
|---|---|---|---|
| US17/783,105 US20220413480A1 (en) | 2019-12-25 | 2019-12-25 | Time series data processing method |
| PCT/JP2019/050988 WO2021130936A1 (ja) | 2019-12-25 | 2019-12-25 | 時系列データ処理方法 |
| JP2021566664A JP7239022B2 (ja) | 2019-12-25 | 2019-12-25 | 時系列データ処理方法 |
Applications Claiming Priority (1)
| Application Number | Priority Date | Filing Date | Title |
|---|---|---|---|
| PCT/JP2019/050988 WO2021130936A1 (ja) | 2019-12-25 | 2019-12-25 | 時系列データ処理方法 |
Publications (1)
| Publication Number | Publication Date |
|---|---|
| WO2021130936A1 true WO2021130936A1 (ja) | 2021-07-01 |
Family
ID=76573759
Family Applications (1)
| Application Number | Title | Priority Date | Filing Date |
|---|---|---|---|
| PCT/JP2019/050988 Ceased WO2021130936A1 (ja) | 2019-12-25 | 2019-12-25 | 時系列データ処理方法 |
Country Status (3)
| Country | Link |
|---|---|
| US (1) | US20220413480A1 (https=) |
| JP (1) | JP7239022B2 (https=) |
| WO (1) | WO2021130936A1 (https=) |
Cited By (2)
| Publication number | Priority date | Publication date | Assignee | Title |
|---|---|---|---|---|
| CN114978863A (zh) * | 2022-05-17 | 2022-08-30 | 安天科技集团股份有限公司 | 一种数据处理方法、装置、计算机设备及可读存储介质 |
| JP2023023555A (ja) * | 2021-08-05 | 2023-02-16 | パナソニックIpマネジメント株式会社 | モデル生成装置、モデル生成方法、異常予兆検知装置、異常予兆検知方法及び異常予兆検知システム |
Families Citing this family (3)
| Publication number | Priority date | Publication date | Assignee | Title |
|---|---|---|---|---|
| JP7710886B2 (ja) * | 2021-05-06 | 2025-07-22 | キヤノン株式会社 | 情報処理方法、情報処理装置、制御プログラム、記録媒体、物品の製造方法、学習用データの取得方法 |
| JP7358679B1 (ja) * | 2022-02-24 | 2023-10-10 | 株式会社日立ハイテク | 診断装置及び診断方法並びに半導体製造装置システム及び半導体装置製造システム |
| CN119166485B (zh) * | 2024-11-19 | 2025-03-18 | 杭银消费金融股份有限公司 | 一种评估分析处理系统运行状态的方法及系统 |
Citations (6)
| Publication number | Priority date | Publication date | Assignee | Title |
|---|---|---|---|---|
| JP2010191556A (ja) * | 2009-02-17 | 2010-09-02 | Hitachi Ltd | 異常検知方法及び異常検知システム |
| JP2019079089A (ja) * | 2017-10-20 | 2019-05-23 | 株式会社日立製作所 | 診断装置 |
| WO2019102884A1 (ja) * | 2017-11-21 | 2019-05-31 | 日本電信電話株式会社 | ラベル生成装置、モデル学習装置、感情認識装置、それらの方法、プログラム、および記録媒体 |
| JP2019144767A (ja) * | 2018-02-19 | 2019-08-29 | 富士通株式会社 | 学習プログラム、学習方法および学習装置 |
| JP2019204155A (ja) * | 2018-05-21 | 2019-11-28 | ファナック株式会社 | 異常検出器 |
| JP2020024139A (ja) * | 2018-08-07 | 2020-02-13 | ファナック株式会社 | 製品検査装置 |
Family Cites Families (5)
| Publication number | Priority date | Publication date | Assignee | Title |
|---|---|---|---|---|
| US7457550B2 (en) * | 2005-01-18 | 2008-11-25 | Ricoh Company, Limited | Abnormality determining apparatus, image forming apparatus, copying machine, and information obtaining method |
| JP5530020B1 (ja) * | 2013-11-01 | 2014-06-25 | 株式会社日立パワーソリューションズ | 異常診断システム及び異常診断方法 |
| US10504036B2 (en) * | 2016-01-06 | 2019-12-10 | International Business Machines Corporation | Optimizing performance of event detection by sensor data analytics |
| US10805324B2 (en) * | 2017-01-03 | 2020-10-13 | General Electric Company | Cluster-based decision boundaries for threat detection in industrial asset control system |
| US20200097810A1 (en) * | 2018-09-25 | 2020-03-26 | Oracle International Corporation | Automated window based feature generation for time-series forecasting and anomaly detection |
-
2019
- 2019-12-25 WO PCT/JP2019/050988 patent/WO2021130936A1/ja not_active Ceased
- 2019-12-25 JP JP2021566664A patent/JP7239022B2/ja active Active
- 2019-12-25 US US17/783,105 patent/US20220413480A1/en not_active Abandoned
Patent Citations (6)
| Publication number | Priority date | Publication date | Assignee | Title |
|---|---|---|---|---|
| JP2010191556A (ja) * | 2009-02-17 | 2010-09-02 | Hitachi Ltd | 異常検知方法及び異常検知システム |
| JP2019079089A (ja) * | 2017-10-20 | 2019-05-23 | 株式会社日立製作所 | 診断装置 |
| WO2019102884A1 (ja) * | 2017-11-21 | 2019-05-31 | 日本電信電話株式会社 | ラベル生成装置、モデル学習装置、感情認識装置、それらの方法、プログラム、および記録媒体 |
| JP2019144767A (ja) * | 2018-02-19 | 2019-08-29 | 富士通株式会社 | 学習プログラム、学習方法および学習装置 |
| JP2019204155A (ja) * | 2018-05-21 | 2019-11-28 | ファナック株式会社 | 異常検出器 |
| JP2020024139A (ja) * | 2018-08-07 | 2020-02-13 | ファナック株式会社 | 製品検査装置 |
Cited By (4)
| Publication number | Priority date | Publication date | Assignee | Title |
|---|---|---|---|---|
| JP2023023555A (ja) * | 2021-08-05 | 2023-02-16 | パナソニックIpマネジメント株式会社 | モデル生成装置、モデル生成方法、異常予兆検知装置、異常予兆検知方法及び異常予兆検知システム |
| JP7656863B2 (ja) | 2021-08-05 | 2025-04-04 | パナソニックIpマネジメント株式会社 | モデル生成装置、モデル生成方法、異常予兆検知装置、異常予兆検知方法及び異常予兆検知システム |
| CN114978863A (zh) * | 2022-05-17 | 2022-08-30 | 安天科技集团股份有限公司 | 一种数据处理方法、装置、计算机设备及可读存储介质 |
| CN114978863B (zh) * | 2022-05-17 | 2024-03-01 | 安天科技集团股份有限公司 | 一种数据处理方法、装置、计算机设备及可读存储介质 |
Also Published As
| Publication number | Publication date |
|---|---|
| US20220413480A1 (en) | 2022-12-29 |
| JPWO2021130936A1 (https=) | 2021-07-01 |
| JP7239022B2 (ja) | 2023-03-14 |
Similar Documents
| Publication | Publication Date | Title |
|---|---|---|
| JP7239022B2 (ja) | 時系列データ処理方法 | |
| JP7282184B2 (ja) | 工業プロセスで使用されるコンポーネントから発生する信号の異常を検出及び測定するためのシステムと方法 | |
| US12607995B2 (en) | Automated analysis of non-stationary machine performance | |
| CN120046873B (zh) | 基于物联网传感的选煤全流程监控决策方法及系统 | |
| Abdallah et al. | Anomaly detection through transfer learning in agriculture and manufacturing IoT systems | |
| JPWO2016147656A1 (ja) | 情報処理装置、情報処理方法、及び、記録媒体 | |
| JP6708203B2 (ja) | 情報処理装置、情報処理方法、及び、プログラム | |
| JP7226542B2 (ja) | 時系列データ処理方法、時系列データ処理装置、プログラム | |
| CN116349102A (zh) | 用于电力网络中的电力异常的基于分布式监测的自适应诊断的方法、设备和系统 | |
| CN112272763A (zh) | 异常探测装置、异常探测方法以及异常探测程序 | |
| CN107831736B (zh) | 使用用于造纸机或其它系统的模型参数数据群集的模型-工厂失配检测 | |
| US20220156137A1 (en) | Anomaly detection method, anomaly detection apparatus, and program | |
| US12481277B2 (en) | Monitoring device and method for detecting anomalies | |
| TW201126289A (en) | Method and apparatus for monitoring a process and/or a technical installation | |
| US12340284B2 (en) | Time-series data processing method | |
| US11885720B2 (en) | Time series data processing method | |
| JP7264231B2 (ja) | 監視方法、監視装置、プログラム | |
| JP7248101B2 (ja) | 監視方法、監視装置、プログラム | |
| Salvador et al. | Online detection of shutdown periods in chemical plants: A case study | |
| WO2020166011A1 (ja) | 時系列データ処理方法 | |
| KR102903456B1 (ko) | 제조 데이터 흐름 분석을 통한 이상 징후 판단 ai 에이전트 제공 방법 | |
| Sharma et al. | Hybrid KNN-LSTM Framework for Intelligent Anomaly Detection in Industrial Big Data Environments | |
| Thivya et al. | Optimized Sensor Fusion Model for Industrial Predictive Maintenance | |
| JP2025114282A (ja) | 情報処理装置、ドリフト検知方法及びドリフト検知プログラム | |
| Alghuried | Big Data Analytics for Anomaly Detection in Large-Scale Sensor-Intensive Networks |
Legal Events
| Date | Code | Title | Description |
|---|---|---|---|
| 121 | Ep: the epo has been informed by wipo that ep was designated in this application |
Ref document number: 19957538 Country of ref document: EP Kind code of ref document: A1 |
|
| ENP | Entry into the national phase |
Ref document number: 2021566664 Country of ref document: JP Kind code of ref document: A |
|
| NENP | Non-entry into the national phase |
Ref country code: DE |
|
| 122 | Ep: pct application non-entry in european phase |
Ref document number: 19957538 Country of ref document: EP Kind code of ref document: A1 |