WO2020213614A1 - 環境因子予測装置、方法、プログラム、学習済モデルおよび記憶媒体 - Google Patents
環境因子予測装置、方法、プログラム、学習済モデルおよび記憶媒体 Download PDFInfo
- Publication number
- WO2020213614A1 WO2020213614A1 PCT/JP2020/016472 JP2020016472W WO2020213614A1 WO 2020213614 A1 WO2020213614 A1 WO 2020213614A1 JP 2020016472 W JP2020016472 W JP 2020016472W WO 2020213614 A1 WO2020213614 A1 WO 2020213614A1
- Authority
- WO
- WIPO (PCT)
- Prior art keywords
- data
- predictor
- prediction
- water quality
- environmental factor
- Prior art date
- Legal status (The legal status is an assumption and is not a legal conclusion. Google has not performed a legal analysis and makes no representation as to the accuracy of the status listed.)
- Ceased
Links
Images






Classifications
-
- G—PHYSICS
- G06—COMPUTING OR CALCULATING; COUNTING
- G06N—COMPUTING ARRANGEMENTS BASED ON SPECIFIC COMPUTATIONAL MODELS
- G06N5/00—Computing arrangements using knowledge-based models
- G06N5/04—Inference or reasoning models
-
- G—PHYSICS
- G06—COMPUTING OR CALCULATING; COUNTING
- G06N—COMPUTING ARRANGEMENTS BASED ON SPECIFIC COMPUTATIONAL MODELS
- G06N3/00—Computing arrangements based on biological models
- G06N3/02—Neural networks
- G06N3/08—Learning methods
-
- G—PHYSICS
- G01—MEASURING; TESTING
- G01W—METEOROLOGY
- G01W1/00—Meteorology
- G01W1/02—Instruments for indicating weather conditions by measuring two or more variables, e.g. humidity, pressure, temperature, cloud cover or wind speed
-
- G—PHYSICS
- G06—COMPUTING OR CALCULATING; COUNTING
- G06N—COMPUTING ARRANGEMENTS BASED ON SPECIFIC COMPUTATIONAL MODELS
- G06N3/00—Computing arrangements based on biological models
- G06N3/02—Neural networks
- G06N3/04—Architecture, e.g. interconnection topology
- G06N3/044—Recurrent networks, e.g. Hopfield networks
-
- G—PHYSICS
- G06—COMPUTING OR CALCULATING; COUNTING
- G06N—COMPUTING ARRANGEMENTS BASED ON SPECIFIC COMPUTATIONAL MODELS
- G06N3/00—Computing arrangements based on biological models
- G06N3/02—Neural networks
- G06N3/04—Architecture, e.g. interconnection topology
- G06N3/044—Recurrent networks, e.g. Hopfield networks
- G06N3/0442—Recurrent networks, e.g. Hopfield networks characterised by memory or gating, e.g. long short-term memory [LSTM] or gated recurrent units [GRU]
-
- G—PHYSICS
- G06—COMPUTING OR CALCULATING; COUNTING
- G06N—COMPUTING ARRANGEMENTS BASED ON SPECIFIC COMPUTATIONAL MODELS
- G06N3/00—Computing arrangements based on biological models
- G06N3/02—Neural networks
- G06N3/04—Architecture, e.g. interconnection topology
- G06N3/0464—Convolutional networks [CNN, ConvNet]
-
- G—PHYSICS
- G06—COMPUTING OR CALCULATING; COUNTING
- G06N—COMPUTING ARRANGEMENTS BASED ON SPECIFIC COMPUTATIONAL MODELS
- G06N3/00—Computing arrangements based on biological models
- G06N3/02—Neural networks
- G06N3/08—Learning methods
- G06N3/09—Supervised learning
-
- G—PHYSICS
- G06—COMPUTING OR CALCULATING; COUNTING
- G06N—COMPUTING ARRANGEMENTS BASED ON SPECIFIC COMPUTATIONAL MODELS
- G06N3/00—Computing arrangements based on biological models
- G06N3/02—Neural networks
- G06N3/08—Learning methods
- G06N3/092—Reinforcement learning
-
- G—PHYSICS
- G06—COMPUTING OR CALCULATING; COUNTING
- G06N—COMPUTING ARRANGEMENTS BASED ON SPECIFIC COMPUTATIONAL MODELS
- G06N3/00—Computing arrangements based on biological models
- G06N3/02—Neural networks
- G06N3/08—Learning methods
- G06N3/096—Transfer learning
-
- G—PHYSICS
- G06—COMPUTING OR CALCULATING; COUNTING
- G06N—COMPUTING ARRANGEMENTS BASED ON SPECIFIC COMPUTATIONAL MODELS
- G06N5/00—Computing arrangements using knowledge-based models
- G06N5/02—Knowledge representation; Symbolic representation
- G06N5/022—Knowledge engineering; Knowledge acquisition
-
- E—FIXED CONSTRUCTIONS
- E02—HYDRAULIC ENGINEERING; FOUNDATIONS; SOIL SHIFTING
- E02B—HYDRAULIC ENGINEERING
- E02B1/00—Equipment or apparatus for, or methods of, general hydraulic engineering, e.g. protection of constructions against ice-strains
-
- Y—GENERAL TAGGING OF NEW TECHNOLOGICAL DEVELOPMENTS; GENERAL TAGGING OF CROSS-SECTIONAL TECHNOLOGIES SPANNING OVER SEVERAL SECTIONS OF THE IPC; TECHNICAL SUBJECTS COVERED BY FORMER USPC CROSS-REFERENCE ART COLLECTIONS [XRACs] AND DIGESTS
- Y02—TECHNOLOGIES OR APPLICATIONS FOR MITIGATION OR ADAPTATION AGAINST CLIMATE CHANGE
- Y02A—TECHNOLOGIES FOR ADAPTATION TO CLIMATE CHANGE
- Y02A20/00—Water conservation; Efficient water supply; Efficient water use
- Y02A20/152—Water filtration
Definitions
- the present invention relates to a technique for predicting environmental factors, and particularly to a technique for predicting environmental factors in water related to the occurrence of diseases such as red tide, blue tide, green powder and seafood.
- Non-Patent Document 1 creates an environmental factor appropriateness index model for each of the water quality and meteorological observation data observed in real time in Ise Bay, calculates the habitat appropriateness index from the product, and predicts the red tide. There is. In this method, the red tide is predicted one day before, but it is generally desirable to predict the occurrence at least three days before. Further, in this method, the predictive value and the prediction rate are 59.4% and 69.5%, respectively, which are not sufficient.
- Non-Patent Document 2 predicts red tide biomass by machine learning that combines linear and non-linear analysis, suggesting that more accurate prediction than before has become possible.
- analysis dealing only with marine information is performed.
- the chlorophyll concentration is often the prediction target, but it can be seen that the prediction accuracy of the chlorophyll concentration in Patent Document 2 is insufficient.
- Non-Patent Document 3 applies a chaos recurrent neural network to time-series data of chlorophyll concentration to predict future chlorophyll concentration. However, sufficient prediction accuracy has not been obtained.
- An object of the present invention is to predict environmental factors that cause diseases such as red tide, blue tide, green powder, and seafood in a long-term and highly accurate manner.
- the environmental factor prediction device is Water quality data including values, water temperature, salinity, dissolved oxygen, turbidity, and flow velocity in multiple layers of water, depending on the amount of biopigment or bioluminescence.
- Meteorological data including temperature, precipitation, and daylight hours, Is used as an explanatory variable, and a predictor that outputs an estimated value of each item of the explanatory variable after a unit time from the time series data of the explanatory variable, and
- the prediction means for predicting the water quality data up to after N unit times (N is an integer of 2 or more), and It is characterized in that.
- red tide refers to a phenomenon in which the color of water changes significantly due to the overgrowth of microorganisms living in seawater, particularly photosynthetic microorganisms such as plankton and bacteria, and chemosynthetic microorganisms.
- white Including tide and green tide.
- blue powder blue powder refers to a phenomenon in which microorganisms living in fresh water, particularly microalgae, grow abnormally.
- blue tide refers to a phenomenon in which an oxygen-deficient water mass rises near the surface of water due to decomposition of mass-proliferated plankton and dead bacteria.
- plankton includes both phytoplankton and zooplankton.
- the chemosynthetic microorganisms include heterotrophic microorganisms such as Noctiluca.
- the diseases of seafood are classified into bacteria such as vibrio, viruses such as koi herpes, and other protists, and refer to those that can be pathogens in seafood.
- Concentration, absorbance, or fluorescence intensity can be mentioned as values according to the amount of biopigment and bioluminescence.
- biopigments include chlorophylls, carotenes, xanthophylls (lutein, fucoxanthin, etc.) and phycobilins (phycocyanin, phycoerythrin, etc.).
- bioluminescence include luminescence by a chemical reaction of luciferin-luciferase. By measuring the absorbance, it is possible to qualitatively and quantify biological samples such as nucleic acids and proteins composed of DNA and RNA, and thereby it is possible to determine the qualitative and quantification of the total amount of bacteria, viruses, protists, etc. in water.
- the amount of biopigment and the amount of bioluminescence are examples of environmental factors that cause red tide, blue tide, blue powder, and the like.
- viruses that infect forming species such as red tide (for example, HaRNAV (heterosigma acaciovirus), HcRNAV, HcDNAV, etc.) have been confirmed to be involved in termination phenomena such as red tide, so the virus on the left is red tide, etc. It is included in one of the termination factors of.
- the water quality data includes, for example, the data of the above items for the three layers of the upper layer, the middle layer, and the lower layer of the water.
- the water quality data may include the data of the above items for two layers or four or more layers in water.
- the water quality data may be seawater data or freshwater data, depending on the purpose of the prediction.
- the predictor outputs the estimated value after the unit time of each item of the input time series data.
- the unit time may be appropriately determined according to the system requirements, but may be, for example, 1 hour, 6 hours, 1 day (24 hours), or the like.
- the above-mentioned N is arbitrary as long as it is 2 or more, but the N unit time can be set to, for example, 3 days or more, more preferably 7 days or more, still more preferably 30 days or more. If the explanatory variable has a defect, the estimated value can be calculated by performing missing value interpolation or the like.
- the predictor outputs the estimated value of each item after a unit time for all the input explanatory variables, so that the estimated value is recursed to the predictor and further after the next unit time. Estimates can be obtained. By repeating this recursive prediction, it is possible to realize the prediction of environmental factors including chlorophyll concentration in a long-term and highly accurate manner.
- the environmental factor prediction device in this embodiment may further include a prediction means for predicting the occurrence of red tide, blue tide, and green powder based on the chlorophyll concentration predicted by the prediction means.
- the forecasting means may predict the beginning and / or end of red tide.
- the forecasting means may forecast the beginning and / or end of the blue tide.
- the forecasting means may predict the beginning and / or end of green powder.
- the chlorophyll concentration published by public institutions such as the Tokyo Metropolitan Environment Bureau, Fisheries Research and Education Agency, other research institutes such as universities, or private companies. The judgment reference value may be used.
- the judgment standard values according to the plankton species and the bacterial species are also published, when making a prediction using the microbial data as described later, the judgment criteria according to the dominant plankton species and the dominant bacterial species are also published. The value may be used to determine the occurrence and termination of red tide and the like.
- the predictor in this embodiment may further accept sampling data obtained by sampling sample water as an explanatory variable and predict microbial data after a unit time.
- sampling data is microbial data on microorganisms contained in water.
- microbial data include qualitative / quantitative (ratio) data of planktons (18S rRNA gene region, 18S rRNA gene sequence) and bacteria (16S rRNA gene region, 16S rRNA gene sequence) obtained by PCR amplicon technology, and visual observation by a microscope.
- Qualitative and quantitative (individual number) data of algae at the level can be mentioned.
- Another example of the sampling data is qualitative or quantitative organic / inorganic data of organic / inorganic substances in the aquatic area by NMR analysis or ICP analysis.
- the prediction means in this embodiment corrects the estimated value of the weather data or water quality data obtained from the predictor based on the weather forecast data or water quality forecast data obtained from a simulation different from the predictor, and then makes the prediction. It may be used as an input for a vessel.
- the meteorological data may include the wind speed. Since the wind speed affects the flow velocity in water, it is possible to make a more accurate prediction by taking the wind speed into consideration.
- the predictor may be learned by machine learning.
- machine learning include RNNs (recurrent neural networks) such as Simple RNN, LSTM (Long Short-Term Memory), and GRU (Gated Recurrent Unit).
- RNNs recurrent neural networks
- LSTM Long Short-Term Memory
- GRU Gate Recurrent Unit
- the type of machine learning algorithm is as long as it can predict the environmental factors intended as the effect of the present invention by outputting the estimated value after the unit time of each item from the time series data of the above explanatory variables. It doesn't matter at all.
- reinforcement learning can be mentioned, but it is not limited to this.
- the trained model may be reconstructed by transfer learning.
- the predictor does not have to be learned by machine learning, and may be, for example, a normal simulator.
- the present invention can also be regarded as an environmental factor prediction method in which the above processing is executed by a computer. That is, another aspect of the present invention is an environmental factor prediction method performed by a computer.
- Water quality data including values, water temperature, salinity, dissolved oxygen, turbidity, and flow velocity in multiple layers of water, depending on the amount of biopigment or bioluminescence.
- Meteorological data including temperature, precipitation, and daylight hours,
- the present invention can also be regarded as a program for causing a computer to execute the above method.
- the present invention can also be regarded as a trained model for performing the above method.
- the present invention can also be regarded as a computer-readable storage medium that stores the program or the trained model.
- environmental factors that cause diseases such as red tide, blue tide, green powder, and seafood can be predicted with high accuracy over a long period of time.
- seawater data is treated as a target in order to predict the occurrence of red tide.
- Seawater data is also treated as a target when predicting the occurrence of blue tide.
- freshwater data may be treated as a target.
- red tide forming species Plankton belonging to diatoms, raphidophytes, dinophyceae, cryptoalgae, ciliates, etc. are known as red tide forming species. All of these contain a large amount of chlorophyll a and chlorophyll c. In the present embodiment, the concentration of chlorophyll a and / or chlorophyll c can be selected as an explanatory variable among chlorophylls, and the beginning or end of red tide can be predicted.
- explanatory variables for predicting environmental factors in addition to the concentrations of chlorophyll a and / or chlorophyll c, as microbial data, these diatoms, raffido algae, whirlpool algae and / or cryptoalgae, etc.
- Eukaryotic-specific 18S rRNA gene sequence qualitative and quantitative (ratio) data can be used as additional explanatory variables to predict predominant plankton and predominant algae species in the predicted red tide. ..
- Blue powder is generated when blue-green algae (blue-colored bacteria, cyanobacteria) and green algae (chlorella, chlamydomonas, etc.) dominate.
- blue-green algae blue-colored bacteria, cyanobacteria
- green algae chlorella, chlamydomonas, etc.
- concentration of chlorophyll d and / or chlorophyll f can be selected among chlorophylls, and the start or end of green powder can be predicted.
- the occurrence is predicted by using the qualitative / quantitative (ratio) data of the 16S rRNA gene sequence specific to cyanobacteria (prokaryotes) as explanatory variables as microbial data. It is possible to predict the bacterial species that cause the chlorophyll.
- chlorophyll d and / or chlorophyll f may be selected as an explanatory variable to predict the beginning or end of red tide.
- red tide predicted to occur by using qualitative / quantitative (ratio) data of 16SrRNA gene sequence specific to cyanobacteria as explanatory variables as microbial data. Bacterial species that cause chlorophyll may be predicted.
- the predicted value of each item after a unit time is estimated by regression prediction using a predictor from the observation time series data of water quality and meteorology including chlorophyll a concentration.
- the predictor obtains an estimated value of each item after one day by using input data such as chlorophyll a concentration, water temperature, and air temperature for three days on a daily basis.
- input data such as chlorophyll a concentration, water temperature, and air temperature for three days on a daily basis.
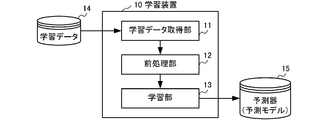
- FIG. 2 shows the configuration of the learning device 10 for learning the predictor.
- the learning device 10 includes a learning data acquisition unit 11, a preprocessing unit 12, and a learning unit 13 as its functional units.
- the learning device 10 is a computer (information processing device) including an arithmetic processor, a storage device, an input device, an output device, a communication device, and the like, and these functions are realized when the arithmetic processor executes a program.
- the learning data acquisition unit 11 acquires the learning data used for learning the predictor 15.
- the explanatory variables used as training data are roughly classified into ocean data (water quality data) and meteorological data.
- Ocean data includes chlorophyll a concentration, water temperature, salinity, dissolved oxygen amount, turbidity, and flow velocity for the upper, middle, and lower layers in the ocean. Oceanographic data may further include pH.
- the chlorophyll a concentration is adopted as the chlorophyll concentration, but in place of or in addition to this, other chlorophyll such as chlorophyll b concentration, chlorophyll c concentration, chlorophyll d concentration, chlorophyll e concentration, and chlorophyll f concentration. Concentration of may be adopted. Further, the concentrations of bacteriochlorophyll a, b, c, d, e, f, g and the like may be adopted.
- Chlorophyll is an example of a biopigment, and concentrations of other biopigments such as carotenes, xanthophylls (lutein, fucoxanthin, etc.) and phycobilins (phycocyanin, phycoerythrin, etc.) may be adopted. Further, the absorbance or fluorescence intensity may be used as an explanatory variable instead of the chlorophyll concentration. The same applies to other biopigments. Further, the bioluminescence amount may be used as an explanatory variable in place of or in addition to the chlorophyll concentration. For example, there is a luminescence amount due to a chemical reaction of luciferin-luciferase such as Noctiluca.
- Oceanographic data may be acquired by remote measurement using a hyperspectral sensor using an artificial satellite, in addition to direct measurement by sampling seawater or inserting a sensor into the seawater.
- the horizontal distance upstream or downstream with respect to the direction of the water flow can also be a predictor.
- Meteorological data includes temperature, precipitation, and sunshine hours. Meteorological data may further include barometric pressure, wind speed, humidity, and cloud cover.
- the learning data acquisition unit 11 acquires these observed values. do it. However, data published by other organizations such as private companies or data observed independently may be used.
- microbial data from experiments using ocean-sampled samples may be added to the learning data.
- qualitative / quantitative (ratio) data of planktons (18S rRNA gene region, 18S rRNA gene sequence) and bacteria (16S rRNA gene region, 16S rRNA gene sequence) may be added by the PCR amplicon sequencing technique of seawater.
- qualitative / quantitative data of marine organic / inorganic substances by NMR analysis or ICP analysis of seawater may be added, and qualitative / quantitative (individual number) data of algae at a visual level by a microscope may be added. ..
- forecast data obtained by meteorological / ocean simulation may be used for ocean data and meteorological data.
- atmospheric pressure, wind speed, air volume, wind direction, temperature, humidity, precipitation, cloud cover, solar radiation (downward short-wave radiation), obtained using the Global Numerical Weather Prediction Model (GSM), Infrared radiation amount (downward long wave radiation amount) or the like may be used.
- GSM Global Numerical Weather Prediction Model
- MSM meso numerical weather prediction model
- the ocean current, water temperature, salinity, etc. for the seawater of the whole earth obtained by using the ocean general circulation model for example, Regional Ocean Modeling System (ROMS)
- forecast data based on a model that combines the atmosphere and the ocean may be used.
- the chlorophyll concentration, water temperature, salinity, dissolved oxygen amount, turbidity, flow velocity, etc. obtained by using the river inflow model may be used.
- the pre-processing unit 12 performs outlier processing, missing value interpolation, data integration, and normalization processing.
- the preprocessing unit 12 excludes or interpolates outliers and missing values as necessary.
- a value using the k-nearest neighbor method, MissForest, median value, average value, or the like may be adopted. Missing value interpolation is particularly effective when the data has periodicity or has little variation. Normalization is a process in which the maximum value is 1 and the minimum value is 0.
- the preprocessing unit 12 may perform discretization processing for converting continuous data into discrete data and data compression processing (eigenvalue decomposition), if necessary.
- the learning unit 13 learns the predictor (prediction model) 15 that obtains the estimated value of each explanatory variable included in the input data one day later from the observation time series data for a predetermined number of days (for example, three days). Since prediction is performed based on time series data, the predictor 15 is equipped with a recurrent neural network (RNN), specifically, Simple RNN, Long Short-Term Memory (LSTM), Gated Recurrent Unit (GRU), etc. It is available.
- RNN recurrent neural network
- LSTM Long Short-Term Memory
- GRU Gated Recurrent Unit
- reinforcement learning can be mentioned, but it is not limited to this.
- the trained model may be reconstructed by transfer learning.
- the predictor does not have to be learned by machine learning, and may be, for example, a normal simulator.
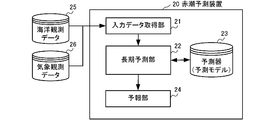
- FIG. 3 shows a configuration according to an embodiment of the red tide prediction device 20 for predicting the occurrence of red tide.
- the red tide prediction device 20 includes an input data acquisition unit 21, a long-term prediction unit 22, a predictor 23, and a forecast unit 24 as its functional units.
- the red tide prediction device 20 is a computer (information processing device) including an arithmetic processor, a storage device, an input device, an output device, a communication device, and the like, and these functions are realized when the arithmetic processor executes a program.
- FIG. 4 is a flowchart showing the flow of the red tide prediction process performed by the red tide prediction device 20.
- the red tide prediction device 20 will be described with reference to FIGS. 3 and 4.
- the predictor 23 is learned based on ocean observation data and meteorological observation data.
- step S101 the input data acquisition unit 21 acquires the observation data for the latest A day (predetermined number of days) at the point where the red tide occurrence prediction is performed.
- step S103 the forecasting unit 24 predicts the start and end of the red tide occurrence based on the chlorophyll a concentration up to the Nth day.
- the criterion value based on the chlorophyll a concentration published by a public institution such as the Tokyo Metropolitan Environment Bureau may be used.
- FIG. 5 shows the configuration of the red tide prediction device 30 according to another embodiment.
- FIG. 6 is a flowchart showing the flow of the red tide prediction process performed by the red tide prediction device 30 in this configuration example.
- the same reference numerals are given to the same configurations and processes as described above.
- the input data acquisition unit 21 acquires the ocean observation data 25, the meteorological observation data 26, and the microorganism sampling data 27 for day A in step S101. In addition, the input data acquisition unit 21 acquires the weather forecast data up to N days later in step S201.
- the weather forecast data is, for example, simulation data of atmospheric pressure, wind speed, air volume, wind direction, temperature, humidity, precipitation, cloud cover, solar radiation, etc. for the atmosphere of the entire earth by a global numerical weather prediction model (GSM).
- GSM global numerical weather prediction model
- the long-term prediction unit 22 inputs ocean observation data, meteorological observation data, and sampling data to the predictor 23 to predict the data one day later, and further recurses it to the predictor 23.
- the long-term forecasting unit 22 corrects the weather data predicted by the predictor 23 based on the acquired weather forecast data, and then recursively inputs the weather data into the predictor 23.
- the specific correction method is arbitrary, and it is assumed that, for example, a simple average or a weighted average is taken. In this way, after correcting the predicted value of the meteorological data, the predictor 23 can be recurred to enable more accurate prediction.
- the ocean observation data (water quality data) 25 can also be recursively input to the predictor 23 after correcting the ocean data (water quality data) predicted by the predictor 23 by the prediction data based on the simulation. Good.
- the forecasting unit 24 predicts the beginning and end of red tide occurrence based on the chlorophyll a concentration up to N days later. Furthermore, the forecasting unit 24 also predicts the dominant plankton species and the dominant bacterial species in the red tide that occurs, based on the predicted values of the microbial sampling data at the time when the outbreak is predicted. The forecasting unit 24 uses criteria according to the dominant plankton species and the dominant bacterial species (for example, 500 cells / ml or more when the Karenia species is the dominant species) to start and end the development of red tide. May be predicted. In this configuration example, since microbial sampling data is also used, the occurrence of red tide using the prediction of the dominant plankton species and the dominant bacterial species and the judgment criteria according to the dominant plankton species and the dominant bacterial species. It is predictable.
- ⁇ Analysis example 1> As an example of red tide prediction, we tried to predict the chlorophyll a concentration as an index of red tide occurrence in the inner part of Tokyo Bay (off Urayasu). For real-time meteorological observation data, the sunshine duration and precipitation of Edogawa criticality were obtained every hour from the website of the Japan Meteorological Agency, and the average and total amount for each day were calculated. Real-time ocean observation data is available from the website of the Tokyo Bay Environmental Information Center on the upper and middle ocean layers regarding chlorophyll a concentration, water temperature, salinity, dissolved oxygen content, turbidity, and flow rate (flow velocity) every hour off Urayasu. The data of the lower layer and the data of the air volume (wind velocity) were acquired, and the average and the total amount for each day were calculated.
- the explanatory variables used in this embodiment are 52 items as follows.
- [Ocean data] Chlorophyll a concentration (upper layer, middle layer, lower layer: daily average value) ⁇ Water temperature (upper / middle / lower: daily average) ⁇ Salinity (upper / middle / lower: daily average) ⁇ Dissolved oxygen amount (upper layer, middle layer, lower layer: daily average value) ⁇ Turbidity (upper / middle / lower: daily average) ⁇ Flow velocity (upper layer, middle layer, lower layer: daily average value and daily total value for each component of north, south, east and west) [Weather data] ⁇ Temperature (daily average) ⁇ Precipitation (daily average, daily total) ⁇ Daylight hours (daily average value, daily total value) ⁇ Wind speed (daily average and daily total for each component of north, south, east and west)
- the predictor used the above 52 items 1 to 3 days ago as explanatory variables and the 52 items on day 0 as objective variables. That is, the number of nodes in the input layer and the output layer is the same, and a prediction model for all variables is created.
- the hidden layer was 100 nodes.
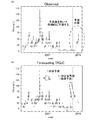
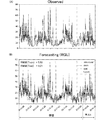
- FIG. 7A shows the fluctuation of the chlorophyll a concentration in the observed data. Of these, 7 years'worth of data was used as learning data (training data), and 1 year's worth of test data (verification data) was used.
- FIG. 7B is a diagram showing the prediction result after one day by the predictor learned by using GRU superimposed on the observation data. Comparing the predictions using the training data with the observed values, they were almost the same, indicating that the learning was sufficiently performed.
- the mean learning error (RMSE) was 11.97 ⁇ g / L.
- test data for about one year not used for learning was applied to the prediction model, and prediction was performed one day later. The prediction error is 15.29 ⁇ g / L, indicating that the prediction is highly versatile.
- FIG. 8A shows the fluctuation of the observation data of the chlorophyll a concentration as in FIG. 7A, but the period from the latter half of 2017 to the middle of January 2018 is enlarged and displayed.
- FIG. 8B shows the values predicted for 30 days until the end of January 2017 by inputting the observation data for 3 days at the end of December 2017, making a prediction one day later, and recurring the predicted value one day later into the prediction model. Is. As shown in the figure, the predicted values and the observed values showed good agreement for about 15 days until mid-January 2018. In this way, it can be seen that this method is useful for long-term prediction.
- FIG. 9A shows the observation data for 7 years as training data as in the analysis example 1, the remaining 1 year as test data, and the prediction result by the predictor learned by the GRU algorithm superimposed on the observation data. It is a figure.
- the prediction error is 18.11 ⁇ g / L, which is lower than that of Analysis Example 1, but it can be seen that sufficient accuracy is obtained.
- FIG. 9B is the result of recursively inputting the predicted value into the created prediction model one day later and performing long-term prediction up to 30 days later. Similar to Analysis Example 1 (Fig. 8B), by inputting the observation data for 3 days at the end of December 2017, making a prediction one day later, and recurring the predicted value one day later to the prediction model until the end of January 2017. It is a value predicted for 30 days of. In this way, the increase in chlorophyll a concentration occurring in mid-January 2018 can be predicted without using wind speed data.
- sampling data 7 items such as Karenia brevis are used as microbial data contained in the sample water, 214 items such as amino acids and sugars are used as organic data, and 20 items such as nitrogen, phosphorus and silicon are used as inorganic data. .. Of the 52 items of oceanographic data and meteorological data, 19 items of daily total value are not used, but 33 items are used.
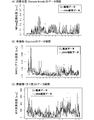
- 10A-10C show observation data and interpolation data of dinophyceae (marine microorganisms), glycine (organic matter), and silicon (inorganic matter) as examples.
- the data marked with a circle are the observation data, and the others are the data obtained by interpolation.
- the discrete data is converted into continuous data (daily data), and the ocean data, the meteorological data, and the sampling data are integrated.
- FIG. 11A shows the fluctuation of the chlorophyll a concentration in the observation data for about three and a half years from April 2015 to November 2018. Of these observation data, the previous three years were used as training data (training data), and the rest were used as test data (verification data).
- FIG. 11B is a diagram showing the prediction result one day later by the predictor learned using GRU superimposed on the observation data. The learning error is 5.93 ⁇ g / L and the prediction error is 8.21 ⁇ g / L, and it can be seen that more accurate prediction can be realized by adding sampling data.
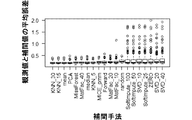
- FIG. 12 is a box plot showing the error between the interpolated value and the observed value obtained by each interpolation method. For the numerical value after the underscore shown in the interpolation method, how many data should the nearest neighbor distance be taken in KNN, and for MatFac (Matrix Factorization), SVD, and SoftImpute, how many components should be decomposed into eigenvalues to generate an interpolation model? , Is shown.
- RMSD smallest average error
- the prediction is made using the data of the one-day interval, but the time interval of the data may be longer or shorter. For example, learning and prediction may be performed using data every hour.
- the predictor uses the data for 3 days (3 unit hours) to predict the data after 1 day, but uses the data for a longer period to obtain the data after 1 day. You may predict. By lengthening the number of days, improvement in prediction accuracy can be expected, and in particular, if the periodicity of data is reflected in learning, it will greatly contribute to the improvement in prediction accuracy. On the other hand, increasing the number of days increases the possibility of encountering missing value data, so it is advisable to determine the number of days in consideration of this point as well.
- FIG. 3 there are two types of input data, ocean observation data 25 and meteorological observation data 26 (FIG. 3), ocean observation data 25, meteorological observation data 26, sampling data 27, and meteorological forecast data 28.
- An example (FIG. 5) in which the four types of the above are used has been described.
- the sampling data 27 may include data on only one or two of microorganisms, organic substances, and inorganic substances.
- the occurrence of red tide is predicted, but it is possible to generate blue tide with the same configuration. Further, it may be used as an environmental factor prediction method and apparatus that performs processing up to the prediction of the chlorophyll a concentration without performing the prediction of the occurrence of red tide and blue tide. Further, the generation of blue powder may be predicted by the same configuration as described above. In this case, the sample water is fresh water instead of seawater.
- Embodiment 2 This embodiment is basically the same as that of the first embodiment, except that transfer learning is performed based on a predictor learned using learning data in a certain area and applied to another area.
- the predictor learned using the learning data of one area can be applied to another area. This is effective in that it is not necessary to acquire learning data at each mounting site, but if the predictor is applied as it is, the prediction accuracy may decrease. Therefore, in the present embodiment, a predictor suitable for the mounting site is generated by using transfer learning.
- the method of the first embodiment is used to generate a predictor (learning model) in an area (for example, Tokyo Bay) where a sufficient amount of learning data can be acquired.
- This predictor (learning model) can also be referred to as a pre-trained predictor (learning model).
- the learning data at the mounting site to which the predictor is applied is prepared.
- the content of the learning data itself is the same as that of the first embodiment.
- Further learning of the predictor is performed using the learning data at the mounting site.
- the weight of the layer close to the input in the network of the predictor may be fixed and only the weight of the layer close to the output may be adjusted.
- weights of the nodes associated with the geographic parameters may be adjusted.
- learning may be performed in advance using learning data of a plurality of locations, and only nodes whose importance changes depending on the location may be adjusted.
- the weight information is obtained by calculating the importance by a random forest, but it may be obtained by using other machine learning algorithms.
- on-site prediction is performed using the predictor obtained by such transfer learning.
- FIG. 13 shows a prediction when the predictor A learned using the learning data of Tokyo Bay without using transfer learning is applied to the mounting site (tuna farm in Imari Bay) as it is, and the learning data of the mounting site is used. It is a figure which compares the prediction when the predictor B which trained by transfer is applied.
- Graph 1300 shows the measured value of the chlorophyll a concentration at the mounting site.
- Graph 1301 shows the predicted value after 1 day using the predictor A
- graph 1302 shows the predicted value after 3 days using the predictor A.
- the measured values are also shown by thin lines for comparison. As can be seen from the figure, in this example, the error between the predicted value and the measured value is large. Since the prediction after 3 days has a large error, the prediction after 7 days using the predictor A is not performed.
- Graphs 1311-1313 are graphs plotting predicted values after 1 day, 3 days, and 7 days using the predictor B learned by transfer learning, respectively. It can be seen that the prediction accuracy is improved by performing transfer learning. Chlorophyll a concentration, that is, the onset and termination of red tide, can be predicted even after 7 days.
- the transfer learning is performed based on the predictor learned in advance for the area with a large amount of learning data, a highly accurate predictor can be easily generated even if the learning data at the mounting site is small. ..
- the parameters directly related to the geographical factors are not used as explanatory variables in the first embodiment, how each parameter affects the occurrence of red tide may change depending on the geographical influence.
- Transfer learning adjusts the weights between each parameter to reflect the specificity at the mounting site, improving prediction accuracy.
- the contribution rate for each parameter may be obtained and the parameter with the higher contribution rate may be output.
- the parameters with the highest contribution rate in Tokyo Bay are K, S, Ca, Tp, Sr, B, NH 3- N, and Na in the order of organic / inorganic substances, and chlorophyll a concentration and sunshine in the environmental physical parameters.
- the order is time, pH, water temperature, westerly wind, easterly wind, dissolved oxygen amount, and southerly wind.
- the parameters with high contribution rate in Imari Bay are Sr, Mg, K, B, Na, S, Ca, Li for organic / inorganic substances, and north wind, south wind, sunshine duration, west wind, etc. for environmental physical parameters. Chlorophyll a concentration, easterly wind, precipitation, and water temperature. As described above, according to the present embodiment, important factors can be obtained at the mounting site.
- the present embodiment is to use meteorological simulation data, ocean simulation data, and river inflow simulation data for red tide occurrence prediction.
- the configuration of the red tide generator is the same as that in FIG.
- the ocean data and meteorological data obtained by observation and the data obtained by simulation used in this embodiment are used as explanatory variables, and the ocean data and meteorological data after one time step are predicted as objective variables.
- ocean data or meteorological data will refer to data obtained by observation or predicted by the predictor 23, and data obtained by simulation different from the predictor 23 will be referred to as simulation data.
- the input data acquisition unit 21 acquires the ocean observation data 25 and the meteorological observation data 26 for the latest predetermined time step. In addition, the input data acquisition unit 21 acquires simulation data for the latest predetermined time step and the time step to be the target of the long-range forecast.
- the predictor 23 inputs the ocean data and meteorological data for the latest predetermined time step, and the simulation data for the latest predetermined time step and the time step to be the target of the long-range forecast, and the ocean data and the weather after one time step. Predict the data.
- the long-term prediction unit 22 uses the predicted ocean data and meteorological data to predict ocean data and meteorological data up to a predetermined time step ahead one time step at a time. Note that the input to the predictor 23 may be oceanographic data, meteorological data, and simulation data for the most recent predetermined time step.
- the learning of the predictor 23 may be performed by the same method as in the first embodiment. However, the difference is that simulation data is used as training data in addition to observation data.
- chlorophyll a concentration, water temperature, salinity, dissolved oxygen amount (DO), turbidity, and flow velocity (east-west component, north-south component) of each of the upper, middle, and lower layers are adopted as ocean data (21 items).
- .. As meteorological data, temperature, wind speed (east-west component, north-south component), precipitation, and sunshine duration are adopted (5 items).
- phytoplankton amount water temperature, salinity, east-west flow velocity, north-south flow velocity, zooplankton amount, ammonia nitrogen, nitrate nitrogen are adopted (8 items).
- temperature (2 m above sea level) precipitation (cumulative precipitation for 1 hour from that time), downward shortwave radiation, and downward longwave radiation are adopted (4 items).
- Inflows from the Koito, Obitsu, Tama, Tsurumi, Arakawa, Sumida, Edo, and Hanami rivers (8 items) are used as river inflow simulation data.
- ROMS was adopted for the ocean simulation
- MSM was adopted for the meteorological simulation.
- observation data and simulation data are acquired every 6 hours with 6 hours as one time step, and the predictor 23 predicts ocean data and meteorological data of the next time step from the latest 6 time steps (36 hours).
- the CNN-QRNN algorithm is used for learning the predictor 23.
- the long-term prediction unit 22 repeats the prediction by the predictor 23 six times to predict ocean data and meteorological data up to after 6 time steps (36 hours later).
- FIG. 14 shows the measured value of the chlorophyll a concentration in Tokyo Bay and the predicted value using the predictor learned in this example.
- Graph 1400 shows the measured value of the chlorophyll a concentration.
- Graphs 1401 to 1406 show predicted values after 6, 12, 18, 24, 30, and 36 hours, respectively. The measured values are also shown by thin lines for comparison.
- the amounts of photosynthetic microorganisms such as plankton and bacteria and chemosynthetic microorganisms are predicted in order to predict the occurrence of red tide, blue tide, and green powder.
- the above technique can be used not only for red tide, blue tide, and green powder, but also for predicting the occurrence of diseases of seafood. In that case, it is necessary to include a parameter indicating the amount of pathogen (causative substance) that causes the disease in the ocean data (water quality data).
- Vibrio disease is an example of a disease.
- Vibrio disease is a general term for infectious diseases caused by Vibrio bacteria.
- the amount of Vibrio bacteria can be measured by a host-specific DNA sequence. If the pathogen is a protist, the amount of the pathogen can be measured by a specific DNA sequence. If the pathogen is a virus, the amount of pathogen can be measured by a specific RNA or DNA sequence.
- the absorbance by measuring the absorbance, it is possible to qualitatively and quantify biological samples such as nucleic acids and proteins composed of DNA and RNA. This makes it possible to determine the qualitative and quantitative amounts of bacteria, viruses, protists, etc. in water.
- the absorbance may be measured after collecting environmental water such as seawater or lake water and generating it with a filter or the like.
- the qualitative and quantitative values of the virus obtained by the absorbance measurement correspond to the values corresponding to the amount of biopigment or bioluminescence in the present invention.
- This embodiment may be implemented in combination with any of the first to third embodiments.
Landscapes
- Engineering & Computer Science (AREA)
- Theoretical Computer Science (AREA)
- Physics & Mathematics (AREA)
- General Engineering & Computer Science (AREA)
- Artificial Intelligence (AREA)
- Software Systems (AREA)
- Computational Linguistics (AREA)
- Data Mining & Analysis (AREA)
- Evolutionary Computation (AREA)
- Mathematical Physics (AREA)
- General Physics & Mathematics (AREA)
- Computing Systems (AREA)
- Life Sciences & Earth Sciences (AREA)
- Biophysics (AREA)
- Molecular Biology (AREA)
- General Health & Medical Sciences (AREA)
- Biomedical Technology (AREA)
- Health & Medical Sciences (AREA)
- Environmental & Geological Engineering (AREA)
- Atmospheric Sciences (AREA)
- Biodiversity & Conservation Biology (AREA)
- Ecology (AREA)
- Environmental Sciences (AREA)
- Management, Administration, Business Operations System, And Electronic Commerce (AREA)
- Measuring Or Testing Involving Enzymes Or Micro-Organisms (AREA)
- Farming Of Fish And Shellfish (AREA)
Abstract
環境因子予測装置は、水中の複数の層における、生体色素量または生体発光量に応じた値(例えば、クロロフィル濃度)、水温、塩分濃度、溶存酸素、濁度、および流速を含む水質データと、気温、降水量、および日照時間を含む気象データと、を説明変数とし、当該説明変数の時系列データから、単位時間後の当該説明変数の各項目の推定値を出力する予測器と、前記予測器による推定値を再び前記予測器の入力とする予測を繰り返すことにより、N単位時間後までの前記水質データを予測する予測手段と、を備える。本発明によれば、赤潮・青潮・青粉や魚介の病害等の発生要因となる環境因子を長期的かつ高精度に予測できる。
Description
本発明は、環境因子を予測する技術に関し、特に赤潮・青潮・青粉や魚介の病害等の発生に関連する水中の環境因子を予測する技術に関する。
赤潮(プランクトンやバクテリアの異常増殖)の発生は、水産業に多大な被害を与えるため、従来から赤潮の予測法の構築が試みられてきた。特に近年は、計算機器やシミュレーション、人工知能(AI)、IoT関連技術の発展に伴い、種々の赤潮予測方法が提案されている。
非特許文献1の手法は、伊勢湾においてリアルタイムに観測された水質・気象観測データについて、それぞれ環境要因適正指数モデルを作成し、それらの積からハビタット適正指数を算出して、赤潮予測を行っている。この手法では、1日前に赤潮を予測しているが、一般的には3日以上前に発生を予測することが望ましい。また、この手法では、適中率および予測率が各々59.4%および69.5%であり、十分ではあるとはいえない。
非特許文献2の手法は、線形・非線形解析を組み合わせた機械学習による赤潮バイオマスの予測を行っており、従来よりも高精度な予測が可能になったことを示唆している。なお、特許文献2では、海洋情報のみを扱った解析を行っている。また、一般的に、環境因子の予測においては、クロロフィル濃度を予測対象とすることが多いが、特許文献2のクロロフィル濃度の予測精度は不十分であることがうかがえる。さらに、代替の予測対象の赤潮バイオマスと赤潮発生の関連性や定義が不明瞭であるという問題点がある。
非特許文献3の手法は、クロロフィル濃度の時系列データにカオスリカレントニューラルネットワークを適用して、将来のクロロフィル濃度の予測を行っている。しかしながら、十分な予測精度が得られていない。
なお、赤潮以外にも、青潮および青粉あるいは魚介の病害等の水中の環境関連の予測も同様に対象とすることが望まれる。
田中陽二; 杉本佑奈. 伊勢湾の自動水質観測装置を用いた植物プランクトンの大量発生予測システムの開発. 土木学会論文集 B3 (海洋開発), 2016, 72.2: I#970-I#975.
QIN, Mengjiao; LI, Zhihang; DU, Zhenhong. Red tide time series forecasting by combining ARIMA and deep belief network. Knowledge-Based Systems, 2017, 125: 39-52.
原田 昌佳, 堂馬 彬史, 平松 和昭, 丸居 篤, カオスリカレントニューラルネットワークによるクロロフィルa時系列の短期予測, 平成24年度農業農村工学会大会講演会, 2012.09.
本発明は、赤潮・青潮・青粉や魚介の病害などの発生要因となる環境因子を長期的かつ高精度に予測することを目的とする。
本発明の一態様に係る環境因子予測装置は、
水中の複数の層における、生体色素量または生体発光量に応じた値、水温、塩分濃度、溶存酸素、濁度、および流速を含む水質データと、
気温、降水量、および日照時間を含む気象データと、
を説明変数とし、当該説明変数の時系列データから、単位時間後の当該説明変数の各項目の推定値を出力する予測器と、
前記予測器による推定値を再び前記予測器の入力とする予測を繰り返すことにより、N単位時間後(Nは2以上の整数)までの前記水質データを予測する予測手段と、
を備える、ことを特徴とする。
水中の複数の層における、生体色素量または生体発光量に応じた値、水温、塩分濃度、溶存酸素、濁度、および流速を含む水質データと、
気温、降水量、および日照時間を含む気象データと、
を説明変数とし、当該説明変数の時系列データから、単位時間後の当該説明変数の各項目の推定値を出力する予測器と、
前記予測器による推定値を再び前記予測器の入力とする予測を繰り返すことにより、N単位時間後(Nは2以上の整数)までの前記水質データを予測する予測手段と、
を備える、ことを特徴とする。
本開示において、赤潮は、海水中に生存している微生物、特にプランクトンやバクテリアなどの光合成微生物や化学合成微生物の異常増殖により、水の色が著しく変わる現象を指し、狭義の赤潮以外に、白潮、緑潮を含む。また、本開示において、青粉(アオコ)は、淡水中に生存している微生物、特に微細藻類が異常増殖する現象を指す。また、本開示において、青潮は、大量増殖したプランクトンやバクテリアの死骸の分解に伴う貧酸素水塊が水面近くに上昇する現象を指す。また、本開示において、プランクトンは、植物プランクトンと動物プランクトンの両方を含む。なお、化学合成微生物は、ヤコウチュウなどの従属栄養微生物が含まれる。また、本開示において、魚介の病害としては、ビブリオなどのバクテリア、コイヘルペスなどのウィルス、その他原生生物などの分類があり、魚介を対象として病原体となり得るものをいう。
生体色素量や生体発光量に応じた値として、濃度、吸光度、または蛍光光度が挙げられる。生体色素の例として、クロロフィル、カロテン類、キサントフィル類(ルティン、フコキサンチンなど)、フィコビリン類(フィコシアニン、フィコエリトリンなど)が挙げられる。生体発光の例として、ルシフェリン-ルシフェラーゼの化学反応による発光が挙げられる。吸光度の測定により、DNAやRNAから構成される核酸、タンパク質などの生体試料の定性や定量ができ、これにより水中のバクテリア、ウィルス、原生生物などの総量の定性、定量の判断が可能である。生体色素量および生体発光量は、赤潮・青潮・青粉などの発生要因となる環境因子の一例である。
また、赤潮などの形成種に感染するウィルス(例えば、HaRNAV(ヘテロシグマアカシオウィルス)、HcRNAV、HcDNAVなど)は、赤潮などの終息現象への関与が確認されているため、左記ウィルスは赤潮などの終息因子の一つに含まれる。
水質データは、例えば、水中の上層・中層・下層の3層についての上記項目のデータを含む。ただし、水質データは、水中の2層あるいは4層以上について上記項目のデータを含んでもよい。水質データは、予測の目的に応じて、海水のデータであってもよいし淡水のデータであってもよい。
予測器は、入力される時系列データの各項目の単位時間後の推定値を出力する。単位時間は、システム要求に応じて適宜決定すればよいが、例えば、1時間、6時間、1日(24時間)などとすることができる。上述のNは2以上であれば任意であるが、N単位時間が例えば、3日以上、より好ましくは7日以上、更に好ましくは30日以上となるような値とすることができる。なお、説明変数に欠損があるときは、欠損値補間などをすることにより推定値の計算をすることができる。
上記の構成によれば、予測器は、入力される説明変数の全てについて、単位時間後の各項目の推定値を出力するので、推定値を予測器に再帰させてさらに次の単位時間後の推定値を得ることができる。この再帰的な予測を繰り返すことで、クロロフィル濃度を含む環境因子の予測を長期的かつ高精度に実現できる。
本態様における環境因子予測装置は、前記予測手段によって予測されたクロロフィル濃度に基づいて、赤潮・青潮・青粉の発生を予報する予報手段、をさらに備えてもよい。予報手段は、赤潮の始期または終期あるいはその両方を予報するとよい。予報手段は、青潮の始期または終期あるいはその両方を予報するとよい。予報手段は、青粉の始期または終期あるいはその両方を予報するとよい。赤潮・青潮・青粉の発生および終息の判定には、例えば、東京都環境局のような公共機関や水産研究・教育機構その他大学等の研究機関あるいは民間企業が公表しているクロロフィル濃度の判定基準値を用いればよい。なお、プランクトン種やバクテリア種に応じた判定基準値も公表されているので、後述するような微生物データを利用して予測する場合には、優占プランクトン種や優占バクテリア種に応じた判定基準値を用いて赤潮等の発生および終息を判定しても良い。
本態様における予測器は、さらに、試料水をサンプリングして得られるサンプリングデータを説明変数として受け付け、単位時間後の微生物データを予測してもよい。サンプリングデータの一例は、水中に含まれる微生物に関する微生物データである。微生物データの例として、PCRアンプリコン技術により得られるプランクトン類(18S rRNA遺伝子領域、18S rRNA遺伝子配列)やバクテリア(16S rRNA遺伝子領域、16SrRNA遺伝子配列)の定性・定量(比率)データ、顕微鏡による視覚レベルでの藻類の定性・定量(個体数)データが挙げられる。また、サンプリングデータの別の例は、NMR分析やICP分析による水圏中の有機物・無機物の定性的あるいは定量的な有機物データ・無機物データである。サンプリングデータに微生物データを用いることで、予報手段は、発生される赤潮、青潮または青粉における優占プランクトン種や優占バクテリア種も予報できる。
本態様における予測手段は、前記予測器とは異なるシミュレーションから得られる気象予報データまたは水質予報データに基づいて、前記予測器から得られる気象データまたは水質データの推定値を補正した上で、前記予測器の入力としてもよい。
また、本態様において、気象データは風速を含んでもよい。風速が水中の流速に影響を与えるため、風速も考慮に入れることでより高精度な予測が可能となる。
また、本態様において、予測器は機械学習によって学習されてもよい。機械学習の例として、Simple RNN, LSTM (Long Short-Term Memory),GRU (Gated Recurrent Unit)のようなRNN(リカレントニューラルネットワーク)が挙げられる。機械学習のアルゴリズムは、上述の説明変数の時系列データから各項目の単位時間後の推定値を出力して、本発明の効果として意図する環境因子の予測が可能なものである限り、種類は一切問わない。再帰型ニューラルネットワーク以外では強化学習などが挙げられるが、これに限られない。また、学習済モデルは転移学習によって再構築してもよい。また、予測器は機械学習によって学習されたものでなくても良く、例えば、通常のシミュレーターであってもよい。
本発明はまた、上記の処理をコンピュータによって実行する環境因子予測方法と捉えることができる。すなわち、本発明の他の態様は、コンピュータによって実行される環境因子予測方法であって、
水中の複数の層における、生体色素量または生体発光量に応じた値、水温、塩分濃度、溶存酸素、濁度、および流速を含む水質データと、
気温、降水量、および日照時間を含む気象データと、
を説明変数とし、当該説明変数の時系列データを取得する第1ステップと、
前記説明変数の時系列データから単位時間後の当該説明変数の各項目の推定値を出力する予測器を用いて、前記取得ステップにおいて取得した時系列データの単位時間後の前記説明変数の各項目の推定値を取得する第2ステップと、
前記第2ステップにおいて取得した推定値を再び前記予測器の入力とする前記第2ステップの処理を繰り返すことにより、N単位時間後までの前記水質データを予測する第3ステップと、
を含むことを特徴とする。
水中の複数の層における、生体色素量または生体発光量に応じた値、水温、塩分濃度、溶存酸素、濁度、および流速を含む水質データと、
気温、降水量、および日照時間を含む気象データと、
を説明変数とし、当該説明変数の時系列データを取得する第1ステップと、
前記説明変数の時系列データから単位時間後の当該説明変数の各項目の推定値を出力する予測器を用いて、前記取得ステップにおいて取得した時系列データの単位時間後の前記説明変数の各項目の推定値を取得する第2ステップと、
前記第2ステップにおいて取得した推定値を再び前記予測器の入力とする前記第2ステップの処理を繰り返すことにより、N単位時間後までの前記水質データを予測する第3ステップと、
を含むことを特徴とする。
本発明はまた、上記方法をコンピュータに実行させるためのプログラムとして捉えることができる。本発明はまた、上記方法を行うための学習済モデルとして捉えることができる。本発明はまた、当該プログラムまたは学習済モデルを記憶したコンピュータ可読記憶媒体として捉えることもできる。
本発明によれば、赤潮・青潮・青粉や魚介の病害などの発生要因となる環境因子を長期的かつ高精度に予測できる。
(実施形態1)
以下では、図面を参照しながら、この発明を実施するための形態を説明するが、本発明はこれに限定されない。以下で説明する各実施形態の構成要素は、適宜組み合わせることができる。また、以下の実施形態では赤潮の発生を予測するため海水データを対象として扱う。青潮の発生を予測する場合も海水データを対象として扱う。青粉の発生を予測する場合には淡水データを対象として扱えばよい。
以下では、図面を参照しながら、この発明を実施するための形態を説明するが、本発明はこれに限定されない。以下で説明する各実施形態の構成要素は、適宜組み合わせることができる。また、以下の実施形態では赤潮の発生を予測するため海水データを対象として扱う。青潮の発生を予測する場合も海水データを対象として扱う。青粉の発生を予測する場合には淡水データを対象として扱えばよい。
赤潮形成種として、珪藻類、ラフィド藻類、渦鞭毛藻類、クリプト藻類、繊毛虫等に属するプランクトンが知られている。これらはいずれも、クロロフィルaとクロロフィルcを多く含んでいる。本実施形態において、説明変数として、クロロフィルの中でも、クロロフィルaおよび/またはクロロフィルcの濃度を選択し、赤潮の始期または終期の予報を行うことができる。
珪藻類では、スケレトネマ属、タラシオシラ属、ユーカンピア属、リゾソレニア属、キートケロス属などに属する種などが、ラフィド藻類では、ヘテロシグマ属、シャットネラ属に属する種などなどが、渦鞭毛藻類では、プロロセントラム属、ケラチウム属、ノクチルカ属(ヤコウチュウ)、カレニア属などに属する種などが、クリプト藻類では、クロオモナス属などに属する種などが、繊毛虫では、メソジニウム属(アカシオウズムシ)に属する種などなどが、しばしば赤潮の優占種となることが知られている。
本実施形態において、環境因子予測のための説明変数として、クロロフィルaおよび/またはクロロフィルcの濃度等に加えて微生物データとして、これらの珪藻類、ラフィド藻類、渦鞭毛藻類および/またはクリプト藻類などの真核生物に特異的な18SrRNA遺伝子配列の定性・定量(比率)データを追加の説明変数として用いて、発生が予測される赤潮における優占プランクトン種や優占バクテリア種の予報を行うことができる。
藍藻(藍色細菌、シアノバクテリア)や緑藻(クロレラ、クラミドモナスなど)が優占となると青粉が発生する。藍藻が優占となっている場合は、環境中にクロロフィルdやクロロフィルfが多く含まれるようになると考えられる。そこで、環境因子予測のための説明変数として、クロロフィルの中でもクロロフィルdおよび/またはクロロフィルfの濃度等を選択し、青粉の始期または終期の予報を行うことができる。
また、クロロフィルdの濃度、クロロフィルfの濃度に加えて、微生物データとして、シアノバクテリア(原核生物)に特異的な16SrRNA遺伝子配列の定性・定量(比率)データを説明変数に用いて、発生が予測される青粉の原因となるバクテリア種の予報を行うことができる。
なお、シアノバクテリアの中には、群体性ラン藻(アイアカシオ)として知られるトリコデスミウム属のように、赤潮を引き起こす種類もある。そこで、クロロフィルdおよび/またはクロロフィルfの濃度等を説明変数として選択して、赤潮の始期または終期の予報を行ってもよい。
また、クロロフィルdの濃度、クロロフィルfの濃度に加えて、微生物データとして、シアノバクテリアに特異的な16SrRNA遺伝子配列の定性・定量(比率)データを説明変数に用いることによって、発生が予測される赤潮の原因となるバクテリア種の予報を行ってもよい。
また、クロロフィルdの濃度、クロロフィルfの濃度に加えて、赤潮形成種に感染する終息現象に関与するウィルス(例えば、HaRNAV(ヘテロシグマアカシオウィルス)、HcRNAV、HcDNAVなど)の定量値等データを説明変数に用いて、赤潮の終期の予報を行うことができる。これらのウィルスの定量値は吸光度等の測定により得られ、したがって、生体色素量あるいは生体発光量に応じた値に該当する。
<全体概要>
以下、赤潮の発生の長期予測の場合を例として説明する。赤潮発生の長期予測を行う上で重要なのは、直接的に1週間後や1ヶ月後を予測することではなく、1日後や1時間後を予測することである。これは、直前で起きた現象が次に起きる現象に強く影響を与えるため、予測する時期が遠いほど予測精度が落ちてしまうためである。したがって、直後の現象を精度良く予測する手法の確立が肝要であり、それができていれば短期の予測値を再度予測モデルに当てはめ、次の予測値を算出する処理を繰り返すことで、精度の良い長期予測が可能となる。
以下、赤潮の発生の長期予測の場合を例として説明する。赤潮発生の長期予測を行う上で重要なのは、直接的に1週間後や1ヶ月後を予測することではなく、1日後や1時間後を予測することである。これは、直前で起きた現象が次に起きる現象に強く影響を与えるため、予測する時期が遠いほど予測精度が落ちてしまうためである。したがって、直後の現象を精度良く予測する手法の確立が肝要であり、それができていれば短期の予測値を再度予測モデルに当てはめ、次の予測値を算出する処理を繰り返すことで、精度の良い長期予測が可能となる。
本発明では、図1に示すように、クロロフィルa濃度を含む水質および気象の観測時系列データから、予測器を用いた回帰予測により、単位時間後の各項目の予測値を推定する。予測器は、例えば、1日単位で3日分のクロロフィルa濃度、水温、気温等を入力データとして、1日後の各項目の推定値を求める。この推定値を再帰的に予測器に入力することで、クロロフィルa濃度の長期的な予測が行える。そして、クロロフィルa濃度の長期予測から、赤潮発生の始期や終期の予測が可能である。
<予測器の学習>
図2は、予測器を学習するための学習装置10の構成を示す。学習装置10は、学習データ取得部11、前処理部12、学習部13をその機能部として含む。学習装置10は、演算プロセッサ、記憶装置、入力装置、出力装置、通信装置等を含むコンピュータ(情報処理装置)であり、演算プロセッサがプログラムを実行することによってこれらの機能が実現される。
図2は、予測器を学習するための学習装置10の構成を示す。学習装置10は、学習データ取得部11、前処理部12、学習部13をその機能部として含む。学習装置10は、演算プロセッサ、記憶装置、入力装置、出力装置、通信装置等を含むコンピュータ(情報処理装置)であり、演算プロセッサがプログラムを実行することによってこれらの機能が実現される。
学習データ取得部11は、予測器15の学習に用いる学習データを取得する。学習データとして用いる説明変数は、大略、海洋データ(水質データ)と気象データに大別される。
海洋データは、海洋中の上層・中層・下層についての、クロロフィルa濃度、水温、塩分濃度、溶存酸素量、濁度、流速を含む。海洋データは、さらに、pHを含んでもよい。なお、ここではクロロフィル濃度としてクロロフィルa濃度を採用しているが、これに替えてあるいはこれに加えて、クロロフィルb濃度、クロロフィルc濃度、クロロフィルd濃度、クロロフィルe濃度、クロロフィルf濃度などその他のクロロフィルの濃度を採用してもよい。また、バクテリオクロロフィルa,b,c,d,e,f,g等の濃度を採用してもよい。クロロフィルは生体色素の一例であり、その他の生体色素、例えば、カロテン類、キサントフィル類(ルティン、フコキサンチンなど)、フィコビリン類(フィコシアニン、フィコエリトリンなど)の濃度を採用してもよい。また、クロロフィル濃度ではなく吸光度または蛍光光度を説明変数としてもよい。他の生体色素についても同様である。また、クロロフィル濃度に替えてあるいはこれに加えて、生体発光量を説明変数としてもよい。例えば、ヤコウチュウなどのルシフェリン-ルシフェラーゼの化学反応による発光量がある。海洋データは、海水をサンプリングしたり海水中にセンサを投入したりして直接計測する以外に、人工衛星を用いたハイパースペクトルセンサを用いたリモート計測で取得してもよい。その場合は、水流の方向に対して上流か下流かの水平方向距離も、予測因子となり得る。
気象データは、気温、降水量、日照時間を含む。気象データは、さらに、気圧、風速、湿度、雲量を含んでもよい。
これらの海洋データおよび気象データの観測値は、気象庁や東京湾環境情報センターなどの公的機関などが定期的に観測して公開しているので、学習データ取得部11はこれらの観測値を取得すればよい。もっとも、民間企業などのその他の機関が公開しているデータや、独自に観測したデータを用いても構わない。
学習データには、上記以外に、海洋サンプリングした試料(海水)を使った実験による微生物データを追加してもよい。例えば、海水のPCRアンプリコンシークエンス技術による、プランクトン類(18S rRNA遺伝子領域、18S rRNA遺伝子配列)やバクテリア(16S rRNA遺伝子領域、16SrRNA遺伝子配列の定性・定量(比率)データを追加してもよい。また、海水のNMR分析やICP分析による海洋有機物・無機物の定性・定量データを追加してもよい。また、顕微鏡による視覚レベルでの藻類の定性・定量(個体数)データを追加してもよい。
また、海洋データや気象データに、気象・海洋のシミュレーションによる予報データを用いてもよい。例えば、全地球数値予報モデル(GSM)を用いて得られる、地球全体の大気を対象とした気圧、風速、風量、風向、気温、湿度、降水量、雲量、日射量(下向き短波放射量)、赤外放射量(下向き長波放射量)等を用いてもよい。全気球数値予報モデルではなく、メソ数値予報モデル(MSM)を用いて得られる、予報対象地域の大気を対象とした上記の各データを用いてもよい。また、海洋大循環モデル(例えば、Regional Ocean Modeling System(ROMS)など)を用いて得られる、地球全体の海水を対象とした海流、水温、塩分濃度等を用いてもよい。また、大気と海洋を結合したモデルによる予報データを用いてもよい。
また、河川流入モデルを用いて得られる、クロロフィル濃度、水温、塩分濃度、溶存酸素量、濁度、流速等を用いてもよい。
前処理部12は、外れ値処理、欠損値補間、データ統合、正規化の処理を行う。前処理部12は、外れ値や欠損値を、必要に応じて除外あるいは補間する。補間には、k近傍法、MissForest、中央値、平均値などを利用した値を採用すればよい。欠損値補間は、データが周期性を有する場合や変動が少ない場合に特に有効である。正規化は、最大値を1、最小値を0とするようにする処理である。前処理部12は、必要に応じて、連続データを離散データに変換する離散化処理、およびデータの圧縮処理(固有値分解)を行ってもよい。
学習部13は、所定日数分(例えば、3日分)の観測時系列データから、入力データに含まれる各説明変数の1日後の推定値を求める予測器(予測モデル)15の学習を行う。時系列データに基づく予測を行うことから、予測器15には、再帰型ニューラルネットワーク(RNN)、具体的には、Simple RNN, Long Short-Term Memory (LSTM), Gated Recurrent Unit (GRU)などを利用可能である。機械学習のアルゴリズムは、説明変数の時系列データから各項目の単位時間後の推定値を出力して、本実施形態の効果として意図する環境因子の予測が可能なものである限り、種類は一切問わない。再帰型ニューラルネットワーク以外では強化学習などが挙げられるが、これに限られない。また、学習済モデルは転移学習によって再構築してもよい。また、予測器は機械学習によって学習されたものでなくても良く、例えば、通常のシミュレーターであってもよい。
<赤潮発生予測>
図3は、赤潮の発生を予測するための赤潮予測装置20の一実施形態に係る構成を示す。赤潮予測装置20は、入力データ取得部21、長期予測部22、予測器23、予報部24をその機能部として含む。赤潮予測装置20は、演算プロセッサ、記憶装置、入力装置、出力装置、通信装置等を含むコンピュータ(情報処理装置)であり、演算プロセッサがプログラムを実行することによってこれらの機能が実現される。
図3は、赤潮の発生を予測するための赤潮予測装置20の一実施形態に係る構成を示す。赤潮予測装置20は、入力データ取得部21、長期予測部22、予測器23、予報部24をその機能部として含む。赤潮予測装置20は、演算プロセッサ、記憶装置、入力装置、出力装置、通信装置等を含むコンピュータ(情報処理装置)であり、演算プロセッサがプログラムを実行することによってこれらの機能が実現される。
図4は、赤潮予測装置20が行う赤潮予測処理の流れを示すフローチャートである。以下、図3および図4を参照して、赤潮予測装置20について説明する。なお、本構成例において、予測器23は、海洋観測データおよび気象観測データに基づいて学習されていることを想定する。
まず、ステップS101において、入力データ取得部21は、赤潮発生予測を行う地点における直近のA日(所定日数)分の観測データを取得する。ここでは、3日分(A=3)の海洋観測データ25および気象観測データ26を取得する。
ループL1において、長期予測部22は、直近のA日間のデータを予測器23に入力して次の日のデータを予測し、それをさらに予測器23に再帰させることを繰り返してN日目までのデータを予測する。具体的には、A=3として、まずT-1日目からT-3日目の観測データからT日目のデータを予測し、T日目の予測データとT-1,T-2日目の観測データからT+1日目のデータを予測し、T+1,T日目の予測データとT-1日目の観測データからT+2日目のデータを予測する。これを繰り返すことで、N日目までのデータの予測が行える。ここで、例えばNは2以上の整数であれば任意の値であってよいが、例えば、N=30とすることができる。
N日目までの予測が完了したら、ステップS103において、予報部24はN日後までのクロロフィルa濃度に基づいて赤潮の発生始期および終期を予測する。赤潮の発生および終息の判定には、例えば、東京都環境局のような公共機関が公表しているクロロフィルa濃度による判定基準値を用いればよい。
図5は、他の実施形態にかかる赤潮予測装置30の構成を示す。図6は、本構成例における赤潮予測装置30が行う赤潮予測処理の流れを示すフローチャートである。上記と同じ構成・処理については同じ符号を付している。
上述した構成(図3)との違いは、微生物サンプリングデータ27および気象予報データ28も用いて赤潮発生予測を行う点である。本構成例では、予測器23は、海洋観測データ、気象観測データ、微生物サンプリングデータ、気象予報データに基づいて学習されていることを想定する。
入力データ取得部21は、ステップS101においてA日分の海洋観測データ25、気象観測データ26、および微生物サンプリングデータ27を取得する。また、入力データ取得部21は、ステップS201において、N日後までの気象予報データを取得する。気象予報データは、例えば、全球数値予報モデル(GSM)により地球全体の大気を対象とした気圧、風速、風量、風向、気温、湿度、降水量、雲量日射量等のシミュレーションデータである。
ループL1の処理では、長期予測部22が、海洋観測データ、気象観測データ、およびサンプリングデータを予測器23に入力して1日後のデータを予測し、それをさらに予測器23に再帰させることは同様である。ただし、ステップS202において、長期予測部22は、予測器23によって予測された気象データを、取得した気象予報データに基づいて補正した上で、予測器23に再帰入力する。具体的な補正の方法は任意であり、例えば、単純平均を取ったり、重み付け平均を取ったりすることが想定される。このようにして、気象データの予測値を補正した上で、予測器23に再帰させることでより精度の良い予測が可能となる。なお、海洋観測データ(水質データ)25についても、同様にシミュレーションに基づく予測データによって、予測器23によって予測された海洋データ(水質データ)を補正した上で、予測器23に再帰入力してもよい。
N日後までのステップS103において、予報部24はN日後までのクロロフィルa濃度に基づいて赤潮の発生始期および終期を予測する。さらに、予報部24は、発生が予測される時期の微生物サンプリングデータの予測値に基づいて、発生する赤潮における優占プランクトン種や優占バクテリア種も予測する。なお、予報部24は、優占プランクトン種や優占バクテリア種に応じた判定基準(例えばカレニア種が優占種である場合には500細胞/ml以上など)を用いて赤潮の発生始期および終期を予測してもよい。本構成例では、微生物サンプリングデータも利用しているため、このように優占プランクトン種や優占バクテリア種の予測および優占プランクトン種や優占バクテリア種に応じた判定基準を用いた赤潮発生の予測が可能である。
<解析例1>
赤潮予測の実施例として、東京湾奥(浦安沖)を対象に、赤潮発生の指標としてのクロロフィルa濃度の予測を試みた。リアルタイムの気象観測データは、気象庁のウェブサイトから、江戸川臨界の1時間おきの日照時間と降水量を取得し、1日ごとの平均および総量を算出した。リアルタイムの海洋観測データは、東京湾環境情報センターのウェブサイトから、浦安沖の1時間おきのクロロフィルa濃度、水温、塩分濃度、溶存酸素量、濁度、流量(流速)についての海洋上層・中層・下層のデータ、および風量(風速)のデータを取得し、1日ごとの平均および総量を算出した。
赤潮予測の実施例として、東京湾奥(浦安沖)を対象に、赤潮発生の指標としてのクロロフィルa濃度の予測を試みた。リアルタイムの気象観測データは、気象庁のウェブサイトから、江戸川臨界の1時間おきの日照時間と降水量を取得し、1日ごとの平均および総量を算出した。リアルタイムの海洋観測データは、東京湾環境情報センターのウェブサイトから、浦安沖の1時間おきのクロロフィルa濃度、水温、塩分濃度、溶存酸素量、濁度、流量(流速)についての海洋上層・中層・下層のデータ、および風量(風速)のデータを取得し、1日ごとの平均および総量を算出した。
本実施例において使用する説明変数は具体的には以下の通り52項目である。
[海洋データ]
・クロロフィルa濃度(上層・中層・下層:1日平均値)
・水温(上層・中層・下層:1日平均値)
・塩分濃度(上層・中層・下層:1日平均値)
・溶存酸素量(上層・中層・下層:1日平均値)
・濁度(上層・中層・下層:1日平均値)
・流速(上層・中層・下層:東西南北の各成分につき1日平均値および1日合計値)
[気象データ]
・気温(1日平均値)
・降水量(1日平均値、1日合計値)
・日照時間(1日平均値、1日合計値)
・風速(東西南北の各成分につき1日平均値および1日合計値)
[海洋データ]
・クロロフィルa濃度(上層・中層・下層:1日平均値)
・水温(上層・中層・下層:1日平均値)
・塩分濃度(上層・中層・下層:1日平均値)
・溶存酸素量(上層・中層・下層:1日平均値)
・濁度(上層・中層・下層:1日平均値)
・流速(上層・中層・下層:東西南北の各成分につき1日平均値および1日合計値)
[気象データ]
・気温(1日平均値)
・降水量(1日平均値、1日合計値)
・日照時間(1日平均値、1日合計値)
・風速(東西南北の各成分につき1日平均値および1日合計値)
予測器は、1~3日前の上記52項目を説明変数として、0日目の52項目を目的変数とした。つまり、入力層と出力層のノード数は同じ数とし、全ての変数の予測モデルを作成する。隠れ層は100ノードとした。
予測器の学習には、リカレントニューラルネットワークの3つのアルゴリズム(Simple RNN, LSTM, GRU)を用いて行ったところ、GRUが一番良好な予測を示した。その結果を図7に示す。図7Aは、観測データのうちのクロロフィルa濃度の変動を示す。このうち7年分のデータを学習データ(訓練データ)として用い、1年分をテストデータ(検証データ)として用いた。図7Bは、GRUを用いて学習した予測器による1日後の予測結果を観測データと重畳させて示した図である。学習データを用いた予測と観測値を比較したところほぼ一致したことから、学習に関しては十分に行われたことが分かる。また、平均学習誤差(RMSE)は11.97μg/Lとなった。過学習の確認および汎用性の評価を行うため、学習に使用していない約1年分のテストデータを予測モデルに当てはめ、1日後の予測を行った。予測誤差は15.29μg/Lとなり、予測の汎用性が高いことが分かる。
さらに、このようにして作成した1日後の予測モデルに予測値を再帰的に入力して30日後までの長期予測を行った。その結果を図8に示す。図8Aは、図7Aと同様にクロロフィルa濃度の観測データの変動であるが、2017年後半から2018年1月中旬までの期間を拡大して表示している。図8Bは、2017年12月末の3日分の観測データを入力とて1日後の予測を行い、1日後予測値を予測モデルに再帰させることにより2017年1月末までの30日間について予測した値である。図に示すように、2018年1月中旬までの約15日間については、予測値と観測値とが良い一致を示した。このように、本手法が長期予測に有用であることが分かる。
<解析例2>
次に、解析例1の手法と同様の手法で、風速データを用いずに学習および予測を試みた。解析に用いたデータは上記解析例1と基本的に同様であるが、説明変数の数は上記52項目から風速に関する8項目を除外した44項目である。
次に、解析例1の手法と同様の手法で、風速データを用いずに学習および予測を試みた。解析に用いたデータは上記解析例1と基本的に同様であるが、説明変数の数は上記52項目から風速に関する8項目を除外した44項目である。
図9Aは、解析例1と同様に7年分の観測データを学習データとして用い、残りの1年分をテストデータとして、GRUアルゴリズムにより学習した予測器による予測結果を観測データと重畳させて示した図である。予測誤差は18.11μg/Lとなり、解析例1よりは低いものの十分な精度が得られていることが分かる。
図9Bは、作成した1日後の予測モデルに予測値を再帰的に入力して30日後までの長期予測を行った結果である。解析例1(図8B)と同様に、2017年12月末の3日分の観測データを入力とて1日後の予測を行い、1日後予測値を予測モデルに再帰させることにより2017年1月末までの30日間について予測した値である。このように風速データを用いなくても、2018年1月中旬に生じているクロロフィルa濃度の上昇を予測できている。
<解析例3>
次に、解析例1に手法において、さらに海水のサンプリングデータを加えて学習および予測を行った。ここでは、サンプリングデータとして、試料水に含まれる微生物データとしてKarenia brevisなどの7項目、有機物データとしてアミノ酸、糖類などの214項目、無機物データとして窒素、リン、ケイ素などの20項目を利用している。なお、海洋データおよび気象データの52項目のうち1日合計値19項目は利用しておらず33項目を利用している。
次に、解析例1に手法において、さらに海水のサンプリングデータを加えて学習および予測を行った。ここでは、サンプリングデータとして、試料水に含まれる微生物データとしてKarenia brevisなどの7項目、有機物データとしてアミノ酸、糖類などの214項目、無機物データとして窒素、リン、ケイ素などの20項目を利用している。なお、海洋データおよび気象データの52項目のうち1日合計値19項目は利用しておらず33項目を利用している。
本解析では、川崎人工島のデータ3年分を利用して学習している。それぞれのデータにおいて欠損値が多く存在しており、KNN(k近傍法)による補間を行っている。図10A~10Cは、例として、渦鞭毛藻(海洋微生物)、グリシン(有機物)、ケイ素(無機物)の観測データおよび補間データを示す。図中において、丸印を付したものが観測データであり、その他が補間により得られたデータである。このように、欠損値補間作業を行うことで、離散データを連続データ(1日単位のデータ)に変換して、海洋データおよび気象データとサンプリングデータとを統合している。
図11Aは、2015年4月から2018年11月までの約3年半の観測データのうちのクロロフィルa濃度の変動を示す。この観測データのうち、先の3年分を学習データ(訓練データ)として用い、残りをテストデータ(検証データ)として用いた。図11BはGRUを用いて学習した予測器による1日後の予測結果を観測データと重畳させて示した図である。学習誤差は5.93μg/L、予測誤差は8.21μg/Lであり、サンプリングデータを加えることでより精度の良い予測が実現できることが分かる。
<欠損値補間方法の検討>
観測データ特にサンプリングデータには欠損値が含まれることが多いので、欠損値補間方法の比較評価を行った。ここでは、上述した72日分の1日ごとのサンプリングデータ(微生物7項目、代謝物214項目、元素20項目)に対してLOOCV(一個抜き交差検証)を行った。
観測データ特にサンプリングデータには欠損値が含まれることが多いので、欠損値補間方法の比較評価を行った。ここでは、上述した72日分の1日ごとのサンプリングデータ(微生物7項目、代謝物214項目、元素20項目)に対してLOOCV(一個抜き交差検証)を行った。
図12は、各補間手法で得られた補間値と観測値の間の誤差を示すボックスプロットである。補間手法に示すアンダーバーの後の数値は、KNNでは何個のデータから最近傍距離を取るか、MatFac (Matrix Factorization), SVD, SoftImputeについてはいくつの成分に固有値分解して補間モデルを生成するか、を示す。
図12には、平均誤差(RMSD)が小さい手法から順番に並べて示している。行列補間系の手法であるSVDやSoftImputeでは誤差が大きくなる項目が多く見受けられたのに対し、KNNやMissForestなどの機械学習的補間方法は全項目で誤差が小さくなる傾向である。したがって、機械学習的補間方法を採用することが好適であり、K=15または30としたKNNを採用することが更に好適であるといえる。なお、機械学習的補間方法以外であっても、図12に示すKNN#30からrandomまでの間の手法であれば誤差の少ない補間が可能である。
<変形例>
上記の説明では、1日間隔のデータを用いて予測を行っているが、データの時間間隔はより長くても短くても良い。例えば、1時間おきのデータを利用して学習および予測を行ってもよい。
上記の説明では、1日間隔のデータを用いて予測を行っているが、データの時間間隔はより長くても短くても良い。例えば、1時間おきのデータを利用して学習および予測を行ってもよい。
また、上記の説明では、予測器は、3日分(3単位時間分)のデータを用いて1日後のデータを予測するものとしたがより長い期間のデータを使用して1日後のデータを予測してもよい。日数を長くすることで、予測精度の向上が期待でき、特にデータの周期性が学習に反映されれば予測精度の向上に大きく寄与する。一方、日数を長くすることで欠損値データに遭遇する可能性も高まるので、この点も考慮して日数を決定するとよい。
上記の実施例では、入力データとして、海洋観測データ25と気象観測データ26との2種類を用いる例(図3)と、海洋観測データ25と気象観測データ26とサンプリングデータ27と気象予報データ28の4種類を用いる例(図5)を説明した。しかしながら、入力データとして、海洋観測データ25と気象観測データ26とサンプリングデータ27の3種類を用いてもよいし、海洋観測データ25と気象観測データ26と気象予報データ28の3種類を用いてもよい。また、サンプリングデータ27は、微生物、有機物、および無機物のうちの1つまたは2つのみのデータを含んでいてもよい。
上記の構成では、アルゴリズム的に地域的特徴を用いていないので、ある地域の学習データ(訓練モデル)を使った学習済モデルで、別の地域の環境因子の予測が可能である。このように、地域的特徴を用いない学習済モデルを得ることで、任意の地域での予測が可能である。なお、地形要素や地域の特徴的気候等を説明変数に加えてもよく、この場合は、対象地域での予測精度の向上が期待できる。
上記の説明では、赤潮の発生を予測しているが、同じ構成により青潮の発生も可能である。また、赤潮や青潮の発生予測まで行わずに、クロロフィルa濃度の予測までの処理を行う環境因子予測方法および装置としてもよい。また、上記と同様の構成により青粉の発生を予測してもよく、この場合、試料水は海水ではなく淡水となる。
(実施形態2)
本実施形態は、実施形態1と基本的に同様であるが、ある地域の学習データを用いて学習した予測器をもとに転移学習を行って他の地域に適用する点が異なる。
本実施形態は、実施形態1と基本的に同様であるが、ある地域の学習データを用いて学習した予測器をもとに転移学習を行って他の地域に適用する点が異なる。
実施形態1は地理的特徴を説明変数として用いていないので、ある地域の学習データを用いて学習した予測器は別の地域にも適用できる。これは、それぞれの実装現場での学習データ取得が不要であるという点で有効であるが、予測器をそのまま適用すると予測精度が低下することも生じうる。そこで、本実施形態では、転移学習を用いて実装現場に適した予測器を生成する。
本実施形態では、まず実施形態1の手法により、十分な量の学習データが取得できる地域(例えば、東京湾)での予測器(学習モデル)を生成する。この予測器(学習モデル)は事前学習済みの予測器(学習モデル)と称することもできる。次に、予測器を適用する実装現場における学習データを用意する。学習データの内容自体は実施形態1と同様である。実装現場での学習データを用いて、予測器の学習を更に行う。この際、予測器のネットワークのうち入力に近い層の重みは固定し出力に近い層の重みだけを調整するようにしてもよい。あるいは、地理的パラメータに関連するノードの重み、具体的には、地理的特異性による影響が大きい(と推定される)ノードの重みだけを調整するようにしてもよい。例えば、あらかじめ複数の場所の学習データを用いて学習を行い、場所によって重要度が変わるノードのみを調整してもよい。重みの情報は、本実施形態では、ランダムフォレストによる重要度の計算によって得ているが、その他の機械学習アルゴリズムを用いて得てもよい。本実施形態では、このような転移学習によって得られた予測器を用いて現場での予測を行う。
図13は、転移学習を用いずに東京湾の学習データを用いて学習した予測器Aをそのまま実装現場(伊万里湾のマグロ養殖場)に適用した場合の予測と、実装現場の学習データを用いて転移学習した予測器Bを適用した場合の予測を比較する図である。
グラフ1300は、実装現場でのクロロフィルa濃度の実測値を示す。グラフ1301は予測器Aを用いた1日後の予測値、グラフ1302は予測器Aを用いた3日後の予測値を示す。比較のために実測値も細線で示している。図から分かるように、この例では予測値と実測値の誤差が大きい。なお、3日後の予測で誤差が大きいため、予測器Aを用いた7日後の予測は行っていない。
グラフ1311~1313は、それぞれ、転移学習によって学習した予測器Bを用いた1日後、3日後、7日後の予測値をプロットしたグラフである。転移学習を行うことにより、予測精度が向上することが分かる。7日後予測であっても、クロロフィルa濃度、すなわち赤潮の発生および終息を予測できる。
このように本実施形態によれば、学習データの多い地域についてあらかじめ学習した予測器に基づいて転移学習をするため、実装現場での学習データが少なくても精度の高い予測器を容易に生成できる。実施形態1では、地理的要因に直接関連するパラメータを説明変数として用いていないが、各パラメータが赤潮発生にどのように影響するかは、地理的な影響によって変化しうる。転移学習によって各パラメータ間の重みが実装現場での特異性を反映するように調整されて、予測精度が向上する。
また、本実施形態によれば、実装現場ごとの重要因子を抽出することができる。転移学習済みの学習モデルおよび事前学習済みの学習モデルにおける、パラメータごとの寄与率を求めて、寄与率上位のパラメータを出力するようにしてもよい。例えば、東京湾において寄与率が高いパラメータは、有機物/無機物では、K,S,Ca,Tp,Sr,B,NH3-N,Naの順であり、環境物理パラメータでは、クロロフィルa濃度、日照時間、pH、水温、西風、東風、溶存酸素量、南風の順である。一方、伊万里湾において寄与率が高いパラメータは、有機物/無機物では、Sr,Mg、K,B,Na,S,Ca,Liであり、環境物理パラメータでは、北風、南風、日照時間、西風、クロロフィルa濃度、東風、降水量、水温である。このように、本実施形態によれば、実装現場において重要な因子を求めることができる。
(実施形態3)
本実施形態は、赤潮発生予測に、気象シミュレーションデータ、海洋シミュレーションデータ、河川流入シミュレーションデータを用いる点である。赤潮発生装置の構成は図5と同様である。
本実施形態は、赤潮発生予測に、気象シミュレーションデータ、海洋シミュレーションデータ、河川流入シミュレーションデータを用いる点である。赤潮発生装置の構成は図5と同様である。
本実施形態で用いる、観測によって得られる海洋データおよび気象データと、シミュレーションによって得られるデータを説明変数として、1タイムステップ後の海洋データおよび気象データを目的変数として予測する。
以下では、海洋データあるいは気象データという用語は、観測によって得られるかまたは予測器23によって予測されるデータを指すこととし、予測器23とは異なるシミュレーションによって得られるデータをシミュレーションデータと呼ぶ。
まず、入力データ取得部21は、直近の所定タイムステップ分の海洋観測データ25および気象観測データ26を取得する。また、入力データ取得部21は、直近の所定タイムステップ分および長期予報の対象とするタイムステップ分のシミュレーションデータを取得する。
予測器23は、直近の所定タイムステップ分の海洋データ、気象データ、および直近の所定タイムステップおよび長期予報の対象とするタイムステップ分のシミュレーションデータを入力として、1タイムステップ後の海洋データおよび気象データを予測する。長期予測部22は、予測された海洋データおよび気象データを利用して1タイムステップずつ所定タイムステップ先までの海洋データおよび気象データを予測する。なお、なお、予測器23に対する入力を、直近の所定タイムステップ分の、海洋データ、気象データ、およびシミュレーションデータとしてもよい。
なお、予測器23の学習は、実施形態1と同様の手法によって行えばよい。ただし、学習データに、観測データ以外にシミュレーションデータも用いられる点が異なる。
以下、東京湾を対象として行った予測の具体例に則して説明する。
本例では、海洋データとして、上層・中層・下層それぞれの、クロロフィルa濃度、水温、塩分濃度、溶存酸素量(DO)、濁度、流速(東西成分、南北成分)を採用する(21項目)。気象データとして、気温、風速(東西成分、南北成分)、降水量、日照時間を採用する(5項目)。
海洋シミュレーションデータとして、植物プランクトン量、水温、塩分濃度、東西流速、南北流速、動物プランクトン量、アンモニア態窒素、硝酸態窒素を採用する(8項目)。気象シミュレーションデータとして、気温(海上2m)、降水量(その時刻から1時間の積算降水量)、下向き短波放射、下向き長波放射を採用する(4項目)。河川流入シミュレーションのデータとして、小糸川、小櫃川、多摩川、鶴見川、荒川、隅田川、江戸川、花見川からの流入量(8項目)を採用する。なお、海洋シミュレーションにはROMSを採用し、気象シミュレーションにはMSMを採用した。
本例では、6時間を1タイムステップとして、6時間ごとの観測データおよびシミュレーションデータを取得し、予測器23は直近6タイムステップ(36時間)から次のタイムステップの海洋データおよび気象データを予測する。予測器23の学習には、CNN-QRNNアルゴリズムを用いている。また、長期予測部22は、予測器23による予測を6回繰り返して6タイムステップ後(36時間後)までの海洋データおよび気象データを予測する。
図14は、東京湾におけるクロロフィルa濃度の実測値と、本例において学習した予測器を用いた予測値を示す。グラフ1400は、クロロフィルa濃度の実測値を示す。グラフ1401~1406は、それぞれ6,12,18,24,30,36時間後の予測値を示す。比較のために実測値も細線で示している。
(実施形態4)
実施形態1~3では、赤潮、青潮、青粉の発生を予測するために、プランクトンやバクテリアなどの光合成微生物や化学合成微生物の量を予測している。上記の技術は、赤潮、青潮、青粉以外にも、魚介の病害発生予測にも利用できる。その場合は、海洋データ(水質データ)に、病害の原因となる病原体(原因物質)の量を表すパラメータを含ませることが必要となる。
実施形態1~3では、赤潮、青潮、青粉の発生を予測するために、プランクトンやバクテリアなどの光合成微生物や化学合成微生物の量を予測している。上記の技術は、赤潮、青潮、青粉以外にも、魚介の病害発生予測にも利用できる。その場合は、海洋データ(水質データ)に、病害の原因となる病原体(原因物質)の量を表すパラメータを含ませることが必要となる。
病害の例として、ビブリオ病が挙げられる。ビブリオ病はビブリオ属細菌を病原体とする感染症の総称である。ビブリオ属細菌の量は、宿主特異的なDNA配列によって計測できる。病原体が原生生物である場合は、病原体の量は、特異的なDNA配列によって計測できる。病原体がウィルスである場合は、病原体の量は、特異的なRNAまたはDNA配列によって計測できる。
また、吸光度の測定により、DNAやRNAから構成される核酸、タンパク質などの生体試料の定性や定量ができる。これにより水中のバクテリア、ウィルス、原生生物などの総量の定性、定量の判断が可能である。具体的には、海水や湖水などの環境水を回収し、フィルターなどで生成した後に、吸光度を測定すればよい。吸光度測定により得られるウィルスの定性、定量値は、本発明における生体色素量または生体発光量に応じた値に相当する。
本実施形態は、実施形態1~3のいずれと組み合わせて実施してもよい。
10:学習装置 11:学習データ取得部 12:前処理部 13:学習部
20:赤潮予測装置 21:入力データ取得部 22:長期予測部 23:予測器 24:予報部
20:赤潮予測装置 21:入力データ取得部 22:長期予測部 23:予測器 24:予報部
Claims (21)
- 水中の複数の層における、生体色素量または生体発光量に応じた値、水温、塩分濃度、溶存酸素、濁度、および流速を含む水質データと、
気温、降水量、および日照時間を含む気象データと、
を説明変数とし、当該説明変数の時系列データから、単位時間後の当該説明変数の各項目の推定値を出力する予測器と、
前記予測器による推定値を再び前記予測器の入力とする予測を繰り返すことにより、N単位時間後(Nは2以上の整数)までの前記水質データを予測する予測手段と、
を備える、環境因子予測装置。 - 前記水質データは、前記生体色素量に応じた値として、クロロフィル濃度を含む、
請求項1に記載の環境因子予測装置。 - 前記気象データは、風速をさらに含む、
請求項1または2に記載の環境因子予測装置。 - 前記説明変数は、試料水からサンプリングされた微生物、有機物、および無機物の少なくとも何れかのデータを含む、
請求項1から3の何れか1項に記載の環境因子予測装置。 - 前記予測手段によって予測された生体色素量または生体発光量に応じた値に基づいて、赤潮、青潮、または青粉の発生を予報する予報手段、をさらに備える、
請求項1から4の何れか1項に記載の環境因子予測装置。 - 前記予報手段は、赤潮の始期または終期を予報する、
請求項5に記載の環境因子予測装置。 - 前記予報手段は、青潮の始期または終期を予報する、
請求項5または6に記載の環境因子予測装置。 - 前記予報手段は、青粉の始期または終期を予報する、
請求項5から7のいずれか1項に記載の環境因子予測装置。 - 前記予測器の説明変数は、水中に含まれる微生物に関する微生物データをさらに含み、
前記予報手段は、前記予測手段によって予測された微生物データに基づいて、発生が予測される赤潮、青潮、または青粉における優占プランクトン種または優占バクテリア種も予報する、
請求項5から8のいずれか1項に記載の環境因子予測装置。 - 前記予報手段は、前記優占プランクトン種または優占バクテリア種に応じた判定基準値を用いて、赤潮、青潮、または青粉の発生の始期または終期を予報する、
請求項9に記載の環境因子予測装置。 - 前記予測手段は、前記予測器とは異なるシミュレーションから得られる気象予報データまたは水質予報データに基づいて、前記予測器から得られる気象データまたは水質データの推定値を補正した上で、前記予測器の入力とする、
請求項1から10のいずれか1項に記載の環境因子予測装置。 - 前記予測器は、機械学習によって学習される、
請求項1から11のいずれか1項に記載の環境因子予測装置。 - 前記予測器は、第1の地域における水質データおよび気象データの観測値に基づく第1の学習データを用いて学習された学習モデルを、第2の地域における水質データおよび気象データの観測値に基づく第2の学習データを用いた転移学習によって学習することにより得られる、
請求項1から12のいずれか1項に記載の環境因子予測装置。 - 水中の複数の層における、生体色素量または生体発光量に応じた値、水温、塩分濃度、溶存酸素、濁度、および流速を含む水質データと、
気温、降水量、および日照時間を含む気象データと、
を説明変数とし、当該説明変数の時系列データを取得する第1ステップと、
前記説明変数の時系列データから単位時間後の当該説明変数の各項目の推定値を出力する予測器を用いて、前記第1ステップにおいて取得した時系列データの単位時間後の前記説明変数の各項目の推定値を取得する第2ステップと、
前記第2ステップにおいて取得した推定値を再び前記予測器の入力とする前記第2ステップの処理を繰り返すことにより、N単位時間後(Nは2以上の整数)までの前記水質データを予測する第3ステップと、
を含む、環境因子予測方法。 - 請求項14に記載の方法の各ステップをコンピュータに実行させるプログラム。
- 水中の複数の層における、生体色素量または生体発光量に応じた値、水温、塩分濃度、溶存酸素、濁度、および流速を含む水質データと、
気温、降水量、および日照時間を含む気象データと、
を説明変数とし、当該説明変数の時系列データから、単位時間後の当該説明変数の各項目の推定値を出力する予測モデルを含み、
前記予測モデルによる推定値を再び前記予測モデルの入力とする予測を繰り返すことにより、N単位時間後(Nは2以上の整数)までの前記水質データを予測するよう、コンピュータを機能させるための学習済モデル。 - 請求項15に記載のプログラムまたは請求項16に記載の学習済モデルを記憶した記憶媒体。
- 魚介の病害の原因となる病原体の量に応じた値を含む水質データと、気象データと、を説明変数とし、当該説明変数の時系列データから、単位時間後の当該説明変数の各項目の推定値を出力する予測器と、
前記予測器による推定値を再び前記予測器の入力とする予測を繰り返すことにより、N単位時間後(Nは2以上の整数)までの前記水質データを予測する予測手段と、
を備える、環境因子予測装置。 - 前記予測器は、第1の地域における水質データおよび気象データの観測値に基づく第1の学習データを用いて学習された学習モデルを、第2の地域における水質データおよび気象データの観測値に基づく第2の学習データを用いた転移学習によって学習することにより得られ、
前記転移学習では、地理的パラメータに関するノードの重みを調整する、
請求項18に記載の環境因子予測装置。 - 前記予測器は、前記水質データと、前記気象データと、水質と気象の少なくとも一方のシミュレーションデータの時系列データから、単位時間後の前記水質データと前記気象データの各項目の推定値を出力し、
前記予測手段は、
N単位時間後までの前記シミュレーションデータを取得し、
前記予測器による前記水質データおよび前記気象データの予測値と、取得されたシミュレーションデータの少なくとも一部とを入力とする予測を繰り返すことにより、N単位時間後までの前記水質データを予測する、
請求項18または19に記載の環境因子予測装置。 - 前記魚介の病害は、赤潮、青潮、青粉のいずれかであり、
前記病原体の量に応じた値は、生体色素量または生体発光量に応じた値である、
請求項18から20のいずれか1項に記載の環境因子予測装置。
Priority Applications (4)
| Application Number | Priority Date | Filing Date | Title |
|---|---|---|---|
| US17/603,894 US20220198303A1 (en) | 2019-04-15 | 2020-04-14 | Device, method and program for environmental factor estimation, learned model and recording medium |
| JP2021514178A JP7109123B2 (ja) | 2019-04-15 | 2020-04-14 | 環境因子予測装置、方法、プログラム、学習済モデルおよび記憶媒体 |
| CN202080029086.4A CN113711087B (zh) | 2019-04-15 | 2020-04-14 | 环境因子预测装置、方法、程序、学习模型及存储介质 |
| JP2022062945A JP7624732B2 (ja) | 2019-04-15 | 2022-04-05 | 水質データ予測装置、方法、およびプログラム |
Applications Claiming Priority (2)
| Application Number | Priority Date | Filing Date | Title |
|---|---|---|---|
| JP2019077300 | 2019-04-15 | ||
| JP2019-077300 | 2019-04-15 |
Publications (1)
| Publication Number | Publication Date |
|---|---|
| WO2020213614A1 true WO2020213614A1 (ja) | 2020-10-22 |
Family
ID=72837894
Family Applications (1)
| Application Number | Title | Priority Date | Filing Date |
|---|---|---|---|
| PCT/JP2020/016472 Ceased WO2020213614A1 (ja) | 2019-04-15 | 2020-04-14 | 環境因子予測装置、方法、プログラム、学習済モデルおよび記憶媒体 |
Country Status (4)
| Country | Link |
|---|---|
| US (1) | US20220198303A1 (ja) |
| JP (2) | JP7109123B2 (ja) |
| CN (1) | CN113711087B (ja) |
| WO (1) | WO2020213614A1 (ja) |
Cited By (11)
| Publication number | Priority date | Publication date | Assignee | Title |
|---|---|---|---|---|
| CN113158762A (zh) * | 2021-02-23 | 2021-07-23 | 中国科学院南京地理与湖泊研究所 | 大型湖库滨岸带蓝藻水华堆积风险评估方法 |
| CN114239422A (zh) * | 2022-02-23 | 2022-03-25 | 中国海洋大学 | 基于机器学习提高海洋叶绿素a浓度预报准确度的方法 |
| JPWO2022085802A1 (ja) * | 2020-10-23 | 2022-04-28 | ||
| CN114723188A (zh) * | 2022-06-09 | 2022-07-08 | 广东盈峰科技有限公司 | 水质预测方法、装置、计算机设备和存储介质 |
| JP7175415B1 (ja) | 2021-06-15 | 2022-11-18 | 哈爾濱工程大学 | Steof-lstmに基づく海洋環境要素予測方法 |
| CN115472230A (zh) * | 2022-09-13 | 2022-12-13 | 中国科学院生态环境研究中心 | 一种基于常规水质理化指标预测微囊藻生长状况的方法 |
| CN116310543A (zh) * | 2023-03-14 | 2023-06-23 | 自然资源部第一海洋研究所 | Gf-1 wfv卫星赤潮深度学习探测模型、构建方法及设备 |
| WO2023234079A1 (ja) * | 2022-06-01 | 2023-12-07 | コニカミノルタ株式会社 | データ処理装置、データ処理システム、データ処理方法及びプログラム |
| CN117350601A (zh) * | 2023-12-06 | 2024-01-05 | 北京英视睿达科技股份有限公司 | 水质预测方法、装置、电子设备及存储介质 |
| CN118577020A (zh) * | 2024-08-06 | 2024-09-03 | 深圳市宏源建设科技有限公司 | 基于物联网的泥水沉淀池监控管理系统 |
| CN119005539A (zh) * | 2024-10-24 | 2024-11-22 | 山东省水利科学研究院 | 一种水质监测预警方法及系统 |
Families Citing this family (21)
| Publication number | Priority date | Publication date | Assignee | Title |
|---|---|---|---|---|
| CN111411608A (zh) * | 2020-04-01 | 2020-07-14 | 中国科学院南京地理与湖泊研究所 | 湖底表层污染物和藻种扫除收集与捕获内源一体化方法 |
| CN114169250B (zh) * | 2021-12-24 | 2024-04-30 | 中国农业大学 | 一种基于时空序列的溶解氧预测方法及系统 |
| CN114527716B (zh) * | 2022-02-08 | 2023-12-15 | 海斯特(青岛)泵业有限公司 | 一种基于注意力机制和行为克隆模型的污水处理预测控制方法 |
| US20230259755A1 (en) * | 2022-02-11 | 2023-08-17 | International Business Machines Corporation | Edge-based forecasting of environmental conditions |
| US20230279462A1 (en) * | 2022-03-01 | 2023-09-07 | Spectacular Labs, Inc. | Methods for detecting microorganisms |
| CN114881540B (zh) * | 2022-07-04 | 2022-09-27 | 广东盈峰科技有限公司 | 确定水源治理方案的方法和装置、电子设备和存储介质 |
| CN114965348B (zh) * | 2022-07-27 | 2022-11-15 | 浙江数翰科技有限公司 | 基于污水检测的光谱解析方法和系统 |
| CN115983131B (zh) * | 2023-01-09 | 2023-07-04 | 淮阴工学院 | 一种水产品生长含氧量调控方法及装置 |
| WO2024262018A1 (ja) * | 2023-06-23 | 2024-12-26 | 日本電信電話株式会社 | シミュレーション装置、シミュレーション方法、プログラム |
| CN117009887B (zh) * | 2023-07-28 | 2024-02-13 | 中科景感(厦门)生态环境科技有限公司 | 流域水环境质量精细化估算及分析的方法及系统 |
| CN116822658B (zh) * | 2023-08-28 | 2024-01-26 | 长江三峡集团实业发展(北京)有限公司 | 一种风光资源的预警方法、装置、计算机设备及存储介质 |
| CN117131365B (zh) * | 2023-10-24 | 2024-02-13 | 自然资源部第二海洋研究所 | 基于海气动力场数据的赤潮预测方法、系统及介质 |
| CN117740690B (zh) * | 2023-12-19 | 2024-06-28 | 珠江水利委员会珠江水利科学研究院 | 一种水表溶解氧遥感估算方法、系统及可读存储介质 |
| CN117725345B (zh) * | 2024-02-08 | 2024-05-31 | 哈尔滨工业大学(深圳)(哈尔滨工业大学深圳科技创新研究院) | 基于绿潮生物量密度的多源遥感绿潮生长速率测量方法 |
| CN118246610B (zh) * | 2024-05-30 | 2024-09-10 | 福建省水产研究所(福建水产病害防治中心) | 基于大数据的微藻浓度预测方法及系统 |
| WO2025253489A1 (ja) * | 2024-06-04 | 2025-12-11 | Ntt株式会社 | 推定装置、および推定方法 |
| CN118364977B (zh) * | 2024-06-20 | 2024-11-08 | 中国水产科学研究院南海水产研究所 | 一种海水池塘菌藻群落的养殖生态智能调节方法及系统 |
| CN118395106B (zh) * | 2024-06-27 | 2024-09-24 | 国家海洋局北海预报中心((国家海洋局青岛海洋预报台)(国家海洋局青岛海洋环境监测中心站)) | 一种基于深度学习的绿潮覆盖面积预报方法 |
| KR102937995B1 (ko) | 2024-09-06 | 2026-03-11 | 주식회사 시즈 | 다중 lstm 구조를 기초로 해양 환경에 대한 복수의 환경 변수 각각을 예측하는 전자 장치의 동작 방법 |
| CN119740121B (zh) * | 2024-12-10 | 2025-09-09 | 生态环境部黄河流域生态环境监督管理局生态环境监测与科学研究中心 | 一种水质生物关系映射及敏感性分析方法 |
| CN120316489B (zh) * | 2025-06-13 | 2025-10-03 | 自然资源部第二海洋研究所 | 赤潮预测模型获取方法、赤潮预测方法、装置、终端及计算机存储介质 |
Citations (1)
| Publication number | Priority date | Publication date | Assignee | Title |
|---|---|---|---|---|
| JP2008214942A (ja) * | 2007-03-02 | 2008-09-18 | Gunma Prefecture | アオコ発生予測と発生防止法 |
Family Cites Families (22)
| Publication number | Priority date | Publication date | Assignee | Title |
|---|---|---|---|---|
| JP3131661B2 (ja) * | 1992-07-07 | 2001-02-05 | 株式会社日立製作所 | 水質汚染監視装置及びその方法 |
| JP2002045074A (ja) * | 2000-07-31 | 2002-02-12 | Taisei Corp | 有害赤潮の検知方法 |
| JP2003130864A (ja) | 2001-10-25 | 2003-05-08 | Mitsubishi Heavy Ind Ltd | 水質改善効果予測システム |
| JP4088075B2 (ja) * | 2002-02-01 | 2008-05-21 | 株式会社東芝 | 水処理プロセスハイブリッド水質計測装置及びこれを有する水処理システム |
| JP3607284B2 (ja) * | 2003-03-31 | 2005-01-05 | 株式会社ミキモト | 有害な水質環境の検出方法および水質環境監視システム |
| JP4525447B2 (ja) * | 2005-04-25 | 2010-08-18 | 東洋製罐株式会社 | 耐熱性ポリエステル延伸成形容器及びその製造方法 |
| US20090228516A1 (en) * | 2008-03-10 | 2009-09-10 | The Hong Kong Polytechnic University | Harmful algae indexing (HaiDex) method |
| CN101533000B (zh) * | 2009-03-05 | 2012-07-25 | 重庆大学 | 一种构建水体富营养化风险分析模型的方法 |
| JP3155748U (ja) * | 2009-07-03 | 2009-12-03 | 国土交通省中国地方整備局長 | アオコ事前検知システム |
| JP2011118786A (ja) * | 2009-12-04 | 2011-06-16 | Sony Corp | 情報処理装置、観測値予測方法、及びプログラム |
| CN102135531A (zh) * | 2010-12-24 | 2011-07-27 | 中国科学院南京地理与湖泊研究所 | 大型浅水湖泊72小时蓝藻水华预测方法 |
| US9014983B1 (en) * | 2014-09-26 | 2015-04-21 | Blue Tribe, Inc. | Platform, systems, and methods for obtaining shore and near shore environmental data via crowdsourced sensor network |
| JP2016146046A (ja) | 2015-02-06 | 2016-08-12 | 株式会社Jsol | 予測装置、予測方法及びプログラム |
| CN104899653B (zh) * | 2015-06-02 | 2018-01-12 | 北京工商大学 | 基于专家系统及蓝藻生长机理时序模型的湖库蓝藻水华预测方法 |
| AU2017310722A1 (en) * | 2016-08-12 | 2019-02-21 | Organ Technologies Inc. | Health-level measuring method, health-level determining apparatus, and hair-health diagnosis system |
| CN106484976B (zh) * | 2016-09-28 | 2019-05-07 | 西安交通大学 | 赤潮监测预警系统 |
| KR101924412B1 (ko) * | 2017-04-03 | 2019-02-27 | 한국외국어대학교 연구산학협력단 | 이미지 프로세싱을 이용한 녹조 측정 장치 및 방법 |
| US20200048124A1 (en) * | 2018-06-26 | 2020-02-13 | Cube Hydro Partners, LLC | System and method for closed-loop dissolved oxygen monitoring and control |
| CN109002888B (zh) * | 2018-06-27 | 2022-01-11 | 厦门市海洋与渔业研究所 | 一种赤潮预警方法 |
| CN109460869B (zh) * | 2018-11-06 | 2021-03-12 | 北京英视睿达科技有限公司 | 水环境预警方法和装置 |
| KR102190912B1 (ko) * | 2019-12-20 | 2020-12-15 | 동문이엔티(주) | IoT 기반 실시간 녹조 측정 시스템 |
| CN114564883B (zh) * | 2022-02-11 | 2023-05-19 | 水利部交通运输部国家能源局南京水利科学研究院 | 融合机理与ML的湖泊叶绿素a短期集合预报方法及系统 |
-
2020
- 2020-04-14 US US17/603,894 patent/US20220198303A1/en active Pending
- 2020-04-14 CN CN202080029086.4A patent/CN113711087B/zh active Active
- 2020-04-14 JP JP2021514178A patent/JP7109123B2/ja active Active
- 2020-04-14 WO PCT/JP2020/016472 patent/WO2020213614A1/ja not_active Ceased
-
2022
- 2022-04-05 JP JP2022062945A patent/JP7624732B2/ja active Active
Patent Citations (1)
| Publication number | Priority date | Publication date | Assignee | Title |
|---|---|---|---|---|
| JP2008214942A (ja) * | 2007-03-02 | 2008-09-18 | Gunma Prefecture | アオコ発生予測と発生防止法 |
Non-Patent Citations (2)
| Title |
|---|
| NAGAHAMA, YUMI ET AL.: "The Construction and Varification of Forecasting Model for Microcystis Bloom for Tsuchiuraisi Bay.", ANNUAL REPORT OF IBARAKI KASUMIGAURA ENVIRONMENTAL SCIENCE CENTER., vol. 13, 2017, pages 41 - 45 * |
| SHONO, HIROSHI ET AL.: "Predicting Yatsushiro Sea Red Tides with Machine Learning/Deep Learning Using Weather Data.", ABSTRACTS OF THE JAPANESE SOCIETY OF FISHERIES OCEANOGRAPHY., 21 November 2018 (2018-11-21), pages 70 * |
Cited By (15)
| Publication number | Priority date | Publication date | Assignee | Title |
|---|---|---|---|---|
| JPWO2022085802A1 (ja) * | 2020-10-23 | 2022-04-28 | ||
| CN113158762B (zh) * | 2021-02-23 | 2024-05-28 | 中国科学院南京地理与湖泊研究所 | 大型湖库滨岸带蓝藻水华堆积风险评估方法 |
| CN113158762A (zh) * | 2021-02-23 | 2021-07-23 | 中国科学院南京地理与湖泊研究所 | 大型湖库滨岸带蓝藻水华堆积风险评估方法 |
| JP2022191176A (ja) * | 2021-06-15 | 2022-12-27 | 哈爾濱工程大学 | Steof-lstmに基づく海洋環境要素予測方法 |
| JP7175415B1 (ja) | 2021-06-15 | 2022-11-18 | 哈爾濱工程大学 | Steof-lstmに基づく海洋環境要素予測方法 |
| CN114239422A (zh) * | 2022-02-23 | 2022-03-25 | 中国海洋大学 | 基于机器学习提高海洋叶绿素a浓度预报准确度的方法 |
| WO2023234079A1 (ja) * | 2022-06-01 | 2023-12-07 | コニカミノルタ株式会社 | データ処理装置、データ処理システム、データ処理方法及びプログラム |
| CN114723188A (zh) * | 2022-06-09 | 2022-07-08 | 广东盈峰科技有限公司 | 水质预测方法、装置、计算机设备和存储介质 |
| CN115472230A (zh) * | 2022-09-13 | 2022-12-13 | 中国科学院生态环境研究中心 | 一种基于常规水质理化指标预测微囊藻生长状况的方法 |
| CN116310543A (zh) * | 2023-03-14 | 2023-06-23 | 自然资源部第一海洋研究所 | Gf-1 wfv卫星赤潮深度学习探测模型、构建方法及设备 |
| CN116310543B (zh) * | 2023-03-14 | 2023-09-22 | 自然资源部第一海洋研究所 | Gf-1 wfv卫星赤潮深度学习探测模型、构建方法及设备 |
| CN117350601A (zh) * | 2023-12-06 | 2024-01-05 | 北京英视睿达科技股份有限公司 | 水质预测方法、装置、电子设备及存储介质 |
| CN117350601B (zh) * | 2023-12-06 | 2024-04-16 | 北京英视睿达科技股份有限公司 | 水质预测方法、装置、电子设备及存储介质 |
| CN118577020A (zh) * | 2024-08-06 | 2024-09-03 | 深圳市宏源建设科技有限公司 | 基于物联网的泥水沉淀池监控管理系统 |
| CN119005539A (zh) * | 2024-10-24 | 2024-11-22 | 山东省水利科学研究院 | 一种水质监测预警方法及系统 |
Also Published As
| Publication number | Publication date |
|---|---|
| CN113711087A (zh) | 2021-11-26 |
| CN113711087B (zh) | 2023-11-14 |
| JP7624732B2 (ja) | 2025-01-31 |
| JP7109123B2 (ja) | 2022-07-29 |
| JPWO2020213614A1 (ja) | 2020-10-22 |
| JP2022082681A (ja) | 2022-06-02 |
| US20220198303A1 (en) | 2022-06-23 |
Similar Documents
| Publication | Publication Date | Title |
|---|---|---|
| JP7109123B2 (ja) | 環境因子予測装置、方法、プログラム、学習済モデルおよび記憶媒体 | |
| Minuzzi et al. | A deep learning approach to predict significant wave height using long short-term memory | |
| Zheng et al. | Prediction of harmful algal blooms in large water bodies using the combined EFDC and LSTM models | |
| Rahman et al. | Dissolved oxygen prediction in prawn ponds from a group of one step predictors | |
| Arepalli et al. | An IoT framework for quality analysis of aquatic water data using time-series convolutional neural network | |
| Fernández et al. | Forecasting the cyanotoxins presence in fresh waters: A new model based on genetic algorithms combined with the MARS technique | |
| Dabrowski et al. | State space models for forecasting water quality variables: an application in aquaculture prawn farming | |
| Zimmer-Faust et al. | Statistical models of fecal coliform levels in Pacific Northwest estuaries for improved shellfish harvest area closure decision making | |
| CN118501379A (zh) | 一种牡蛎礁典型生态区域分层分类海水提取与检测方法 | |
| Kenitz et al. | Environmental and ecological drivers of harmful algal blooms revealed by automated underwater microscopy | |
| Simonetti et al. | On the use of hydrodynamic modelling and random forest classifiers for the prediction of hypoxia in coastal lagoons | |
| CN106295833A (zh) | 一种太平洋褶柔鱼资源补充量预测方法及其应用 | |
| Yang et al. | LangYa: Revolutionizing cross-spatiotemporal ocean forecasting | |
| Busari et al. | Advancing harmful algal bloom predictions using chlorophyll-a as an Indicator: Combining deep learning and EnKF data assimilation method | |
| Hansen et al. | Assessing the state of the Barents Sea using indicators: how, when, and where? | |
| Bhabra et al. | Optimal harvesting with autonomous tow vessels for offshore macroalgae farming | |
| Boulêtreau et al. | Identification of a minimal adequate model to describe the biomass dynamics of river epilithon | |
| Janecki et al. | The influence of biochemical parameters on primary production in the Gulf of Gdańsk region: A model study | |
| Sahbani et al. | Performance of different modeling techniques in testing the impact of environmental variables on eel landing in Ichkeul Lake, a RAMSAR Wetland and UNESCO biosphere reserve | |
| Beracko et al. | Drivers predicting biodiversity and community assembly of benthic diatoms in a karst spring environment | |
| Amssaya et al. | IoT and Machine Learning Based Techniques for Monitoring and Predicting Water Hyacinth Expansion Rate in Lake Tana Ecosystem | |
| Huang et al. | Interpretable Machine Learning-Based Spring Algal Bloom Forecast Model for the Coastal Waters of Zhejiang | |
| Yadav et al. | Forecasting quarterly landings of total fish and major pelagic fishes and modelling the impacts of climate change on Bombay duck along India’s north-western Gujarat coast | |
| Marzidovšek et al. | Explainable machine learning for predicting shellfish toxicity in the Adriatic Sea using long-term monitoring data of HABs | |
| Al-Attar et al. | Estimation of dissolved oxygen levels using Landsat 8 images: Application to Kuwait territorial waters |
Legal Events
| Date | Code | Title | Description |
|---|---|---|---|
| 121 | Ep: the epo has been informed by wipo that ep was designated in this application |
Ref document number: 20791839 Country of ref document: EP Kind code of ref document: A1 |
|
| ENP | Entry into the national phase |
Ref document number: 2021514178 Country of ref document: JP Kind code of ref document: A |
|
| NENP | Non-entry into the national phase |
Ref country code: DE |
|
| 122 | Ep: pct application non-entry in european phase |
Ref document number: 20791839 Country of ref document: EP Kind code of ref document: A1 |