WO2020188640A1 - 構造物評価システム、構造物評価装置及び構造物評価方法 - Google Patents
構造物評価システム、構造物評価装置及び構造物評価方法 Download PDFInfo
- Publication number
- WO2020188640A1 WO2020188640A1 PCT/JP2019/010887 JP2019010887W WO2020188640A1 WO 2020188640 A1 WO2020188640 A1 WO 2020188640A1 JP 2019010887 W JP2019010887 W JP 2019010887W WO 2020188640 A1 WO2020188640 A1 WO 2020188640A1
- Authority
- WO
- WIPO (PCT)
- Prior art keywords
- elastic wave
- unit
- arrival time
- reliability
- sensor
- Prior art date
Links
Images


Classifications
-
- G—PHYSICS
- G01—MEASURING; TESTING
- G01N—INVESTIGATING OR ANALYSING MATERIALS BY DETERMINING THEIR CHEMICAL OR PHYSICAL PROPERTIES
- G01N29/00—Investigating or analysing materials by the use of ultrasonic, sonic or infrasonic waves; Visualisation of the interior of objects by transmitting ultrasonic or sonic waves through the object
- G01N29/04—Analysing solids
- G01N29/06—Visualisation of the interior, e.g. acoustic microscopy
- G01N29/0654—Imaging
- G01N29/069—Defect imaging, localisation and sizing using, e.g. time of flight diffraction [TOFD], synthetic aperture focusing technique [SAFT], Amplituden-Laufzeit-Ortskurven [ALOK] technique
-
- G—PHYSICS
- G01—MEASURING; TESTING
- G01N—INVESTIGATING OR ANALYSING MATERIALS BY DETERMINING THEIR CHEMICAL OR PHYSICAL PROPERTIES
- G01N29/00—Investigating or analysing materials by the use of ultrasonic, sonic or infrasonic waves; Visualisation of the interior of objects by transmitting ultrasonic or sonic waves through the object
- G01N29/44—Processing the detected response signal, e.g. electronic circuits specially adapted therefor
- G01N29/4463—Signal correction, e.g. distance amplitude correction [DAC], distance gain size [DGS], noise filtering
-
- G—PHYSICS
- G01—MEASURING; TESTING
- G01M—TESTING STATIC OR DYNAMIC BALANCE OF MACHINES OR STRUCTURES; TESTING OF STRUCTURES OR APPARATUS, NOT OTHERWISE PROVIDED FOR
- G01M5/00—Investigating the elasticity of structures, e.g. deflection of bridges or air-craft wings
- G01M5/0008—Investigating the elasticity of structures, e.g. deflection of bridges or air-craft wings of bridges
-
- G—PHYSICS
- G01—MEASURING; TESTING
- G01M—TESTING STATIC OR DYNAMIC BALANCE OF MACHINES OR STRUCTURES; TESTING OF STRUCTURES OR APPARATUS, NOT OTHERWISE PROVIDED FOR
- G01M5/00—Investigating the elasticity of structures, e.g. deflection of bridges or air-craft wings
- G01M5/0033—Investigating the elasticity of structures, e.g. deflection of bridges or air-craft wings by determining damage, crack or wear
-
- G—PHYSICS
- G01—MEASURING; TESTING
- G01M—TESTING STATIC OR DYNAMIC BALANCE OF MACHINES OR STRUCTURES; TESTING OF STRUCTURES OR APPARATUS, NOT OTHERWISE PROVIDED FOR
- G01M5/00—Investigating the elasticity of structures, e.g. deflection of bridges or air-craft wings
- G01M5/0066—Investigating the elasticity of structures, e.g. deflection of bridges or air-craft wings by exciting or detecting vibration or acceleration
-
- G—PHYSICS
- G01—MEASURING; TESTING
- G01M—TESTING STATIC OR DYNAMIC BALANCE OF MACHINES OR STRUCTURES; TESTING OF STRUCTURES OR APPARATUS, NOT OTHERWISE PROVIDED FOR
- G01M5/00—Investigating the elasticity of structures, e.g. deflection of bridges or air-craft wings
- G01M5/0083—Investigating the elasticity of structures, e.g. deflection of bridges or air-craft wings by measuring variation of impedance, e.g. resistance, capacitance, induction
-
- G—PHYSICS
- G01—MEASURING; TESTING
- G01M—TESTING STATIC OR DYNAMIC BALANCE OF MACHINES OR STRUCTURES; TESTING OF STRUCTURES OR APPARATUS, NOT OTHERWISE PROVIDED FOR
- G01M7/00—Vibration-testing of structures; Shock-testing of structures
- G01M7/02—Vibration-testing by means of a shake table
- G01M7/025—Measuring arrangements
-
- G—PHYSICS
- G01—MEASURING; TESTING
- G01N—INVESTIGATING OR ANALYSING MATERIALS BY DETERMINING THEIR CHEMICAL OR PHYSICAL PROPERTIES
- G01N29/00—Investigating or analysing materials by the use of ultrasonic, sonic or infrasonic waves; Visualisation of the interior of objects by transmitting ultrasonic or sonic waves through the object
- G01N29/04—Analysing solids
- G01N29/07—Analysing solids by measuring propagation velocity or propagation time of acoustic waves
-
- G—PHYSICS
- G01—MEASURING; TESTING
- G01N—INVESTIGATING OR ANALYSING MATERIALS BY DETERMINING THEIR CHEMICAL OR PHYSICAL PROPERTIES
- G01N29/00—Investigating or analysing materials by the use of ultrasonic, sonic or infrasonic waves; Visualisation of the interior of objects by transmitting ultrasonic or sonic waves through the object
- G01N29/14—Investigating or analysing materials by the use of ultrasonic, sonic or infrasonic waves; Visualisation of the interior of objects by transmitting ultrasonic or sonic waves through the object using acoustic emission techniques
-
- G—PHYSICS
- G01—MEASURING; TESTING
- G01N—INVESTIGATING OR ANALYSING MATERIALS BY DETERMINING THEIR CHEMICAL OR PHYSICAL PROPERTIES
- G01N29/00—Investigating or analysing materials by the use of ultrasonic, sonic or infrasonic waves; Visualisation of the interior of objects by transmitting ultrasonic or sonic waves through the object
- G01N29/44—Processing the detected response signal, e.g. electronic circuits specially adapted therefor
- G01N29/4454—Signal recognition, e.g. specific values or portions, signal events, signatures
-
- G—PHYSICS
- G01—MEASURING; TESTING
- G01N—INVESTIGATING OR ANALYSING MATERIALS BY DETERMINING THEIR CHEMICAL OR PHYSICAL PROPERTIES
- G01N29/00—Investigating or analysing materials by the use of ultrasonic, sonic or infrasonic waves; Visualisation of the interior of objects by transmitting ultrasonic or sonic waves through the object
- G01N29/44—Processing the detected response signal, e.g. electronic circuits specially adapted therefor
- G01N29/4472—Mathematical theories or simulation
-
- G—PHYSICS
- G01—MEASURING; TESTING
- G01N—INVESTIGATING OR ANALYSING MATERIALS BY DETERMINING THEIR CHEMICAL OR PHYSICAL PROPERTIES
- G01N2291/00—Indexing codes associated with group G01N29/00
- G01N2291/01—Indexing codes associated with the measuring variable
- G01N2291/011—Velocity or travel time
-
- G—PHYSICS
- G01—MEASURING; TESTING
- G01N—INVESTIGATING OR ANALYSING MATERIALS BY DETERMINING THEIR CHEMICAL OR PHYSICAL PROPERTIES
- G01N2291/00—Indexing codes associated with group G01N29/00
- G01N2291/02—Indexing codes associated with the analysed material
- G01N2291/023—Solids
- G01N2291/0232—Glass, ceramics, concrete or stone
-
- G—PHYSICS
- G01—MEASURING; TESTING
- G01N—INVESTIGATING OR ANALYSING MATERIALS BY DETERMINING THEIR CHEMICAL OR PHYSICAL PROPERTIES
- G01N2291/00—Indexing codes associated with group G01N29/00
- G01N2291/02—Indexing codes associated with the analysed material
- G01N2291/028—Material parameters
- G01N2291/0289—Internal structure, e.g. defects, grain size, texture
Definitions
- the embodiment of the present invention relates to a structure evaluation system, a structure evaluation device, and a structure evaluation method.
- AE Acoustic Emission
- AE Acoustic Emission
- AE is an elastic wave generated by the growth of fatigue cracks in a material.
- an elastic wave is detected as an AE signal (voltage signal) by an AE sensor using a piezoelectric element.
- the AE signal is detected as a sign before material breakage occurs. Therefore, the frequency of occurrence of the AE signal and the signal intensity are useful as indicators of the soundness of the material. Therefore, research is being conducted on techniques for detecting signs of deterioration of structures by the AE method.
- the tomography method is known as one of the evaluation methods of structures using AE signals.
- Tomography is one of the inverse analysis methods for estimating the internal velocity field structure in the measurement region by using the arrival time difference of the signals detected between a plurality of sensors.
- Tomography can be used as a non-destructive inspection method to detect damaged parts inside a structure as a change in velocity field.
- a method using an AE signal generated from the inside of a material as the signal source is known as AE tomography.
- the results obtained by AE tomography in a real environment are not always accurate because they include estimation errors based on measurement errors. Therefore, the evaluation accuracy of the deteriorated state of the structure based on the result obtained by AE tomography may be low.
- An object to be solved by the present invention is to provide a structure evaluation system, a structure evaluation device, and a structure evaluation method capable of improving the evaluation accuracy of the deteriorated state of a structure.
- the structure evaluation system of the embodiment has a plurality of sensors, an arrival time determination unit, a reliability calculation unit, and a map generation unit.
- Multiple sensors detect elastic waves.
- the arrival time determination unit determines the arrival time of the elastic wave by using the elastic wave detected by each of the plurality of sensors.
- the reliability calculation unit calculates the reliability of the measurement waveform of the elastic wave based on the arrival time.
- the map generation unit generates the first map based on the calculated reliability or the reliability and the distance.
- the schematic block diagram which shows the function of the evaluation part in 1st Embodiment. The figure which shows the structure model of the concrete floor board prepared for the simulation.
- the figure which shows the waveform of the elastic wave detected by the sensor. The figure which shows the waveform of the elastic wave detected by the sensor.
- the figure which shows the waveform of the elastic wave detected by the sensor. The figure which shows the specific example of the error map in this embodiment.
- the figure which shows the specific example of the speed field map after correction in this embodiment The schematic block diagram which shows the function of the evaluation part in 4th Embodiment.
- FIG. 1 is a diagram showing the configuration of the structure evaluation system 100 according to the first embodiment.
- the structure evaluation system 100 is used to evaluate the soundness of the structure.
- evaluation means determining the degree of soundness of a structure, that is, the state of deterioration of the structure, based on a certain criterion.
- a bridge made of concrete will be described as an example of the structure, but the structure does not have to be limited to the bridge.
- the structure may be any structure as long as it generates elastic waves due to the generation or growth of cracks or an external impact (for example, rain, artificial rain, etc.).
- the structure may be bedrock.
- the bridge is not limited to a structure erected on a river or a valley, but also includes various structures (for example, a viaduct on an expressway) provided above the ground.
- damage that affects the evaluation of the deterioration state of the structure includes damage inside the structure that hinders the propagation of elastic waves such as cracks, cavities, and sedimentation.
- the cracks include vertical cracks, horizontal cracks, diagonal cracks, and the like.
- a vertical crack is a crack that occurs in the direction perpendicular to the surface of the structure in which the sensor is installed.
- a lateral crack is a crack that occurs in the horizontal direction on the surface of the structure in which the sensor is installed.
- An oblique crack is a crack that occurs in a direction other than horizontal and vertical on the surface of the structure in which the sensor is installed.
- Sedimentation is deterioration in which concrete changes to a sediment-like shape mainly at the boundary between asphalt and concrete plate bridge.
- a specific configuration of the structure evaluation system 100 will be described.
- the structure evaluation system 100 includes a plurality of sensors 10-1 to 10-n (n is an integer of 3 or more), a plurality of amplifiers 11-1 to 11-n, and a plurality of A / D converters 12-1 to 12-. n, the signal processing unit 20 and the structure evaluation device 30 are provided. The signal processing unit 20 and the structure evaluation device 30 are connected by wire so as to be communicable.
- the sensors 10-1 to 10-n are not distinguished, the sensor 10 is described.
- the amplifiers 11-1 to 11-are not distinguished they are described as the amplifier 11.
- the A / D converters 12-1 to 12-n are not distinguished, they are described as the A / D converter 12.
- the sensor 10 is installed in the structure.
- the sensor 10 is installed on a concrete slab of a bridge.
- the sensor 10 has a piezoelectric element and detects elastic waves generated from the inside of the structure.
- the sensor 10 is installed at a position where it can detect elastic waves.
- the sensor 10 is installed on any surface, side surface, or bottom surface of the structure.
- the sensor 10 converts the detected elastic wave into an AE source signal which is a voltage signal.
- the sensor 10 outputs the AE source signal to the amplifier 11.
- the sensor 10 for example, a piezoelectric element having a sensitivity in the range of 10 kHz to 1 MHz is used.
- the sensor 10 has a resonance type having a resonance peak in the frequency range, a broadband type in which resonance is suppressed, and the like, but the type of the sensor 10 may be any.
- the method for detecting the elastic wave by the sensor 10 includes a voltage output type, a resistance change type, a capacitance type and the like, and any detection method may be used.
- An acceleration sensor may be used instead of the sensor 10. In this case, the acceleration sensor detects elastic waves generated from inside the structure. Then, the acceleration sensor performs the same processing as the sensor 10 to convert the detected elastic wave into an AE source signal which is a voltage signal. After that, the acceleration sensor outputs the converted AE source signal to the amplifier 11.
- the thickness of the structure is, for example, 15 cm or more.
- the amplifier 11 amplifies the AE source signal output from the sensor 10, and outputs the amplified AE source signal to the A / D converter 12.
- the A / D converter 12 quantizes the AE source signal and converts it into a digital signal.
- the A / D converter 12 outputs the AE source signal as digital time series data to the signal processing unit 20.
- the signal processing unit 20 inputs the time series data output from the A / D converter 12.
- the signal processing unit 20 performs signal processing on the input digital signal of the time series data.
- the signal processing performed by the signal processing unit 20 is, for example, noise removal, parameter extraction, and the like.
- the signal processing unit 20 generates transmission data including the digital signal after signal processing, and outputs the generated transmission data to the structure evaluation device 30.
- the structure evaluation device 30 includes a CPU (Central Processing Unit) connected by a bus, a memory, an auxiliary storage device, and the like, and executes an evaluation program. By executing the evaluation program, the structure evaluation device 30 functions as a device including the evaluation unit 31 and the display unit 32. Even if all or a part of each function of the structure evaluation device 30 is realized by using hardware such as ASIC (Application Specific Integrated Circuit), PLD (Programmable Logic Device), FPGA (Field Programmable Gate Array), etc. Good.
- the evaluation program may also be recorded on a computer-readable recording medium.
- the computer-readable recording medium is, for example, a flexible disk, a magneto-optical disk, a portable medium such as a ROM or a CD-ROM, or a storage device such as a hard disk built in a computer system. Further, the evaluation program may be transmitted and received via a telecommunication line.
- the evaluation unit 31 inputs the transmission data output from the signal processing unit 20.
- the evaluation unit 31 evaluates the soundness of the structure based on the input transmission data.
- the display unit 32 is an image display device such as a liquid crystal display or an organic EL (Electro Luminescence) display.
- the display unit 32 displays the evaluation result under the control of the evaluation unit 31.
- the display unit 32 may be an interface for connecting the image display device to the structure evaluation device 30. In this case, the display unit 32 generates a video signal for displaying the evaluation result, and outputs the video signal to the image display device connected to the display unit 32.
- FIG. 2 is a schematic block diagram showing the functions of the signal processing unit 20 according to the first embodiment.
- the signal processing unit 20 includes a waveform shaping filter 201, a gate generation circuit 202, an arrival time determination unit 203, a reliability calculation unit 204, a feature amount extraction unit 205, a transmission data generation unit 206, a memory 207, and an output unit 208.
- the waveform shaping filter 201 removes noise components outside a predetermined signal band from the digital signal of the input time series data.
- the waveform shaping filter 201 is, for example, a digital bandpass filter (BPF).
- the waveform shaping filter 201 outputs a signal after noise component removal (hereinafter referred to as “noise removal elastic wave signal”) to the gate generation circuit 202, the arrival time determination unit 203, the reliability calculation unit 204, and the feature amount extraction unit 205. ..
- the gate generation circuit 202 inputs the noise-removing elastic wave signal output from the waveform shaping filter 201.
- the gate generation circuit 202 generates a gate signal indicating whether or not the waveform of the input noise-removing elastic wave signal is sustained.
- the gate generation circuit 202 is realized by, for example, an envelope detector and a comparator.
- the envelope detector detects the envelope of a noise-removing elastic wave signal.
- the envelope is extracted, for example, by squared a noise-removing elastic wave signal and performing a predetermined process (for example, a process using a low-pass filter or a Hilbert transform) on the squared output value.
- the comparator determines whether or not the envelope of the noise-removing elastic wave signal is equal to or greater than a predetermined threshold value.
- the gate generation circuit 202 determines the arrival time of the first gate signal indicating that the waveform of the noise-removing elastic wave signal is sustained. Output to the reliability calculation unit 204 and the feature amount extraction unit 205. On the other hand, the gate generation circuit 202 determines the arrival time of a second gate signal indicating that the waveform of the noise-removing elastic wave signal is not sustained when the envelope of the noise-removing elastic wave signal becomes less than a predetermined threshold value. Output to 203, reliability calculation unit 204, and feature amount extraction unit 205.
- the arrival time determination unit 203 inputs the noise-removing elastic wave signal output from the waveform shaping filter 201 and the gate signal output from the gate generation circuit 202.
- the arrival time determination unit 203 uses the noise-removing elastic wave signal input while the first gate signal is input, and uses the first elastic wave arrival time t M and the second elastic wave arrival time t TH. To determine.
- the first elastic wave arrival time t M and the second elastic wave arrival time t TH are the arrival time of the elastic wave obtained by machine learning, the time when the amplitude of the noise-removing elastic wave signal exceeds a predetermined threshold, or It is any time that satisfies a predetermined criterion that combines these information.
- the arrival time of the elastic wave obtained by machine learning is the time when it is determined by machine learning that the elastic wave has been received by the sensor 10.
- a method of obtaining the first elastic wave arrival time t M by machine learning for example, a method such as AIC (Akaike's Information Criterion), ChangeFinder, or a change point detection algorithm by deep learning can be used.
- ChangeFinder is used as a method for obtaining the first elastic wave arrival time t M, and the amplitude of the noise-removing elastic wave signal exceeds a predetermined threshold as a method for obtaining the second elastic wave arrival time t TH. The case where the time is used will be described.
- the arrival time determination unit 203 outputs the determined first elastic wave arrival time t M and the second elastic wave arrival time t TH as time information to the reliability calculation unit 204 and the transmission data generation unit 206.
- the reliability calculation unit 204 inputs a noise-removing elastic wave signal, a gate signal, and time information.
- the reliability calculation unit 204 calculates the reliability of the measurement waveform of the elastic wave based on the time information obtained while the first gate signal is being input.
- the reliability calculation unit 204 outputs the calculated reliability information to the transmission data generation unit 206.
- the feature amount extraction unit 205 inputs the noise-removing elastic wave signal output from the waveform shaping filter 201 and the gate signal output from the gate generation circuit 202.
- the feature amount extraction unit 205 extracts the feature amount of the noise-removing elastic wave signal by using the noise-removing elastic wave signal input while the first gate signal is being input.
- the feature amount is information indicating the feature of the noise-removing elastic wave signal.
- the features include, for example, the waveform amplitude [mV] of the noise-removed elastic wave signal, the rise time [usc] of the gate signal, the duration [usc] of the gate signal, the zero cross count number [times] of the noise-removed elastic wave signal, and noise. Waveform energy of the removed elastic wave signal [arb. ] And the frequency [Hz] of the noise-removing elastic wave signal.
- the feature amount extraction unit 205 outputs parameters related to the extracted feature amount to the transmission data generation unit 206.
- the sensor ID is associated with the parameter related to the feature amount.
- the sensor ID represents identification information for identifying the sensor 10 installed in the area (hereinafter referred to as “evaluation area”) to be evaluated for the soundness of the structure.
- the amplitude of the noise-removing elastic wave signal is, for example, the value of the maximum amplitude among the noise-removing elastic wave signals.
- the rise time of the gate signal is, for example, the time T1 from the zero value until the gate signal rises beyond a predetermined value set in advance.
- the duration of the gate signal is, for example, the time from the start of the rise of the gate signal until the amplitude becomes smaller than the preset value.
- the zero cross count number of the noise-removing elastic wave signal is, for example, the number of times the noise-removing elastic wave signal crosses the reference line passing through the zero value.
- the energy of the waveform of the noise-removing elastic wave signal is, for example, a value obtained by time-integrating the square of the amplitude at each time point. The definition of energy is not limited to the above example, and may be approximated using, for example, a waveform envelope.
- the frequency of the noise-removing elastic wave signal is the frequency of the noise-removing elastic wave signal.
- the transmission data generation unit 206 inputs time information, reliability information, and parameters related to the feature amount.
- the transmission data generation unit 206 generates transmission data by associating the input time information, the reliability information, and the parameters related to the feature amount.
- the memory 207 stores transmission data.
- the memory 207 is, for example, a dual port RAM (Random Access Memory).
- the output unit 208 sequentially outputs the transmission data stored in the memory 207 to the structure evaluation device 30.
- FIG. 3 is a schematic block diagram showing the functions of the evaluation unit 31 in the first embodiment.
- the evaluation unit 31 includes an acquisition unit 311, a memory 312, an event extraction unit 313, a position / velocity orientation unit 314, and an error map generation unit 315.
- the acquisition unit 311 acquires the transmission data output from the signal processing unit 20.
- the acquisition unit 311 stores the acquired transmission data in the memory 312.
- the memory 312 stores the transmission data acquired by the acquisition unit 311.
- the memory 312 is configured by using a storage device such as a magnetic hard disk device or a semiconductor storage device.
- the event extraction unit 313 extracts the transmission data in one event from the transmission data stored in the memory 312.
- An event represents an elastic wave generation event that has occurred in a structure.
- elastic waves are detected by the plurality of sensors 10 at substantially the same time. That is, the memory 312 stores transmission data related to elastic waves detected at substantially the same time. Therefore, the event extraction unit 313 provides a predetermined time window, and extracts all transmission data whose arrival time is within the range of the time window as transmission data in one event.
- the event extraction unit 313 outputs the transmission data in one extracted event to the position / velocity setting unit 314 and the error map generation unit 315.
- the position / velocity setting unit 314 determines the position of the elastic wave source (hereinafter referred to as “elastic wave source”) and the elastic wave propagation velocity of the structure based on the plurality of transmitted data extracted by the event extraction unit 313. ..
- the position / velocity orientation unit 314 holds information regarding the installation position of the sensor 10 installed on the structure (hereinafter referred to as “sensor position information”) in advance in association with the sensor ID.
- the sensor position information is, for example, latitude and longitude, or horizontal and vertical distances from a reference position of the structure.
- a Kalman filter, a least squares method, or the like may be used to determine the position of the elastic wave source and the elastic wave propagation velocity of the structure.
- the position / velocity setting unit 314 outputs the position information of the oriented elastic wave source to the error map generation unit 315.
- the error map generation unit 315 performs an error map (first) based on the reliability information and time information included in the transmission data in the plurality of events output from the event extraction unit 313 and the position of the evaluated elastic wave source. Map) is generated.
- the error map represents a distribution map in which the evaluation area is divided into a plurality of sections, and the integrated value of the values related to the reciprocal of the time difference of the arrival time of the elastic wave is assigned to each section. That is, the error map is a distribution map showing the degree of the time difference (error) of the arrival time of the elastic wave in the evaluation region.
- the integrated value of reliability when there is a difference in the passing frequency of elastic waves in each section, the integrated value of reliability is large in the section with high passing frequency, and the integrated value of reliability is small in the section with low passing frequency.
- Various regularized least squares methods such as the Kalman filter and the least squares method can be used to generate the error map.
- the error map makes it possible to grasp in which region of the evaluation region the degree of time difference between the arrival times of the elastic waves is large, and the frequency of passage of the elastic waves in each section. The greater the degree of time difference between the arrival times of elastic waves, the higher the possibility that problems such as poor adhesion of the sensor 10 have occurred.
- FIG. 4 is a diagram showing a structure model of a concrete floor board prepared for simulation.
- the concrete floor board shown in FIG. 4 is a square having a side of 800 mm.
- Sensors 10-1 to 10-4 are installed at the four corners of the concrete floor board, and sensors 10-5 are installed at the center of the concrete floor board.
- the region 41 represents a damaged region (hereinafter referred to as “damaged region”).
- impacts at 25 points were applied to the concrete floor board to generate elastic waves.
- FIGS. 5A to 5E The waveforms of elastic waves detected by the sensors 10-1 to 10-5 when an impact is applied to the concrete floor plate at the position indicated by the point 42 in FIG. 4 are shown in FIGS. 5A to 5E.
- FIG. 5A represents the waveform of the elastic wave detected by the sensor 10-1
- FIG. 5B represents the waveform of the elastic wave detected by the sensor 10-2
- FIG. 5C represents the waveform of the elastic wave detected by the sensor 10-3
- 5D shows the waveform of the elastic wave detected by the sensor 10-4
- FIG. 5E shows the waveform of the elastic wave detected by the sensor 10-5.
- the vertical axis represents the amplitude of elastic waves
- the horizontal axis represents time.
- FIGS. 5A to 5E the vertical axis represents the amplitude of elastic waves
- the vertical axis represents the CF (Change finder) score
- the horizontal axis represents time.
- the time of t CF1 in FIGS. 5A to 5E is the first elastic wave arrival time t M obtained by the arrival time determination unit 203 by the method of ChangeFinder. That is, the time t CF1 is the time when the CF score exceeds a certain threshold value.
- the time of t TH in FIGS. 5A to 5E is the second elastic wave arrival time t TH .
- FIG. 6 is a diagram showing a specific example of the error map in the present embodiment.
- FIG. 6 is a contour map showing an error map 50 when an elastic wave is generated by applying an impact of 25 points to a concrete floor plate in the above simulation. As shown in FIG. 6, the error is large in the region on the left side of the error map 50. It is considered that this is because the sensor 10-1 and the sensor 10-2 had poor adhesion.
- FIG. 7 is a sequence diagram showing a flow of evaluation processing of a deteriorated state by the structure evaluation system 100 in the first embodiment.
- the arrival time determination unit 204 determines the first elastic wave arrival time t M and the second elastic wave arrival time t TH based on the noise-removing elastic wave signal (step S101).
- the arrival time determination unit 203 outputs the determined time information to the reliability calculation unit 204 and the transmission data generation unit 206.
- the reliability calculation unit 204 calculates the reliability of the noise-removing elastic wave signal based on the time information obtained while the first gate signal is being input (step S102). For example, the reliability calculation unit 204 calculates a value related to the reciprocal of the time difference between the first elastic wave arrival time t M and the second elastic wave arrival time t TH as the reliability. The reliability calculation unit 204 outputs the calculated reliability information to the transmission data generation unit 206.
- the feature amount extraction unit 205 extracts the feature amount of the noise-removing elastic wave signal obtained while the first gate signal is input (step S103).
- the transmission data generation unit 206 generates transmission data by associating the information acquired in the processes from step S101 to step S103 (step S104).
- the output unit 208 outputs the generated transmission data to the structure evaluation device 30 (step S105).
- the processes from step S101 to step S105 are executed every time an elastic wave is detected by the sensor 10 and a first gate signal is output. That is, every time the first gate signal is output, the first elastic wave arrival time t M , the second elastic wave arrival time t TH , the reliability and the feature amount are acquired.
- the acquisition unit 311 acquires the transmission data output from the signal processing unit 20, and stores the acquired transmission data in the memory 312 (step S106).
- the event extraction unit 313 extracts the transmission data in one event from the transmission data stored in the memory 312 (step S107).
- the event extraction unit 313 extracts transmission data in one event that is larger than the number (for example, three) required for position and speed orientation.
- the event extraction unit 313 outputs the extracted transmission data to the position / velocity orientation unit 314.
- the position / velocity setting unit 314 determines the position or position of the elastic wave source generated in one event and the velocity of the elastic wave based on the transmission data in one event (step S108).
- the structure evaluation device 30 may be provided with another functional unit that determines the velocity of the elastic wave.
- the position or position of the elastic wave source and the method of deriving the velocity of the elastic wave will be specifically described.
- the observed value is t i, for n sensor the n-1 (x s, y s, z s, v) nonlinear simultaneous equations are obtained for the unknowns.
- the position / velocity setting unit 314 outputs the position information of the evaluated elastic wave source to the error map generation unit 315.
- the error map generation unit 315 generates an error map based on the reliability information and time information included in the transmission data in the plurality of events output from the event extraction unit 313 and the position information of the elastic wave source (step S109). ).
- the error map generation unit 315 divides the evaluation area of the structure into a plurality of sections.
- the error map generation unit 315 adjusts the slowness S, which is the reciprocal of the velocity of the elastic wave in each section, so as to best match the measured value, and estimates the velocity field distribution in the target region.
- the observation equation is expressed as Eq. (2).
- Equation (2) Y represents the measured value (arrival time) vector, H represents the observation matrix, X represents the unknown parameter (slowness) vector, and V represents the measurement error vector.
- the element lij (i, j is an integer of 1 or more) of the observation matrix H indicates the length of the line segment through which the elastic wave measured by the sensor 10-i passes through the compartment j.
- Equation (3) X- (-is above X, the same applies hereinafter) represents the estimated value of X, P represents the estimation error covariance matrix of X, and R represents the measurement error having ⁇ t as a diagonal component. Represents a covariance matrix.
- the reciprocal of R corresponds to the value related to the reciprocal of the time difference.
- X ⁇ ( ⁇ is above X, and so on) that minimizes this equation (3) is given as in the following equation (4).
- the diagonal term of P represents the estimation error variance of the parameter X, and its square root corresponds to the estimation error. That is, the error map generation unit 315 obtains an estimated error map (error map) of the evaluation region by mapping the diagonal terms of P of each section to the corresponding sections. Looking at the update formula of P here, P has a large value (not updated) when each element of the observation matrix H does not have a value, or the diagonal component ⁇ t of the measurement error covariance matrix R is large. You can tell when it has a value.
- the error map generation unit 315 outputs the generated error map to the display unit 32. As an evaluation result, the display unit 32 displays the generated error map as a contour diagram according to the level of the error (step S110).
- the time difference between the first elastic wave arrival time t M and the second elastic wave arrival time t TH for each elastic wave detected by the sensor 10 The integrated value of the values related to the reciprocal is acquired as the reliability, and the acquired reliability is used to generate an error map.
- the error in the area in the error map corresponding to the area on the path from the elastic wave source to the poorly bonded sensor 10 becomes large.
- the user of the system can investigate in consideration of problems such as poor adhesion of the sensor 10. In this way, the evaluation accuracy of the deteriorated state of the structure can be improved.
- the system user can estimate that the evaluation result is unreliable in the area where the estimation error is large by looking at the error map due to some factor. Therefore, in a region where the estimation error is large, it is possible to artificially generate an elastic wave or the like and prompt the user to measure again. Therefore, it becomes easy to find a factor that lowers the evaluation accuracy of the structure. This makes it possible to respond according to the factors.
- FIG. 8 is a schematic block diagram showing the functions of the evaluation unit 31a in the second embodiment.
- the evaluation unit 31a includes an acquisition unit 311, a memory 312, an event extraction unit 313, a position / velocity determination unit 314, an error map generation unit 315, and a velocity field map generation unit 316.
- the velocity field map generation unit 316 contains reliability information and time information included in the transmission data in one event output from the event extraction unit 313, and the position or position and elasticity of the elastic wave source defined by the position velocity determination unit 314. Generate a velocity field map (second map) based on the velocity of the wave.
- the velocity field map represents a distribution map in which the evaluation region is divided into a plurality of compartments, and values indicating the propagation velocities of elastic waves generated in the structure are assigned to each compartment. That is, the velocity field map is a distribution map showing the propagation velocity of elastic waves in the evaluation region. Further, the velocity field map generation unit 316 determines the velocity of the elastic wave in the structure evaluation device 30 when the position velocity determination unit 314 determines only the position of the elastic wave source.
- the velocity field map generation unit 316 may determine the velocity of the elastic wave when the information regarding the velocity of the elastic wave cannot be obtained from the position velocity setting unit 314.
- a method using a Kalman filter as in Eq. (3) or various regularized least squares methods such as the least squares method can be used.
- FIG. 9 is a diagram showing a specific example of the velocity field map in the present embodiment.
- the velocity field map 60 shown in FIG. 9 is generated using the information obtained under the same environment as the error map 50 shown in FIG.
- FIG. 9 shows a contour map of the velocity field map 60 when 25 impacts are applied to the concrete floor plate to generate elastic waves.
- the speed around the sensor 10 where the improper installation occurs slows down. This is because the sensor 10-1 and the sensor 10-2 have a problem of poor adhesion.
- the velocity field map 60 the region where the velocity is slow is slightly shifted upward from the damaged region 41 shown in FIG. 4, because the arrival time of the elastic wave is estimated to be late due to poor adhesion of the sensor 10-1, and the velocity is slow. It is believed that the area was dragged up by it.
- the error map 50 the error is large across the sensors 10-1 and the sensors 10-2. This means that there was a decrease in SN due to poor adhesion between the sensor 10-1 and the sensor 10-2.
- FIG. 10 is a sequence diagram showing a flow of evaluation processing of a deteriorated state by the structure evaluation system 100 in the second embodiment.
- the event extraction unit 313 extracts the transmission data in one event from the transmission data stored in the memory 312 (step S201).
- the event extraction unit 313 outputs the extracted transmission data to the position / velocity orientation unit 314 and the error map generation unit 315.
- the position / velocity setting unit 314 determines the position or position of the elastic wave source generated in one event and the velocity of the elastic wave based on the extracted data transmitted in one event (step S202).
- the position / velocity setting unit 314 outputs the position information of the evaluated elastic wave source to the error map generation unit 315. Further, the position / velocity setting unit 314 outputs the position information and the velocity information of the elastic wave to the velocity field map generation unit 316.
- the velocity field map generation unit 316 is based on the reliability information and time information included in the transmission data in one event output from the event extraction unit 313, and the position information or position information of the elastic wave source and the velocity information of the elastic wave. To generate a velocity field map (step S203). As a result, the structure evaluation device 30 evaluates the deteriorated state of the structure.
- the structure evaluation device 30 generates not only the error map 50 but also the velocity field map 60. Therefore, the user of the system not only determines how accurate the estimation result is by comparing the error map 50 and the speed field map 60, but also detects anomalies such as poor adhesion of the sensor 10. It can be found with high accuracy.
- FIG. 11 is a schematic block diagram showing the functions of the signal processing unit 20b according to the third embodiment.
- the signal processing unit 20b includes a waveform shaping filter 201, a gate generation circuit 202, an arrival time determination unit 203, a reliability calculation unit 204b, a feature amount extraction unit 205, a transmission data generation unit 206, a memory 207, an output unit 208, and a correction unit 209. To be equipped.
- the correction unit 209 corrects the arrival time of the sensor 10 which may have an abnormality based on the elastic wave detected by each sensor 10. Specifically, first, the correction unit 209 acquires a noise-removing elastic wave signal based on the elastic wave detected by one sensor 10 for a predetermined period of time. As a result, the correction unit 209 acquires a plurality of noise-removing elastic wave signals based on the elastic waves detected by one sensor 10. Next, the correction unit 209 acquires the first elastic wave arrival time t M and the second elastic wave arrival time t TH of each of the acquired noise-removing elastic wave signals from the arrival time determination unit 203. The correction unit 209 calculates the time difference based on the acquired first elastic wave arrival time t M and the second elastic wave arrival time t TH . The correction unit 209 calculates the average and variance of the plurality of calculated time differences. The correction unit 209 executes the above process for each sensor 10.
- the correction unit 209 determines that the sensor 10 whose average or variance value is equal to or greater than the threshold value is the sensor 10 which may have an abnormality.
- the abnormality of the sensor 10 is a poor adhesion or a failure.
- the correction unit 209 lowers the threshold value for determining the first elastic wave arrival time t M , so that the arrival time of the sensor 10 that may have an abnormality may occur.
- the first elastic wave reaches the sensor 10-1 and the sensor 10-2. Lower the threshold for determining time t M.
- FIG. 12A represents the waveform of the elastic wave detected by the sensor 10-1
- FIG. 12B represents the waveform of the elastic wave detected by the sensor 10-2.
- the vertical axis represents the amplitude of elastic waves and the horizontal axis represents time.
- the vertical axis represents the CF score and the horizontal axis represents time.
- the time of t CF1 in FIGS. 12A and 12B is the first elastic wave arrival time t M obtained by the arrival time determination unit 203 by the method of ChangeFinder.
- the time of t TH in FIGS. 12A and 12B is the second elastic wave arrival time t TH .
- the time of t CF0 in FIGS. 12A and 12B is the corrected first elastic wave arrival time t M.
- the first elastic wave arrival time t M detected by the sensor 10 in which an abnormality may have occurred is detected earlier than before the correction. Recognize.
- the correction unit 209 calculates the average and variance of the time difference of the entire sensor 10. After that, the correction unit 209 normalizes the average and variance of each sensor 10 based on the average and variance of the time difference of the entire sensor 10.
- standardization means that the average and variance of each sensor 10 are brought close to the average and variance of the time difference of the entire sensor 10. Thereby, the deviation of the detection sensitivity for each sensor 10 is adjusted.
- the correction unit 209 outputs the average and dispersion values of the time difference for each sensor 10 after standardization to the reliability calculation unit 204b.
- the reliability calculation unit 204b outputs the obtained dispersion value to the transmission data generation unit 206 as the reliability for each sensor 10.
- FIG. 13A is a diagram showing a specific example of the error map 50
- FIG. 13B is a diagram showing a specific example of the velocity field map 60
- FIG. 13C is a diagram of the velocity field map 60a generated based on the corrected arrival time. It is a figure which shows a specific example. As shown in FIG. 13C, it can be seen that the result is changed as compared with the velocity field map 60 shown in FIG. 13B due to the correction of the arrival time. For example, it can be seen that in FIG. 13C, the region where deterioration occurs inside the structure (damaged region 41) is shown more clearly than in FIG. 13B.
- the correction unit 209 is the first elastic wave of the elastic wave detected by the sensor 10 in which an abnormality may occur.
- the arrival time t M is corrected.
- the first elastic wave arrival time t M of the elastic wave detected by the sensor 10 that may have an abnormality is determined by the arrival time determination unit 203. Correct so that it is before the arrival time t M.
- the elastic wave is not detected at the time when it should have been detected due to an abnormality such as poor adhesion, it is possible to approach the original detection time. Therefore, it is possible to suppress a decrease in the evaluation accuracy of the deteriorated state of the structure.
- FIG. 14 is a schematic block diagram showing the function of the evaluation unit 31c in the fourth embodiment.
- the evaluation unit 31c includes an acquisition unit 311, a memory 312, an event extraction unit 313, a position / velocity setting unit 314, an error map generation unit 315, and a measurement result evaluation unit 317.
- the measurement result evaluation unit 317 evaluates that there is a possibility that an abnormality has occurred in the damaged area or the sensor 10 in the evaluation area based on the reliability. Specifically, the measurement result evaluation unit 317 refers to the error map generated by the error map generation unit 315, and sets a region where the value indicated by the reliability is equal to or less than the threshold value due to a damaged region or an abnormality of the sensor 10. It is judged that the evaluation result is deteriorated.
- the abnormality of the sensor 10 is a poor adhesion or a failure.
- the measurement result evaluation unit 317 displays the determination result on the display unit 32. Specifically, the measurement result evaluation unit 317 displays a display indicating that the region where the value indicated by the reliability is equal to or less than the threshold value is a damaged region or a region where the evaluation result is deteriorated due to an abnormality of the sensor 10. It is displayed on the display unit 32. For example, the measurement result evaluation unit 317 causes the display unit 32 to display the determination result by displaying a pop-up or a balloon.
- the evaluation unit 31c is a damaged area based on the reliability, or an area where the evaluation result is deteriorated due to an abnormality of the sensor 10. To judge. Then, the evaluation unit 31c causes the display unit 32 to display the determination result. As a result, the evaluation result can be provided to the user of the system. The user of the system can correct the poor adhesion of the sensor 10 and grasp the damaged area by referring to the provided evaluation result.
- the evaluation unit 31c may be configured to include the velocity field map generation unit 316 shown in the second embodiment.
- the measurement result evaluation unit 317 evaluates that there is a possibility that an abnormality has occurred in the damaged area or the sensor 10 based on the error map and the speed field map. It is composed. Specifically, the measurement result evaluation unit 317 sets the region where the value indicated by the reliability in the error map is below the threshold value and the region where the velocity value is below the threshold value in the velocity field map is the damaged region or the sensor 10. It is judged that the evaluation result is deteriorated due to the abnormality of.
- the evaluation unit 31c more accurately determines the damaged area or the area where the evaluation result is deteriorated due to the abnormality of the sensor 10 by performing the evaluation using two maps, the error map and the speed field map. can do.
- FIG. 15 is a diagram showing a system configuration of the structure evaluation system 100d according to the fifth embodiment.
- the structure evaluation system 100d includes a plurality of sensors 10-1 to 10-n, a plurality of amplifiers 11-1 to 11-n, a plurality of A / D converters 12-1 to 12-n, a signal processing unit 20, and a radio. It includes a transmission unit 21 and a structure evaluation device 30d.
- the structure evaluation device 30d includes an evaluation unit 31, a display unit 32, and a wireless reception unit 33.
- the signal processing unit 20 and the structure evaluation device 30d are connected by wireless communication.
- the wireless transmission unit 21 transmits the transmission data output from the signal processing unit 20 to the structure evaluation device 30d.
- the wireless reception unit 33 receives the transmission data transmitted from the wireless transmission unit 21 and outputs the received transmission data to the evaluation unit 31.
- a so-called ISM band Industry Science Medical Band
- 2.4 GHz or 920 MHz band 915 MHz to 928 MHz in Japan
- the senor 10, amplifier 11, A / D converter 12, signal processing unit 20, and wireless transmission unit 21 are installed as sensor nodes on a structure such as a bridge to be evaluated, and have a structure.
- the object evaluation device 30d can be installed in the monitoring room, and the deterioration state of the structure can be monitored from a remote location.
- the structure evaluation system 100d may be configured to include a signal processing unit 20b instead of the signal processing unit 20.
- the structure evaluation system 100d may be configured to include either the evaluation unit 31a or the evaluation unit 31c instead of the evaluation unit 31.
- the structure evaluation system 100d may be modified in the same manner as in the fourth embodiment.
- FIG. 16 is a diagram showing a system configuration of the structure evaluation system 100e according to the sixth embodiment.
- the structure evaluation system 100e includes a plurality of sensors 10-1 to 10-n, a plurality of amplifiers 11-1 to 11-n, a plurality of A / D converters 12-1 to 12-n, a signal processing unit 20, and a radio. It includes a transmission unit 21, a selection unit 22, and a structure evaluation device 30d.
- the selection unit 22 selects transmission data to be used for evaluation according to the feature amount information. Specifically, the selection unit 22 outputs only transmission data whose amplitude in the feature amount of the signal is equal to or greater than a predetermined threshold value to the wireless transmission unit 21.
- a wired connection may be made between the selection unit 22 and the structure evaluation device 30d.
- the selection unit 22 outputs the selected transmission data to the structure evaluation device 30d by wired communication.
- the structure evaluation system 100e does not have to include the wireless transmission unit 21 and the wireless reception unit 33.
- the structure evaluation system 100e may include a signal processing unit 20b instead of the signal processing unit 20.
- the structure evaluation system 100e may be configured to include either the evaluation unit 31a or the evaluation unit 31c instead of the evaluation unit 31.
- the structure evaluation system 100e may be modified in the same manner as in the fourth embodiment.
- the sensor 10 may include an amplifier 11.
- the structure evaluation system 100 does not have to include the amplifier 11.
- the error map generation unit 315 and the velocity field map generation unit 316 may be realized by one map generation unit.
- Each functional unit included in the structure evaluation device 30 may be partially or completely provided in another housing.
- the structure evaluation device 30 may include only the evaluation unit 31, and the position orientation unit 401 and the display unit 32 may be provided in another housing.
- the evaluation unit 31 acquires the elastic wave source distribution from another housing and evaluates the soundness of the structure using the acquired elastic wave source distribution. Then, the evaluation unit 31 outputs the evaluation result to the display unit 32 provided in another housing.
- the manufacturing cost of the structure evaluation device 30 can be suppressed by using the existing device for deriving the elastic wave source distribution.
- the signal processing unit 20 may be configured to perform signal processing on the input AE source signal having an amplitude value higher than the first threshold value set higher than the noise level. Specifically, first, when a vibration larger than the first threshold value is detected, the signal processing unit 20 determines that the signal for a predetermined time from the time when the first threshold value is exceeded is an elastic wave waveform. , Stores an AE source signal with an amplitude value higher than the first threshold. Then, the signal processing unit 20 extracts the AE feature amount including the information about the elastic wave based on the data of the elastic wave waveform indicated by the stored AE source signal. The first threshold value is set in advance.
- the signal processing units 20 and 20b may be provided in the structure evaluation devices 30 and 30d. When configured in this way, the signal processing units 20 and 20b acquire the AE source signal processed by the sensor 10 directly from the sensor 10 or via a relay device (not shown). In FIGS. 1, 15 and 16, one signal processing unit 20 is connected to a plurality of sensors 10-1 to 10-n, but the structure evaluation systems 100, 100d and 100e process a plurality of signals.
- a unit 20 may be provided, and a signal processing unit 20 may be connected to each sensor 10 to include a plurality of sensor units.
- the error map generation unit 315 is configured to update the error map by using the error map of the same evaluation area generated up to the previous time and the newly generated error map. May be good. Further, the speed field map generation unit 316 updates the speed field map using the newly generated speed field map and the speed field map up to the previous time in the speed field map as well as the error map. When configured in this way, the velocity field map generation unit 316, for example, calculates the average value of the elastic wave propagation velocity v in the divided region of the conventional velocity field map including the newly generated velocity field map for each divided section. The speed field map is updated by assigning the calculated value to each division section as an update value.
- an arrival time determination unit that determines the arrival time of elastic waves by using a plurality of sensors 10 that detect elastic waves and elastic waves detected by each of the plurality of sensors 10.
- a reliability calculation unit 204 that calculates the reliability of the measured waveform of the elastic wave based on the arrival time
- an error map generation that generates an error map of the arrival time of the elastic wave based on the calculated reliability.
Landscapes
- Physics & Mathematics (AREA)
- General Physics & Mathematics (AREA)
- Engineering & Computer Science (AREA)
- Immunology (AREA)
- Pathology (AREA)
- Chemical & Material Sciences (AREA)
- Analytical Chemistry (AREA)
- Biochemistry (AREA)
- General Health & Medical Sciences (AREA)
- Health & Medical Sciences (AREA)
- Life Sciences & Earth Sciences (AREA)
- Aviation & Aerospace Engineering (AREA)
- Signal Processing (AREA)
- Acoustics & Sound (AREA)
- Algebra (AREA)
- Mathematical Analysis (AREA)
- Mathematical Optimization (AREA)
- Mathematical Physics (AREA)
- Pure & Applied Mathematics (AREA)
- Investigating Or Analyzing Materials By The Use Of Ultrasonic Waves (AREA)
Abstract
実施形態の構造物評価システムは、複数のセンサと、到達時刻決定部と、信頼度算出部と、マップ生成部とを持つ。複数のセンサは、弾性波を検出する。到達時刻決定部は、前記複数のセンサそれぞれによって検出された弾性波を用いて、前記弾性波の到達時刻を決定する。信頼度算出部は、前記到達時刻に基づいて、前記弾性波の測定波形に関する信頼度を算出する。マップ生成部は、算出された前記信頼度又は前記信頼度と距離に基づいて第1のマップを生成する。
Description
本発明の実施形態は、構造物評価システム、構造物評価装置及び構造物評価方法に関する。
近年、高度経済成長期に建設された橋梁等の構造物の老朽化に伴う問題が顕在化してきている。万が一にも構造物に事故が生じた場合の損害は計り知れないため、従来から構造物の状態を監視するための技術が提案されている。例えば、内部亀裂の発生、又は、内部亀裂の進展に伴い発生する弾性波を、高感度センサにより検出するAE(Acoustic Emission:アコースティック・エミッション)方式により、構造物の損傷を検出する技術が提案されている。AEは、材料の疲労亀裂の進展に伴い発生する弾性波である。AE方式では、圧電素子を利用したAEセンサにより弾性波をAE信号(電圧信号)として検出する。AE信号は、材料の破断が生じる前の兆候として検出される。したがって、AE信号の発生頻度及び信号強度は、材料の健全性を表す指標として有用である。そのため、AE方式によって構造物の劣化の予兆を検出する技術の研究が行われている。
ところで、AE信号を利用した構造物の評価方法の一つとして、トモグラフィ法が知られている。トモグラフィとは、複数のセンサ間で検出された信号の到達時間差を利用して、計測領域における内部速度場構造を推定する逆解析手法の一つである。トモグラフィは、速度場の変化として、構造物内部の損傷部分を検出する非破壊検査法として利用することができる。特に、その信号源として材料内部から発生するAE信号を用いる方式はAEトモグラフィとして知られている。しかしながら、実環境におけるAEトモグラフィで得られる結果には、測定誤差に基づく推定誤差が含まれるため必ずしも正確ではない。そのため、AEトモグラフィで得られる結果に基づく構造物の劣化状態の評価精度が低い場合があった。
本発明が解決しようとする課題は、構造物の劣化状態の評価精度を向上させることができる構造物評価システム、構造物評価装置及び構造物評価方法を提供することである。
実施形態の構造物評価システムは、複数のセンサと、到達時刻決定部と、信頼度算出部と、マップ生成部とを持つ。複数のセンサは、弾性波を検出する。到達時刻決定部は、前記複数のセンサそれぞれによって検出された弾性波を用いて、前記弾性波の到達時刻を決定する。信頼度算出部は、前記到達時刻に基づいて、前記弾性波の測定波形に関する信頼度を算出する。マップ生成部は、算出された前記信頼度又は前記信頼度と距離に基づいて第1のマップを生成する。
以下、実施形態の構造物評価システム、構造物評価装置及び構造物評価方法を、図面を参照して説明する。
(第1の実施形態)
図1は、第1の実施形態における構造物評価システム100の構成を示す図である。
構造物評価システム100は、構造物の健全性の評価に用いられる。以下の説明において、評価とは、ある基準に基づいて構造物の健全性の度合い、すなわち構造物の劣化状態を決定することを意味する。なお、以下の説明では、構造物の一例としてコンクリートで構成された橋梁を例に説明するが、構造物は橋梁に限定される必要はない。構造物は、亀裂の発生または進展、あるいは外的衝撃(例えば雨、人工雨など)に伴い弾性波が発生する構造物であればどのようなものであってもよい。例えば、構造物は、岩盤であってもよい。なお、橋梁は、河川や渓谷等の上に架設される構造物に限らず、地面よりも上方に設けられる種々の構造物(例えば高速道路の高架橋)なども含む。
また、構造物の劣化状態の評価に影響を及ぼす損傷としては、例えば亀裂、空洞、土砂化等の弾性波の伝搬を妨害する構造物内部の損傷がある。ここで、亀裂には、縦方向の亀裂、横方向の亀裂及び斜め方向の亀裂等が含まれる。縦方向の亀裂とは、センサが設置されている構造物の面に垂直な方向に生じている亀裂である。横方向の亀裂とは、センサが設置されている構造物の面に水平な方向に生じている亀裂である。斜め方向の亀裂とは、センサが設置されている構造物の面に水平及び垂直以外の方向に生じている亀裂である。土砂化とは、主にアスファルトとコンクリート床版の境界部でコンクリートが土砂状に変化する劣化である。
以下、構造物評価システム100の具体的な構成について説明する。
以下、構造物評価システム100の具体的な構成について説明する。
構造物評価システム100は、複数のセンサ10-1~10-n(nは3以上の整数)、複数の増幅器11-1~11-n、複数のA/D変換器12-1~12-n、信号処理部20及び構造物評価装置30を備える。信号処理部20と構造物評価装置30とは、有線により通信可能に接続される。なお、以下の説明では、センサ10-1~10-nを区別しない場合にはセンサ10と記載する。以下の説明では、増幅器11-1~11-を区別しない場合には増幅器11と記載と記載する。以下の説明では、A/D変換器12-1~12-nを区別しない場合にはA/D変換器12と記載する。
センサ10は、構造物に設置される。例えば、センサ10は、橋梁のコンクリート床版に設置される。センサ10は、圧電素子を有し、構造物内部から発生する弾性波を検出する。センサ10は、弾性波を検出することが可能な位置に設置される。例えば、センサ10は、構造物の表面、側面及び底面のいずれかの面上に設置される。センサ10は、検出した弾性波を電圧信号であるAE源信号に変換する。センサ10は、AE源信号を増幅器11に出力する。
センサ10には、例えば10kHz~1MHzの範囲に感度を有する圧電素子が用いられる。センサ10は、周波数範囲内に共振ピークをもつ共振型、共振を抑えた広帯域型等の種類があるが、センサ10の種類はいずれでもよい。また、センサ10が弾性波を検出する方法は、電圧出力型、抵抗変化型及び静電容量型等があるが、いずれの検出方法でもよい。なお、センサ10に代えて加速度センサが用いられてもよい。この場合、加速度センサは、構造物内部から発生する弾性波を検出する。そして、加速度センサは、センサ10と同様の処理を行うことによって、検出した弾性波を電圧信号であるAE源信号に変換する。その後、加速度センサは、変換後のAE源信号を増幅器11に出力する。構造物の厚さは、例えば15cm以上である。
増幅器11は、センサ10から出力されたAE源信号を増幅し、増幅後のAE源信号をA/D変換器12に出力する。
A/D変換器12は、増幅されたAE源信号を受けとると、AE源信号を量子化してデジタル信号に変換する。A/D変換器12は、AE源信号をデジタルの時系列データとして信号処理部20に出力する。
信号処理部20は、A/D変換器12から出力された時系列データを入力とする。信号処理部20は、入力した時系列データのデジタル信号に対して、信号処理を行う。信号処理部20が行う信号処理は、例えば、ノイズ除去、パラメータ抽出等である。信号処理部20は、信号処理後のデジタル信号を含む送信データを生成し、生成した送信データを構造物評価装置30に出力する。
A/D変換器12は、増幅されたAE源信号を受けとると、AE源信号を量子化してデジタル信号に変換する。A/D変換器12は、AE源信号をデジタルの時系列データとして信号処理部20に出力する。
信号処理部20は、A/D変換器12から出力された時系列データを入力とする。信号処理部20は、入力した時系列データのデジタル信号に対して、信号処理を行う。信号処理部20が行う信号処理は、例えば、ノイズ除去、パラメータ抽出等である。信号処理部20は、信号処理後のデジタル信号を含む送信データを生成し、生成した送信データを構造物評価装置30に出力する。
構造物評価装置30は、バスで接続されたCPU(Central Processing Unit)やメモリや補助記憶装置などを備え、評価プログラムを実行する。評価プログラムの実行によって、構造物評価装置30は、評価部31、表示部32を備える装置として機能する。なお、構造物評価装置30の各機能の全て又は一部は、ASIC(Application Specific Integrated Circuit)やPLD(Programmable Logic Device)やFPGA(Field Programmable Gate Array)等のハードウェアを用いて実現されてもよい。また、評価プログラムは、コンピュータ読み取り可能な記録媒体に記録されてもよい。コンピュータ読み取り可能な記録媒体とは、例えばフレキシブルディスク、光磁気ディスク、ROM、CD-ROM等の可搬媒体、コンピュータシステムに内蔵されるハードディスク等の記憶装置である。また、評価プログラムは、電気通信回線を介して送受信されてもよい。
評価部31は、信号処理部20から出力された送信データを入力とする。評価部31は、入力した送信データに基づいて構造物の健全性を評価する。
表示部32は、液晶ディスプレイ、有機EL(Electro Luminescence)ディスプレイ等の画像表示装置である。表示部32は、評価部31の制御に従って評価結果を表示する。表示部32は、画像表示装置を構造物評価装置30に接続するためのインタフェースであってもよい。この場合、表示部32は、評価結果を表示するための映像信号を生成し、自身に接続されている画像表示装置に映像信号を出力する。
表示部32は、液晶ディスプレイ、有機EL(Electro Luminescence)ディスプレイ等の画像表示装置である。表示部32は、評価部31の制御に従って評価結果を表示する。表示部32は、画像表示装置を構造物評価装置30に接続するためのインタフェースであってもよい。この場合、表示部32は、評価結果を表示するための映像信号を生成し、自身に接続されている画像表示装置に映像信号を出力する。
図2は、第1の実施形態における信号処理部20の機能を表す概略ブロック図である。信号処理部20は、波形整形フィルタ201、ゲート生成回路202、到達時刻決定部203、信頼度算出部204、特徴量抽出部205、送信データ生成部206、メモリ207及び出力部208を備える。
波形整形フィルタ201は、入力された時系列データのデジタル信号から所定の信号帯域外のノイズ成分を除去する。波形整形フィルタ201は、例えばデジタルバンドパスフィルタ(BPF)である。波形整形フィルタ201は、ノイズ成分除去後の信号(以下「ノイズ除去弾性波信号」という。)をゲート生成回路202、到達時刻決定部203、信頼度算出部204及び特徴量抽出部205に出力する。
波形整形フィルタ201は、入力された時系列データのデジタル信号から所定の信号帯域外のノイズ成分を除去する。波形整形フィルタ201は、例えばデジタルバンドパスフィルタ(BPF)である。波形整形フィルタ201は、ノイズ成分除去後の信号(以下「ノイズ除去弾性波信号」という。)をゲート生成回路202、到達時刻決定部203、信頼度算出部204及び特徴量抽出部205に出力する。
ゲート生成回路202は、波形整形フィルタ201から出力されたノイズ除去弾性波信号を入力とする。ゲート生成回路202は、入力したノイズ除去弾性波信号の波形が持続しているか否かを示すゲート信号を生成する。ゲート生成回路202は、例えばエンベロープ検出器及びコンパレータにより実現される。エンベロープ検出器は、ノイズ除去弾性波信号のエンベロープを検出する。エンベロープは、例えば、ノイズ除去弾性波信号を二乗し、二乗した出力値に対して所定の処理(例えばローパスフィルタを用いた処理やヒルベルト変換)を行うことで抽出される。コンパレータは、ノイズ除去弾性波信号のエンベロープが所定の閾値以上であるか否かを判定する。
ゲート生成回路202は、ノイズ除去弾性波信号のエンベロープが所定の閾値以上となった場合、ノイズ除去弾性波信号の波形が持続していることを示す第1のゲート信号を到達時刻決定部203、信頼度算出部204及び特徴量抽出部205に出力する。一方、ゲート生成回路202は、ノイズ除去弾性波信号のエンベロープが所定の閾値未満になった場合、ノイズ除去弾性波信号の波形が持続していないことを示す第2のゲート信号を到達時刻決定部203、信頼度算出部204及び特徴量抽出部205に出力する。
到達時刻決定部203は、波形整形フィルタ201から出力されたノイズ除去弾性波信号と、ゲート生成回路202から出力されたゲート信号とを入力とする。到達時刻決定部203は、第1のゲート信号が入力されている間に入力されたノイズ除去弾性波信号を用いて、第1の弾性波到達時刻tM及び第2の弾性波到達時刻tTHを決定する。第1の弾性波到達時刻tM及び第2の弾性波到達時刻tTHは、機械学習により求められる弾性波の到達時刻、ノイズ除去弾性波信号の振幅が所定の閾値を超えた時刻、あるいは、これらの情報を組み合わせた所定の基準を満たした時刻のいずれかの時刻である。
機械学習により求められる弾性波の到達時刻は、機械学習によりセンサ10に弾性波が受信されたと判定された時刻である。機械学習により第1の弾性波到達時刻tMを求める方法としては、例えばAIC(Akaike‘s Information Criterion)、ChangeFinder、深層学習による変化点検出アルゴリズム等の手法を用いることができる。以下の説明では、第1の弾性波到達時刻tMを求める手法として、ChangeFinderを用い、第2の弾性波到達時刻tTHを求める手法として、ノイズ除去弾性波信号の振幅が所定の閾値を超えた時刻を用いた場合について説明する。到達時刻決定部203は、決定した第1の弾性波到達時刻tM及び第2の弾性波到達時刻tTHを時刻情報として信頼度算出部204及び送信データ生成部206に出力する。
信頼度算出部204は、ノイズ除去弾性波信号と、ゲート信号と、時刻情報とを入力とする。信頼度算出部204は、第1のゲート信号が入力されている間に得られた時刻情報に基づいて、弾性波の測定波形に関する信頼度を算出する。信頼度は、第1の弾性波到達時刻tMと第2の弾性波到達時刻tTHとの差Δt=|tM-tTH|の逆数に関する値である。信頼度算出部204は、算出した信頼度の情報を送信データ生成部206に出力する。
特徴量抽出部205は、波形整形フィルタ201から出力されたノイズ除去弾性波信号と、ゲート生成回路202から出力されたゲート信号とを入力とする。特徴量抽出部205は、第1のゲート信号が入力されている間に入力されたノイズ除去弾性波信号を用いて、ノイズ除去弾性波信号の特徴量を抽出する。特徴量は、ノイズ除去弾性波信号の特徴を示す情報である。
特徴量は、例えばノイズ除去弾性波信号の波形の振幅[mV]、ゲート信号の立ち上がり時間[usec]、ゲート信号の持続時間[usec]、ノイズ除去弾性波信号のゼロクロスカウント数[times]、ノイズ除去弾性波信号の波形のエネルギー[arb.]及びノイズ除去弾性波信号の周波数[Hz]等である。特徴量抽出部205は、抽出した特徴量に関するパラメータを送信データ生成部206に出力する。特徴量抽出部205は、特徴量に関するパラメータを出力する際に、特徴量に関するパラメータにセンサIDを対応付ける。センサIDは、構造物の健全性の評価対象となる領域(以下「評価領域」という。)に設置されているセンサ10を識別するための識別情報を表す。
ノイズ除去弾性波信号の振幅は、例えばノイズ除去弾性波信号の中で最大振幅の値である。ゲート信号の立ち上がり時間は、例えばゲート信号がゼロ値から予め設定される所定値を超えて立ち上がるまでの時間T1である。ゲート信号の持続時間は、例えばゲート信号の立ち上がり開始から振幅が予め設定される値よりも小さくなるまでの時間である。ノイズ除去弾性波信号のゼロクロスカウント数は、例えばゼロ値を通る基準線をノイズ除去弾性波信号が横切る回数である。ノイズ除去弾性波信号の波形のエネルギーは、例えば各時点において振幅を二乗したものを時間積分した値である。なお、エネルギーの定義は、上記例に限定されず、例えば波形の包絡線を用いて近似されたものでもよい。ノイズ除去弾性波信号の周波数は、ノイズ除去弾性波信号の周波数である。
送信データ生成部206は、時刻情報と、信頼度の情報と、特徴量に関するパラメータとを入力とする。送信データ生成部206は、入力した時刻情報と、信頼度の情報と、特徴量に関するパラメータとを対応付けることによって送信データを生成する。
メモリ207は、送信データを記憶する。メモリ207は、例えばデュアルポートRAM(Random Access Memory)である。
出力部208は、メモリ207に記憶されている送信データを構造物評価装置30に逐次出力する。
メモリ207は、送信データを記憶する。メモリ207は、例えばデュアルポートRAM(Random Access Memory)である。
出力部208は、メモリ207に記憶されている送信データを構造物評価装置30に逐次出力する。
図3は、第1の実施形態における評価部31の機能を表す概略ブロック図である。図3に示すように、評価部31は、取得部311、メモリ312、イベント抽出部313、位置速度標定部314及び誤差マップ生成部315を備える。
取得部311は、信号処理部20から出力された送信データを取得する。取得部311は、取得した送信データをメモリ312に記憶する。
メモリ312は、取得部311によって取得された送信データを記憶する。メモリ312は、磁気ハードディスク装置や半導体記憶装置などの記憶装置を用いて構成される。
取得部311は、信号処理部20から出力された送信データを取得する。取得部311は、取得した送信データをメモリ312に記憶する。
メモリ312は、取得部311によって取得された送信データを記憶する。メモリ312は、磁気ハードディスク装置や半導体記憶装置などの記憶装置を用いて構成される。
イベント抽出部313は、メモリ312に記憶されている送信データの中から1イベントにおける送信データを抽出する。イベントとは、構造物で起こったある弾性波発生事象を表す。構造物におけるクラックの発生などに伴い、1回のイベントが発生した場合、複数のセンサ10で略同時刻に弾性波が検出されることになる。すなわち、メモリ312には、略同時刻に検出された弾性波に関する送信データが記憶されている。そこで、イベント抽出部313は、所定の時間窓を設け、到達時刻がその時間窓の範囲内に存在する全ての送信データを1イベントにおける送信データとして抽出する。イベント抽出部313は、抽出した1イベントにおける送信データを位置速度標定部314及び誤差マップ生成部315に出力する。
時間窓の範囲Twは、対象とする構造物の弾性波伝播速度vと、最大のセンサ間隔dmaxを用いて、Tw≧dmax/vの範囲になるように決定してもよい。誤検出を避けるためには、Twをできるだけ小さい値に設定することが望ましいため、実質的にはTw=dmax/vとすることができる。
位置速度標定部314は、イベント抽出部313によって抽出された複数の送信データに基づいて、弾性波の発生源(以下「弾性波源」という。)の位置及び構造物の弾性波伝搬速度を標定する。
位置速度標定部314は、イベント抽出部313によって抽出された複数の送信データに基づいて、弾性波の発生源(以下「弾性波源」という。)の位置及び構造物の弾性波伝搬速度を標定する。
なお、位置速度標定部314は、構造物に対して設置されたセンサ10の設置位置に関する情報(以下「センサ位置情報」という。)をセンサIDに対応付けて予め保持する。センサ位置情報は、例えば緯度および経度、あるいは構造物の基準となる位置からの水平方向および垂直方向の距離などである。弾性波源の位置及び構造物の弾性波伝搬速度の標定には、カルマンフィルタ、最小二乗法などが用いられてもよい。位置速度標定部314は、標定した弾性波源の位置情報を誤差マップ生成部315に出力する。
誤差マップ生成部315は、イベント抽出部313から出力された複数のイベントにおける送信データに含まれる信頼度の情報及び時刻情報と、評定された弾性波源の位置とに基づいて誤差マップ(第1のマップ)を生成する。誤差マップは、評価領域が複数の区画に分割され、各区画に対して弾性波の到達時刻の時刻差の逆数に関する値の積算値が割り当てられた分布図を表す。すなわち、誤差マップは、評価領域において弾性波の到達時刻の時刻差(誤差)の大きさの度合いが示された分布図である。なお、誤差マップにおいて、各区画の弾性波の通過頻度に差がある場合、通過頻度が高い区画は信頼度の積算値が大きく、通過頻度の低い区画は信頼度の積算値が小さくなる。誤差マップの生成には、カルマンフィルタや最小二乗法等の各種正則化最小二乗法を用いることができる。誤差マップにより、評価領域のどの領域において弾性波の到達時刻の時刻差の度合いが大きいのか、また各区画における弾性波の通過頻度の多さを把握することが可能になる。弾性波の到達時刻の時刻差の度合いが大きいほど、センサ10の接着不良等の障害が生じている可能性が高い。
次に、図4から図6を用いて、本実施形態における構造物評価システム100の処理について説明する。図4は、シミュレーション用に用意したコンクリート床板の構造物モデルを示す図である。図4に示すコンクリート床板は、一辺が800mmの正方形である。コンクリート床板の四隅にはセンサ10-1~10-4が設置され、コンクリート床板の中央にはセンサ10-5が設置されている。また、図4において領域41は損傷が生じている領域(以下「損傷領域」という。)を表す。また、シミュレーションの例として、25点の衝撃をコンクリート床板に加え弾性波を発生させた。
図4における点42で示す位置でコンクリート床板に衝撃を加えた場合に、各センサ10-1~10-5で検出された弾性波の波形を図5A~図5Eに示す。図5Aはセンサ10-1で検出した弾性波の波形を表し、図5Bはセンサ10-2で検出した弾性波の波形を表し、図5Cはセンサ10-3で検出した弾性波の波形を表し、図5Dはセンサ10-4で検出した弾性波の波形を表し、図5Eはセンサ10-5で検出した弾性波の波形を表す。図5A~図5Eの上図において、縦軸は弾性波の振幅を表し、横軸は時間を表す。また、図5A~図5Eの下図において、縦軸はCF(Change finder)のスコアを表し、横軸は時間を表す。図5A~図5EにおけるtCF1の時刻は、到達時刻決定部203がChangeFinderの手法により求めた第1の弾性波到達時刻tMである。すなわち、時刻tCF1は、CFのスコアがある閾値を超えた時刻である。図5A~図5EにおけるtTHの時刻は、第2の弾性波到達時刻tTHである。
図5A及び図5Bにおいて、第1の弾性波到達時刻tMと第2の弾性波到達時刻tTHとの誤差が大きいことがわかる。これは、測定波形の振幅が小さく(SN(Signal-to-Noise)が悪く)、弾性波の振幅が閾値を超える時刻が遅く検出されたことが原因と考えられる。センサ10-1及びセンサ10-2を後で調べると、接着不良の問題があったことがわかった。
図6は、本実施形態における誤差マップの具体例を示す図である。
図6では、上記のシミュレーションにおいて25点の衝撃をコンクリート床板に加えて弾性波を発生させた際の誤差マップ50をコンター図で示している。図6に示すように、誤差マップ50の左側の領域では、誤差が大きくなっている。これは、センサ10-1及びセンサ10-2に接着不良があったことが原因であると考えられる。
図6では、上記のシミュレーションにおいて25点の衝撃をコンクリート床板に加えて弾性波を発生させた際の誤差マップ50をコンター図で示している。図6に示すように、誤差マップ50の左側の領域では、誤差が大きくなっている。これは、センサ10-1及びセンサ10-2に接着不良があったことが原因であると考えられる。
図7は、第1の実施形態における構造物評価システム100による劣化状態の評価処理の流れを示すシーケンス図である。図7に示す例では、ゲート生成回路202から第1のゲート信号が出力された後の処理を示している。
到達時刻決定部204は、ノイズ除去弾性波信号に基づいて第1の弾性波到達時刻tM及び第2の弾性波到達時刻tTHを決定する(ステップS101)。到達時刻決定部203は、決定した時刻情報を信頼度算出部204及び送信データ生成部206に出力する。
到達時刻決定部204は、ノイズ除去弾性波信号に基づいて第1の弾性波到達時刻tM及び第2の弾性波到達時刻tTHを決定する(ステップS101)。到達時刻決定部203は、決定した時刻情報を信頼度算出部204及び送信データ生成部206に出力する。
信頼度算出部204は、第1のゲート信号が入力されている間に得られた時刻情報に基づいて、ノイズ除去弾性波信号の信頼度を算出する(ステップS102)。例えば、信頼度算出部204は、第1の弾性波到達時刻tMと第2の弾性波到達時刻tTHとの時刻差の逆数に関する値を信頼度として算出する。信頼度算出部204は、算出した信頼度の情報を送信データ生成部206に出力する。
特徴量抽出部205は、第1のゲート信号が入力されている間に得られたノイズ除去弾性波信号の特徴量を抽出する(ステップS103)。送信データ生成部206は、ステップS101からステップS103までの処理で取得された情報を対応付けることによって送信データを生成する(ステップS104)。出力部208は、生成された送信データを構造物評価装置30に出力する(ステップS105)。なお、ステップS101からステップS105までの処理は、センサ10において弾性波が検出されて第1のゲート信号が出力される度に実行される。すなわち、第1のゲート信号が出力される度に、第1の弾性波到達時刻tM、第2の弾性波到達時刻tTH、信頼度及び特徴量が取得される。
特徴量抽出部205は、第1のゲート信号が入力されている間に得られたノイズ除去弾性波信号の特徴量を抽出する(ステップS103)。送信データ生成部206は、ステップS101からステップS103までの処理で取得された情報を対応付けることによって送信データを生成する(ステップS104)。出力部208は、生成された送信データを構造物評価装置30に出力する(ステップS105)。なお、ステップS101からステップS105までの処理は、センサ10において弾性波が検出されて第1のゲート信号が出力される度に実行される。すなわち、第1のゲート信号が出力される度に、第1の弾性波到達時刻tM、第2の弾性波到達時刻tTH、信頼度及び特徴量が取得される。
取得部311は、信号処理部20から出力された送信データを取得し、取得した送信データをメモリ312に記憶する(ステップS106)。イベント抽出部313は、メモリ312に記憶されている送信データの中から1イベントにおける送信データを抽出する(ステップS107)。なお、イベント抽出部313は位置及び速度標定するために必要となる数(例えば、3つ)より多い1イベントにおける送信データを抽出する。イベント抽出部313は、抽出した送信データを位置速度標定部314に出力する。
位置速度標定部314は、1イベントにおける送信データに基づいて、1イベントで発生した弾性波源の位置又は位置と弾性波の速度を標定する(ステップS108)。なお、位置速度標定部314が、弾性波源の位置のみを標定する場合、構造物評価装置30には弾性波の速度を標定する他の機能部が設けられてもよい。以下、弾性波源の位置又は位置と弾性波の速度の導出方法について具体的に説明する。複数のセンサ10のうち、1つのセンサ10を原点とする3次元座標系を考える。センサ10の数をn個とした場合、原点のセンサS0と、他のセンサSi(i=1、2、・・・、n-1)との間の到達時間差Δtiは、弾性波源の座標(xs,ys,zs)、センサSiの座標(ai,bi,ci)、弾性波伝播速度vとすると以下の式1のように表される。
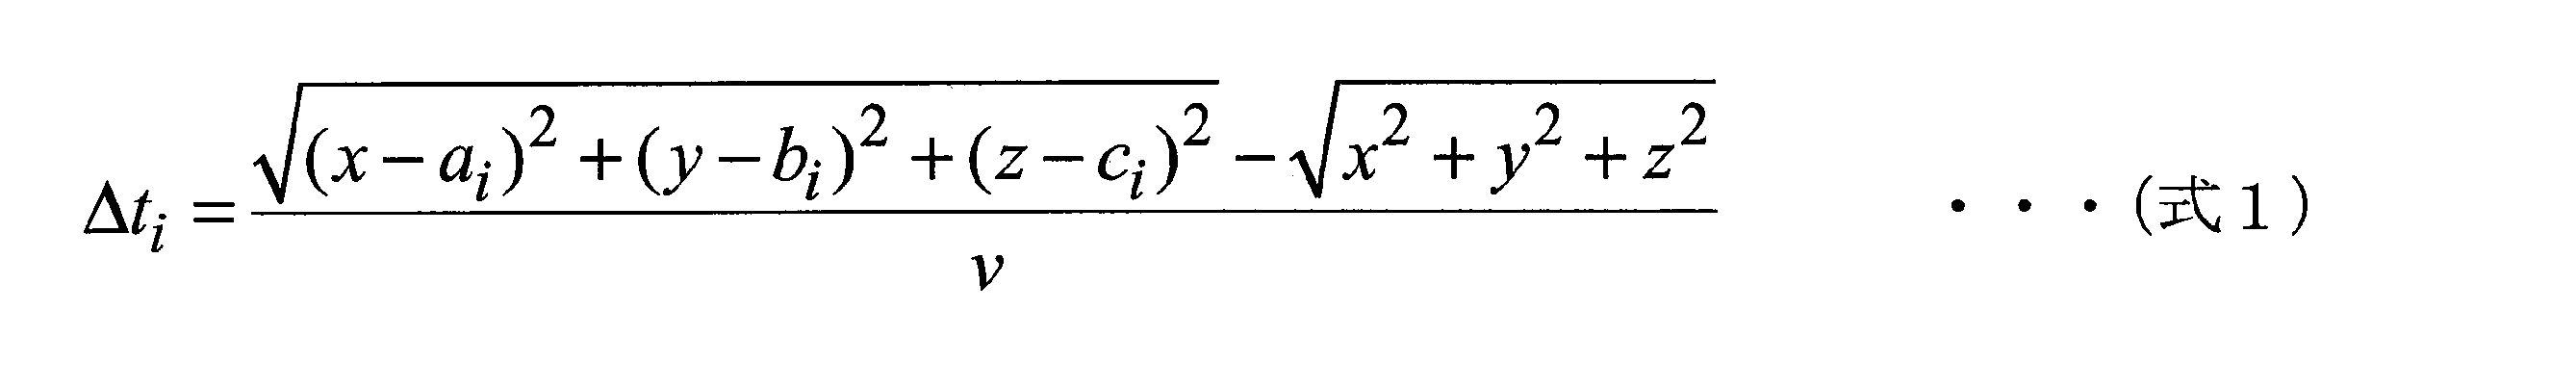
観測される値はtiであり、n個のセンサに対してn-1個の(xs,ys,zs,v)を未知数とする非線形連立方程式が得られる。種々の近似的解法を用いることにより未知数(xs,ys,zs,v)を求めることが可能になる。位置速度標定部314は、評定した弾性波源の位置情報を誤差マップ生成部315に出力する。
誤差マップ生成部315は、イベント抽出部313から出力された複数のイベントにおける送信データに含まれる信頼度の情報及び時刻情報と、弾性波源の位置情報とに基づいて誤差マップを生成する(ステップS109)。
まず、誤差マップ生成部315は、構造物の評価領域を複数の区画に分割する。次に、誤差マップ生成部315は、各区画の弾性波の速度の逆数であるスローネスSを測定値に最も合うように調整して、対象領域の速度場分布を推定する。これを定式化すると観測方程式は式(2)のように表される。

式(2)において、Yは測定値(到達時刻)ベクトル、Hは観測行列、Xは未知パラメータ(スローネス)ベクトル、Vは測定誤差ベクトルを表す。観測行列Hの要素lij(i,jは1以上の整数)は、センサ10-iで測定された弾性波が区画jを通過する線分の長さを指す。この連立方程式になるべくよく合う解を得るため、何らかの目的関数を最小化するXを求める。以下、カルマンフィルタを用いたときの目的関数について説明する。目的関数は、以下の式(3)のように表される。

式(3)において、X-(-はXの上、以下同様)はXの推定値を表し、PはXの推定誤差共分散行列を表し、RはΔtを対角成分に持つ測定誤差共分散行列を表す。なお、Rの逆数が、時刻差の逆数に関する値に対応する。この式(3)を最小化するX^(^はXの上、以下同様)は以下の式(4)のように与えられる。

Pの対角項はパラメータXの推定誤差分散を表し、その平方根は推定誤差に相当する。つまり、誤差マップ生成部315は、各区画のPの対角項を対応する区画にマッピングすることで、評価領域の推定誤差マップ(誤差マップ)を得る。ここでPの更新式をみると、Pが大きな値をもつ(更新されない)のは、観測行列Hの各要素が値を持たないとき、又は測定誤差共分散行列Rの対角成分Δtが大きな値をもつときと分かる。誤差マップ生成部315は、生成した誤差マップを表示部32に出力する。表示部32は、評価結果として、生成された誤差マップを誤差の高低に応じたコンター図で表示する(ステップS110)。
以上のように構成された構造物評価システム100では、センサ10によって検出された弾性波毎に、第1の弾性波到達時刻tMと、第2の弾性波到達時刻tTHとの時刻差の逆数に関する値の積算値を信頼度として取得し、取得した信頼度を用いて誤差マップを生成する。センサ10の接着不良が生じている場合、弾性波源から接着不良のセンサ10への経路上の領域に対応する誤差マップ内の領域の誤差が大きくなる。このように、構造物評価システム100では、システムの利用者が構造物の劣化状態の評価精度を低下させる要因を発見しやすくなる。推定誤差が大きい範囲が広がっている場合、システムの利用者はセンサ10の接着不良等の問題を踏まえて調査することができる。このように、構造物の劣化状態の評価精度を向上させることができる。
また、システムの利用者は、誤差マップを見ることによって推定誤差が大きい領域は何かしらの要因により評価結果が信頼できないと推定することができる。したがって、推定誤差が大きい領域については、弾性波等を人為的に発生させて再度測定するように促すことができる。そのため、構造物の評価精度を低下させる要因を発見しやすくなる。これにより、要因に応じた対応が可能になる。
(第2の実施形態)
第2の実施形態は、評価部が、誤差マップに加えて速度場マップをさらに生成する点で第1の実施形態と構成が異なる。以下、相違点についてのみ説明する。
図8は、第2の実施形態における評価部31aの機能を表す概略ブロック図である。評価部31aは、取得部311、メモリ312、イベント抽出部313、位置速度標定部314、誤差マップ生成部315及び速度場マップ生成部316を備える。
第2の実施形態は、評価部が、誤差マップに加えて速度場マップをさらに生成する点で第1の実施形態と構成が異なる。以下、相違点についてのみ説明する。
図8は、第2の実施形態における評価部31aの機能を表す概略ブロック図である。評価部31aは、取得部311、メモリ312、イベント抽出部313、位置速度標定部314、誤差マップ生成部315及び速度場マップ生成部316を備える。
速度場マップ生成部316は、イベント抽出部313から出力された1イベントにおける送信データに含まれる信頼度の情報及び時刻情報と、位置速度標定部314により標定された弾性波源の位置又は位置及び弾性波の速度とに基づいて速度場マップ(第2のマップ)を生成する。速度場マップは、評価領域が複数の区画に分割され、各区画に対して構造物で発生した弾性波の伝搬速度を示す値が割り当てられた分布図を表す。すなわち、速度場マップは、評価領域において弾性波の伝搬速度が示された分布図である。また、速度場マップ生成部316は、位置速度標定部314が弾性波源の位置のみを標定する場合、構造物評価装置30には弾性波の速度を標定する。すなわち、速度場マップ生成部316は、位置速度標定部314から弾性波の速度に関する情報が得られなかった場合には、弾性波の速度を標定してもよい。速度場マップの生成には、式(3)のようにカルマンフィルタを用いる方法や、最小二乗法等の各種正則化最小二乗法を用いることができる。
図9は、本実施形態における速度場マップの具体例を示す図である。
図9に示す速度場マップ60は、図6に示す誤差マップ50と同じ環境下で得られた情報を用いて生成されている。図9では、25点の衝撃をコンクリート床板に加え弾性波を発生させた際の速度場マップ60をコンター図で示している。
センサ10の設置不良の問題がある場合、設置不良が生じているセンサ10周辺の速度が遅くなる。これは、センサ10-1とセンサ10-2に接着不良の問題があったためである。速度場マップ60において、速度が遅い領域が、図4に示す損傷領域41からやや上にずれているのは、センサ10-1の接着不良により弾性波の到達時刻が遅く推定され、速度が遅い領域がそれに引きずられ上にずれたと考えられる。
図9に示す速度場マップ60は、図6に示す誤差マップ50と同じ環境下で得られた情報を用いて生成されている。図9では、25点の衝撃をコンクリート床板に加え弾性波を発生させた際の速度場マップ60をコンター図で示している。
センサ10の設置不良の問題がある場合、設置不良が生じているセンサ10周辺の速度が遅くなる。これは、センサ10-1とセンサ10-2に接着不良の問題があったためである。速度場マップ60において、速度が遅い領域が、図4に示す損傷領域41からやや上にずれているのは、センサ10-1の接着不良により弾性波の到達時刻が遅く推定され、速度が遅い領域がそれに引きずられ上にずれたと考えられる。
一方、誤差マップ50は、センサ10-1及びセンサ10-2周辺にまたがり誤差が大きくなっている。これは、センサ10-1及びセンサ10-2の接着不良によるSN低下があったことを意味している。
図10は、第2の実施形態における構造物評価システム100による劣化状態の評価処理の流れを示すシーケンス図である。なお、図10において、図7と同様の処理は図7と同様の符号を付して説明を省略する。
イベント抽出部313は、メモリ312に記憶されている送信データの中から1イベントにおける送信データを抽出する(ステップS201)。イベント抽出部313は、抽出した送信データを位置速度標定部314及び誤差マップ生成部315に出力する。
イベント抽出部313は、メモリ312に記憶されている送信データの中から1イベントにおける送信データを抽出する(ステップS201)。イベント抽出部313は、抽出した送信データを位置速度標定部314及び誤差マップ生成部315に出力する。
位置速度標定部314は、抽出された1イベントにおける送信データに基づいて、1イベントで発生した弾性波源の位置又は位置と弾性波の速度を標定する(ステップS202)。位置速度標定部314は、評定した弾性波源の位置情報を誤差マップ生成部315に出力する。また、位置速度標定部314は、位置情報と弾性波の速度情報を速度場マップ生成部316に出力する。速度場マップ生成部316は、イベント抽出部313から出力された1イベントにおける送信データに含まれる信頼度の情報及び時刻情報と、弾性波源の位置情報又は位置情報と弾性波の速度情報とに基づいて速度場マップを生成する(ステップS203)。これにより、構造物評価装置30は、構造物の劣化状態を評価する。
以上のように構成された第2の実施形態における構造物評価システム100によれば、構造物評価装置30は、誤差マップ50のみならず、速度場マップ60も生成する。したがって、システムの利用者は、誤差マップ50と速度場マップ60とを比較することよって、推定結果がどの程度正確であるのかを判断するだけでなく、センサ10の接着不良等の異常検知をより精度よく発見することができる。
(第3の実施形態)
第3の実施形態は、信号処理部が、到達時刻を補正する点で第1の実施形態及び第2の実施形態と構成が異なる。以下、相違点についてのみ説明する。
図11は、第3の実施形態における信号処理部20bの機能を表す概略ブロック図である。信号処理部20bは、波形整形フィルタ201、ゲート生成回路202、到達時刻決定部203、信頼度算出部204b、特徴量抽出部205、送信データ生成部206、メモリ207、出力部208及び補正部209を備える。
第3の実施形態は、信号処理部が、到達時刻を補正する点で第1の実施形態及び第2の実施形態と構成が異なる。以下、相違点についてのみ説明する。
図11は、第3の実施形態における信号処理部20bの機能を表す概略ブロック図である。信号処理部20bは、波形整形フィルタ201、ゲート生成回路202、到達時刻決定部203、信頼度算出部204b、特徴量抽出部205、送信データ生成部206、メモリ207、出力部208及び補正部209を備える。
補正部209は、各センサ10により検出された弾性波に基づいて、異常が生じている可能性のあるセンサ10の到達時刻を補正する。具体的には、まず補正部209は、1つのセンサ10で検出された弾性波に基づくノイズ除去弾性波信号を所定の期間取得する。これにより、補正部209は、1つのセンサ10で検出された弾性波に基づくノイズ除去弾性波信号を複数取得する。次に、補正部209は、取得した複数のノイズ除去弾性波信号それぞれの第1の弾性波到達時刻tM及び第2の弾性波到達時刻tTHを到達時刻決定部203から取得する。補正部209は、取得した第1の弾性波到達時刻tM及び第2の弾性波到達時刻tTHに基づいて時刻差を算出する。補正部209は、算出した複数の時刻差の平均及び分散を算出する。補正部209は、上記の処理をセンサ10毎に実行する。
補正部209は、平均又は分散の値が閾値以上のセンサ10を異常が生じている可能性のあるセンサ10と判定する。なお、センサ10の異常とは、接着不良や故障などである。補正部209は、異常が生じている可能性のあるセンサ10については、第1の弾性波到達時刻tMを決定する閾値を下げることによって異常が生じている可能性のあるセンサ10の到達時刻を補正する。例えば、補正部209は、センサ10-1及びセンサ10-2を、異常が生じている可能性のあるセンサ10と判定した場合、センサ10-1及びセンサ10-2における第1の弾性波到達時刻tMを決定する閾値を下げる。
図12Aはセンサ10-1で検出した弾性波の波形を表し、図12Bはセンサ10-2で検出した弾性波の波形を表す。図12A及び図12Bの上図において、縦軸は弾性波の振幅を表し、横軸は時間を表す。また、図12A及び図12Bの下図において、縦軸はCFのスコアを表し、横軸は時間を表す。図12A及び図12BにおけるtCF1の時刻は、到達時刻決定部203がChangeFinderの手法により求めた第1の弾性波到達時刻tMである。図12A及び図12BにおけるtTHの時刻は、第2の弾性波到達時刻tTHである。図12A及び図12BにおけるtCF0の時刻は、補正後の第1の弾性波到達時刻tMである。図12A及び図12Bに示すように、異常が生じている可能性のあるセンサ10で検出された第1の弾性波到達時刻tMが、補正前に比べて早い時刻で検出されていることがわかる。
また、補正部209は、センサ10全体の時刻差の平均及び分散を算出する。その後、補正部209は、各センサ10の平均及び分散を、センサ10全体の時刻差の平均及び分散に基づいて規格化する。ここで、規格化とは、各センサ10の平均及び分散を、センサ10全体の時刻差の平均及び分散に近づけることを意味する。これにより、センサ10毎の検出感度のずれを調整する。補正部209は、規格化後のセンサ10毎の時刻差の平均及び分散値を信頼度算出部204bに出力する。
信頼度算出部204bは、得られた分散値をセンサ10毎の信頼度として送信データ生成部206に出力する。
信頼度算出部204bは、得られた分散値をセンサ10毎の信頼度として送信データ生成部206に出力する。
図13Aは誤差マップ50の具体例を示す図であり、図13Bは速度場マップ60の具体例を示す図であり、図13Cは補正後の到達時刻に基づいて生成された速度場マップ60aの具体例を示す図である。
図13Cに示すように、到達時刻が補正されたことによって、図13Bに示す速度場マップ60と比較して結果が変化していることがわかる。例えば、図13Cのほうが図13Bに比べて構造物内部に劣化が生じている領域(損傷領域41)がより明確に示されていることがわかる。
図13Cに示すように、到達時刻が補正されたことによって、図13Bに示す速度場マップ60と比較して結果が変化していることがわかる。例えば、図13Cのほうが図13Bに比べて構造物内部に劣化が生じている領域(損傷領域41)がより明確に示されていることがわかる。
以上のように構成された第3の実施形態における構造物評価システム100によれば、補正部209が、異常が生じている可能性のあるセンサ10で検出された弾性波の第1の弾性波到達時刻tMを補正する。例えば、補正部209は、異常が生じている可能性のあるセンサ10で検出された弾性波の第1の弾性波到達時刻tMが、到達時刻決定部203により決定された第1の弾性波到達時刻tMよりも手前になるように補正する。これにより、接着不良等の異常により本来弾性波が検出されているべき時刻で検出されていない場合にも、本来の検出時刻に近づけることができる。そのため、構造物の劣化状態の評価精度の低下を抑制することができる。
(第4の実施形態)
第4の実施形態は、評価部が、測定結果を評価する点で第1の実施形態から第3の実施形態と構成が異なる。以下、相違点についてのみ説明する。
図14は、第4の実施形態における評価部31cの機能を表す概略ブロック図である。評価部31cは、取得部311、メモリ312、イベント抽出部313、位置速度標定部314、誤差マップ生成部315及び測定結果評価部317を備える。
第4の実施形態は、評価部が、測定結果を評価する点で第1の実施形態から第3の実施形態と構成が異なる。以下、相違点についてのみ説明する。
図14は、第4の実施形態における評価部31cの機能を表す概略ブロック図である。評価部31cは、取得部311、メモリ312、イベント抽出部313、位置速度標定部314、誤差マップ生成部315及び測定結果評価部317を備える。
測定結果評価部317は、信頼度に基づいて、評価領域内において損傷領域、又は、センサ10に異常が生じている可能性がある旨の評価を行う。具体的には、測定結果評価部317は、誤差マップ生成部315によって生成された誤差マップを参照し、信頼度で示される値が閾値以下の領域を、損傷領域、又は、センサ10の異常により評価結果が低下している領域と判定する。なお、センサ10の異常とは、接着不良や故障などである。
測定結果評価部317は、判定結果を表示部32に表示させる。具体的には、測定結果評価部317は、信頼度で示される値が閾値以下の領域が、損傷領域、又は、センサ10の異常により評価結果が低下している領域であることを示す表示を表示部32に表示させる。例えば、測定結果評価部317は、ポップアップや吹き出しなどの表示により判定結果を表示部32に表示させる。
以上のように構成された第4の実施形態における構造物評価システム100によれば、評価部31cは、信頼度に基づいて損傷領域、又は、センサ10の異常により評価結果が低下している領域を判定する。そして、評価部31cは、判定結果を表示部32に表示させる。これにより、システムの利用者に対して、評価結果を提供することができる。システムの利用者は、提供された評価結果を参考にして、センサ10の接着不良を直したり、損傷領域を把握することができる。
以下、第4の実施形態における構造物評価システム100の変形例について説明する。
評価部31cが、第2の実施形態に示した速度場マップ生成部316を備えるように構成されてもよい。このように構成される場合、測定結果評価部317は、誤差マップと速度場マップとに基づいて、損傷領域、又は、センサ10に異常が生じている可能性がある旨の評価を行うように構成される。具体的には、測定結果評価部317は、誤差マップにおいて信頼度で示される値が閾値以下の領域、かつ、速度場マップにおいて速度の値が閾値以下の領域を、損傷領域、又は、センサ10の異常により評価結果が低下している領域と判定する。信頼度で示される値が閾値以下の領域、かつ、速度場マップにおいて速度の値が閾値以下の領域は、構造物内部の劣化又はセンサ10の異常により弾性波が遅く検出されてしまったことなどが原因となる。したがって、評価部31cは、誤差マップと速度場マップとの2つのマップを用いた評価を行うことによって、損傷領域、又は、センサ10の異常により評価結果が低下している領域をより精度よく判定することができる。
評価部31cが、第2の実施形態に示した速度場マップ生成部316を備えるように構成されてもよい。このように構成される場合、測定結果評価部317は、誤差マップと速度場マップとに基づいて、損傷領域、又は、センサ10に異常が生じている可能性がある旨の評価を行うように構成される。具体的には、測定結果評価部317は、誤差マップにおいて信頼度で示される値が閾値以下の領域、かつ、速度場マップにおいて速度の値が閾値以下の領域を、損傷領域、又は、センサ10の異常により評価結果が低下している領域と判定する。信頼度で示される値が閾値以下の領域、かつ、速度場マップにおいて速度の値が閾値以下の領域は、構造物内部の劣化又はセンサ10の異常により弾性波が遅く検出されてしまったことなどが原因となる。したがって、評価部31cは、誤差マップと速度場マップとの2つのマップを用いた評価を行うことによって、損傷領域、又は、センサ10の異常により評価結果が低下している領域をより精度よく判定することができる。
(第5の実施形態)
図15は、第5の実施形態における構造物評価システム100dのシステム構成を示す図である。構造物評価システム100dは、複数のセンサ10-1~10-n、複数の増幅器11-1~11-n、複数のA/D変換器12-1~12-n、信号処理部20、無線送信部21及び構造物評価装置30dを備える。構造物評価装置30dは、評価部31、表示部32及び無線受信部33を備える。第5の実施形態では、信号処理部20と、構造物評価装置30dとの間を無線通信によって接続する。この場合、無線送信部21は、信号処理部20から出力された送信データを構造物評価装置30dに送信する。無線受信部33は、無線送信部21から送信された送信データを受信し、受信した送信データを評価部31に出力する。無線送信部21と無線受信部33との間の無線の周波数帯は、例えば2.4GHz、920MHz帯(日本国内においては915MHz~928MHz)等のいわゆるISMバンド(Industry Science Medical Band)を用いることができる。
図15は、第5の実施形態における構造物評価システム100dのシステム構成を示す図である。構造物評価システム100dは、複数のセンサ10-1~10-n、複数の増幅器11-1~11-n、複数のA/D変換器12-1~12-n、信号処理部20、無線送信部21及び構造物評価装置30dを備える。構造物評価装置30dは、評価部31、表示部32及び無線受信部33を備える。第5の実施形態では、信号処理部20と、構造物評価装置30dとの間を無線通信によって接続する。この場合、無線送信部21は、信号処理部20から出力された送信データを構造物評価装置30dに送信する。無線受信部33は、無線送信部21から送信された送信データを受信し、受信した送信データを評価部31に出力する。無線送信部21と無線受信部33との間の無線の周波数帯は、例えば2.4GHz、920MHz帯(日本国内においては915MHz~928MHz)等のいわゆるISMバンド(Industry Science Medical Band)を用いることができる。
このように構成されることによって、センサ10、増幅器11、A/D変換器12、信号処理部20及び無線送信部21をセンサノードとして、評価対象となる橋梁等の構造物に設置し、構造物評価装置30dを監視室に設置することが可能になり、遠隔地から構造物の劣化状態をモニタリングすることも可能になる。
構造物評価システム100dは、信号処理部20に代えて信号処理部20bを備えるように構成されてもよい。
構造物評価システム100dは、評価部31に代えて評価部31a又は評価部31cのいずれかを備えるように構成されてもよい。
構造物評価システム100dは、第4の実施形態と同様に変形されてもよい。
構造物評価システム100dは、評価部31に代えて評価部31a又は評価部31cのいずれかを備えるように構成されてもよい。
構造物評価システム100dは、第4の実施形態と同様に変形されてもよい。
(第6の実施形態)
図16は、第6の実施形態における構造物評価システム100eのシステム構成を示す図である。構造物評価システム100eは、複数のセンサ10-1~10-n、複数の増幅器11-1~11-n、複数のA/D変換器12-1~12-n、信号処理部20、無線送信部21、選択部22及び構造物評価装置30dを備える。選択部22は、特徴量の情報に応じて、評価に利用する送信データを選択する。具体的には、選択部22は、信号の特徴量における振幅が所定の閾値以上の送信データのみ無線送信部21に出力する。
図16は、第6の実施形態における構造物評価システム100eのシステム構成を示す図である。構造物評価システム100eは、複数のセンサ10-1~10-n、複数の増幅器11-1~11-n、複数のA/D変換器12-1~12-n、信号処理部20、無線送信部21、選択部22及び構造物評価装置30dを備える。選択部22は、特徴量の情報に応じて、評価に利用する送信データを選択する。具体的には、選択部22は、信号の特徴量における振幅が所定の閾値以上の送信データのみ無線送信部21に出力する。
このように構成されることによって、無用なノイズ情報を送信データとして送信することが抑制され、送信側の消費電力を削減することが可能になる。また、無用なノイズ情報を送信データとして送信することによる構造物の評価の劣化を抑制することも可能になる。
選択部22と、構造物評価装置30dとの間は有線接続であってもよい。このように構成される場合、選択部22は、選択した送信データを有線通信により構造物評価装置30dに出力する。なお、このように構成される場合、構造物評価システム100eは、無線送信部21及び無線受信部33を備えなくてもよい。
選択部22と、構造物評価装置30dとの間は有線接続であってもよい。このように構成される場合、選択部22は、選択した送信データを有線通信により構造物評価装置30dに出力する。なお、このように構成される場合、構造物評価システム100eは、無線送信部21及び無線受信部33を備えなくてもよい。
構造物評価システム100eは、信号処理部20に代えて信号処理部20bを備えてもよい。
構造物評価システム100eは、評価部31に代えて評価部31a又は評価部31cのいずれかを備えるように構成されてもよい。
構造物評価システム100eは、第4の実施形態と同様に変形されてもよい。
構造物評価システム100eは、評価部31に代えて評価部31a又は評価部31cのいずれかを備えるように構成されてもよい。
構造物評価システム100eは、第4の実施形態と同様に変形されてもよい。
以下、各実施形態に共通の変形例について説明する。
センサ10は、増幅器11を内蔵していてもよい。このように構成される場合、構造物評価システム100は増幅器11を備えなくてよい。
誤差マップ生成部315及び速度場マップ生成部316は、1つのマップ生成部で実現されてもよい。
センサ10は、増幅器11を内蔵していてもよい。このように構成される場合、構造物評価システム100は増幅器11を備えなくてよい。
誤差マップ生成部315及び速度場マップ生成部316は、1つのマップ生成部で実現されてもよい。
構造物評価装置30が備える各機能部は、一部又は全てが別の筺体に備えられていてもよい。例えば、構造物評価装置30が評価部31のみを備えて、位置標定部401および表示部32が別の筺体に備えられてもよい。このように構成される場合、評価部31は、弾性波源分布を別の筺体から取得し、取得した弾性波源分布を用いて構造物の健全性を評価する。そして、評価部31は、評価結果を別の筺体が備える表示部32に出力する。
このように構成されることによって、弾性波源分布の導出に既存の装置を用いることによって、構造物評価装置30の製造コストを抑えることができる。
このように構成されることによって、弾性波源分布の導出に既存の装置を用いることによって、構造物評価装置30の製造コストを抑えることができる。
信号処理部20は、入力したAE源信号のうち、ノイズレベルより高く定められた第1の閾値より高い振幅値を有するAE源信号に対して信号処理を行うように構成されてもよい。具体的には、まず信号処理部20は、第1の閾値と比較して大きい振動が検出された場合、第1の閾値を超えた時刻から所定の時間分の信号を弾性波波形と判断し、第1の閾値より高い振幅値を有するAE源信号を保存する。そして、信号処理部20は、保存したAE源信号が示す弾性波波形のデータに基づいて、弾性波に関する情報を含むAE特徴量を抽出する。なお、第1の閾値は、予め設定される。
信号処理部20,20bは、構造物評価装置30,30dに備えられてもよい。このように構成される場合、信号処理部20,20bは、センサ10による処理が施されたAE源信号を、センサ10から直接、又は、不図示の中継装置を介して取得する。
図1、図15及び図16では、複数のセンサ10-1~10-nに1台の信号処理部20が接続されているが、構造物評価システム100,100d,100eは複数台の信号処理部20を備え、各センサ10にそれぞれ信号処理部20が接続されて複数台のセンサユニットを備えるように構成されてもよい。
図1、図15及び図16では、複数のセンサ10-1~10-nに1台の信号処理部20が接続されているが、構造物評価システム100,100d,100eは複数台の信号処理部20を備え、各センサ10にそれぞれ信号処理部20が接続されて複数台のセンサユニットを備えるように構成されてもよい。
誤差マップ生成部315は、誤差マップを新たに生成した場合、前回までに生成された同じ評価領域の誤差マップと、新たに生成した誤差マップとを用いて誤差マップを更新するように構成されてもよい。また、速度場マップ生成部316は、速度場マップにおいても誤差マップと同様に、新たに生成した速度場マップと、前回までの速度場マップとを用いて速度場マップを更新する。このように構成される場合、速度場マップ生成部316は、例えば、新たに生成した速度場マップを含めたこれまでの速度場マップの分割領域における弾性波伝播速度vの平均値を分割区間毎に算出し、算出した値を更新値として各分割区間に割り当てることによって速度場マップを更新する。
以上説明した少なくともひとつの実施形態によれば、弾性波を検出する複数のセンサ10と、複数のセンサ10それぞれによって検出された弾性波を用いて、弾性波の到達時刻を決定する到達時刻決定部203と、到達時刻に基づいて、弾性波の測定波形に関する信頼度を算出する信頼度算出部204と、算出された信頼度に基づいて、弾性波の到着時刻に関する誤差マップを生成する誤差マップ生成部315とを持つことにより、構造物の劣化状態の評価精度を向上させることができる。
本発明のいくつかの実施形態を説明したが、これらの実施形態は、例として提示したものであり、発明の範囲を限定することは意図していない。これら実施形態は、その他の様々な形態で実施されることが可能であり、発明の要旨を逸脱しない範囲で、種々の省略、置き換え、変更を行うことができる。これら実施形態やその変形は、発明の範囲や要旨に含まれると同様に、特許請求の範囲に記載された発明とその均等の範囲に含まれるものである。
Claims (10)
- 弾性波を検出する複数のセンサと、
前記複数のセンサそれぞれによって検出された弾性波を用いて、前記弾性波の到達時刻を決定する到達時刻決定部と、
前記到達時刻に基づいて、前記弾性波の測定波形に関する信頼度を算出する信頼度算出部と、
算出された前記信頼度又は前記信頼度と距離に基づいて第1のマップを生成するマップ生成部と、
を備える構造物評価システム。 - 前記到達時刻決定部は、所定の手法により第1の到達時刻と第2の到達時刻を決定し、
前記信頼度算出部は、前記第1の到達時刻と前記第2の到達時刻との時刻差の逆数に関する値の積算値を前記信頼度として算出する、請求項1に記載の構造物評価システム。 - 前記マップ生成部は、前記構造物の健全性の評価領域を複数の区画に分割し、分割後の区画に対して前記信頼度に応じた値を割り当てることによって前記第1のマップを生成する、請求項1又は2に記載の構造物評価システム。
- 前記複数のセンサそれぞれによって検出された複数の弾性波の到達時刻に基づいて、弾性波の発生源の位置又は弾性波の発生源の位置と前記弾性波の速度を標定する位置速度標定部をさらに備え、
前記マップ生成部は、前記弾性波の発生源の位置及び前記弾性波の速度に基づいて、前記弾性波の速度に関する第2のマップをさらに生成する、請求項1から3のいずれ一項に記載の構造物評価システム。 - 前記弾性波に基づいて、前記弾性波の到達時刻を補正する補正部をさらに備える、請求項1から4のいずれか一項に記載の構造物評価システム。
- 前記補正部は、1つのセンサで得られる複数の弾性波に基づいて、異常が生じている可能性があるセンサを特定し、前記異常が生じている可能性があるセンサで検出された前記弾性波の到達時刻を補正する、請求項5に記載の構造物評価システム。
- 前記信頼度に基づいて、評価領域内において損傷が生じている領域、又は、前記センサに異常が生じている可能性がある旨の評価を行う測定結果評価部をさらに備える、請求項1から6のいずれか一項に記に記載の構造物評価システム。
- 前記弾性波の振幅に応じて評価に利用する弾性波を選択する選択部をさらに備え、
前記到達時刻決定部は、選択された前記弾性波を用いて前記到着時刻を決定する、請求項1から7のいずれか一項に記載の構造物評価システム。 - 弾性波を検出する複数のセンサそれぞれによって検出された弾性波を用いて決定された前記弾性波の到達時刻に基づいて算出された前記弾性波の測定波形に関する信頼度又は前記信頼度と距離に基づいて第1のマップを生成するマップ生成部を、
を備える構造物評価装置。 - 弾性波を検出する複数のセンサそれぞれによって検出された弾性波を用いて、前記弾性波の到達時刻を決定する到達時刻決定ステップと、
前記到達時刻に基づいて、前記弾性波の測定波形に関する信頼度を算出する信頼度算出ステップと、
算出された前記信頼度又は前記信頼度と距離に基づいて第1のマップを生成するマップ生成ステップと、
を有する構造物評価方法。
Priority Applications (3)
| Application Number | Priority Date | Filing Date | Title |
|---|---|---|---|
| JP2020546513A JP7155277B2 (ja) | 2019-03-15 | 2019-03-15 | 構造物評価システム、構造物評価装置及び構造物評価方法 |
| PCT/JP2019/010887 WO2020188640A1 (ja) | 2019-03-15 | 2019-03-15 | 構造物評価システム、構造物評価装置及び構造物評価方法 |
| US17/012,604 US11519883B2 (en) | 2019-03-15 | 2020-09-04 | Structure evaluation system, structure evaluation apparatus, and structure evaluation method |
Applications Claiming Priority (1)
| Application Number | Priority Date | Filing Date | Title |
|---|---|---|---|
| PCT/JP2019/010887 WO2020188640A1 (ja) | 2019-03-15 | 2019-03-15 | 構造物評価システム、構造物評価装置及び構造物評価方法 |
Related Child Applications (1)
| Application Number | Title | Priority Date | Filing Date |
|---|---|---|---|
| US17/012,604 Continuation US11519883B2 (en) | 2019-03-15 | 2020-09-04 | Structure evaluation system, structure evaluation apparatus, and structure evaluation method |
Publications (1)
| Publication Number | Publication Date |
|---|---|
| WO2020188640A1 true WO2020188640A1 (ja) | 2020-09-24 |
Family
ID=72519703
Family Applications (1)
| Application Number | Title | Priority Date | Filing Date |
|---|---|---|---|
| PCT/JP2019/010887 WO2020188640A1 (ja) | 2019-03-15 | 2019-03-15 | 構造物評価システム、構造物評価装置及び構造物評価方法 |
Country Status (3)
| Country | Link |
|---|---|
| US (1) | US11519883B2 (ja) |
| JP (1) | JP7155277B2 (ja) |
| WO (1) | WO2020188640A1 (ja) |
Families Citing this family (2)
| Publication number | Priority date | Publication date | Assignee | Title |
|---|---|---|---|---|
| JP7362580B2 (ja) * | 2020-09-16 | 2023-10-17 | 株式会社東芝 | 構造物評価方法、及び構造物評価システム |
| JP2022131023A (ja) * | 2021-02-26 | 2022-09-07 | セイコーエプソン株式会社 | 計測方法、計測装置、計測システム及び計測プログラム |
Citations (3)
| Publication number | Priority date | Publication date | Assignee | Title |
|---|---|---|---|---|
| JP2004219075A (ja) * | 2003-01-09 | 2004-08-05 | Civil Engineering Research Institute Of Hokkaido | Ae計測体、ae計測体の機能点検方法、ae計測方法、及び能動的地山安定評価方法 |
| CN108459083A (zh) * | 2018-03-22 | 2018-08-28 | 中国水利水电科学研究院 | 一种用于混凝土坝的检测系统及其检测方法 |
| JP2018165732A (ja) * | 2016-09-15 | 2018-10-25 | 株式会社東芝 | 構造物評価システム、構造物評価装置及び構造物評価方法 |
Family Cites Families (11)
| Publication number | Priority date | Publication date | Assignee | Title |
|---|---|---|---|---|
| US5642328A (en) * | 1995-05-08 | 1997-06-24 | Mobil Oil Corporation | Method for determining validity of seismic reflections below lateral velocity variations |
| US6099471A (en) * | 1997-10-07 | 2000-08-08 | General Electric Company | Method and apparatus for real-time calculation and display of strain in ultrasound imaging |
| FR2943276B1 (fr) * | 2009-03-19 | 2013-05-17 | Michelin Soc Tech | Procede de surveillance de l'etat d'un pneumatique |
| JP6171214B2 (ja) | 2012-11-07 | 2017-08-02 | 飛島建設株式会社 | トモグラフィ解析を利用した構造物の非破壊検査システム |
| CN104080408B (zh) * | 2012-11-21 | 2016-06-01 | 株式会社东芝 | 超声波诊断装置、图像处理装置以及图像处理方法 |
| JP6608232B2 (ja) * | 2015-09-30 | 2019-11-20 | キヤノンメディカルシステムズ株式会社 | 医用画像診断装置、医用画像処理装置および医用情報の表示制御方法 |
| US10352912B2 (en) | 2016-09-15 | 2019-07-16 | Kabushiki Kaisha Toshiba | Structure evaluation system, structure evaluation apparatus, and structure evaluation method |
| US10458954B2 (en) | 2016-09-15 | 2019-10-29 | Kabushiki Kaisha Toshiba | Structure evaluation system, structure evaluation apparatus, and structure evaluation method |
| CN111225619B (zh) * | 2017-10-17 | 2023-04-04 | 富士胶片株式会社 | 声波诊断装置及声波诊断装置的控制方法 |
| CN108459082B (zh) | 2018-03-27 | 2021-01-05 | 润电能源科学技术有限公司 | 一种材料检测方法及材料检测装置 |
| JP6643416B2 (ja) | 2018-08-01 | 2020-02-12 | キヤノン株式会社 | 画像処理装置、画像処理方法およびプログラム |
-
2019
- 2019-03-15 WO PCT/JP2019/010887 patent/WO2020188640A1/ja active Application Filing
- 2019-03-15 JP JP2020546513A patent/JP7155277B2/ja active Active
-
2020
- 2020-09-04 US US17/012,604 patent/US11519883B2/en active Active
Patent Citations (3)
| Publication number | Priority date | Publication date | Assignee | Title |
|---|---|---|---|---|
| JP2004219075A (ja) * | 2003-01-09 | 2004-08-05 | Civil Engineering Research Institute Of Hokkaido | Ae計測体、ae計測体の機能点検方法、ae計測方法、及び能動的地山安定評価方法 |
| JP2018165732A (ja) * | 2016-09-15 | 2018-10-25 | 株式会社東芝 | 構造物評価システム、構造物評価装置及び構造物評価方法 |
| CN108459083A (zh) * | 2018-03-22 | 2018-08-28 | 中国水利水电科学研究院 | 一种用于混凝土坝的检测系统及其检测方法 |
Also Published As
| Publication number | Publication date |
|---|---|
| US11519883B2 (en) | 2022-12-06 |
| JP7155277B2 (ja) | 2022-10-18 |
| US20210096110A1 (en) | 2021-04-01 |
| JPWO2020188640A1 (ja) | 2021-04-30 |
Similar Documents
| Publication | Publication Date | Title |
|---|---|---|
| JP6917344B2 (ja) | 構造物評価システム、構造物評価装置及び構造物評価方法 | |
| US10352912B2 (en) | Structure evaluation system, structure evaluation apparatus, and structure evaluation method | |
| US20080255774A1 (en) | Dynamic environmental change compensation of sensor data in structural health monitoring systems | |
| JP6833770B2 (ja) | 構造物評価システム、構造物評価装置及び構造物評価方法 | |
| WO2019167137A1 (ja) | 構造物評価システム及び構造物評価方法 | |
| WO2020188640A1 (ja) | 構造物評価システム、構造物評価装置及び構造物評価方法 | |
| US10458954B2 (en) | Structure evaluation system, structure evaluation apparatus, and structure evaluation method | |
| EP2937689A1 (en) | Adaptive baseline damage detection system and method | |
| JP6710653B2 (ja) | センサ接着状態判定システム、センサ接着状態判定装置及びセンサ接着状態判定方法 | |
| JP2019168430A (ja) | 診断装置及び診断方法 | |
| US20220130240A1 (en) | Vehicle information estimation system, vehicle information estimation apparatus, vehicle information estimation method, and non-transitory computer readable recording medium | |
| EP4435400A1 (en) | Structure evaluation system and structure evaluation method | |
| EP4339578A1 (en) | Structure evaluation system, structure evaluation apparatus, structure evaluation method, and computer program |
Legal Events
| Date | Code | Title | Description |
|---|---|---|---|
| ENP | Entry into the national phase |
Ref document number: 2020546513 Country of ref document: JP Kind code of ref document: A |
|
| 121 | Ep: the epo has been informed by wipo that ep was designated in this application |
Ref document number: 19920448 Country of ref document: EP Kind code of ref document: A1 |
|
| NENP | Non-entry into the national phase |
Ref country code: DE |
|
| 122 | Ep: pct application non-entry in european phase |
Ref document number: 19920448 Country of ref document: EP Kind code of ref document: A1 |