WO2020183975A1 - 表示システム - Google Patents
表示システム Download PDFInfo
- Publication number
- WO2020183975A1 WO2020183975A1 PCT/JP2020/003870 JP2020003870W WO2020183975A1 WO 2020183975 A1 WO2020183975 A1 WO 2020183975A1 JP 2020003870 W JP2020003870 W JP 2020003870W WO 2020183975 A1 WO2020183975 A1 WO 2020183975A1
- Authority
- WO
- WIPO (PCT)
- Prior art keywords
- display
- causal relationship
- causal
- abnormality
- driving means
- Prior art date
Links
Images


Classifications
-
- G—PHYSICS
- G05—CONTROLLING; REGULATING
- G05B—CONTROL OR REGULATING SYSTEMS IN GENERAL; FUNCTIONAL ELEMENTS OF SUCH SYSTEMS; MONITORING OR TESTING ARRANGEMENTS FOR SUCH SYSTEMS OR ELEMENTS
- G05B19/00—Programme-control systems
- G05B19/02—Programme-control systems electric
- G05B19/418—Total factory control, i.e. centrally controlling a plurality of machines, e.g. direct or distributed numerical control [DNC], flexible manufacturing systems [FMS], integrated manufacturing systems [IMS], computer integrated manufacturing [CIM]
- G05B19/41875—Total factory control, i.e. centrally controlling a plurality of machines, e.g. direct or distributed numerical control [DNC], flexible manufacturing systems [FMS], integrated manufacturing systems [IMS], computer integrated manufacturing [CIM] characterised by quality surveillance of production
-
- G—PHYSICS
- G05—CONTROLLING; REGULATING
- G05B—CONTROL OR REGULATING SYSTEMS IN GENERAL; FUNCTIONAL ELEMENTS OF SUCH SYSTEMS; MONITORING OR TESTING ARRANGEMENTS FOR SUCH SYSTEMS OR ELEMENTS
- G05B23/00—Testing or monitoring of control systems or parts thereof
- G05B23/02—Electric testing or monitoring
- G05B23/0205—Electric testing or monitoring by means of a monitoring system capable of detecting and responding to faults
- G05B23/0218—Electric testing or monitoring by means of a monitoring system capable of detecting and responding to faults characterised by the fault detection method dealing with either existing or incipient faults
- G05B23/0243—Electric testing or monitoring by means of a monitoring system capable of detecting and responding to faults characterised by the fault detection method dealing with either existing or incipient faults model based detection method, e.g. first-principles knowledge model
-
- G—PHYSICS
- G05—CONTROLLING; REGULATING
- G05B—CONTROL OR REGULATING SYSTEMS IN GENERAL; FUNCTIONAL ELEMENTS OF SUCH SYSTEMS; MONITORING OR TESTING ARRANGEMENTS FOR SUCH SYSTEMS OR ELEMENTS
- G05B19/00—Programme-control systems
- G05B19/02—Programme-control systems electric
- G05B19/418—Total factory control, i.e. centrally controlling a plurality of machines, e.g. direct or distributed numerical control [DNC], flexible manufacturing systems [FMS], integrated manufacturing systems [IMS], computer integrated manufacturing [CIM]
- G05B19/4183—Total factory control, i.e. centrally controlling a plurality of machines, e.g. direct or distributed numerical control [DNC], flexible manufacturing systems [FMS], integrated manufacturing systems [IMS], computer integrated manufacturing [CIM] characterised by data acquisition, e.g. workpiece identification
-
- G—PHYSICS
- G05—CONTROLLING; REGULATING
- G05B—CONTROL OR REGULATING SYSTEMS IN GENERAL; FUNCTIONAL ELEMENTS OF SUCH SYSTEMS; MONITORING OR TESTING ARRANGEMENTS FOR SUCH SYSTEMS OR ELEMENTS
- G05B19/00—Programme-control systems
- G05B19/02—Programme-control systems electric
- G05B19/418—Total factory control, i.e. centrally controlling a plurality of machines, e.g. direct or distributed numerical control [DNC], flexible manufacturing systems [FMS], integrated manufacturing systems [IMS], computer integrated manufacturing [CIM]
- G05B19/4184—Total factory control, i.e. centrally controlling a plurality of machines, e.g. direct or distributed numerical control [DNC], flexible manufacturing systems [FMS], integrated manufacturing systems [IMS], computer integrated manufacturing [CIM] characterised by fault tolerance, reliability of production system
-
- G—PHYSICS
- G05—CONTROLLING; REGULATING
- G05B—CONTROL OR REGULATING SYSTEMS IN GENERAL; FUNCTIONAL ELEMENTS OF SUCH SYSTEMS; MONITORING OR TESTING ARRANGEMENTS FOR SUCH SYSTEMS OR ELEMENTS
- G05B23/00—Testing or monitoring of control systems or parts thereof
- G05B23/02—Electric testing or monitoring
- G05B23/0205—Electric testing or monitoring by means of a monitoring system capable of detecting and responding to faults
- G05B23/0218—Electric testing or monitoring by means of a monitoring system capable of detecting and responding to faults characterised by the fault detection method dealing with either existing or incipient faults
- G05B23/0221—Preprocessing measurements, e.g. data collection rate adjustment; Standardization of measurements; Time series or signal analysis, e.g. frequency analysis or wavelets; Trustworthiness of measurements; Indexes therefor; Measurements using easily measured parameters to estimate parameters difficult to measure; Virtual sensor creation; De-noising; Sensor fusion; Unconventional preprocessing inherently present in specific fault detection methods like PCA-based methods
-
- G—PHYSICS
- G05—CONTROLLING; REGULATING
- G05B—CONTROL OR REGULATING SYSTEMS IN GENERAL; FUNCTIONAL ELEMENTS OF SUCH SYSTEMS; MONITORING OR TESTING ARRANGEMENTS FOR SUCH SYSTEMS OR ELEMENTS
- G05B2219/00—Program-control systems
- G05B2219/30—Nc systems
- G05B2219/32—Operator till task planning
- G05B2219/32368—Quality control
-
- Y—GENERAL TAGGING OF NEW TECHNOLOGICAL DEVELOPMENTS; GENERAL TAGGING OF CROSS-SECTIONAL TECHNOLOGIES SPANNING OVER SEVERAL SECTIONS OF THE IPC; TECHNICAL SUBJECTS COVERED BY FORMER USPC CROSS-REFERENCE ART COLLECTIONS [XRACs] AND DIGESTS
- Y02—TECHNOLOGIES OR APPLICATIONS FOR MITIGATION OR ADAPTATION AGAINST CLIMATE CHANGE
- Y02P—CLIMATE CHANGE MITIGATION TECHNOLOGIES IN THE PRODUCTION OR PROCESSING OF GOODS
- Y02P90/00—Enabling technologies with a potential contribution to greenhouse gas [GHG] emissions mitigation
- Y02P90/02—Total factory control, e.g. smart factories, flexible manufacturing systems [FMS] or integrated manufacturing systems [IMS]
Definitions
- the present invention relates to a display system, a display method, and a display program.
- Patent Document 1 proposes a method of dividing modes according to operating states based on an event signal, creating a normal model for each mode, and performing abnormality determination based on the created normal model. There is. In this method, the adequacy of the training data used to create the normal model is checked, and the threshold value used for abnormality judgment is set according to the result to prevent the occurrence of false alarms that judge normal as abnormal. ing.
- Patent Document 2 proposes a method for detecting an abnormality in a product produced by a production facility. Specifically, in Patent Document 2, the data collected from the production system is classified into a normal case and an abnormal case, and a feature amount that causes a significant difference between the normal case and the abnormal case is specified. Therefore, a method of diagnosing whether or not the product is normal based on the specified feature amount has been proposed.
- an abnormality occurs in a production facility, it must be resolved immediately, but the user investigates the cause of the abnormality by a manual or the like and then performs a process for solving the abnormality. Is common. However, if the manual is checked every time an abnormality occurs, it takes time and the processing may be delayed.
- the present invention has been made to solve this problem, and an object of the present invention is to provide a display system, a display method, and a display program capable of easily confirming the cause of an abnormality that may occur in a production facility. To do.
- the display system is a production facility for producing a product, and has at least one drive means for driving the production facility and at least one monitoring means for monitoring the production, and the drive means and the display system
- the monitoring means is a display system provided in a production facility having at least one controllable feature amount, and includes a control unit, a display unit, and a storage unit, and the control unit is the control unit.
- the feature amount output over time from at least one of the driving means and the monitoring means is acquired and stored in the storage unit, and at least one of the driving means and the monitoring means is selected and stored in the production facility.
- a causal relationship model showing at least one causative element of an abnormality that can occur and the relationship between the causal elements is constructed at predetermined time intervals based on the acquired feature quantity, and is constructed at a plurality of the above time periods.
- a plurality of the causal relationship models are displayed on the display unit.
- a causal relationship model showing at least one causal element of an abnormality that can occur in a production facility and the relationship between the causal elements at a plurality of periods is constructed and displayed. There is. Therefore, it is possible to compare causal relational models constructed at multiple times. As a result, for example, when the causal relationship model changes at multiple times, it can be seen that some change over time has occurred in the causative element of the abnormality. Therefore, by confirming the difference in the causal relationship model, the abnormality can be found. The cause of this can be easily identified.
- control unit can be configured to emphasize the differences in the plurality of causal relationship models and display them on the display unit.
- control unit can be configured to display the change over time in the feature amount of the causal element in each causal relationship model on the display unit.
- the display system can further include a notification unit that notifies when a difference occurs between the plurality of causal relationship models constructed at the plurality of times.
- the notification unit when a change occurs in a plurality of causal relational models, the notification unit notifies the change, so that the user can foresee the occurrence of an abnormality.
- the display method according to the present invention is an abnormality that may occur in a production facility that produces a product and has at least one driving means for driving the production facility and at least one monitoring means for monitoring the production.
- This is a display method for displaying the causal relationship of the above on the display unit, the step of acquiring the feature amount output over time from at least one of the driving means and the monitoring means, and the driving means and the monitoring means.
- a causal relationship model showing at least one causal element of an abnormality that can occur in the production facility and the relationship between the causal elements, which is selected from the above, is determined based on the acquired feature quantity. It includes a step of constructing each period and a step of displaying a plurality of the causal relationship models constructed at the plurality of periods on the display unit.
- the display program according to the present invention is an abnormality that may occur in a production facility that produces a product and has at least one driving means for driving the production facility and at least one monitoring means for monitoring the production.
- a display program for displaying the causal relationship of the above on the display unit, the step of acquiring the feature amount output to the computer over time from at least one of the driving means and the monitoring means, and the driving means and A causal relationship model showing at least one causative element of at least one abnormality that can occur in the production equipment and the relationship between the causative elements selected from the monitoring means is obtained based on the acquired feature quantity.
- a step of constructing at each predetermined time period and a step of displaying a plurality of the causal relationship models constructed at the plurality of time periods on the display unit are executed.
- the cause of an abnormality that may occur in a production facility can be easily confirmed.
- FIG. 1 An example of a situation in which the present invention is applied is schematically illustrated. It is a block diagram which shows the hardware structure of the analysis apparatus which concerns on one Embodiment of this invention. It is the schematic of the production equipment which concerns on one Embodiment of this invention. It is a block diagram which shows the functional structure of an analyzer. It is a flowchart which shows an example of construction of a causal relational model. This is an example of the relationship between the control signal and the takt time. This is an example of a causal relationship model. This is an example of a causal relationship model. This is an example of a causal relationship model. It is the figure which superposed the node of the causal relation model on the schematic diagram of a packaging machine. This is an example of a screen of a display device.
- the present embodiment an embodiment according to one aspect of the present invention (hereinafter, also referred to as “the present embodiment”) will be described with reference to the drawings.
- the embodiments described below are merely examples of the present invention in all respects. Needless to say, various improvements and modifications can be made without departing from the scope of the present invention. That is, in carrying out the present invention, a specific configuration according to the embodiment may be appropriately adopted.
- the data appearing in the present embodiment are described in natural language, but more specifically, the data is specified in a pseudo language, commands, parameters, machine language, etc. that can be recognized by a computer.
- FIG. 1 schematically illustrates an example of an application scene of the production system according to the present embodiment.
- the production system according to the present embodiment includes a packaging machine 3, an analysis device 1, and a display device 2, which are examples of production equipment.
- the analysis device 1 is a computer configured to derive a causal relationship between a servomotor (driving means) and various sensors (monitoring means) provided in the packaging machine 3 and display the causal relationship.
- driving means such as a servomotor and monitoring means such as various sensors will be collectively referred to as a mechanism.
- the causative element according to the present invention corresponds to a mechanism that causes an abnormality among the mechanisms.
- the analysis device 1 generates a causal relationship model between the mechanisms for the abnormality that may occur in the packaging machine 3, and displays this on the screen 21 of the display device 2.
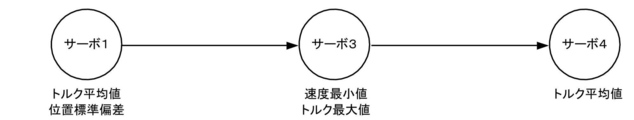
- a causal relationship model is shown when the leather belt for the brake of the film roll 30 (see FIG. 3), which will be described later, is abnormally worn at two times of time T1 and time T2. That is, among the plurality of servomotors provided in the packaging machine 3, servos 1, 3 and 4 are displayed as nodes, and these are connected by edges. And the direction of the edge shows a causal relationship. That is, it is shown that when the leather belt is worn, the servo 1 affects the servo 3 and the servo 3 affects the servo 4, resulting in the wear of the leather belt.
- each servomotor has a plurality of controllable feature amounts such as torque and position, and any of the feature amounts of the servomotor establishes the above causal relationship.
- the operator can know the difference between the two causal relational models, and thereby, at the present time, which mechanism should be confirmed to return the abnormality to normal. You can easily see if you can do it.
- each mechanism does not have to be particularly limited, and may be appropriately selected depending on the embodiment.
- Each mechanism may be, for example, a conveyor, a robot arm, a servomotor, a cylinder (molding machine or the like), a suction pad, a cutter device, a sealing device, or the like.
- each mechanism may be a composite device such as a printing machine, a mounting machine, a reflow furnace, or a substrate inspection device.
- each mechanism includes, for example, a device that detects some information by various sensors, a device that acquires data from various sensors, and some device from the acquired data, in addition to the device that involves some physical operation as described above. It may include a device that performs internal processing such as a device that detects information and a device that processes acquired data.
- One mechanism may be composed of one or more devices, or may be composed of a part of the devices.
- One device may be configured by a plurality of mechanisms. Further, when the same device executes a plurality of processes, each may be regarded as a different mechanism. For example, when the same device executes the first process and the second process, the device that executes the first process is regarded as the first mechanism, and the device that executes the second process is the first. It may be regarded as the mechanism of 2.
- FIG. 2 is a block diagram showing an example of the hardware configuration of the analysis device 1 according to the present embodiment
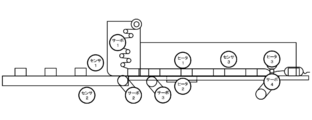
- FIG. 3 is a diagram showing a schematic configuration of the packaging machine.
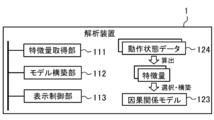
- the analysis device 1 is a computer to which the control unit 11, the storage unit 12, the communication interface 13, the external interface 14, the input device 15, and the drive 16 are electrically connected.
- the control unit 11 includes a CPU (Central Processing Unit), a RAM (Random Access Memory), a ROM (Read Only Memory), and the like, and controls each component according to information processing.
- the storage unit 12 is, for example, an auxiliary storage device such as a hard disk drive or a solid state drive, and stores a program 121 executed by the control unit 11, schematic diagram data 122, causal relationship model data 123, operation state data 124, and the like. To do.
- the program 121 is a program for generating a causal relationship model between an abnormality occurring in the packaging machine 3 and a mechanism, displaying the model on the display device 2, and the like.
- the schematic data 122 is data showing a schematic diagram of a target production facility, and in the present embodiment, is data showing a schematic diagram of the packaging machine 3.
- the schematic diagram may be at least a schematic diagram of the entire packaging machine so that the position of the mechanism shown in the causal relationship model can be understood, and is not necessarily a detailed diagram. Further, it may be an enlarged view showing only a part of the packaging machine 3.
- the causal relationship model data 123 is data showing a causal relationship model of abnormal occurrence constructed by the feature amount of each mechanism extracted from the packaging machine 3. That is, it is data showing a causal relationship between mechanisms when an abnormality occurs.
- the causal relationship model data is generated by the feature amount extracted from the packaging machine 3, but the causal relationship model data generated in advance in the external device can also be stored. ..
- the operating state data 124 is data indicating the operating state of the packaging machine 3. Details will be described later, but for example, it can be data that can occur in driving each mechanism described above, for example, measurement data such as torque, speed, acceleration, temperature, and pressure. Further, when the mechanism is a sensor, the detection result can be, for example, detection data indicating whether or not the content WA exists by "on” and "off".
- the communication interface 13 is, for example, a wired LAN (Local Area Network) module, a wireless LAN module, or the like, and is an interface for performing wired or wireless communication. That is, the communication interface 13 is an example of a communication unit configured to communicate with another device.
- the analysis device 1 of the present embodiment is connected to the packaging machine 3 via the communication interface 13.
- the external interface 14 is an interface for connecting to an external device, and is appropriately configured according to the external device to be connected.
- the external interface 14 is connected to the display device 2.
- the display device 2 a known liquid crystal display, touch panel display, or the like may be used.
- the input device 15 is, for example, a device for inputting a mouse, a keyboard, or the like.
- the drive 16 is, for example, a CD (CompactDisk) drive, a DVD (DigitalVersatileDisk) drive, or the like, and is a device for reading a program stored in the storage medium 17.
- the type of the drive 16 may be appropriately selected according to the type of the storage medium 17. At least a part of various data 122 to 125 including the program 121 stored in the storage unit may be stored in the storage medium 17.
- the storage medium 17 stores the information of the program or the like by electrical, magnetic, optical, mechanical or chemical action so that the information of the program or the like recorded by the computer or other device, the machine or the like can be read. It is a medium to do.
- a disc-type storage medium such as a CD or DVD is illustrated.
- the type of the storage medium 17 is not limited to the disc type, and may be other than the disc type. Examples of storage media other than the disk type include semiconductor memories such as flash memories.
- the components can be omitted, replaced, or added as appropriate according to the embodiment.
- the control unit 11 may include a plurality of processors.
- the analysis device 1 may be composed of a plurality of information processing devices. Further, as the analysis device 1, a general-purpose server device or the like may be used in addition to the information processing device designed exclusively for the provided service.
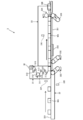
- FIG. 3 schematically illustrates an example of the hardware configuration of the packaging machine 3 according to the present embodiment.
- the wrapping machine 3 is a so-called horizontal pillow wrapping machine, which is a device for wrapping contents WA such as food (dried noodles, etc.) and stationery (eraser, etc.).
- the type of the content WA can be appropriately selected according to the embodiment, and is not particularly limited.
- the wrapping machine 3 broadcasts the film roll 30 on which the wrapping film is wound, the film transport unit 31 for transporting the wrapping film, the content transport unit 32 for transporting the content WA, and the content on the packaging film. It includes a bag making section 33.
- the packaging film can be, for example, a resin film such as a polyethylene film.
- the film roll 30 includes a winding core, and the packaging film is wound around the winding core.
- the winding core is rotatably supported around the axis, whereby the film roll 30 is configured so that the packaging film can be unwound while rotating.
- the film transport unit 31 includes a drive roller driven by a servomotor (servo 1) 311, a passive roller 312 to which a rotational force is applied from the drive roller, and a plurality of pulleys 313 that guide the packaging film while applying tension. , Is equipped.
- the film transport section 31 is configured to feed the packaging film from the film roll 30 and transport the delivered packaging film to the bag making section 33 without loosening it.
- the content transfer unit 32 includes a conveyor 321 that conveys the content WA to be packaged, and a servomotor (servo 2) 322 that drives the conveyor 321.
- the content transporting section 32 is connected to the bag making section 33 via the lower part of the film transporting section 31.
- the content WA transported by the content transport unit 32 is supplied to the bag making unit 33 and packaged by the packaging film supplied from the film transport unit 31.
- a fiber sensor (sensor 1) 324 for detecting the position of the content WA is provided in the information downstream of the conveyor 321.
- a fiber sensor (sensor 2) 325 for detecting the riding of the contents WA and the like.
- the bag making section 33 cuts the conveyor 331, the servo motor (servo 3) 332 that drives the conveyor 331, the center seal section 333 that seals the packaging film in the transport direction, and the packaging film on both ends in the transport direction. It includes an end seal portion 334 that seals at each end portion.
- the conveyor 331 conveys the content WA conveyed from the content transfer unit 32 and the packaging film supplied from the film transfer unit 31.
- the packaging film supplied from the film transport unit 31 is supplied to the center seal unit 333 while being appropriately bent so that both side edge portions in the width direction overlap each other.
- the center seal portion 333 is composed of, for example, a pair of left and right heating rollers (heaters 1 and 2), and seals both side edge portions of the bent packaging film along the transport direction by heating.
- the packaging film is formed in a tubular shape.
- the content WA is put into the packaging film formed in this tubular shape.
- a fiber sensor (sensor 3) 336 that detects the position of the content WA is provided above the conveyor 331.
- the end seal portion 334 has, for example, a roller driven by a servomotor 335, a pair of cutters that open and close by rotation of the rollers, and heaters (heaters 3) provided on both sides of each cutter. ..
- the end seal portion 334 is configured so that the tubular packaging film can be cut in the direction orthogonal to the transport direction and can be sealed by heating at the cut portion. After passing through the end seal portion 334, the tip portion of the packaging film formed in a tubular shape is sealed on both sides in the transport direction and separated from the subsequent portion to become a packaging body WB containing the contents WA.
- the above-mentioned packaging machine 3 can wrap the contents WA in the following steps. That is, the film transport unit 31 feeds out the packaging film from the film roll 30. In addition, the content transport unit 32 transports the content WA to be packaged. Next, the center seal portion 333 of the bag making portion 33 forms the unwound packaging film into a tubular shape. Then, after the content WA is put into the formed tubular packaging film, the tubular packaging film is cut in the direction orthogonal to the transport direction by the end seal portion 334, and both sides of the cut portion in the transport direction are cut. Seal by heating with. As a result, a horizontal pillow type package WB containing the content WA is formed. That is, the packaging of the contents WA is completed.
- the drive of the packaging machine 3 can be controlled by a PLC or the like provided separately from the packaging machine 3.
- the above-mentioned operating state data 124 can be acquired from the PLC.
- 10 mechanisms are set in order to establish a causal relationship of abnormality. That is, the above-mentioned servos 1 to 4, heaters 1 to 3, and sensors 1 to 3 are set as mechanisms, and a causal relationship between these mechanisms when an abnormality occurs is constructed as a causal relationship model. Details will be described later.
- FIG. 4 is an example of the functional configuration of the analysis device 1 according to the present embodiment.
- the control unit 11 of the analysis device 1 expands the program 8 stored in the storage unit 12 into the RAM. Then, the control unit 11 interprets and executes the program 8 expanded in the RAM by the CPU to control each component.
- the analysis device 1 according to the present embodiment functions as a computer including a feature amount acquisition unit 111, a model construction unit 112, and a display control unit 113.
- the feature amount acquisition unit 111 is an operating state data indicating the operating state of the packaging machine 3 at the time when the packaging machine 3 normally forms the packaging body WB and at the time when an abnormality occurs in the formed packaging body WB.
- the values of a plurality of types of features calculated from 124 are acquired.
- the model construction unit 112 uses the acquired values of the features of each type during normal and abnormal times to derive a degree of association between the abnormalities occurring in the formed package WB and the features of each type. Based on this, a feature amount effective for predicting anomalies is selected from the acquired multiple types of feature amounts. Then, using the selected features, a causal relationship model 123 showing a causal relationship between the mechanisms when an abnormality occurs is constructed.
- the display control unit 113 has a function of displaying the above-described schematic diagram of the packaging machine 3, a causal relationship model, various feature amounts, and the like on the screen 21 of the display device 2. In addition, the display control unit 113 controls to display various information on the screen 21 of the display device 2.
- each function of the analysis device 1 will be described in detail in an operation example described later.
- an example in which all of the above functions are realized by a general-purpose CPU is described.
- some or all of the above functions may be realized by one or more dedicated processors.
- the functions may be omitted, replaced, or added as appropriate according to the embodiment.
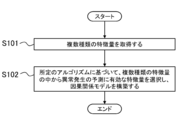
- FIG. 5 illustrates an example of the processing procedure of the analyzer when creating a causal relationship model.
- Step S101 In the first step S101, the control unit 11 of the analysis device 1 functions as the feature amount acquisition unit 111, and an abnormality occurs in the normal time when the packaging machine 3 normally forms the package WB and in the formed package WB. For each of the abnormal cases, the values of a plurality of types of features calculated from the operating state data 124 indicating the operating state of the packaging machine 3 are acquired.
- the control unit 11 classifies the normal time and the abnormal time, and collects the operation state data 124.
- the type of operating state data 124 to be collected is not particularly limited as long as it is data indicating the state of the packaging machine 3, but in the present embodiment, data that can occur in driving each mechanism described above, for example, torque, speed, and so on. It can be measured data such as acceleration, temperature, and pressure.
- measurement data such as ON time, OFF time, turn ON time, and turn OFF time can be used as operation state data 124.
- the ON time and the OFF time are the total times during which the control signal in the target frame is ON or OFF, and the turn ON time and the turn OFF time are the targets. This is the time until the control signal is turned ON or OFF for the first time in the frame.
- the control unit 11 can acquire the detection result of each sensor, for example, the detection data indicating whether or not the content WA exists as “on” and “off” as the operation state data 124.
- the collected operation state data 124 may be stored in the storage unit 12 or may be stored in an external storage device.
- the control unit 11 divides the collected operation state data 124 into frames in order to define the processing range for calculating the feature amount. For example, the control unit 11 may divide the operation state data 124 into frames having a fixed time length. However, the packaging machine 3 does not always operate at regular time intervals. Therefore, if the operation state data 124 is divided into frames having a fixed time length, the operation of the packaging machine 3 reflected in each frame may be deviated.
- the control unit 11 divides the operation state data 124 into frames for each tact time.
- the takt time is the time required to produce a predetermined number of products, that is, to form a predetermined number of packages WB. This takt time can be specified based on a signal that controls the packaging machine 3, for example, a control signal that controls the operation of each servomotor of the packaging machine 3.
- FIG. 6 schematically illustrates the relationship between the control signal and the takt time.
- the control signal for a production facility that repeats the production of products such as the packaging machine 3 is a pulse signal in which "on" and "off” appear periodically according to the production of a predetermined number of products. It has become.
- control unit 11 can acquire this control signal from the packaging machine 3, and set the time from the rise (“on”) of the acquired control signal to the next rise (“on”) as the takt time. Then, as shown in FIG. 6, the control unit 11 can divide the operation state data 124 into frames for each takt time.
- control signal is not particularly limited as long as it is a signal that can be used to control the packaging machine 3.
- the packaging machine 3 is provided with a sensor for detecting a mark attached to the packaging film and the output signal of this sensor is used for adjusting the feed amount of the packaging film, the output signal of this sensor is used. May be used as a control signal.
- control unit 11 calculates the value of the feature amount from each frame of the operation state data 124.
- the type of feature quantity is not particularly limited as long as it indicates the characteristics of the production equipment.
- the control unit 11 controls the amplitude, maximum value, minimum value, average value, and dispersion value in the frame.
- Standard deviation, autocorrelation coefficient, maximum value of power spectrum obtained by Fourier transform, distortion, kurtosis, etc. may be calculated as feature quantities.
- the control unit 11 has an “on” time, an “off” time, in each frame.
- the duty ratio, the number of “on” times, the number of “off” times, and the like may be calculated as feature quantities.
- the feature amount may be derived not only from a single operating state data 124 but also from a plurality of operating state data 124.
- the control unit 11 may calculate the mutual correlation coefficient, ratio, difference, synchronization deviation amount, distance, and the like between the corresponding frames of the two types of operation state data 124 as feature quantities.
- the control unit 11 calculates a plurality of types of features as described above from the operation state data 124. As a result, the control unit 11 can acquire the values of a plurality of types of features calculated from the operation state data 124 for each of the normal state and the abnormal time.
- the processing from the collection of the operation state data 124 to the calculation of the value of the feature amount may be performed not by the analysis device 1 but by the packaging machine 3 or various devices that control the packaging machine 3. Further, even if the control unit 11 discretizes the value of each type of feature amount, for example, a state higher than the threshold value is "1" or "high", and a state lower than the threshold value is "0" or "low”. Good.
- Step S102 In the next step S102, the control unit 11 functions as the model construction unit 112, and the abnormality that occurs in the package WB formed from the values of the respective types of features in the normal state and the abnormal state acquired in step S101. Based on a predetermined algorithm that specifies the degree of association with each type of feature amount, a feature amount effective for predicting anomalies is selected from a plurality of types of acquired feature amounts.
- the predetermined algorithm may be configured using, for example, a Bayesian network.
- the Bayesian network is one of the graphical modeling in which the causal relationship between a plurality of random variables is expressed by a directed acyclic graph structure and the causal relationship between each random variable is expressed by a conditional probability.
- the control unit 11 treats each acquired feature amount and the state of the package WB as a random variable, that is, sets each acquired feature amount and the state of the package WB in each node to construct a Bayesian network. Therefore, the causal relationship between each feature amount and the state of the package WB can be derived.
- a known method may be used for constructing the Bayesian network. For example, a structural learning algorithm such as a Greedy Search algorithm, a Stingy Search algorithm, or a total search method can be used to construct a Bayesian network.
- AIC Alkaike's. Information Criterion
- C4.5 C4.5
- CHM Channel Herskovits Measurement
- MDL Minimum Description Length
- ML Maximum Likelihood
- a pairwise method, a wristwise method, or the like can be used as a processing method when a missing value is included in the learning data (operating state data 124) used for constructing the Bayesian network.
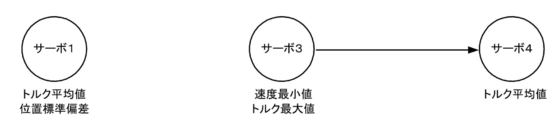
- FIG. 7A shows a causal relationship model when the wear of the leather belt is an abnormal event. That is, the torque average value and the standard deviation of the position, which are the feature amounts of the servo 1, affect the speed average value and the torque maximum value, which are the feature amounts of the servo 2, and these affect the torque average value of the servo 4.
- a causal relationship model of giving is constructed.
- FIG. 7B shows a causal relationship model when the looseness of the chain of the conveyor 321 of the content transport unit 32 is an abnormal event. That is, a causal relationship model is constructed in which the ON time, which is the feature amount of the sensor 2, affects the turn ON time, which is the feature amount of the sensor 3, and further affects the torque average value of the servo 4.
- FIG. 7C shows a causal relationship model when a defective seal of the packaging film is an abnormal event.
- a causal relationship model is constructed in which only the average torque value of the servo 4 is the cause of this abnormal event.
- the causal relationship model constructed in this way is stored in the storage unit 12 as the causal relationship model data 123.
- the method of handling each acquired feature amount and the state of the package WB as a random variable can be appropriately set according to the embodiment.
- the state of the package WB is probable by associating the probability with each event by setting the event that the package WB is normal as "0" and the event that the package WB is abnormal as "1". It can be regarded as a variable.
- an event in which the value of each feature amount is equal to or less than the threshold value is set to "0”
- an event in which the value of each feature amount exceeds the threshold value is set to "1”
- the probability is associated with each event.
- the state of the feature quantity can be regarded as a random variable.
- the number of states set for each feature amount is not limited to two, and may be three or more.
- FIG. 8 is a diagram in which a mechanism that can be a causative element of an abnormal event in the present embodiment is superimposed on a schematic diagram.
- the servos 1 to 4, heaters 1 to 3, and sensors 1 to 3, which are the nodes of the causal relationship model, are arranged at the positions where they are installed in the schematic diagram. Then, on the screen 21 of the display device 2 described below, the mechanism for constructing the causal relationship model is selected as a node from among these mechanisms according to the abnormal event selected by the user, and the causal relationship is selected. An edge with an arrow indicating is displayed with the node.
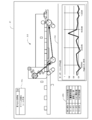
- FIG. 9A is an example of the screen 21 of the display device 2 showing the causal relationship model.
- This screen 21 can be operated by the input device 15 described above.
- a selection box 211 for selecting an abnormal event is displayed on the upper left, and an abnormal event can be selected from a pull-down menu.
- leather belt wear, chain loosening, and poor sealing are shown as abnormal events, from which leather belt wear is selected.
- an abnormality cause diagram 212 in which a schematic diagram of the packaging machine and a causal relationship model are superimposed is displayed.
- the abnormality cause diagram when the abnormality event is the wear of the leather belt is displayed.
- a list 213 showing the mechanism that is the cause element and the feature amount thereof is displayed according to the selected abnormality event.
- the user can select any of the mechanisms and features from this list 213, and when one is selected, the corresponding mechanism in the abnormality cause diagram 212 is highlighted.
- (servo 1-torque average value) is selected from Listing 213, which highlights Servo 1 in the cause of abnormality FIG. 212.
- Various methods can be used for highlighting, and it may be displayed so as to be distinguishable from other nodes such as coloring and blinking.
- the change with time of the selected feature amount is displayed by the graph 214.
- a line graph 214 showing the change over time is displayed.
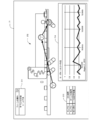
- FIG. 9B shows an example in which the looseness of the chain is displayed as an abnormal event in the box 211.
- the mechanism and the feature amount that cause the loosening of the chain are displayed in the list 213.
- (servo 4-torque average value) is selected, the servo 4 of the abnormality cause FIG. 212 is emphasized, and the line graph 214 showing the change over time of (servo 4-torque average value) is shown. It is displayed.
- FIG. 9C shows an example in which a defective seal is displayed as an abnormal event in the box 211.
- the mechanism and the feature amount that cause the seal failure are displayed.
- (servo 4-torque average value) is selected, the servo 4 in the abnormality cause diagram is emphasized, and a line graph 214 showing the change over time of (servo 4-torque average value) is displayed. Has been done.
- the operations on the above screen 21 can be summarized as follows.
- the user selects an abnormal event to be confirmed from the selection box 211 by the input device 15.
- the display control unit 113 displays the abnormality cause diagram 212 and the list 213 corresponding to the selected abnormality event on the screen.
- the node of the corresponding abnormality cause FIG. 212 is highlighted, and the graph 214 showing the change with time of the selected feature amount is displayed. Therefore, the user can visually recognize the causal relationship related to the abnormal event while looking at the screen 21.
- the user can appropriately set the period of time-dependent changes in the feature amount displayed on the graph 214.
- the causal relationship model constructed as described above may change over time by driving the packaging machine for a long period of time. Therefore, it is preferable to construct the causal relationship model at predetermined intervals. For example, suppose that a causal relationship model related to leather belt wear as shown in FIG. 7A is constructed at a certain time T1, and then a causal relationship model related to leather belt wear is constructed at time T2 when a predetermined period elapses. It is assumed that a causal relationship model as shown in FIG. 10 is constructed.
- FIG. 11 shows an example of screen display.
- the causal relationship model at time T1 and time T2 is displayed side by side on the screen. It highlights the differences between the two causal models. That is, at time T2, the causal relationship between the servo 1 and the servo 2 disappeared, so in the two causal relationship models, the servos 1, 2 and the edges between them are shown by thick lines.
- the highlighting method is not particularly limited, and there are various methods such as coloring and blinking.
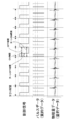
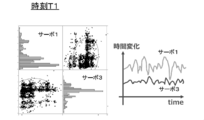
- FIG. 12A shows one frequency distribution, correlation, and time change of the features of the servo 1 and the servo 3 at the time T1
- FIG. 12B shows the features of the servo 1 and the servo 3 at the time T2. It shows one frequency distribution, correlation, and time change.
- Such a change in the causal relationship model may be displayed on the display device 2 by the analysis device 1 when there is a change as described above, or the user may periodically operate the causal relationship model by his / her own operation. Can also be displayed. It is also possible to notify when there is a change in sound, light, display on the screen, or the like.
- the causal relationship model is constructed at a plurality of periods and is configured to be displayed. Therefore, it is possible to compare causal relational models constructed at multiple times. As a result, for example, when the causal relationship model changes at multiple times, it can be seen that some change over time has occurred in the causative element of the abnormality. Therefore, by confirming the difference in the causal relationship model, the abnormality can be found. The cause of this can be easily identified. In addition, by highlighting the differences in the causal relationship model, the differences can be easily visually recognized.
- the causal relationships in the plurality of packaging machines 3 can be compared over a plurality of periods. This facilitates coordination between the plurality of packaging machines 3.
- a schematic diagram of the packaging machine 3 and a causal relationship model related to an abnormality that may occur in the packaging machine 3 are displayed on the screen 21 of the display device 2.
- the causal relational model is superimposed and displayed on the screen 21 so as to correspond to the schematic diagram, the causal element included in the causal relational model can be specified while looking at the schematic diagram. Therefore, it is possible to easily visually recognize where the abnormality is occurring in the packaging machine 3.
- the causative element and the corresponding feature amount for each abnormal event are displayed on the screen 21 as a list 213, the causal element for solving the abnormality and the feature amount for controlling the abnormality can be visually recognized. it can. For example, even if the cause elements are the same, the feature amount to be controlled may differ depending on the abnormality. Therefore, by looking at Listing 213, it is possible to easily know which feature amount should be controlled.
- the display method of the plurality of causal relational models on the screen 21 is not particularly limited, and the arrangement of the causal relational models is not particularly limited. For example, highlighting differences is not mandatory, and causal relationships models can simply be displayed side by side. It is also possible to display a causal relationship model for three or more periods, and to display detailed data such as a frequency distribution of each feature. Further, it can be displayed according to the screen 21 shown in FIGS. 9A to 9C.
- an abnormality event selection box 211 On the screen 21 shown in FIGS. 9A to 9C, an abnormality event selection box 211, an abnormality cause diagram 212, a list 213, and a graph 214 are displayed, but the present invention is not limited to this, and some of them are displayed. Is displayed. For example, depending on the target production facility, there may be one abnormal event, and in this case, the selection box 211 becomes unnecessary. Further, it is not necessary to display all the elements 211 to 214 on the screen 21, and these may be displayed separately on a plurality of screens so that the user can switch between them.
- the construction of the causal relationship model shown in the above embodiment is an example, and may be another method. Further, the schematic diagram data 122 and the causal relationship model data 123 constructed by another device can be sequentially stored in the storage unit 12.
- ⁇ 5-4> It can also be applied to production equipment other than the packaging machine 3, and in that case, a mechanism for constructing a causal relationship model can be appropriately selected according to the production equipment. Further, it is also possible to store schematic data relating to a plurality of production facilities in the storage unit 12 and display the corresponding production facilities on the display device 2.
- the display system according to the present invention can be configured by the analysis device 1 and the display device 2 in the production system. Therefore, the display device 2 of the above embodiment corresponds to the display unit of the present invention, and the control unit 11 and the storage unit 12 of the analysis device 1 correspond to the control unit and the storage unit of the present invention.
- the control unit, the storage unit, and the display unit according to the present invention can be configured by a tablet PC or the like.
Priority Applications (3)
| Application Number | Priority Date | Filing Date | Title |
|---|---|---|---|
| EP20769632.9A EP3940489A4 (de) | 2019-03-13 | 2020-02-03 | Anzeigesystem |
| US17/269,535 US20210200194A1 (en) | 2019-03-13 | 2020-02-03 | Display system, display method, and non-transitory computer-readable recording medium recording display program |
| CN202080004364.0A CN112534373A (zh) | 2019-03-13 | 2020-02-03 | 显示系统 |
Applications Claiming Priority (2)
| Application Number | Priority Date | Filing Date | Title |
|---|---|---|---|
| JP2019045646A JP7272020B2 (ja) | 2019-03-13 | 2019-03-13 | 表示システム |
| JP2019-045646 | 2019-03-13 |
Publications (1)
| Publication Number | Publication Date |
|---|---|
| WO2020183975A1 true WO2020183975A1 (ja) | 2020-09-17 |
Family
ID=72426734
Family Applications (1)
| Application Number | Title | Priority Date | Filing Date |
|---|---|---|---|
| PCT/JP2020/003870 WO2020183975A1 (ja) | 2019-03-13 | 2020-02-03 | 表示システム |
Country Status (5)
| Country | Link |
|---|---|
| US (1) | US20210200194A1 (de) |
| EP (1) | EP3940489A4 (de) |
| JP (1) | JP7272020B2 (de) |
| CN (1) | CN112534373A (de) |
| WO (1) | WO2020183975A1 (de) |
Cited By (1)
| Publication number | Priority date | Publication date | Assignee | Title |
|---|---|---|---|---|
| JP7011106B1 (ja) * | 2021-08-25 | 2022-01-26 | ファナック株式会社 | 状態判定装置及び状態判定方法 |
Families Citing this family (1)
| Publication number | Priority date | Publication date | Assignee | Title |
|---|---|---|---|---|
| JP2022029983A (ja) * | 2020-08-06 | 2022-02-18 | オムロン株式会社 | 表示システム、表示方法、及び表示プログラム |
Citations (7)
| Publication number | Priority date | Publication date | Assignee | Title |
|---|---|---|---|---|
| JP2003162504A (ja) * | 2001-11-26 | 2003-06-06 | Hitachi Ltd | 障害分析支援システム |
| JP2008003920A (ja) * | 2006-06-23 | 2008-01-10 | Toshiba Corp | 時系列データの予測・診断装置およびそのプログラム |
| JP2010277199A (ja) | 2009-05-26 | 2010-12-09 | Nippon Steel Corp | 生産システムの設備診断装置および設備診断方法、並びに設備診断プログラムおよびこれを記録したコンピュータ読み取り可能な記録媒体 |
| JP2015172945A (ja) | 2009-08-28 | 2015-10-01 | 株式会社日立製作所 | 設備状態監視方法およびその装置 |
| WO2018073960A1 (ja) * | 2016-10-21 | 2018-04-26 | 日本電気株式会社 | 表示方法、表示装置、および、プログラム |
| JP2018116545A (ja) * | 2017-01-19 | 2018-07-26 | オムロン株式会社 | 予測モデル作成装置、生産設備監視システム、及び生産設備監視方法 |
| JP2018181021A (ja) * | 2017-04-14 | 2018-11-15 | オムロン株式会社 | 産業用制御装置、制御方法、プログラム、包装機、および包装機用制御装置 |
Family Cites Families (12)
| Publication number | Priority date | Publication date | Assignee | Title |
|---|---|---|---|---|
| JP2005141292A (ja) * | 2003-11-04 | 2005-06-02 | Yamatake Corp | 設備保守・操業知識伝承システムおよび方法、並びに知識ベース構築システムおよび方法 |
| JP2006330878A (ja) * | 2005-05-24 | 2006-12-07 | Toshiba Corp | プラント監視制御装置 |
| CN101414186A (zh) * | 2007-03-09 | 2009-04-22 | 欧姆龙株式会社 | 要因估计支持装置及其控制方法 |
| US7765020B2 (en) * | 2007-05-04 | 2010-07-27 | Applied Materials, Inc. | Graphical user interface for presenting multivariate fault contributions |
| JP5129725B2 (ja) * | 2008-11-19 | 2013-01-30 | 株式会社日立製作所 | 装置異常診断方法及びシステム |
| JP5292477B2 (ja) * | 2010-01-22 | 2013-09-18 | 株式会社日立製作所 | 診断装置及び診断方法 |
| JP5740338B2 (ja) * | 2012-03-29 | 2015-06-24 | 株式会社日立ソリューションズ | 仮想環境運用支援システム |
| JP6216242B2 (ja) * | 2013-12-13 | 2017-10-18 | 株式会社日立ハイテクノロジーズ | 異常検知方法およびその装置 |
| JP2017111657A (ja) * | 2015-12-17 | 2017-06-22 | 株式会社日立製作所 | 設計支援装置及び設計支援方法及び設計支援プログラム |
| JP6837893B2 (ja) * | 2017-03-31 | 2021-03-03 | 住友重機械工業株式会社 | 故障診断システム |
| JP2018200556A (ja) * | 2017-05-26 | 2018-12-20 | 株式会社東芝 | 情報処理装置、情報処理方法及びプログラム |
| JP6551565B2 (ja) * | 2017-06-02 | 2019-07-31 | オムロン株式会社 | 工程解析装置、工程解析方法、及び工程解析プログラム |
-
2019
- 2019-03-13 JP JP2019045646A patent/JP7272020B2/ja active Active
-
2020
- 2020-02-03 US US17/269,535 patent/US20210200194A1/en active Pending
- 2020-02-03 EP EP20769632.9A patent/EP3940489A4/de active Pending
- 2020-02-03 CN CN202080004364.0A patent/CN112534373A/zh active Pending
- 2020-02-03 WO PCT/JP2020/003870 patent/WO2020183975A1/ja unknown
Patent Citations (7)
| Publication number | Priority date | Publication date | Assignee | Title |
|---|---|---|---|---|
| JP2003162504A (ja) * | 2001-11-26 | 2003-06-06 | Hitachi Ltd | 障害分析支援システム |
| JP2008003920A (ja) * | 2006-06-23 | 2008-01-10 | Toshiba Corp | 時系列データの予測・診断装置およびそのプログラム |
| JP2010277199A (ja) | 2009-05-26 | 2010-12-09 | Nippon Steel Corp | 生産システムの設備診断装置および設備診断方法、並びに設備診断プログラムおよびこれを記録したコンピュータ読み取り可能な記録媒体 |
| JP2015172945A (ja) | 2009-08-28 | 2015-10-01 | 株式会社日立製作所 | 設備状態監視方法およびその装置 |
| WO2018073960A1 (ja) * | 2016-10-21 | 2018-04-26 | 日本電気株式会社 | 表示方法、表示装置、および、プログラム |
| JP2018116545A (ja) * | 2017-01-19 | 2018-07-26 | オムロン株式会社 | 予測モデル作成装置、生産設備監視システム、及び生産設備監視方法 |
| JP2018181021A (ja) * | 2017-04-14 | 2018-11-15 | オムロン株式会社 | 産業用制御装置、制御方法、プログラム、包装機、および包装機用制御装置 |
Cited By (2)
| Publication number | Priority date | Publication date | Assignee | Title |
|---|---|---|---|---|
| JP7011106B1 (ja) * | 2021-08-25 | 2022-01-26 | ファナック株式会社 | 状態判定装置及び状態判定方法 |
| WO2023026416A1 (ja) * | 2021-08-25 | 2023-03-02 | ファナック株式会社 | 状態判定装置及び状態判定方法 |
Also Published As
| Publication number | Publication date |
|---|---|
| CN112534373A (zh) | 2021-03-19 |
| EP3940489A1 (de) | 2022-01-19 |
| EP3940489A4 (de) | 2022-11-30 |
| JP7272020B2 (ja) | 2023-05-12 |
| JP2020149291A (ja) | 2020-09-17 |
| US20210200194A1 (en) | 2021-07-01 |
Similar Documents
| Publication | Publication Date | Title |
|---|---|---|
| WO2020183973A1 (ja) | 表示システム、表示方法、及び表示プログラム | |
| US11106197B2 (en) | Prediction model creation apparatus, production facility monitoring system, and production facility monitoring method | |
| WO2020183975A1 (ja) | 表示システム | |
| WO2022030568A1 (ja) | 表示システム、表示方法、及び表示プログラム | |
| CN105539948A (zh) | 控制装置、系统及库程序 | |
| WO2020183974A1 (ja) | 表示システム | |
| JP2018177268A (ja) | 包装機 | |
| WO2022030567A1 (ja) | 表示システム、表示方法、及び表示プログラム | |
| WO2021044500A1 (ja) | 異常に対する処理の支援装置 | |
| WO2021053782A1 (ja) | 生産設備に生じ得る事象の解析装置 | |
| JP6459686B2 (ja) | 制御装置、システム、およびライブラリプログラム | |
| EP4286822A1 (de) | Virtuelles sensorsystem zur zustandsüberwachung einer behälterverpackungsmaschine | |
| US11932991B2 (en) | Systems and methods for monitoring and controlling industrial processes | |
| US11846930B1 (en) | Systems and methods for monitoring and controlling industrial processes | |
| US20240102242A1 (en) | Adaptive-Learning, Auto-Labeling Method and System for Predicting and Diagnosing Web Breaks in Paper Machine | |
| WO2022063373A1 (en) | Optical assessment of packaging film welds |
Legal Events
| Date | Code | Title | Description |
|---|---|---|---|
| 121 | Ep: the epo has been informed by wipo that ep was designated in this application |
Ref document number: 20769632 Country of ref document: EP Kind code of ref document: A1 |
|
| NENP | Non-entry into the national phase |
Ref country code: DE |
|
| ENP | Entry into the national phase |
Ref document number: 2020769632 Country of ref document: EP Effective date: 20211013 |