WO2020183975A1 - Display system - Google Patents
Display system Download PDFInfo
- Publication number
- WO2020183975A1 WO2020183975A1 PCT/JP2020/003870 JP2020003870W WO2020183975A1 WO 2020183975 A1 WO2020183975 A1 WO 2020183975A1 JP 2020003870 W JP2020003870 W JP 2020003870W WO 2020183975 A1 WO2020183975 A1 WO 2020183975A1
- Authority
- WO
- WIPO (PCT)
- Prior art keywords
- display
- causal relationship
- causal
- abnormality
- driving means
- Prior art date
Links
Images


Classifications
-
- G—PHYSICS
- G05—CONTROLLING; REGULATING
- G05B—CONTROL OR REGULATING SYSTEMS IN GENERAL; FUNCTIONAL ELEMENTS OF SUCH SYSTEMS; MONITORING OR TESTING ARRANGEMENTS FOR SUCH SYSTEMS OR ELEMENTS
- G05B19/00—Programme-control systems
- G05B19/02—Programme-control systems electric
- G05B19/418—Total factory control, i.e. centrally controlling a plurality of machines, e.g. direct or distributed numerical control [DNC], flexible manufacturing systems [FMS], integrated manufacturing systems [IMS], computer integrated manufacturing [CIM]
- G05B19/41875—Total factory control, i.e. centrally controlling a plurality of machines, e.g. direct or distributed numerical control [DNC], flexible manufacturing systems [FMS], integrated manufacturing systems [IMS], computer integrated manufacturing [CIM] characterised by quality surveillance of production
-
- G—PHYSICS
- G05—CONTROLLING; REGULATING
- G05B—CONTROL OR REGULATING SYSTEMS IN GENERAL; FUNCTIONAL ELEMENTS OF SUCH SYSTEMS; MONITORING OR TESTING ARRANGEMENTS FOR SUCH SYSTEMS OR ELEMENTS
- G05B23/00—Testing or monitoring of control systems or parts thereof
- G05B23/02—Electric testing or monitoring
- G05B23/0205—Electric testing or monitoring by means of a monitoring system capable of detecting and responding to faults
- G05B23/0218—Electric testing or monitoring by means of a monitoring system capable of detecting and responding to faults characterised by the fault detection method dealing with either existing or incipient faults
- G05B23/0243—Electric testing or monitoring by means of a monitoring system capable of detecting and responding to faults characterised by the fault detection method dealing with either existing or incipient faults model based detection method, e.g. first-principles knowledge model
-
- G—PHYSICS
- G05—CONTROLLING; REGULATING
- G05B—CONTROL OR REGULATING SYSTEMS IN GENERAL; FUNCTIONAL ELEMENTS OF SUCH SYSTEMS; MONITORING OR TESTING ARRANGEMENTS FOR SUCH SYSTEMS OR ELEMENTS
- G05B19/00—Programme-control systems
- G05B19/02—Programme-control systems electric
- G05B19/418—Total factory control, i.e. centrally controlling a plurality of machines, e.g. direct or distributed numerical control [DNC], flexible manufacturing systems [FMS], integrated manufacturing systems [IMS], computer integrated manufacturing [CIM]
- G05B19/4183—Total factory control, i.e. centrally controlling a plurality of machines, e.g. direct or distributed numerical control [DNC], flexible manufacturing systems [FMS], integrated manufacturing systems [IMS], computer integrated manufacturing [CIM] characterised by data acquisition, e.g. workpiece identification
-
- G—PHYSICS
- G05—CONTROLLING; REGULATING
- G05B—CONTROL OR REGULATING SYSTEMS IN GENERAL; FUNCTIONAL ELEMENTS OF SUCH SYSTEMS; MONITORING OR TESTING ARRANGEMENTS FOR SUCH SYSTEMS OR ELEMENTS
- G05B19/00—Programme-control systems
- G05B19/02—Programme-control systems electric
- G05B19/418—Total factory control, i.e. centrally controlling a plurality of machines, e.g. direct or distributed numerical control [DNC], flexible manufacturing systems [FMS], integrated manufacturing systems [IMS], computer integrated manufacturing [CIM]
- G05B19/4184—Total factory control, i.e. centrally controlling a plurality of machines, e.g. direct or distributed numerical control [DNC], flexible manufacturing systems [FMS], integrated manufacturing systems [IMS], computer integrated manufacturing [CIM] characterised by fault tolerance, reliability of production system
-
- G—PHYSICS
- G05—CONTROLLING; REGULATING
- G05B—CONTROL OR REGULATING SYSTEMS IN GENERAL; FUNCTIONAL ELEMENTS OF SUCH SYSTEMS; MONITORING OR TESTING ARRANGEMENTS FOR SUCH SYSTEMS OR ELEMENTS
- G05B23/00—Testing or monitoring of control systems or parts thereof
- G05B23/02—Electric testing or monitoring
- G05B23/0205—Electric testing or monitoring by means of a monitoring system capable of detecting and responding to faults
- G05B23/0218—Electric testing or monitoring by means of a monitoring system capable of detecting and responding to faults characterised by the fault detection method dealing with either existing or incipient faults
- G05B23/0221—Preprocessing measurements, e.g. data collection rate adjustment; Standardization of measurements; Time series or signal analysis, e.g. frequency analysis or wavelets; Trustworthiness of measurements; Indexes therefor; Measurements using easily measured parameters to estimate parameters difficult to measure; Virtual sensor creation; De-noising; Sensor fusion; Unconventional preprocessing inherently present in specific fault detection methods like PCA-based methods
-
- G—PHYSICS
- G05—CONTROLLING; REGULATING
- G05B—CONTROL OR REGULATING SYSTEMS IN GENERAL; FUNCTIONAL ELEMENTS OF SUCH SYSTEMS; MONITORING OR TESTING ARRANGEMENTS FOR SUCH SYSTEMS OR ELEMENTS
- G05B2219/00—Program-control systems
- G05B2219/30—Nc systems
- G05B2219/32—Operator till task planning
- G05B2219/32368—Quality control
-
- Y—GENERAL TAGGING OF NEW TECHNOLOGICAL DEVELOPMENTS; GENERAL TAGGING OF CROSS-SECTIONAL TECHNOLOGIES SPANNING OVER SEVERAL SECTIONS OF THE IPC; TECHNICAL SUBJECTS COVERED BY FORMER USPC CROSS-REFERENCE ART COLLECTIONS [XRACs] AND DIGESTS
- Y02—TECHNOLOGIES OR APPLICATIONS FOR MITIGATION OR ADAPTATION AGAINST CLIMATE CHANGE
- Y02P—CLIMATE CHANGE MITIGATION TECHNOLOGIES IN THE PRODUCTION OR PROCESSING OF GOODS
- Y02P90/00—Enabling technologies with a potential contribution to greenhouse gas [GHG] emissions mitigation
- Y02P90/02—Total factory control, e.g. smart factories, flexible manufacturing systems [FMS] or integrated manufacturing systems [IMS]
Definitions
- the present invention relates to a display system, a display method, and a display program.
- Patent Document 1 proposes a method of dividing modes according to operating states based on an event signal, creating a normal model for each mode, and performing abnormality determination based on the created normal model. There is. In this method, the adequacy of the training data used to create the normal model is checked, and the threshold value used for abnormality judgment is set according to the result to prevent the occurrence of false alarms that judge normal as abnormal. ing.
- Patent Document 2 proposes a method for detecting an abnormality in a product produced by a production facility. Specifically, in Patent Document 2, the data collected from the production system is classified into a normal case and an abnormal case, and a feature amount that causes a significant difference between the normal case and the abnormal case is specified. Therefore, a method of diagnosing whether or not the product is normal based on the specified feature amount has been proposed.
- an abnormality occurs in a production facility, it must be resolved immediately, but the user investigates the cause of the abnormality by a manual or the like and then performs a process for solving the abnormality. Is common. However, if the manual is checked every time an abnormality occurs, it takes time and the processing may be delayed.
- the present invention has been made to solve this problem, and an object of the present invention is to provide a display system, a display method, and a display program capable of easily confirming the cause of an abnormality that may occur in a production facility. To do.
- the display system is a production facility for producing a product, and has at least one drive means for driving the production facility and at least one monitoring means for monitoring the production, and the drive means and the display system
- the monitoring means is a display system provided in a production facility having at least one controllable feature amount, and includes a control unit, a display unit, and a storage unit, and the control unit is the control unit.
- the feature amount output over time from at least one of the driving means and the monitoring means is acquired and stored in the storage unit, and at least one of the driving means and the monitoring means is selected and stored in the production facility.
- a causal relationship model showing at least one causative element of an abnormality that can occur and the relationship between the causal elements is constructed at predetermined time intervals based on the acquired feature quantity, and is constructed at a plurality of the above time periods.
- a plurality of the causal relationship models are displayed on the display unit.
- a causal relationship model showing at least one causal element of an abnormality that can occur in a production facility and the relationship between the causal elements at a plurality of periods is constructed and displayed. There is. Therefore, it is possible to compare causal relational models constructed at multiple times. As a result, for example, when the causal relationship model changes at multiple times, it can be seen that some change over time has occurred in the causative element of the abnormality. Therefore, by confirming the difference in the causal relationship model, the abnormality can be found. The cause of this can be easily identified.
- control unit can be configured to emphasize the differences in the plurality of causal relationship models and display them on the display unit.
- control unit can be configured to display the change over time in the feature amount of the causal element in each causal relationship model on the display unit.
- the display system can further include a notification unit that notifies when a difference occurs between the plurality of causal relationship models constructed at the plurality of times.
- the notification unit when a change occurs in a plurality of causal relational models, the notification unit notifies the change, so that the user can foresee the occurrence of an abnormality.
- the display method according to the present invention is an abnormality that may occur in a production facility that produces a product and has at least one driving means for driving the production facility and at least one monitoring means for monitoring the production.
- This is a display method for displaying the causal relationship of the above on the display unit, the step of acquiring the feature amount output over time from at least one of the driving means and the monitoring means, and the driving means and the monitoring means.
- a causal relationship model showing at least one causal element of an abnormality that can occur in the production facility and the relationship between the causal elements, which is selected from the above, is determined based on the acquired feature quantity. It includes a step of constructing each period and a step of displaying a plurality of the causal relationship models constructed at the plurality of periods on the display unit.
- the display program according to the present invention is an abnormality that may occur in a production facility that produces a product and has at least one driving means for driving the production facility and at least one monitoring means for monitoring the production.
- a display program for displaying the causal relationship of the above on the display unit, the step of acquiring the feature amount output to the computer over time from at least one of the driving means and the monitoring means, and the driving means and A causal relationship model showing at least one causative element of at least one abnormality that can occur in the production equipment and the relationship between the causative elements selected from the monitoring means is obtained based on the acquired feature quantity.
- a step of constructing at each predetermined time period and a step of displaying a plurality of the causal relationship models constructed at the plurality of time periods on the display unit are executed.
- the cause of an abnormality that may occur in a production facility can be easily confirmed.
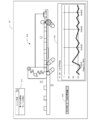
- FIG. 1 An example of a situation in which the present invention is applied is schematically illustrated. It is a block diagram which shows the hardware structure of the analysis apparatus which concerns on one Embodiment of this invention. It is the schematic of the production equipment which concerns on one Embodiment of this invention. It is a block diagram which shows the functional structure of an analyzer. It is a flowchart which shows an example of construction of a causal relational model. This is an example of the relationship between the control signal and the takt time. This is an example of a causal relationship model. This is an example of a causal relationship model. This is an example of a causal relationship model. It is the figure which superposed the node of the causal relation model on the schematic diagram of a packaging machine. This is an example of a screen of a display device.
- the present embodiment an embodiment according to one aspect of the present invention (hereinafter, also referred to as “the present embodiment”) will be described with reference to the drawings.
- the embodiments described below are merely examples of the present invention in all respects. Needless to say, various improvements and modifications can be made without departing from the scope of the present invention. That is, in carrying out the present invention, a specific configuration according to the embodiment may be appropriately adopted.
- the data appearing in the present embodiment are described in natural language, but more specifically, the data is specified in a pseudo language, commands, parameters, machine language, etc. that can be recognized by a computer.
- FIG. 1 schematically illustrates an example of an application scene of the production system according to the present embodiment.
- the production system according to the present embodiment includes a packaging machine 3, an analysis device 1, and a display device 2, which are examples of production equipment.
- the analysis device 1 is a computer configured to derive a causal relationship between a servomotor (driving means) and various sensors (monitoring means) provided in the packaging machine 3 and display the causal relationship.
- driving means such as a servomotor and monitoring means such as various sensors will be collectively referred to as a mechanism.
- the causative element according to the present invention corresponds to a mechanism that causes an abnormality among the mechanisms.
- the analysis device 1 generates a causal relationship model between the mechanisms for the abnormality that may occur in the packaging machine 3, and displays this on the screen 21 of the display device 2.
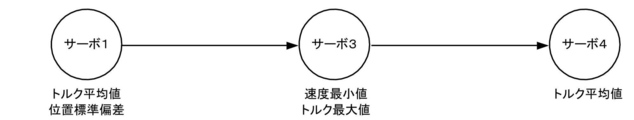
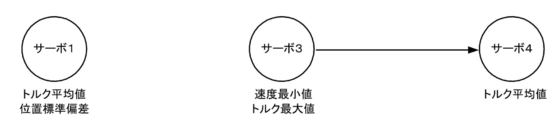
- a causal relationship model is shown when the leather belt for the brake of the film roll 30 (see FIG. 3), which will be described later, is abnormally worn at two times of time T1 and time T2. That is, among the plurality of servomotors provided in the packaging machine 3, servos 1, 3 and 4 are displayed as nodes, and these are connected by edges. And the direction of the edge shows a causal relationship. That is, it is shown that when the leather belt is worn, the servo 1 affects the servo 3 and the servo 3 affects the servo 4, resulting in the wear of the leather belt.
- each servomotor has a plurality of controllable feature amounts such as torque and position, and any of the feature amounts of the servomotor establishes the above causal relationship.
- the operator can know the difference between the two causal relational models, and thereby, at the present time, which mechanism should be confirmed to return the abnormality to normal. You can easily see if you can do it.
- each mechanism does not have to be particularly limited, and may be appropriately selected depending on the embodiment.
- Each mechanism may be, for example, a conveyor, a robot arm, a servomotor, a cylinder (molding machine or the like), a suction pad, a cutter device, a sealing device, or the like.
- each mechanism may be a composite device such as a printing machine, a mounting machine, a reflow furnace, or a substrate inspection device.
- each mechanism includes, for example, a device that detects some information by various sensors, a device that acquires data from various sensors, and some device from the acquired data, in addition to the device that involves some physical operation as described above. It may include a device that performs internal processing such as a device that detects information and a device that processes acquired data.
- One mechanism may be composed of one or more devices, or may be composed of a part of the devices.
- One device may be configured by a plurality of mechanisms. Further, when the same device executes a plurality of processes, each may be regarded as a different mechanism. For example, when the same device executes the first process and the second process, the device that executes the first process is regarded as the first mechanism, and the device that executes the second process is the first. It may be regarded as the mechanism of 2.
- FIG. 2 is a block diagram showing an example of the hardware configuration of the analysis device 1 according to the present embodiment
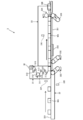
- FIG. 3 is a diagram showing a schematic configuration of the packaging machine.
- the analysis device 1 is a computer to which the control unit 11, the storage unit 12, the communication interface 13, the external interface 14, the input device 15, and the drive 16 are electrically connected.
- the control unit 11 includes a CPU (Central Processing Unit), a RAM (Random Access Memory), a ROM (Read Only Memory), and the like, and controls each component according to information processing.
- the storage unit 12 is, for example, an auxiliary storage device such as a hard disk drive or a solid state drive, and stores a program 121 executed by the control unit 11, schematic diagram data 122, causal relationship model data 123, operation state data 124, and the like. To do.
- the program 121 is a program for generating a causal relationship model between an abnormality occurring in the packaging machine 3 and a mechanism, displaying the model on the display device 2, and the like.
- the schematic data 122 is data showing a schematic diagram of a target production facility, and in the present embodiment, is data showing a schematic diagram of the packaging machine 3.
- the schematic diagram may be at least a schematic diagram of the entire packaging machine so that the position of the mechanism shown in the causal relationship model can be understood, and is not necessarily a detailed diagram. Further, it may be an enlarged view showing only a part of the packaging machine 3.
- the causal relationship model data 123 is data showing a causal relationship model of abnormal occurrence constructed by the feature amount of each mechanism extracted from the packaging machine 3. That is, it is data showing a causal relationship between mechanisms when an abnormality occurs.
- the causal relationship model data is generated by the feature amount extracted from the packaging machine 3, but the causal relationship model data generated in advance in the external device can also be stored. ..
- the operating state data 124 is data indicating the operating state of the packaging machine 3. Details will be described later, but for example, it can be data that can occur in driving each mechanism described above, for example, measurement data such as torque, speed, acceleration, temperature, and pressure. Further, when the mechanism is a sensor, the detection result can be, for example, detection data indicating whether or not the content WA exists by "on” and "off".
- the communication interface 13 is, for example, a wired LAN (Local Area Network) module, a wireless LAN module, or the like, and is an interface for performing wired or wireless communication. That is, the communication interface 13 is an example of a communication unit configured to communicate with another device.
- the analysis device 1 of the present embodiment is connected to the packaging machine 3 via the communication interface 13.
- the external interface 14 is an interface for connecting to an external device, and is appropriately configured according to the external device to be connected.
- the external interface 14 is connected to the display device 2.
- the display device 2 a known liquid crystal display, touch panel display, or the like may be used.
- the input device 15 is, for example, a device for inputting a mouse, a keyboard, or the like.
- the drive 16 is, for example, a CD (CompactDisk) drive, a DVD (DigitalVersatileDisk) drive, or the like, and is a device for reading a program stored in the storage medium 17.
- the type of the drive 16 may be appropriately selected according to the type of the storage medium 17. At least a part of various data 122 to 125 including the program 121 stored in the storage unit may be stored in the storage medium 17.
- the storage medium 17 stores the information of the program or the like by electrical, magnetic, optical, mechanical or chemical action so that the information of the program or the like recorded by the computer or other device, the machine or the like can be read. It is a medium to do.
- a disc-type storage medium such as a CD or DVD is illustrated.
- the type of the storage medium 17 is not limited to the disc type, and may be other than the disc type. Examples of storage media other than the disk type include semiconductor memories such as flash memories.
- the components can be omitted, replaced, or added as appropriate according to the embodiment.
- the control unit 11 may include a plurality of processors.
- the analysis device 1 may be composed of a plurality of information processing devices. Further, as the analysis device 1, a general-purpose server device or the like may be used in addition to the information processing device designed exclusively for the provided service.
- FIG. 3 schematically illustrates an example of the hardware configuration of the packaging machine 3 according to the present embodiment.
- the wrapping machine 3 is a so-called horizontal pillow wrapping machine, which is a device for wrapping contents WA such as food (dried noodles, etc.) and stationery (eraser, etc.).
- the type of the content WA can be appropriately selected according to the embodiment, and is not particularly limited.
- the wrapping machine 3 broadcasts the film roll 30 on which the wrapping film is wound, the film transport unit 31 for transporting the wrapping film, the content transport unit 32 for transporting the content WA, and the content on the packaging film. It includes a bag making section 33.
- the packaging film can be, for example, a resin film such as a polyethylene film.
- the film roll 30 includes a winding core, and the packaging film is wound around the winding core.
- the winding core is rotatably supported around the axis, whereby the film roll 30 is configured so that the packaging film can be unwound while rotating.
- the film transport unit 31 includes a drive roller driven by a servomotor (servo 1) 311, a passive roller 312 to which a rotational force is applied from the drive roller, and a plurality of pulleys 313 that guide the packaging film while applying tension. , Is equipped.
- the film transport section 31 is configured to feed the packaging film from the film roll 30 and transport the delivered packaging film to the bag making section 33 without loosening it.
- the content transfer unit 32 includes a conveyor 321 that conveys the content WA to be packaged, and a servomotor (servo 2) 322 that drives the conveyor 321.
- the content transporting section 32 is connected to the bag making section 33 via the lower part of the film transporting section 31.
- the content WA transported by the content transport unit 32 is supplied to the bag making unit 33 and packaged by the packaging film supplied from the film transport unit 31.
- a fiber sensor (sensor 1) 324 for detecting the position of the content WA is provided in the information downstream of the conveyor 321.
- a fiber sensor (sensor 2) 325 for detecting the riding of the contents WA and the like.
- the bag making section 33 cuts the conveyor 331, the servo motor (servo 3) 332 that drives the conveyor 331, the center seal section 333 that seals the packaging film in the transport direction, and the packaging film on both ends in the transport direction. It includes an end seal portion 334 that seals at each end portion.
- the conveyor 331 conveys the content WA conveyed from the content transfer unit 32 and the packaging film supplied from the film transfer unit 31.
- the packaging film supplied from the film transport unit 31 is supplied to the center seal unit 333 while being appropriately bent so that both side edge portions in the width direction overlap each other.
- the center seal portion 333 is composed of, for example, a pair of left and right heating rollers (heaters 1 and 2), and seals both side edge portions of the bent packaging film along the transport direction by heating.
- the packaging film is formed in a tubular shape.
- the content WA is put into the packaging film formed in this tubular shape.
- a fiber sensor (sensor 3) 336 that detects the position of the content WA is provided above the conveyor 331.
- the end seal portion 334 has, for example, a roller driven by a servomotor 335, a pair of cutters that open and close by rotation of the rollers, and heaters (heaters 3) provided on both sides of each cutter. ..
- the end seal portion 334 is configured so that the tubular packaging film can be cut in the direction orthogonal to the transport direction and can be sealed by heating at the cut portion. After passing through the end seal portion 334, the tip portion of the packaging film formed in a tubular shape is sealed on both sides in the transport direction and separated from the subsequent portion to become a packaging body WB containing the contents WA.
- the above-mentioned packaging machine 3 can wrap the contents WA in the following steps. That is, the film transport unit 31 feeds out the packaging film from the film roll 30. In addition, the content transport unit 32 transports the content WA to be packaged. Next, the center seal portion 333 of the bag making portion 33 forms the unwound packaging film into a tubular shape. Then, after the content WA is put into the formed tubular packaging film, the tubular packaging film is cut in the direction orthogonal to the transport direction by the end seal portion 334, and both sides of the cut portion in the transport direction are cut. Seal by heating with. As a result, a horizontal pillow type package WB containing the content WA is formed. That is, the packaging of the contents WA is completed.
- the drive of the packaging machine 3 can be controlled by a PLC or the like provided separately from the packaging machine 3.
- the above-mentioned operating state data 124 can be acquired from the PLC.
- 10 mechanisms are set in order to establish a causal relationship of abnormality. That is, the above-mentioned servos 1 to 4, heaters 1 to 3, and sensors 1 to 3 are set as mechanisms, and a causal relationship between these mechanisms when an abnormality occurs is constructed as a causal relationship model. Details will be described later.
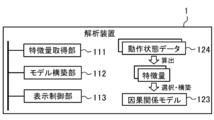
- FIG. 4 is an example of the functional configuration of the analysis device 1 according to the present embodiment.
- the control unit 11 of the analysis device 1 expands the program 8 stored in the storage unit 12 into the RAM. Then, the control unit 11 interprets and executes the program 8 expanded in the RAM by the CPU to control each component.
- the analysis device 1 according to the present embodiment functions as a computer including a feature amount acquisition unit 111, a model construction unit 112, and a display control unit 113.
- the feature amount acquisition unit 111 is an operating state data indicating the operating state of the packaging machine 3 at the time when the packaging machine 3 normally forms the packaging body WB and at the time when an abnormality occurs in the formed packaging body WB.
- the values of a plurality of types of features calculated from 124 are acquired.
- the model construction unit 112 uses the acquired values of the features of each type during normal and abnormal times to derive a degree of association between the abnormalities occurring in the formed package WB and the features of each type. Based on this, a feature amount effective for predicting anomalies is selected from the acquired multiple types of feature amounts. Then, using the selected features, a causal relationship model 123 showing a causal relationship between the mechanisms when an abnormality occurs is constructed.
- the display control unit 113 has a function of displaying the above-described schematic diagram of the packaging machine 3, a causal relationship model, various feature amounts, and the like on the screen 21 of the display device 2. In addition, the display control unit 113 controls to display various information on the screen 21 of the display device 2.
- each function of the analysis device 1 will be described in detail in an operation example described later.
- an example in which all of the above functions are realized by a general-purpose CPU is described.
- some or all of the above functions may be realized by one or more dedicated processors.
- the functions may be omitted, replaced, or added as appropriate according to the embodiment.
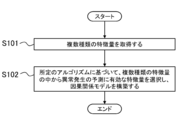
- FIG. 5 illustrates an example of the processing procedure of the analyzer when creating a causal relationship model.
- Step S101 In the first step S101, the control unit 11 of the analysis device 1 functions as the feature amount acquisition unit 111, and an abnormality occurs in the normal time when the packaging machine 3 normally forms the package WB and in the formed package WB. For each of the abnormal cases, the values of a plurality of types of features calculated from the operating state data 124 indicating the operating state of the packaging machine 3 are acquired.
- the control unit 11 classifies the normal time and the abnormal time, and collects the operation state data 124.
- the type of operating state data 124 to be collected is not particularly limited as long as it is data indicating the state of the packaging machine 3, but in the present embodiment, data that can occur in driving each mechanism described above, for example, torque, speed, and so on. It can be measured data such as acceleration, temperature, and pressure.
- measurement data such as ON time, OFF time, turn ON time, and turn OFF time can be used as operation state data 124.
- the ON time and the OFF time are the total times during which the control signal in the target frame is ON or OFF, and the turn ON time and the turn OFF time are the targets. This is the time until the control signal is turned ON or OFF for the first time in the frame.
- the control unit 11 can acquire the detection result of each sensor, for example, the detection data indicating whether or not the content WA exists as “on” and “off” as the operation state data 124.
- the collected operation state data 124 may be stored in the storage unit 12 or may be stored in an external storage device.
- the control unit 11 divides the collected operation state data 124 into frames in order to define the processing range for calculating the feature amount. For example, the control unit 11 may divide the operation state data 124 into frames having a fixed time length. However, the packaging machine 3 does not always operate at regular time intervals. Therefore, if the operation state data 124 is divided into frames having a fixed time length, the operation of the packaging machine 3 reflected in each frame may be deviated.
- the control unit 11 divides the operation state data 124 into frames for each tact time.
- the takt time is the time required to produce a predetermined number of products, that is, to form a predetermined number of packages WB. This takt time can be specified based on a signal that controls the packaging machine 3, for example, a control signal that controls the operation of each servomotor of the packaging machine 3.
- FIG. 6 schematically illustrates the relationship between the control signal and the takt time.
- the control signal for a production facility that repeats the production of products such as the packaging machine 3 is a pulse signal in which "on" and "off” appear periodically according to the production of a predetermined number of products. It has become.
- control unit 11 can acquire this control signal from the packaging machine 3, and set the time from the rise (“on”) of the acquired control signal to the next rise (“on”) as the takt time. Then, as shown in FIG. 6, the control unit 11 can divide the operation state data 124 into frames for each takt time.
- control signal is not particularly limited as long as it is a signal that can be used to control the packaging machine 3.
- the packaging machine 3 is provided with a sensor for detecting a mark attached to the packaging film and the output signal of this sensor is used for adjusting the feed amount of the packaging film, the output signal of this sensor is used. May be used as a control signal.
- control unit 11 calculates the value of the feature amount from each frame of the operation state data 124.
- the type of feature quantity is not particularly limited as long as it indicates the characteristics of the production equipment.
- the control unit 11 controls the amplitude, maximum value, minimum value, average value, and dispersion value in the frame.
- Standard deviation, autocorrelation coefficient, maximum value of power spectrum obtained by Fourier transform, distortion, kurtosis, etc. may be calculated as feature quantities.
- the control unit 11 has an “on” time, an “off” time, in each frame.
- the duty ratio, the number of “on” times, the number of “off” times, and the like may be calculated as feature quantities.
- the feature amount may be derived not only from a single operating state data 124 but also from a plurality of operating state data 124.
- the control unit 11 may calculate the mutual correlation coefficient, ratio, difference, synchronization deviation amount, distance, and the like between the corresponding frames of the two types of operation state data 124 as feature quantities.
- the control unit 11 calculates a plurality of types of features as described above from the operation state data 124. As a result, the control unit 11 can acquire the values of a plurality of types of features calculated from the operation state data 124 for each of the normal state and the abnormal time.
- the processing from the collection of the operation state data 124 to the calculation of the value of the feature amount may be performed not by the analysis device 1 but by the packaging machine 3 or various devices that control the packaging machine 3. Further, even if the control unit 11 discretizes the value of each type of feature amount, for example, a state higher than the threshold value is "1" or "high", and a state lower than the threshold value is "0" or "low”. Good.
- Step S102 In the next step S102, the control unit 11 functions as the model construction unit 112, and the abnormality that occurs in the package WB formed from the values of the respective types of features in the normal state and the abnormal state acquired in step S101. Based on a predetermined algorithm that specifies the degree of association with each type of feature amount, a feature amount effective for predicting anomalies is selected from a plurality of types of acquired feature amounts.
- the predetermined algorithm may be configured using, for example, a Bayesian network.
- the Bayesian network is one of the graphical modeling in which the causal relationship between a plurality of random variables is expressed by a directed acyclic graph structure and the causal relationship between each random variable is expressed by a conditional probability.
- the control unit 11 treats each acquired feature amount and the state of the package WB as a random variable, that is, sets each acquired feature amount and the state of the package WB in each node to construct a Bayesian network. Therefore, the causal relationship between each feature amount and the state of the package WB can be derived.
- a known method may be used for constructing the Bayesian network. For example, a structural learning algorithm such as a Greedy Search algorithm, a Stingy Search algorithm, or a total search method can be used to construct a Bayesian network.
- AIC Alkaike's. Information Criterion
- C4.5 C4.5
- CHM Channel Herskovits Measurement
- MDL Minimum Description Length
- ML Maximum Likelihood
- a pairwise method, a wristwise method, or the like can be used as a processing method when a missing value is included in the learning data (operating state data 124) used for constructing the Bayesian network.
- FIG. 7A shows a causal relationship model when the wear of the leather belt is an abnormal event. That is, the torque average value and the standard deviation of the position, which are the feature amounts of the servo 1, affect the speed average value and the torque maximum value, which are the feature amounts of the servo 2, and these affect the torque average value of the servo 4.
- a causal relationship model of giving is constructed.
- FIG. 7B shows a causal relationship model when the looseness of the chain of the conveyor 321 of the content transport unit 32 is an abnormal event. That is, a causal relationship model is constructed in which the ON time, which is the feature amount of the sensor 2, affects the turn ON time, which is the feature amount of the sensor 3, and further affects the torque average value of the servo 4.
- FIG. 7C shows a causal relationship model when a defective seal of the packaging film is an abnormal event.
- a causal relationship model is constructed in which only the average torque value of the servo 4 is the cause of this abnormal event.
- the causal relationship model constructed in this way is stored in the storage unit 12 as the causal relationship model data 123.
- the method of handling each acquired feature amount and the state of the package WB as a random variable can be appropriately set according to the embodiment.
- the state of the package WB is probable by associating the probability with each event by setting the event that the package WB is normal as "0" and the event that the package WB is abnormal as "1". It can be regarded as a variable.
- an event in which the value of each feature amount is equal to or less than the threshold value is set to "0”
- an event in which the value of each feature amount exceeds the threshold value is set to "1”
- the probability is associated with each event.
- the state of the feature quantity can be regarded as a random variable.
- the number of states set for each feature amount is not limited to two, and may be three or more.
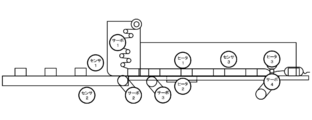
- FIG. 8 is a diagram in which a mechanism that can be a causative element of an abnormal event in the present embodiment is superimposed on a schematic diagram.
- the servos 1 to 4, heaters 1 to 3, and sensors 1 to 3, which are the nodes of the causal relationship model, are arranged at the positions where they are installed in the schematic diagram. Then, on the screen 21 of the display device 2 described below, the mechanism for constructing the causal relationship model is selected as a node from among these mechanisms according to the abnormal event selected by the user, and the causal relationship is selected. An edge with an arrow indicating is displayed with the node.
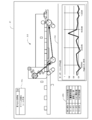
- FIG. 9A is an example of the screen 21 of the display device 2 showing the causal relationship model.
- This screen 21 can be operated by the input device 15 described above.
- a selection box 211 for selecting an abnormal event is displayed on the upper left, and an abnormal event can be selected from a pull-down menu.
- leather belt wear, chain loosening, and poor sealing are shown as abnormal events, from which leather belt wear is selected.
- an abnormality cause diagram 212 in which a schematic diagram of the packaging machine and a causal relationship model are superimposed is displayed.
- the abnormality cause diagram when the abnormality event is the wear of the leather belt is displayed.
- a list 213 showing the mechanism that is the cause element and the feature amount thereof is displayed according to the selected abnormality event.
- the user can select any of the mechanisms and features from this list 213, and when one is selected, the corresponding mechanism in the abnormality cause diagram 212 is highlighted.
- (servo 1-torque average value) is selected from Listing 213, which highlights Servo 1 in the cause of abnormality FIG. 212.
- Various methods can be used for highlighting, and it may be displayed so as to be distinguishable from other nodes such as coloring and blinking.
- the change with time of the selected feature amount is displayed by the graph 214.
- a line graph 214 showing the change over time is displayed.
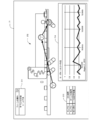
- FIG. 9B shows an example in which the looseness of the chain is displayed as an abnormal event in the box 211.
- the mechanism and the feature amount that cause the loosening of the chain are displayed in the list 213.
- (servo 4-torque average value) is selected, the servo 4 of the abnormality cause FIG. 212 is emphasized, and the line graph 214 showing the change over time of (servo 4-torque average value) is shown. It is displayed.
- FIG. 9C shows an example in which a defective seal is displayed as an abnormal event in the box 211.
- the mechanism and the feature amount that cause the seal failure are displayed.
- (servo 4-torque average value) is selected, the servo 4 in the abnormality cause diagram is emphasized, and a line graph 214 showing the change over time of (servo 4-torque average value) is displayed. Has been done.
- the operations on the above screen 21 can be summarized as follows.
- the user selects an abnormal event to be confirmed from the selection box 211 by the input device 15.
- the display control unit 113 displays the abnormality cause diagram 212 and the list 213 corresponding to the selected abnormality event on the screen.
- the node of the corresponding abnormality cause FIG. 212 is highlighted, and the graph 214 showing the change with time of the selected feature amount is displayed. Therefore, the user can visually recognize the causal relationship related to the abnormal event while looking at the screen 21.
- the user can appropriately set the period of time-dependent changes in the feature amount displayed on the graph 214.
- the causal relationship model constructed as described above may change over time by driving the packaging machine for a long period of time. Therefore, it is preferable to construct the causal relationship model at predetermined intervals. For example, suppose that a causal relationship model related to leather belt wear as shown in FIG. 7A is constructed at a certain time T1, and then a causal relationship model related to leather belt wear is constructed at time T2 when a predetermined period elapses. It is assumed that a causal relationship model as shown in FIG. 10 is constructed.
- FIG. 11 shows an example of screen display.
- the causal relationship model at time T1 and time T2 is displayed side by side on the screen. It highlights the differences between the two causal models. That is, at time T2, the causal relationship between the servo 1 and the servo 2 disappeared, so in the two causal relationship models, the servos 1, 2 and the edges between them are shown by thick lines.
- the highlighting method is not particularly limited, and there are various methods such as coloring and blinking.
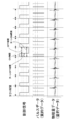
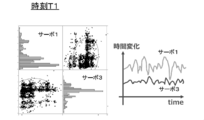
- FIG. 12A shows one frequency distribution, correlation, and time change of the features of the servo 1 and the servo 3 at the time T1
- FIG. 12B shows the features of the servo 1 and the servo 3 at the time T2. It shows one frequency distribution, correlation, and time change.
- Such a change in the causal relationship model may be displayed on the display device 2 by the analysis device 1 when there is a change as described above, or the user may periodically operate the causal relationship model by his / her own operation. Can also be displayed. It is also possible to notify when there is a change in sound, light, display on the screen, or the like.
- the causal relationship model is constructed at a plurality of periods and is configured to be displayed. Therefore, it is possible to compare causal relational models constructed at multiple times. As a result, for example, when the causal relationship model changes at multiple times, it can be seen that some change over time has occurred in the causative element of the abnormality. Therefore, by confirming the difference in the causal relationship model, the abnormality can be found. The cause of this can be easily identified. In addition, by highlighting the differences in the causal relationship model, the differences can be easily visually recognized.
- the causal relationships in the plurality of packaging machines 3 can be compared over a plurality of periods. This facilitates coordination between the plurality of packaging machines 3.
- a schematic diagram of the packaging machine 3 and a causal relationship model related to an abnormality that may occur in the packaging machine 3 are displayed on the screen 21 of the display device 2.
- the causal relational model is superimposed and displayed on the screen 21 so as to correspond to the schematic diagram, the causal element included in the causal relational model can be specified while looking at the schematic diagram. Therefore, it is possible to easily visually recognize where the abnormality is occurring in the packaging machine 3.
- the causative element and the corresponding feature amount for each abnormal event are displayed on the screen 21 as a list 213, the causal element for solving the abnormality and the feature amount for controlling the abnormality can be visually recognized. it can. For example, even if the cause elements are the same, the feature amount to be controlled may differ depending on the abnormality. Therefore, by looking at Listing 213, it is possible to easily know which feature amount should be controlled.
- the display method of the plurality of causal relational models on the screen 21 is not particularly limited, and the arrangement of the causal relational models is not particularly limited. For example, highlighting differences is not mandatory, and causal relationships models can simply be displayed side by side. It is also possible to display a causal relationship model for three or more periods, and to display detailed data such as a frequency distribution of each feature. Further, it can be displayed according to the screen 21 shown in FIGS. 9A to 9C.
- an abnormality event selection box 211 On the screen 21 shown in FIGS. 9A to 9C, an abnormality event selection box 211, an abnormality cause diagram 212, a list 213, and a graph 214 are displayed, but the present invention is not limited to this, and some of them are displayed. Is displayed. For example, depending on the target production facility, there may be one abnormal event, and in this case, the selection box 211 becomes unnecessary. Further, it is not necessary to display all the elements 211 to 214 on the screen 21, and these may be displayed separately on a plurality of screens so that the user can switch between them.
- the construction of the causal relationship model shown in the above embodiment is an example, and may be another method. Further, the schematic diagram data 122 and the causal relationship model data 123 constructed by another device can be sequentially stored in the storage unit 12.
- ⁇ 5-4> It can also be applied to production equipment other than the packaging machine 3, and in that case, a mechanism for constructing a causal relationship model can be appropriately selected according to the production equipment. Further, it is also possible to store schematic data relating to a plurality of production facilities in the storage unit 12 and display the corresponding production facilities on the display device 2.
- the display system according to the present invention can be configured by the analysis device 1 and the display device 2 in the production system. Therefore, the display device 2 of the above embodiment corresponds to the display unit of the present invention, and the control unit 11 and the storage unit 12 of the analysis device 1 correspond to the control unit and the storage unit of the present invention.
- the control unit, the storage unit, and the display unit according to the present invention can be configured by a tablet PC or the like.
Abstract
A display system according to the present invention is a display system provided to production equipment that produces a product, and that has at least one driving means for driving the production equipment and at least one monitoring means for monitoring the production, the driving means and the monitoring means each having at least one controllable feature. The display system is provided with a control unit, a display unit, and a storage unit. The control unit is configured to: obtain a feature output over time from at least one among the driving means and the monitoring means, and cause the storage unit to store the feature; construct, in each prescribed period, a causal relationship model that indicates a causal factor of at least one abnormality that can occur in the production equipment, the causal factor being at least one mechanism selected from among the driving means and the monitoring means, and that also indicates the relationship between causal factors, the causal relationship model being constructed on the basis of the obtained feature; and display, on the display unit, a plurality of causal relationship models constructed in a plurality of periods.
Description
本発明は、表示システム、表示方法、及び表示プログラムに関する。
The present invention relates to a display system, a display method, and a display program.
設備状態を監視する方法として、特許文献1では、イベント信号に基づいて運転状態別にモード分割し、モード毎に正常モデルを作成し、作成した正常モデルに基づいて異常判定を行う方法が提案されている。この方法では、正常モデルの作成に用いた学習データの十分性をチェックし、その結果に応じて、異常判定に利用する閾値を設定することで、正常を異常と判定する誤報の発生を防止している。
As a method of monitoring the equipment state, Patent Document 1 proposes a method of dividing modes according to operating states based on an event signal, creating a normal model for each mode, and performing abnormality determination based on the created normal model. There is. In this method, the adequacy of the training data used to create the normal model is checked, and the threshold value used for abnormality judgment is set according to the result to prevent the occurrence of false alarms that judge normal as abnormal. ing.
また、特許文献2では、生産設備が生産する製品に異常が生じたことを検知する方法が提案されている。具体的に、特許文献2では、生産システムから収集されるデータを製品が正常な場合と異常な場合とに分類し、正常な場合と異常な場合とで有意な差異が生じる特徴量を特定して、特定した特徴量に基づいて製品が正常であるか否かを診断する方法が提案されている。
Further, Patent Document 2 proposes a method for detecting an abnormality in a product produced by a production facility. Specifically, in Patent Document 2, the data collected from the production system is classified into a normal case and an abnormal case, and a feature amount that causes a significant difference between the normal case and the abnormal case is specified. Therefore, a method of diagnosing whether or not the product is normal based on the specified feature amount has been proposed.
ところで、生産設備において、異常が生じた場合には、これを即座に解決しなければならないが、ユーザは、生じた異常の原因をマニュアルなどで調べた上で、解決のための処理を行うのが一般的である。しかしながら、異常が生じる度にマニュアルを調べるとなると、時間を要し、処理が遅れることがある。本発明は、この問題を解決するためになされたものであり、生産設備において生じ得る異常の原因を容易に確認することができる、表示システム、表示方法、及び表示プログラムを提供することを目的とする。
By the way, when an abnormality occurs in a production facility, it must be resolved immediately, but the user investigates the cause of the abnormality by a manual or the like and then performs a process for solving the abnormality. Is common. However, if the manual is checked every time an abnormality occurs, it takes time and the processing may be delayed. The present invention has been made to solve this problem, and an object of the present invention is to provide a display system, a display method, and a display program capable of easily confirming the cause of an abnormality that may occur in a production facility. To do.
本発明に係る表示システムは、製品を生産する生産設備であって、当該生産設備の駆動を行う少なくとも1つの駆動手段及び前記生産の監視を行う少なくとも1つの監視手段を有し、前記駆動手段及び監視手段が、制御可能な少なくとも1つの特徴量を有している、生産設備に設けられる表示システムであって、制御部と、表示部と、記憶部と、を備え、前記制御部は、前記駆動手段及び監視手段の少なくとも1つから経時的に出力される前記特徴量を取得して前記記憶部に記憶させ、前記駆動手段及び前記監視手段の中から少なくとも1つ選択され、前記生産設備に生じ得る少なくとも1つの異常の原因要素と、当該原因要素の関係と、を示す因果関係モデルを、取得された前記特徴量に基づいて、所定の時期ごとに構築し、複数の前記時期において構築された複数の前記因果関係モデルを、前記表示部に表示するように構成されている。
The display system according to the present invention is a production facility for producing a product, and has at least one drive means for driving the production facility and at least one monitoring means for monitoring the production, and the drive means and the display system The monitoring means is a display system provided in a production facility having at least one controllable feature amount, and includes a control unit, a display unit, and a storage unit, and the control unit is the control unit. The feature amount output over time from at least one of the driving means and the monitoring means is acquired and stored in the storage unit, and at least one of the driving means and the monitoring means is selected and stored in the production facility. A causal relationship model showing at least one causative element of an abnormality that can occur and the relationship between the causal elements is constructed at predetermined time intervals based on the acquired feature quantity, and is constructed at a plurality of the above time periods. A plurality of the causal relationship models are displayed on the display unit.
この構成によれば、複数の時期において、生産設備に生じ得る少なくとも1つの異常の原因要素と、当該原因要素の関係と、を示す因果関係モデルを構築し、これらを表示するように構成されている。そのため、複数の時期において構築された因果関係モデルの比較を行うことができる。これにより、例えば、複数の時期において因果関係モデルの変化が生じたときには、異常の原因要素に何らかの経時的な変化が生じたことが分かるため、因果関係モデルの相違点を確認することで、異常の原因を容易に特定することができる。
According to this configuration, a causal relationship model showing at least one causal element of an abnormality that can occur in a production facility and the relationship between the causal elements at a plurality of periods is constructed and displayed. There is. Therefore, it is possible to compare causal relational models constructed at multiple times. As a result, for example, when the causal relationship model changes at multiple times, it can be seen that some change over time has occurred in the causative element of the abnormality. Therefore, by confirming the difference in the causal relationship model, the abnormality can be found. The cause of this can be easily identified.
上記表示システムにおいて、前記制御部は、複数の前記因果関係モデルにおける相違点を強調して前記表示部に表示するように構成することができる。
In the display system, the control unit can be configured to emphasize the differences in the plurality of causal relationship models and display them on the display unit.
これにより、ユーザは、複数の因果関係モデルの相違点を容易に視認することができる。
This allows the user to easily see the differences between the plurality of causal relational models.
上記表示システムにおいて、前記制御部は、前記各因果関係モデルにおける前記原因要素の特徴量の経時的変化を、前記表示部に、表示するように構成することができる。
In the display system, the control unit can be configured to display the change over time in the feature amount of the causal element in each causal relationship model on the display unit.
この構成によれば、各因果関係モデルにおける原因要素の特徴量の経時的変化を確認することができるため、例えば、複数の因果関係モデルに変化が生じたときには、その変化の原因を、特徴量の経時的変化を確認することで、検討することができる。したがって、異常の原因の特定を容易に行うことができる。
According to this configuration, it is possible to confirm the change over time in the feature amount of the causal element in each causal relationship model. Therefore, for example, when a change occurs in a plurality of causal relationship models, the cause of the change is determined by the feature amount. It can be examined by confirming the change over time. Therefore, the cause of the abnormality can be easily identified.
上記表示システムでは、複数の前記時期において構築された複数の前記因果関係モデルに相違点が生じたときに、報知を行う、報知部をさらに備えることができる。
The display system can further include a notification unit that notifies when a difference occurs between the plurality of causal relationship models constructed at the plurality of times.
この構成によれば、複数の因果関係モデルに変化が生じたときには、それを報知部によって報知されるため、ユーザは異常の発生を予見することができる。
According to this configuration, when a change occurs in a plurality of causal relational models, the notification unit notifies the change, so that the user can foresee the occurrence of an abnormality.
本発明に係る表示方法は、製品を生産する生産設備であって、当該生産設備の駆動を行う少なくとも1つの駆動手段及び前記生産の監視を行う少なくとも1つの監視手段を有する生産設備において生じ得る異常の因果関係を表示部に表示するための表示方法であって、前記駆動手段及び監視手段の少なくとも1つから経時的に出力される前記特徴量を取得するステップと、前記駆動手段及び前記監視手段の中から少なくとも1つ選択され、前記生産設備に生じ得る少なくとも1つの異常の原因要素と、当該原因要素の関係と、を示す因果関係モデルを、取得された前記特徴量に基づいて、所定の時期ごとに構築するステップと、複数の前記時期において構築された複数の前記因果関係モデルを、前記表示部に表示するステップと、を備えている。
The display method according to the present invention is an abnormality that may occur in a production facility that produces a product and has at least one driving means for driving the production facility and at least one monitoring means for monitoring the production. This is a display method for displaying the causal relationship of the above on the display unit, the step of acquiring the feature amount output over time from at least one of the driving means and the monitoring means, and the driving means and the monitoring means. A causal relationship model showing at least one causal element of an abnormality that can occur in the production facility and the relationship between the causal elements, which is selected from the above, is determined based on the acquired feature quantity. It includes a step of constructing each period and a step of displaying a plurality of the causal relationship models constructed at the plurality of periods on the display unit.
本発明に係る表示プログラムは、製品を生産する生産設備であって、当該生産設備の駆動を行う少なくとも1つの駆動手段及び前記生産の監視を行う少なくとも1つの監視手段を有する生産設備において生じ得る異常の因果関係を表示部に表示するための表示プログラムであって、コンピュータに、前記駆動手段及び監視手段の少なくとも1つから経時的に出力される前記特徴量を取得するステップと、前記駆動手段及び前記監視手段の中から少なくとも1つ選択され、前記生産設備に生じ得る少なくとも1つの異常の原因要素と、当該原因要素の関係と、を示す因果関係モデルを、取得された前記特徴量に基づいて、所定の時期ごとに構築するステップと、複数の前記時期において構築された複数の前記因果関係モデルを、前記表示部に表示するステップと、を実行させる。
The display program according to the present invention is an abnormality that may occur in a production facility that produces a product and has at least one driving means for driving the production facility and at least one monitoring means for monitoring the production. A display program for displaying the causal relationship of the above on the display unit, the step of acquiring the feature amount output to the computer over time from at least one of the driving means and the monitoring means, and the driving means and A causal relationship model showing at least one causative element of at least one abnormality that can occur in the production equipment and the relationship between the causative elements selected from the monitoring means is obtained based on the acquired feature quantity. , A step of constructing at each predetermined time period and a step of displaying a plurality of the causal relationship models constructed at the plurality of time periods on the display unit are executed.
本発明によれば、生産設備において生じ得る異常の原因を容易に確認することができる。
According to the present invention, the cause of an abnormality that may occur in a production facility can be easily confirmed.
以下、本発明の一側面に係る実施の形態(以下、「本実施形態」とも表記する)を、図面に基づいて説明する。ただし、以下で説明する本実施形態は、あらゆる点において本発明の例示に過ぎない。本発明の範囲を逸脱することなく種々の改良や変形を行うことができることは言うまでもない。つまり、本発明の実施にあたって、実施形態に応じた具体的構成が適宜採用されてもよい。なお、本実施形態において登場するデータを自然言語により説明しているが、より具体的には、コンピュータが認識可能な疑似言語、コマンド、パラメータ、マシン語等で指定される。
Hereinafter, an embodiment according to one aspect of the present invention (hereinafter, also referred to as “the present embodiment”) will be described with reference to the drawings. However, the embodiments described below are merely examples of the present invention in all respects. Needless to say, various improvements and modifications can be made without departing from the scope of the present invention. That is, in carrying out the present invention, a specific configuration according to the embodiment may be appropriately adopted. The data appearing in the present embodiment are described in natural language, but more specifically, the data is specified in a pseudo language, commands, parameters, machine language, etc. that can be recognized by a computer.
<1.適用例>
まず、図1を用いて、本発明が適用される場面の一例について説明する。図1は、本実施形態に係る生産システムの適用場面の一例を模式的に例示する。本実施形態に係る生産システムは、生産設備の一例である包装機3と、解析装置1と、表示装置2と、を備えている。解析装置1は、包装機3に設けられたサーボモータ(駆動手段)や各種センサ(監視手段)間の因果関係を導出し、これを表示するように構成されたコンピュータである。なお、以下では、サーボモータ等の駆動手段や各種センサ等の監視手段を合わせて機構と称することとする。また、本発明に係る原因要素とは、機構のうち、異常が生じる際の原因となる機構に相当する。 <1. Application example>
First, an example of a situation in which the present invention is applied will be described with reference to FIG. FIG. 1 schematically illustrates an example of an application scene of the production system according to the present embodiment. The production system according to the present embodiment includes apackaging machine 3, an analysis device 1, and a display device 2, which are examples of production equipment. The analysis device 1 is a computer configured to derive a causal relationship between a servomotor (driving means) and various sensors (monitoring means) provided in the packaging machine 3 and display the causal relationship. In the following, driving means such as a servomotor and monitoring means such as various sensors will be collectively referred to as a mechanism. In addition, the causative element according to the present invention corresponds to a mechanism that causes an abnormality among the mechanisms.
まず、図1を用いて、本発明が適用される場面の一例について説明する。図1は、本実施形態に係る生産システムの適用場面の一例を模式的に例示する。本実施形態に係る生産システムは、生産設備の一例である包装機3と、解析装置1と、表示装置2と、を備えている。解析装置1は、包装機3に設けられたサーボモータ(駆動手段)や各種センサ(監視手段)間の因果関係を導出し、これを表示するように構成されたコンピュータである。なお、以下では、サーボモータ等の駆動手段や各種センサ等の監視手段を合わせて機構と称することとする。また、本発明に係る原因要素とは、機構のうち、異常が生じる際の原因となる機構に相当する。 <1. Application example>
First, an example of a situation in which the present invention is applied will be described with reference to FIG. FIG. 1 schematically illustrates an example of an application scene of the production system according to the present embodiment. The production system according to the present embodiment includes a
解析装置1は、包装機3に生じ得る異常について、機構間の因果関係モデルを生成し、これを表示装置2の画面21に表示する。図1の例では、時刻T1及び時刻T2の2つの時期における、後述するフィルムロール30(図3参照)のブレーキ用の革ベルトの摩耗が異常として生じるときの因果関係モデルを示している。すなわち、包装機3に設けられた複数のサーボモータのうち、サーボ1,3,4がノードとして表示され、これらがエッジにより連結されている。そして、エッジの向きが因果関係を示している。つまり、革ベルトの摩耗が生じるときには、サーボ1がサーボ3に影響を及ぼし、さらにサーボ3がサーボ4に影響を及ぼすことで、結果として革ベルトの摩耗が生じることを示している。したがって、包装機3の作業者は、サーボ4,3,1の順に異常が生じる原因を確認すればよい。但し、詳細は後述するが、各サーボモータには、トルク、位置などの制御可能な複数の特徴量があり、サーボモータの特徴量のいずれかが上記因果関係を構築する。
The analysis device 1 generates a causal relationship model between the mechanisms for the abnormality that may occur in the packaging machine 3, and displays this on the screen 21 of the display device 2. In the example of FIG. 1, a causal relationship model is shown when the leather belt for the brake of the film roll 30 (see FIG. 3), which will be described later, is abnormally worn at two times of time T1 and time T2. That is, among the plurality of servomotors provided in the packaging machine 3, servos 1, 3 and 4 are displayed as nodes, and these are connected by edges. And the direction of the edge shows a causal relationship. That is, it is shown that when the leather belt is worn, the servo 1 affects the servo 3 and the servo 3 affects the servo 4, resulting in the wear of the leather belt. Therefore, the operator of the packaging machine 3 may confirm the cause of the abnormality in the order of the servos 4, 3 and 1. However, as will be described in detail later, each servomotor has a plurality of controllable feature amounts such as torque and position, and any of the feature amounts of the servomotor establishes the above causal relationship.
このような画面21が表示されることで、作業者は、2つの因果関係モデルの相違点を知ることができ、これによって、現時点で、どの機構を確認にすれば、異常を正常に戻すことができるかを容易に視認することができる。
By displaying such a screen 21, the operator can know the difference between the two causal relational models, and thereby, at the present time, which mechanism should be confirmed to return the abnormality to normal. You can easily see if you can do it.
なお、上記の説明では、生産設備の例として包装機3を示しているが、何らかの物を生産可能であればよく、その種類は、特に限定されなくてもよい。各機構の種類は、特に限定されなくてもよく、実施の形態に応じて適宜選択されてよい。各機構は、例えば、コンベア、ロボットアーム、サーボモータ、シリンダ(成形機等)、吸着パッド、カッター装置、シール装置等であってよい。また、各機構は、上述した包装機3のほか、例えば、印刷機、実装機、リフロー炉、基板検査装置等の複合装置であってもよい。更に、各機構は、例えば、上記のような何らかの物理的な動作を伴う装置の他に、例えば、各種センサにより何らかの情報を検知する装置、各種センサからデータを取得する装置、取得したデータから何らかの情報を検知する装置、取得したデータを情報処理する装置等の内部処理を行う装置を含んでもよい。1つの機構は、1又は複数の装置で構成されてもよいし、装置の一部で構成されてもよい。複数の機構により1つの装置が構成されてもよい。また、同一の装置が複数の処理を実行する場合には、それぞれを別の機構とみなしてもよい。例えば、同一の装置が第1の処理と第2の処理とを実行する場合に、第1の処理を実行する当該装置を第1の機構とみなし、第2の処理を実行する当該装置を第2の機構とみなしてもよい。
In the above description, the packaging machine 3 is shown as an example of the production equipment, but it is sufficient as long as it can produce something, and the type may not be particularly limited. The type of each mechanism does not have to be particularly limited, and may be appropriately selected depending on the embodiment. Each mechanism may be, for example, a conveyor, a robot arm, a servomotor, a cylinder (molding machine or the like), a suction pad, a cutter device, a sealing device, or the like. In addition to the packaging machine 3 described above, each mechanism may be a composite device such as a printing machine, a mounting machine, a reflow furnace, or a substrate inspection device. Further, each mechanism includes, for example, a device that detects some information by various sensors, a device that acquires data from various sensors, and some device from the acquired data, in addition to the device that involves some physical operation as described above. It may include a device that performs internal processing such as a device that detects information and a device that processes acquired data. One mechanism may be composed of one or more devices, or may be composed of a part of the devices. One device may be configured by a plurality of mechanisms. Further, when the same device executes a plurality of processes, each may be regarded as a different mechanism. For example, when the same device executes the first process and the second process, the device that executes the first process is regarded as the first mechanism, and the device that executes the second process is the first. It may be regarded as the mechanism of 2.
<2.構成例>
<2-1.ハードウェア構成>
次に、本実施形態に係る生産システムのハードウェア構成の一例について説明する。図2は、本実施形態に係る解析装置1のハードウェア構成の一例を示すブロック図であり、図3は包装機の概略構成を示す図である。 <2. Configuration example>
<2-1. Hardware configuration>
Next, an example of the hardware configuration of the production system according to the present embodiment will be described. FIG. 2 is a block diagram showing an example of the hardware configuration of theanalysis device 1 according to the present embodiment, and FIG. 3 is a diagram showing a schematic configuration of the packaging machine.
<2-1.ハードウェア構成>
次に、本実施形態に係る生産システムのハードウェア構成の一例について説明する。図2は、本実施形態に係る解析装置1のハードウェア構成の一例を示すブロック図であり、図3は包装機の概略構成を示す図である。 <2. Configuration example>
<2-1. Hardware configuration>
Next, an example of the hardware configuration of the production system according to the present embodiment will be described. FIG. 2 is a block diagram showing an example of the hardware configuration of the
<2-1-1.解析装置>
まず、図2を用いて、本実施形態に係る解析装置1のハードウェア構成の一例を説明する。図2に示すように、この解析装置1は、制御部11、記憶部12、通信インタフェース13、外部インタフェース14、入力装置15、及びドライブ16が電気的に接続されたコンピュータである。 <2-1-1. Analyst>
First, an example of the hardware configuration of theanalysis device 1 according to the present embodiment will be described with reference to FIG. As shown in FIG. 2, the analysis device 1 is a computer to which the control unit 11, the storage unit 12, the communication interface 13, the external interface 14, the input device 15, and the drive 16 are electrically connected.
まず、図2を用いて、本実施形態に係る解析装置1のハードウェア構成の一例を説明する。図2に示すように、この解析装置1は、制御部11、記憶部12、通信インタフェース13、外部インタフェース14、入力装置15、及びドライブ16が電気的に接続されたコンピュータである。 <2-1-1. Analyst>
First, an example of the hardware configuration of the
制御部11は、CPU(Central Processing Unit)、RAM(Random Access Memory)、ROM(Read Only Memory)等を含み、情報処理に応じて各構成要素の制御を行う。記憶部12は、例えば、ハードディスクドライブ、ソリッドステートドライブ等の補助記憶装置であり、制御部11で実行されるプログラム121、概略図データ122、因果関係モデルデータ123、及び動作状態データ124等を記憶する。
The control unit 11 includes a CPU (Central Processing Unit), a RAM (Random Access Memory), a ROM (Read Only Memory), and the like, and controls each component according to information processing. The storage unit 12 is, for example, an auxiliary storage device such as a hard disk drive or a solid state drive, and stores a program 121 executed by the control unit 11, schematic diagram data 122, causal relationship model data 123, operation state data 124, and the like. To do.
プログラム121は、包装機3に生じる異常と機構との因果関係モデルを生成したり、これを表示装置2に表示すること等を行うためのプログラムである。概略図データ122は、対象となる生産設備の概略図が示されたデータであり、本実施形態においては、包装機3の概略図を示すデータである。概略図は、少なくとも因果関係モデルで示される機構の位置が分かるような包装機全体の概略図であればよく、必ずしも詳細に図でなくてもよい。また、包装機3の一部のみを示す拡大図であってもよい。
The program 121 is a program for generating a causal relationship model between an abnormality occurring in the packaging machine 3 and a mechanism, displaying the model on the display device 2, and the like. The schematic data 122 is data showing a schematic diagram of a target production facility, and in the present embodiment, is data showing a schematic diagram of the packaging machine 3. The schematic diagram may be at least a schematic diagram of the entire packaging machine so that the position of the mechanism shown in the causal relationship model can be understood, and is not necessarily a detailed diagram. Further, it may be an enlarged view showing only a part of the packaging machine 3.
因果関係モデルデータ123は、包装機3から抽出される各機構の特徴量によって構築される異常発生の因果関係モデルを示すデータである。すなわち、異常が発生するときの、機構間の因果関係を示すデータである。この解析装置1では、後述するように、包装機3から抽出される特徴量等によって因果関係モデルデータが生成されるが、外部の装置において予め生成された因果関係モデルデータを記憶することもできる。
The causal relationship model data 123 is data showing a causal relationship model of abnormal occurrence constructed by the feature amount of each mechanism extracted from the packaging machine 3. That is, it is data showing a causal relationship between mechanisms when an abnormality occurs. In this analysis device 1, as will be described later, the causal relationship model data is generated by the feature amount extracted from the packaging machine 3, but the causal relationship model data generated in advance in the external device can also be stored. ..
動作状態データ124は、包装機3の動作状態を示すデータである。詳細は、後述するが、例えば、上述した各機構の駆動において生じ得るデータ、例えば、トルク、速度、加速度、温度、圧力等の計測データとすることができる。また、機構がセンサの場合には、検出される結果、例えば、内容物WAが存在するか否かを「on」と「off」とで示す検出データとすることができる。
The operating state data 124 is data indicating the operating state of the packaging machine 3. Details will be described later, but for example, it can be data that can occur in driving each mechanism described above, for example, measurement data such as torque, speed, acceleration, temperature, and pressure. Further, when the mechanism is a sensor, the detection result can be, for example, detection data indicating whether or not the content WA exists by "on" and "off".
通信インタフェース13は、例えば、有線LAN(Local Area Network)モジュール、無線LANモジュール等であり、有線又は無線通信を行うためのインタフェースである。すなわち、通信インタフェース13は、他の装置と通信を行うように構成された通信部の一例である。本実施形態の解析装置1は、通信インタフェース13を介して包装機3と接続されている。
The communication interface 13 is, for example, a wired LAN (Local Area Network) module, a wireless LAN module, or the like, and is an interface for performing wired or wireless communication. That is, the communication interface 13 is an example of a communication unit configured to communicate with another device. The analysis device 1 of the present embodiment is connected to the packaging machine 3 via the communication interface 13.
外部インタフェース14は、外部装置と接続するためのインタフェースであり、接続する外部装置に応じて適宜構成される。本実施形態では、外部インタフェース14が、表示装置2に接続されている。なお、表示装置2は、公知の液晶ディスプレイ、タッチパネルディスプレイ等が用いられてよい。
The external interface 14 is an interface for connecting to an external device, and is appropriately configured according to the external device to be connected. In this embodiment, the external interface 14 is connected to the display device 2. As the display device 2, a known liquid crystal display, touch panel display, or the like may be used.
入力装置15は、例えば、マウス、キーボード等の入力を行うための装置である。
The input device 15 is, for example, a device for inputting a mouse, a keyboard, or the like.
ドライブ16は、例えば、CD(Compact Disk)ドライブ、DVD(Digital Versatile Disk)ドライブ等であり、記憶媒体17に記憶されたプログラムを読み込むための装置である。ドライブ16の種類は、記憶媒体17の種類に応じて適宜選択されてよい。なお、記憶部に記憶されている、プログラム121を含む各種のデータ122~125の少なくとも一部は、この記憶媒体17に記憶されていてもよい。
The drive 16 is, for example, a CD (CompactDisk) drive, a DVD (DigitalVersatileDisk) drive, or the like, and is a device for reading a program stored in the storage medium 17. The type of the drive 16 may be appropriately selected according to the type of the storage medium 17. At least a part of various data 122 to 125 including the program 121 stored in the storage unit may be stored in the storage medium 17.
記憶媒体17は、コンピュータその他装置、機械等が記録されたプログラム等の情報を読み取り可能なように、このプログラム等の情報を、電気的、磁気的、光学的、機械的又は化学的作用によって蓄積する媒体である。図2では、記憶媒体17の一例として、CD、DVD等のディスク型の記憶媒体を例示している。しかしながら、記憶媒体17の種類は、ディスク型に限定される訳ではなく、ディスク型以外であってもよい。ディスク型以外の記憶媒体として、例えば、フラッシュメモリ等の半導体メモリを挙げることができる。
The storage medium 17 stores the information of the program or the like by electrical, magnetic, optical, mechanical or chemical action so that the information of the program or the like recorded by the computer or other device, the machine or the like can be read. It is a medium to do. In FIG. 2, as an example of the storage medium 17, a disc-type storage medium such as a CD or DVD is illustrated. However, the type of the storage medium 17 is not limited to the disc type, and may be other than the disc type. Examples of storage media other than the disk type include semiconductor memories such as flash memories.
なお、解析装置1の具体的なハードウェア構成に関して、実施形態に応じて、適宜、構成要素の省略、置換及び追加が可能である。例えば、制御部11は、複数のプロセッサを含んでもよい。解析装置1は、複数台の情報処理装置で構成されてもよい。また、解析装置1には、提供されるサービス専用に設計された情報処理装置の他、汎用のサーバ装置等が用いられてよい。
Regarding the specific hardware configuration of the analysis device 1, the components can be omitted, replaced, or added as appropriate according to the embodiment. For example, the control unit 11 may include a plurality of processors. The analysis device 1 may be composed of a plurality of information processing devices. Further, as the analysis device 1, a general-purpose server device or the like may be used in addition to the information processing device designed exclusively for the provided service.
<2-1-2.包装機>
次に、図3を用いて、本実施形態に係る包装機3のハードウェア構成の一例を説明する。図3は、本実施形態に係る包装機3のハードウェア構成の一例を模式的に例示する。包装機3は、いわゆる横ピロー包装機であり、食品(乾燥麺等)、文房具(消しゴム等)等の内容物WAを包装する装置である。但し、内容物WAの種類は、実施の形態に応じて適宜選択可能であり、特には限定されない。この包装機3は、包装フィルムが巻き取られたフィルムロール30と、包装フィルムを搬送するフィルム搬送部31と、内容物WAを搬送する内容物搬送部32と、内容物を包装フィルムで放送する製袋部33と、を備えている。 <2-1-2. Packaging machine >
Next, an example of the hardware configuration of thepackaging machine 3 according to the present embodiment will be described with reference to FIG. FIG. 3 schematically illustrates an example of the hardware configuration of the packaging machine 3 according to the present embodiment. The wrapping machine 3 is a so-called horizontal pillow wrapping machine, which is a device for wrapping contents WA such as food (dried noodles, etc.) and stationery (eraser, etc.). However, the type of the content WA can be appropriately selected according to the embodiment, and is not particularly limited. The wrapping machine 3 broadcasts the film roll 30 on which the wrapping film is wound, the film transport unit 31 for transporting the wrapping film, the content transport unit 32 for transporting the content WA, and the content on the packaging film. It includes a bag making section 33.
次に、図3を用いて、本実施形態に係る包装機3のハードウェア構成の一例を説明する。図3は、本実施形態に係る包装機3のハードウェア構成の一例を模式的に例示する。包装機3は、いわゆる横ピロー包装機であり、食品(乾燥麺等)、文房具(消しゴム等)等の内容物WAを包装する装置である。但し、内容物WAの種類は、実施の形態に応じて適宜選択可能であり、特には限定されない。この包装機3は、包装フィルムが巻き取られたフィルムロール30と、包装フィルムを搬送するフィルム搬送部31と、内容物WAを搬送する内容物搬送部32と、内容物を包装フィルムで放送する製袋部33と、を備えている。 <2-1-2. Packaging machine >
Next, an example of the hardware configuration of the
包装フィルムは、例えば、ポリエチレンフィルム等の樹脂フィルムとすることができる。フィルムロール30は巻き芯を備えており、包装フィルムはその巻き芯に巻き取られている。巻き芯は軸周りに回転可能に支持されており、これにより、フィルムロール30は、回転しながら包装フィルムを繰り出すことができるように構成されている。
The packaging film can be, for example, a resin film such as a polyethylene film. The film roll 30 includes a winding core, and the packaging film is wound around the winding core. The winding core is rotatably supported around the axis, whereby the film roll 30 is configured so that the packaging film can be unwound while rotating.
フィルム搬送部31は、サーボモータ(サーボ1)311により駆動される駆動ローラと、この駆動ローラから回転力を付与される受動ローラ312と、包装フィルムにテンションをかけながらガイドする複数のプーリ313と、を備えている。これにより、フィルム搬送部31は、フィルムロール30から包装フィルムを繰り出し、繰り出した包装フィルムを弛ませることなく製袋部33に搬送するように構成されている。
The film transport unit 31 includes a drive roller driven by a servomotor (servo 1) 311, a passive roller 312 to which a rotational force is applied from the drive roller, and a plurality of pulleys 313 that guide the packaging film while applying tension. , Is equipped. As a result, the film transport section 31 is configured to feed the packaging film from the film roll 30 and transport the delivered packaging film to the bag making section 33 without loosening it.
内容物搬送部32は、包装対象となる内容物WAを搬送するコンベア321と、コンベア321を駆動するサーボモータ(サーボ2)322と、を備えている。図3に例示されるように、内容物搬送部32は、フィルム搬送部31の下方を経て、製袋部33に連結している。これにより、内容物搬送部32により搬送される内容物WAは、製袋部33に供給されるとともに、フィルム搬送部31から供給された包装フィルムにより包装される。また、コンベア321の下流の情報には、内容物WAの位置を検知するファイバセンサ(センサ1)324が設けられている。さらに、コンベア321の下方には、内容物WAの乗り上げ等を検知するファイバセンサ(センサ2)325が設けられている。これらセンサ1,2により、内容物WAが正しく包装されるために、正しい位置で搬送されているか否かを検知する。
The content transfer unit 32 includes a conveyor 321 that conveys the content WA to be packaged, and a servomotor (servo 2) 322 that drives the conveyor 321. As illustrated in FIG. 3, the content transporting section 32 is connected to the bag making section 33 via the lower part of the film transporting section 31. As a result, the content WA transported by the content transport unit 32 is supplied to the bag making unit 33 and packaged by the packaging film supplied from the film transport unit 31. Further, in the information downstream of the conveyor 321, a fiber sensor (sensor 1) 324 for detecting the position of the content WA is provided. Further, below the conveyor 321 is provided a fiber sensor (sensor 2) 325 for detecting the riding of the contents WA and the like. These sensors 1 and 2 detect whether or not the contents WA are transported in the correct position in order to be correctly packaged.
製袋部33は、コンベア331と、コンベア331を駆動するサーボモータ(サーボ3)332と、包装フィルムを搬送方向にシールするセンターシール部333と、包装フィルムを搬送方向の両端側で切断し、各端部でシールするエンドシール部334と、を備えている。
The bag making section 33 cuts the conveyor 331, the servo motor (servo 3) 332 that drives the conveyor 331, the center seal section 333 that seals the packaging film in the transport direction, and the packaging film on both ends in the transport direction. It includes an end seal portion 334 that seals at each end portion.
コンベア331は、内容物搬送部32から搬送された内容物WAとフィルム搬送部31から供給された包装フィルムとを搬送する。フィルム搬送部31から供給された包装フィルムは、幅方向の両側端縁部同士が重なるように適宜折り曲げられつつ、センターシール部333に供給される。センターシール部333は、例えば、左右一対の加熱ローラ(ヒータ1,2)により構成されており、折り曲げられた包装フィルムの両側端縁部を加熱により搬送方向に沿ってシールする。これにより、包装フィルムは、筒状に形成される。内容物WAは、この筒状に形成された包装フィルム内に投入される。また、エンドシール部334の上流側には、コンベア331の上方に、内容物WAの位置を検知するファイバセンサ(センサ3)336が設けられている。
The conveyor 331 conveys the content WA conveyed from the content transfer unit 32 and the packaging film supplied from the film transfer unit 31. The packaging film supplied from the film transport unit 31 is supplied to the center seal unit 333 while being appropriately bent so that both side edge portions in the width direction overlap each other. The center seal portion 333 is composed of, for example, a pair of left and right heating rollers (heaters 1 and 2), and seals both side edge portions of the bent packaging film along the transport direction by heating. As a result, the packaging film is formed in a tubular shape. The content WA is put into the packaging film formed in this tubular shape. Further, on the upstream side of the end seal portion 334, a fiber sensor (sensor 3) 336 that detects the position of the content WA is provided above the conveyor 331.
一方、エンドシール部334は、例えば、サーボモータ335により駆動されるローラと、ローラの回転によって開閉する一対のカッタと、各カッタの両側に設けられるヒータ(ヒータ3)と、を有している。これらにより、エンドシール部334は、搬送方向に直交する方向に筒状の包装フィルムをカットするとともに、カットした部分で加熱によりシールすることができるように構成されている。このエンドシール部334を通過すると、筒状に形成された包装フィルムの先端部分は、搬送方向の両側でシールされ、後続から分離されて、内容物WAを内包する包装体WBとなる。
On the other hand, the end seal portion 334 has, for example, a roller driven by a servomotor 335, a pair of cutters that open and close by rotation of the rollers, and heaters (heaters 3) provided on both sides of each cutter. .. As a result, the end seal portion 334 is configured so that the tubular packaging film can be cut in the direction orthogonal to the transport direction and can be sealed by heating at the cut portion. After passing through the end seal portion 334, the tip portion of the packaging film formed in a tubular shape is sealed on both sides in the transport direction and separated from the subsequent portion to become a packaging body WB containing the contents WA.
<2-1-3.包装工程>
以上の包装機3は、次のような工程で、内容物WAの包装を行うことができる。すなわち、フィルム搬送部31によって、フィルムロール30から包装フィルムを繰り出す。また、内容物搬送部32によって、包装対象となる内容物WAを搬送する。次に、製袋部33のセンターシール部333によって、繰り出された包装フィルムを筒状に形成する。そして、形成した筒状の包装フィルムに内容物WAを投入した上で、エンドシール部334によって、搬送方向に直交する方向に筒状の包装フィルムをカットすると共に、カットした部分の搬送方向の両側で加熱によりシールする。これにより、内容物WAを内包する横ピロー型の包装体WBが形成される。すなわち、内容物WAの包装が完了する。 <2-1-3. Packaging process>
The above-mentionedpackaging machine 3 can wrap the contents WA in the following steps. That is, the film transport unit 31 feeds out the packaging film from the film roll 30. In addition, the content transport unit 32 transports the content WA to be packaged. Next, the center seal portion 333 of the bag making portion 33 forms the unwound packaging film into a tubular shape. Then, after the content WA is put into the formed tubular packaging film, the tubular packaging film is cut in the direction orthogonal to the transport direction by the end seal portion 334, and both sides of the cut portion in the transport direction are cut. Seal by heating with. As a result, a horizontal pillow type package WB containing the content WA is formed. That is, the packaging of the contents WA is completed.
以上の包装機3は、次のような工程で、内容物WAの包装を行うことができる。すなわち、フィルム搬送部31によって、フィルムロール30から包装フィルムを繰り出す。また、内容物搬送部32によって、包装対象となる内容物WAを搬送する。次に、製袋部33のセンターシール部333によって、繰り出された包装フィルムを筒状に形成する。そして、形成した筒状の包装フィルムに内容物WAを投入した上で、エンドシール部334によって、搬送方向に直交する方向に筒状の包装フィルムをカットすると共に、カットした部分の搬送方向の両側で加熱によりシールする。これにより、内容物WAを内包する横ピロー型の包装体WBが形成される。すなわち、内容物WAの包装が完了する。 <2-1-3. Packaging process>
The above-mentioned
なお、包装機3の駆動の制御は、包装機3とは別個に設けたPLCなどで行うこともできる。この場合、上述した動作状態データ124は、PLCから取得することができる。また、上記のように構成された包装機3では、一例として、異常の因果関係を構築するために、10個の機構が設定されている。すなわち、上述したサーボ1~4,ヒータ1~3,及びセンサ1~3が機構として設定され、異常が発生するときの、これら機構間の因果関係が因果関係モデルとして構築される。詳細は後述する。
Note that the drive of the packaging machine 3 can be controlled by a PLC or the like provided separately from the packaging machine 3. In this case, the above-mentioned operating state data 124 can be acquired from the PLC. Further, in the packaging machine 3 configured as described above, as an example, 10 mechanisms are set in order to establish a causal relationship of abnormality. That is, the above-mentioned servos 1 to 4, heaters 1 to 3, and sensors 1 to 3 are set as mechanisms, and a causal relationship between these mechanisms when an abnormality occurs is constructed as a causal relationship model. Details will be described later.
<2-2.機能構成>
次に、解析装置1の機能構成(ソフトウエア構成)を説明する。図4は、本実施形態に係る解析装置1の機能構成の一例である。解析装置1の制御部11は、記憶部12に記憶されたプログラム8をRAMに展開する。そして、制御部11は、RAMに展開されたプログラム8をCPUにより解釈及び実行して、各構成要素を制御する。これによって、図4に示すように、本実施形態に係る解析装置1は、特徴量取得部111、モデル構築部112、及び表示制御部113を備えるコンピュータとして機能する。 <2-2. Functional configuration>
Next, the functional configuration (software configuration) of theanalysis device 1 will be described. FIG. 4 is an example of the functional configuration of the analysis device 1 according to the present embodiment. The control unit 11 of the analysis device 1 expands the program 8 stored in the storage unit 12 into the RAM. Then, the control unit 11 interprets and executes the program 8 expanded in the RAM by the CPU to control each component. As a result, as shown in FIG. 4, the analysis device 1 according to the present embodiment functions as a computer including a feature amount acquisition unit 111, a model construction unit 112, and a display control unit 113.
次に、解析装置1の機能構成(ソフトウエア構成)を説明する。図4は、本実施形態に係る解析装置1の機能構成の一例である。解析装置1の制御部11は、記憶部12に記憶されたプログラム8をRAMに展開する。そして、制御部11は、RAMに展開されたプログラム8をCPUにより解釈及び実行して、各構成要素を制御する。これによって、図4に示すように、本実施形態に係る解析装置1は、特徴量取得部111、モデル構築部112、及び表示制御部113を備えるコンピュータとして機能する。 <2-2. Functional configuration>
Next, the functional configuration (software configuration) of the
特徴量取得部111は、包装機3が包装体WBを正常に形成した正常時、及び形成される包装体WBに異常が生じた異常時それぞれについて、包装機3の動作状態を示す動作状態データ124から算出される複数種類の特徴量の値を取得する。モデル構築部112は、取得した正常時及び異常時それぞれの各種類の特徴量の値から、形成される包装体WBに生じる異常と各種類の特徴量との関連度を導出する所定のアルゴリズムに基づいて、取得した複数種類の特徴量の中から異常の予測に有効な特徴量を選択する。そして、選択した特徴量を用いて、異常が生じるときの、機構間の因果関係を示す因果関係モデル123を構築する。
The feature amount acquisition unit 111 is an operating state data indicating the operating state of the packaging machine 3 at the time when the packaging machine 3 normally forms the packaging body WB and at the time when an abnormality occurs in the formed packaging body WB. The values of a plurality of types of features calculated from 124 are acquired. The model construction unit 112 uses the acquired values of the features of each type during normal and abnormal times to derive a degree of association between the abnormalities occurring in the formed package WB and the features of each type. Based on this, a feature amount effective for predicting anomalies is selected from the acquired multiple types of feature amounts. Then, using the selected features, a causal relationship model 123 showing a causal relationship between the mechanisms when an abnormality occurs is constructed.
表示制御部113は、上述した包装機3の概略図、因果関係モデル、各種の特徴量等を表示装置2の画面21に表示する機能を有する。その他、表示制御部113は、表示装置2の画面21に各種の情報を表示するための制御を行う。
The display control unit 113 has a function of displaying the above-described schematic diagram of the packaging machine 3, a causal relationship model, various feature amounts, and the like on the screen 21 of the display device 2. In addition, the display control unit 113 controls to display various information on the screen 21 of the display device 2.
解析装置1の各機能に関しては後述する動作例で詳細に説明する。なお、本実施形態では、以上の機能がいずれも汎用のCPUによって実現される例について説明している。しかしながら、以上の機能の一部又は全部が、1又は複数の専用のプロセッサにより実現されてもよい。また、解析装置1の機能構成に関しては、実施形態に応じて、適宜、機能の省略、置換及び追加が行われてもよい。
Each function of the analysis device 1 will be described in detail in an operation example described later. In this embodiment, an example in which all of the above functions are realized by a general-purpose CPU is described. However, some or all of the above functions may be realized by one or more dedicated processors. Further, regarding the functional configuration of the analysis device 1, the functions may be omitted, replaced, or added as appropriate according to the embodiment.
<3.動作例>
次に、上記のように構成された生産システムの動作例を説明する。 <3. Operation example>
Next, an operation example of the production system configured as described above will be described.
次に、上記のように構成された生産システムの動作例を説明する。 <3. Operation example>
Next, an operation example of the production system configured as described above will be described.
<3-1.因果関係モデルの作成>
まず、図5を用いて、解析装置が因果関係モデルを作成する際の処理手順について説明する。図5は、因果関係モデルを作成する際の解析装置の処理手順の一例を例示する。 <3-1. Creating a causal relationship model>
First, with reference to FIG. 5, a processing procedure when the analyzer creates a causal relationship model will be described. FIG. 5 illustrates an example of the processing procedure of the analyzer when creating a causal relationship model.
(ステップS101)
最初のステップS101では、解析装置1の制御部11は、特徴量取得部111として機能し、包装機3が包装体WBを正常に形成した正常時、及び形成される包装体WBに異常が生じた異常時それぞれについて、包装機3の動作状態を示す動作状態データ124から算出される複数種類の特徴量の値を取得する。 (Step S101)
In the first step S101, thecontrol unit 11 of the analysis device 1 functions as the feature amount acquisition unit 111, and an abnormality occurs in the normal time when the packaging machine 3 normally forms the package WB and in the formed package WB. For each of the abnormal cases, the values of a plurality of types of features calculated from the operating state data 124 indicating the operating state of the packaging machine 3 are acquired.
最初のステップS101では、解析装置1の制御部11は、特徴量取得部111として機能し、包装機3が包装体WBを正常に形成した正常時、及び形成される包装体WBに異常が生じた異常時それぞれについて、包装機3の動作状態を示す動作状態データ124から算出される複数種類の特徴量の値を取得する。 (Step S101)
In the first step S101, the
具体的には、まず、制御部11は、正常時と異常時とに分類して、動作状態データ124を収集する。収集する動作状態データ124の種類は、包装機3の状態を示すデータであれば、特に限定されないが、本実施形態においては、上述した各機構の駆動において生じ得るデータ、例えば、トルク、速度、加速度、温度、圧力等の計測データとすることができる。
Specifically, first, the control unit 11 classifies the normal time and the abnormal time, and collects the operation state data 124. The type of operating state data 124 to be collected is not particularly limited as long as it is data indicating the state of the packaging machine 3, but in the present embodiment, data that can occur in driving each mechanism described above, for example, torque, speed, and so on. It can be measured data such as acceleration, temperature, and pressure.
機構がセンサの場合には、ON時間、OFF時間、ターンON時間、ターンOFF時間などの計測データを動作状態データ124とすることができる。ON時間及びOFF時間は、後述する図6に示すように、対象とするフレーム内での制御信号がONまたはOFFとなっている総時間であり、ターンON時間及びターンOFF時間は、対象とするフレーム内で制御信号が初めてONまたはOFFになるまでの時間である。その他、制御部11は、各センサの検出結果、例えば、内容物WAが存在するか否かを「on」と「off」とで示す検出データを動作状態データ124として取得することができる。なお、収集した動作状態データ124は、記憶部12に蓄積してもよいし、外部の記憶装置に蓄積してもよい。
When the mechanism is a sensor, measurement data such as ON time, OFF time, turn ON time, and turn OFF time can be used as operation state data 124. As shown in FIG. 6 described later, the ON time and the OFF time are the total times during which the control signal in the target frame is ON or OFF, and the turn ON time and the turn OFF time are the targets. This is the time until the control signal is turned ON or OFF for the first time in the frame. In addition, the control unit 11 can acquire the detection result of each sensor, for example, the detection data indicating whether or not the content WA exists as “on” and “off” as the operation state data 124. The collected operation state data 124 may be stored in the storage unit 12 or may be stored in an external storage device.
次に、制御部11は、特徴量を算出する処理範囲を規定するため、収集した動作状態データ124をフレーム毎に分割する。例えば、制御部11は、動作状態データ124を一定時間長のフレーム毎に分割してもよい。ただし、包装機3は、必ずしも一定時間間隔で動作しているとは限らない。そのため、動作状態データ124を一定時間長のフレーム毎に分割すると、各フレームに反映される包装機3の動作がずれてしまう可能性がある。
Next, the control unit 11 divides the collected operation state data 124 into frames in order to define the processing range for calculating the feature amount. For example, the control unit 11 may divide the operation state data 124 into frames having a fixed time length. However, the packaging machine 3 does not always operate at regular time intervals. Therefore, if the operation state data 124 is divided into frames having a fixed time length, the operation of the packaging machine 3 reflected in each frame may be deviated.
そこで、本実施形態では、制御部11は、動作状態データ124をタクト時間毎にフレーム分割する。タクト時間は、製品を所定個数分生産する、すなわち、包装体WBを所定個数分形成するのにかかる時間である。このタクト時間は、包装機3を制御する信号、例えば、包装機3の各サーボモータ等の動作を制御する制御信号に基づいて特定することができる。
Therefore, in the present embodiment, the control unit 11 divides the operation state data 124 into frames for each tact time. The takt time is the time required to produce a predetermined number of products, that is, to form a predetermined number of packages WB. This takt time can be specified based on a signal that controls the packaging machine 3, for example, a control signal that controls the operation of each servomotor of the packaging machine 3.
図6を用いて、制御信号とタクト時間との関係について説明する。図6は、制御信号とタクト時間との関係を模式的に例示する。図6に示すように、包装機3のような製品の生産を繰り返す生産設備に対する制御信号は、所定個数分の製品の生産に応じて「on」と「off」とが周期的に表れるパルス信号になっている。
The relationship between the control signal and the takt time will be described with reference to FIG. FIG. 6 schematically illustrates the relationship between the control signal and the takt time. As shown in FIG. 6, the control signal for a production facility that repeats the production of products such as the packaging machine 3 is a pulse signal in which "on" and "off" appear periodically according to the production of a predetermined number of products. It has become.
例えば、図6に示す制御信号では、1つの包装体WBを形成する間に、「on」と「off」とが1回ずつ表れている。そこで、制御部11は、この制御信号を包装機3から取得し、取得した制御信号の立ち上がり(「on」)から次の立ち上がり(「on」)までの時間をタクト時間とすることができる。そして、制御部11は、図6に示すように、タクト時間毎に動作状態データ124をフレームに分割することができる。
For example, in the control signal shown in FIG. 6, "on" and "off" appear once while forming one package WB. Therefore, the control unit 11 can acquire this control signal from the packaging machine 3, and set the time from the rise (“on”) of the acquired control signal to the next rise (“on”) as the takt time. Then, as shown in FIG. 6, the control unit 11 can divide the operation state data 124 into frames for each takt time.
なお、制御信号の種類は、包装機3を制御するのに利用可能な信号であれば、特に限定されなくてもよい。例えば、包装機3が、包装フィルムに付されたマークを検知するためのセンサを備えており、このセンサの出力信号を包装フィルムの送り量の調節に利用する場合には、このセンサの出力信号を制御信号として利用してもよい。
The type of control signal is not particularly limited as long as it is a signal that can be used to control the packaging machine 3. For example, when the packaging machine 3 is provided with a sensor for detecting a mark attached to the packaging film and the output signal of this sensor is used for adjusting the feed amount of the packaging film, the output signal of this sensor is used. May be used as a control signal.
次に、制御部11は、動作状態データ124の各フレームから特徴量の値を算出する。特徴量の種類は、生産設備の特徴を示すものであれば、特に限定されなくてもよい。
Next, the control unit 11 calculates the value of the feature amount from each frame of the operation state data 124. The type of feature quantity is not particularly limited as long as it indicates the characteristics of the production equipment.
例えば、動作状態データ124が上記計測データのような量的データ(図6の物理量データ)である場合には、制御部11は、フレーム内の振幅、最大値、最小値、平均値、分散値、標準偏差、自己相関係数、フーリエ変換により得られるパワースペクトルの最大値、歪度、尖度等を特徴量として算出してもよい。
For example, when the operation state data 124 is quantitative data (physical quantity data in FIG. 6) such as the measurement data, the control unit 11 controls the amplitude, maximum value, minimum value, average value, and dispersion value in the frame. , Standard deviation, autocorrelation coefficient, maximum value of power spectrum obtained by Fourier transform, distortion, kurtosis, etc. may be calculated as feature quantities.
また、例えば、動作状態データ124が上記検出データのような質的データ(図6のパルスデータ)である場合には、制御部11は、各フレーム内の「on」時間、「off」時間、Duty比、「on」回数、「off」回数、等を特徴量として算出してもよい。
Further, for example, when the operation state data 124 is qualitative data (pulse data in FIG. 6) such as the detection data, the control unit 11 has an “on” time, an “off” time, in each frame. The duty ratio, the number of “on” times, the number of “off” times, and the like may be calculated as feature quantities.
さらに、特徴量は、単一の動作状態データ124からだけではなく、複数件の動作状態データ124から導出してもよい。例えば、制御部11は、2種類の動作状態データ124の対応するフレーム同士の相互相関係数、比率、差分、同期のずれ量、距離、等を特徴量として算出してもよい。
Further, the feature amount may be derived not only from a single operating state data 124 but also from a plurality of operating state data 124. For example, the control unit 11 may calculate the mutual correlation coefficient, ratio, difference, synchronization deviation amount, distance, and the like between the corresponding frames of the two types of operation state data 124 as feature quantities.
制御部11は、動作状態データ124から上記のような特徴量を複数種類算出する。これにより、制御部11は、正常時及び異常時それぞれについて、動作状態データ124から算出される複数種類の特徴量の値を取得することができる。なお、動作状態データ124の収集から特徴量の値の算出までの処理は、解析装置1ではなく、包装機3またはそれを制御する各種の装置で行うようにしてもよい。また、制御部11は、各種類の特徴量の値を、例えば、閾値より高い状態を「1」又は「high」、閾値を低い状態を「0」又は「low」というように離散化してもよい。
The control unit 11 calculates a plurality of types of features as described above from the operation state data 124. As a result, the control unit 11 can acquire the values of a plurality of types of features calculated from the operation state data 124 for each of the normal state and the abnormal time. The processing from the collection of the operation state data 124 to the calculation of the value of the feature amount may be performed not by the analysis device 1 but by the packaging machine 3 or various devices that control the packaging machine 3. Further, even if the control unit 11 discretizes the value of each type of feature amount, for example, a state higher than the threshold value is "1" or "high", and a state lower than the threshold value is "0" or "low". Good.
(ステップS102)
次のステップS102では、制御部11は、モデル構築部112として機能し、ステップS101で取得した正常時及び異常時それぞれの各種類の特徴量の値から、形成される包装体WBに生じる異常と各種類の特徴量との関連度を特定する所定のアルゴリズムに基づいて、取得した複数種類の特徴量の中から異常の予測に有効な特徴量を選択する。 (Step S102)
In the next step S102, thecontrol unit 11 functions as the model construction unit 112, and the abnormality that occurs in the package WB formed from the values of the respective types of features in the normal state and the abnormal state acquired in step S101. Based on a predetermined algorithm that specifies the degree of association with each type of feature amount, a feature amount effective for predicting anomalies is selected from a plurality of types of acquired feature amounts.
次のステップS102では、制御部11は、モデル構築部112として機能し、ステップS101で取得した正常時及び異常時それぞれの各種類の特徴量の値から、形成される包装体WBに生じる異常と各種類の特徴量との関連度を特定する所定のアルゴリズムに基づいて、取得した複数種類の特徴量の中から異常の予測に有効な特徴量を選択する。 (Step S102)
In the next step S102, the
所定のアルゴリズムは、例えば、ベイジアンネットワークを利用して構成されてもよい。ベイジアンネットワークは、複数の確率変数間の因果関係を有向非巡回グラフ構造で表現すると共に、各確率変数間の因果関係を条件付確率で表現するグラフィカルモデリングの1つである。
The predetermined algorithm may be configured using, for example, a Bayesian network. The Bayesian network is one of the graphical modeling in which the causal relationship between a plurality of random variables is expressed by a directed acyclic graph structure and the causal relationship between each random variable is expressed by a conditional probability.
制御部11は、取得した各特徴量及び包装体WBの状態を確率変数として扱って、すなわち、取得した各特徴量及び包装体WBの状態を各ノードに設定して、ベイジアンネットワークを構築することで、各特徴量と包装体WBの状態との因果関係を導出することができる。ベイジアンネットワークの構築には、公知の方法が用いられてよい。例えば、ベイジアンネットワークの構築には、Greedy Search アルゴリズム、Stingy Search アルゴリズム、全探索法等の構造学習アルゴリズムを用いることができる。また、構築されるベイジアンネットワークの評価基準には、AIC(Akaike ' s. Information Criterion)、C4.5、CHM(Cooper Herskovits Measure)、MDL(Minimum Description Length)、ML(Maximum Likelihood)等を用いることができる。また、ベイジアンネットワークの構築に利用する学習データ(動作状態データ124)に欠損値が含まれる場合の処理方法として、ペアワイズ法、リストワイズ法等を用いることができる。
The control unit 11 treats each acquired feature amount and the state of the package WB as a random variable, that is, sets each acquired feature amount and the state of the package WB in each node to construct a Bayesian network. Therefore, the causal relationship between each feature amount and the state of the package WB can be derived. A known method may be used for constructing the Bayesian network. For example, a structural learning algorithm such as a Greedy Search algorithm, a Stingy Search algorithm, or a total search method can be used to construct a Bayesian network. In addition, AIC (Akaike's. Information Criterion), C4.5, CHM (Cooper Herskovits Measurement), MDL (Minimum Description Length), ML (Maximum Likelihood), etc. should be used as the evaluation criteria for the Bayesian network to be constructed. Can be done. Further, a pairwise method, a wristwise method, or the like can be used as a processing method when a missing value is included in the learning data (operating state data 124) used for constructing the Bayesian network.
例えば、図7Aは、革ベルトの摩耗が異常イベントであるときの因果関係モデルを示している。すなわち、サーボ1の特徴量であるトルク平均値と位置の標準偏差が、サーボ2の特徴量である速度平均値とトルク最大値に影響を与え、さらにこれらがサーボ4のトルク平均値に影響を与える、という因果関係モデルが構築される。
For example, FIG. 7A shows a causal relationship model when the wear of the leather belt is an abnormal event. That is, the torque average value and the standard deviation of the position, which are the feature amounts of the servo 1, affect the speed average value and the torque maximum value, which are the feature amounts of the servo 2, and these affect the torque average value of the servo 4. A causal relationship model of giving is constructed.
図7Bは、内容物搬送部32のコンベア321のチェーンの緩みが異常イベントであるときの因果関係モデルを示している。すなわち、センサ2の特徴量であるON時間が、センサ3の特徴量であるターンON時間に影響を与え、さらにこれがサーボ4のトルク平均値に影響を与える、という因果関係モデルが構築される。
FIG. 7B shows a causal relationship model when the looseness of the chain of the conveyor 321 of the content transport unit 32 is an abnormal event. That is, a causal relationship model is constructed in which the ON time, which is the feature amount of the sensor 2, affects the turn ON time, which is the feature amount of the sensor 3, and further affects the torque average value of the servo 4.
図7Cは、包装フィルムのシール不良が異常イベントであるときの因果関係モデルを示している。この異常イベントについては、サーボ4のトルク平均値のみが原因であるという因果関係モデルが構築される。このように構築された因果関係モデルは、因果関係モデルデータ123として、記憶部12に記憶される。
FIG. 7C shows a causal relationship model when a defective seal of the packaging film is an abnormal event. A causal relationship model is constructed in which only the average torque value of the servo 4 is the cause of this abnormal event. The causal relationship model constructed in this way is stored in the storage unit 12 as the causal relationship model data 123.
なお、取得した各特徴量及び包装体WBの状態を確率変数として取り扱う方法は、実施の形態に応じて適宜設定可能である。例えば、包装体WBが正常である事象を「0」、包装体WBに異常が発生している事象を「1」として、それぞれの事象に確率を対応させることにより、包装体WBの状態を確率変数とみなすことができる。また、例えば、各特徴量の値が閾値以下である事象を「0」、各特徴量の値が閾値を超えている事象を「1」として、それぞれの事象に確率を対応させることにより、各特徴量の状態を確率変数とみなすことができる。ただし、各特徴量に対して設定する状態数は、2つに限定されなくてもよく、3つ以上であってもよい。
The method of handling each acquired feature amount and the state of the package WB as a random variable can be appropriately set according to the embodiment. For example, the state of the package WB is probable by associating the probability with each event by setting the event that the package WB is normal as "0" and the event that the package WB is abnormal as "1". It can be regarded as a variable. Further, for example, an event in which the value of each feature amount is equal to or less than the threshold value is set to "0", an event in which the value of each feature amount exceeds the threshold value is set to "1", and the probability is associated with each event. The state of the feature quantity can be regarded as a random variable. However, the number of states set for each feature amount is not limited to two, and may be three or more.
<3-2.因果関係モデルの表示>
次に、上記のように構築された因果関係モデルの表示について説明する。このとき、解析装置1の制御部11は、表示制御部113として機能する。表示制御部113は、以下に示す画面21の表示を制御する。まず、表示制御部113は、記憶部12から読み出した概略図122と、上述した因果関係モデル123とを重ねて表示装置2の画面21に表示する。図8は、本実施形態における異常イベントの原因要素となり得る機構を、概略図に重ね合わせた図である。ここでは、上述したように、因果関係モデルのノードであるサーボ1~4,ヒータ1~3,及びセンサ1~3を、概略図において、それらが設置される位置に配置している。そして、次に説明する表示装置2の画面21においては、ユーザによって選択された異常イベントに応じて、これらの機構の中から、因果関係モデルを構築する機構がノードとして選択されるとともに、因果関係を示す矢印が示されたエッジがノードとともに表示される。 <3-2. Display of causal relationship model>
Next, the display of the causal relationship model constructed as described above will be described. At this time, thecontrol unit 11 of the analysis device 1 functions as the display control unit 113. The display control unit 113 controls the display of the screen 21 shown below. First, the display control unit 113 superimposes the schematic diagram 122 read from the storage unit 12 and the causal relationship model 123 described above and displays them on the screen 21 of the display device 2. FIG. 8 is a diagram in which a mechanism that can be a causative element of an abnormal event in the present embodiment is superimposed on a schematic diagram. Here, as described above, the servos 1 to 4, heaters 1 to 3, and sensors 1 to 3, which are the nodes of the causal relationship model, are arranged at the positions where they are installed in the schematic diagram. Then, on the screen 21 of the display device 2 described below, the mechanism for constructing the causal relationship model is selected as a node from among these mechanisms according to the abnormal event selected by the user, and the causal relationship is selected. An edge with an arrow indicating is displayed with the node.
次に、上記のように構築された因果関係モデルの表示について説明する。このとき、解析装置1の制御部11は、表示制御部113として機能する。表示制御部113は、以下に示す画面21の表示を制御する。まず、表示制御部113は、記憶部12から読み出した概略図122と、上述した因果関係モデル123とを重ねて表示装置2の画面21に表示する。図8は、本実施形態における異常イベントの原因要素となり得る機構を、概略図に重ね合わせた図である。ここでは、上述したように、因果関係モデルのノードであるサーボ1~4,ヒータ1~3,及びセンサ1~3を、概略図において、それらが設置される位置に配置している。そして、次に説明する表示装置2の画面21においては、ユーザによって選択された異常イベントに応じて、これらの機構の中から、因果関係モデルを構築する機構がノードとして選択されるとともに、因果関係を示す矢印が示されたエッジがノードとともに表示される。 <3-2. Display of causal relationship model>
Next, the display of the causal relationship model constructed as described above will be described. At this time, the
図9Aは、因果関係モデルを示す表示装置2の画面21の例である。この画面21は、上述した入力装置15により操作することができる。この画面21には、左上に異常イベントを選択するための選択ボックス211が表示され、プルダウンメニューにより、異常イベントを選択できるようになっている。この例では、革ベルトの摩耗、チェーンの緩み、及びシール不良が異常イベントとして示され、この中から革ベルトの摩耗が選択されている。
FIG. 9A is an example of the screen 21 of the display device 2 showing the causal relationship model. This screen 21 can be operated by the input device 15 described above. On this screen 21, a selection box 211 for selecting an abnormal event is displayed on the upper left, and an abnormal event can be selected from a pull-down menu. In this example, leather belt wear, chain loosening, and poor sealing are shown as abnormal events, from which leather belt wear is selected.
この選択ボックス211の下側には、包装機の概略図と因果関係モデルとが重ねられた異常原因図212が表示されている。図9Aの例では、異常イベントが革ベルトの摩耗であるときの異常原因図が表示されている。そして、この異常原因図212の左下には、選択された異常イベントに応じ、原因要素となる機構とその特徴量とが示されたリスト213が表示されている。ユーザは、このリスト213の中から、いずれかの機構及び特徴量を選択することができ、いずれかを選択すると、異常原因図212の中の対応する機構が強調表示される。この例では、リスト213の中から(サーボ1-トルク平均値)が選択されており、これによって、異常原因図212の中のサーボ1が強調表示される。強調表示は、種々の方法が可能であり、着色、点滅等、他のノードと区別できるように表示されればよい。
Below this selection box 211, an abnormality cause diagram 212 in which a schematic diagram of the packaging machine and a causal relationship model are superimposed is displayed. In the example of FIG. 9A, the abnormality cause diagram when the abnormality event is the wear of the leather belt is displayed. Then, in the lower left of the abnormality cause diagram 212, a list 213 showing the mechanism that is the cause element and the feature amount thereof is displayed according to the selected abnormality event. The user can select any of the mechanisms and features from this list 213, and when one is selected, the corresponding mechanism in the abnormality cause diagram 212 is highlighted. In this example, (servo 1-torque average value) is selected from Listing 213, which highlights Servo 1 in the cause of abnormality FIG. 212. Various methods can be used for highlighting, and it may be displayed so as to be distinguishable from other nodes such as coloring and blinking.
さらに、リスト213の左側には、選択された特徴量の経時変化がグラフ214によって表示されている。この例では、(サーボ1-トルク平均値)が選択されているため、その経時的な変化を示す折れ線グラフ214が表示されている。
Further, on the left side of the list 213, the change with time of the selected feature amount is displayed by the graph 214. In this example, since (servo 1-torque average value) is selected, a line graph 214 showing the change over time is displayed.
図9Bは、ボックス211において、チェーンの緩みが異常イベンとして表示された例を示している。これにより、リスト213には、チェーンの緩みの原因要素となる機構と特徴量が表示されている。ここでは、(サーボ4-トルク平均値)が選択されているため、異常原因図212のサーボ4が強調されるとともに、(サーボ4-トルク平均値)の経時的な変化を示す折れ線グラフ214が表示されている。
FIG. 9B shows an example in which the looseness of the chain is displayed as an abnormal event in the box 211. As a result, the mechanism and the feature amount that cause the loosening of the chain are displayed in the list 213. Here, since (servo 4-torque average value) is selected, the servo 4 of the abnormality cause FIG. 212 is emphasized, and the line graph 214 showing the change over time of (servo 4-torque average value) is shown. It is displayed.
図9Cは、ボックス211において、シール不良が異常イベンとして表示された例を示している。これにより、リスト213には、シール不良の原因要素となる機構と特徴量が表示されている。ここでは、(サーボ4-トルク平均値)が選択されているため、異常原因図のサーボ4が強調されるとともに、(サーボ4-トルク平均値)の経時的な変化を示す折れ線グラフ214が表示されている。
FIG. 9C shows an example in which a defective seal is displayed as an abnormal event in the box 211. As a result, in Listing 213, the mechanism and the feature amount that cause the seal failure are displayed. Here, since (servo 4-torque average value) is selected, the servo 4 in the abnormality cause diagram is emphasized, and a line graph 214 showing the change over time of (servo 4-torque average value) is displayed. Has been done.
上記の画面21の操作をまとめると、以下の通りである。まず、ユーザは、入力装置15によって、選択ボックス211から確認を行うべき異常イベントを選択する。これにより、表示制御部113は、選択された異常イベントに対応する異常原因図212及びリスト213を画面に表示する。そして、リスト213から、いずれかの特徴量が選択されると、対応する異常原因図212のノードが強調表示されるとともに、選択された特徴量の経時変化を示すグラフ214が表示される。したがって、ユーザは、この画面21を見ながら、異常イベントに係る因果関係を視認することができる。なお、グラフ214に表示する特徴量の経時変化の期間は、ユーザが適宜設定することができる。
The operations on the above screen 21 can be summarized as follows. First, the user selects an abnormal event to be confirmed from the selection box 211 by the input device 15. As a result, the display control unit 113 displays the abnormality cause diagram 212 and the list 213 corresponding to the selected abnormality event on the screen. Then, when any of the feature amounts is selected from the list 213, the node of the corresponding abnormality cause FIG. 212 is highlighted, and the graph 214 showing the change with time of the selected feature amount is displayed. Therefore, the user can visually recognize the causal relationship related to the abnormal event while looking at the screen 21. The user can appropriately set the period of time-dependent changes in the feature amount displayed on the graph 214.
<3-3.因果関係モデルの変化>
次に、因果関係モデルの変化について説明する。上記のように構築される因果関係モデルは、包装機を長時間に亘って駆動することで、経時的に変化する可能性がある。したがって、因果関係モデルの構築は、所定期間ごとに行うことが好ましい。例えば、ある時刻T1に、図7Aに示すような革ベルトの摩耗に係る因果関係モデルを構築したとし、それから所定期間が経過した時刻T2に、革ベルトの摩耗に係る因果関係モデルを構築すると、図10に示すような因果関係モデルが構築されたとする。これは、時刻T1においては、サーボ1,3,4が革ベルトの摩耗の原因要素となっていたが、経時的な変化により、サーボ1は、原因要素ではなくなったことを意味する。すなわち、時刻T2の時点では、サーボ3の速度最小値とトルク最大値が、サーボ4のトルク平均値に影響を与え、これによって革ベルトの摩耗が生じることになった。 <3-3. Changes in causal relationship model>
Next, changes in the causal relationship model will be described. The causal relationship model constructed as described above may change over time by driving the packaging machine for a long period of time. Therefore, it is preferable to construct the causal relationship model at predetermined intervals. For example, suppose that a causal relationship model related to leather belt wear as shown in FIG. 7A is constructed at a certain time T1, and then a causal relationship model related to leather belt wear is constructed at time T2 when a predetermined period elapses. It is assumed that a causal relationship model as shown in FIG. 10 is constructed. This means that at time T1, the servos 1, 3 and 4 were the causative factors of the wear of the leather belt, but the servo 1 is no longer the causative factor due to the change over time. That is, at the time of time T2, the minimum speed value and the maximum torque value of the servo 3 affect the average torque value of the servo 4, which causes wear of the leather belt.
次に、因果関係モデルの変化について説明する。上記のように構築される因果関係モデルは、包装機を長時間に亘って駆動することで、経時的に変化する可能性がある。したがって、因果関係モデルの構築は、所定期間ごとに行うことが好ましい。例えば、ある時刻T1に、図7Aに示すような革ベルトの摩耗に係る因果関係モデルを構築したとし、それから所定期間が経過した時刻T2に、革ベルトの摩耗に係る因果関係モデルを構築すると、図10に示すような因果関係モデルが構築されたとする。これは、時刻T1においては、サーボ1,3,4が革ベルトの摩耗の原因要素となっていたが、経時的な変化により、サーボ1は、原因要素ではなくなったことを意味する。すなわち、時刻T2の時点では、サーボ3の速度最小値とトルク最大値が、サーボ4のトルク平均値に影響を与え、これによって革ベルトの摩耗が生じることになった。 <3-3. Changes in causal relationship model>
Next, changes in the causal relationship model will be described. The causal relationship model constructed as described above may change over time by driving the packaging machine for a long period of time. Therefore, it is preferable to construct the causal relationship model at predetermined intervals. For example, suppose that a causal relationship model related to leather belt wear as shown in FIG. 7A is constructed at a certain time T1, and then a causal relationship model related to leather belt wear is constructed at time T2 when a predetermined period elapses. It is assumed that a causal relationship model as shown in FIG. 10 is constructed. This means that at time T1, the
したがって、ユーザは、このような経時変化による因果関係モデルの変化を知る必要があり、これによって、異常が発生したときの修理を容易に行うことができる。そのため、本実施形態においては、所定期間おきに因果関係モデルを構築し、変化があった場合には、これを画面に表示することとした。図11は、画面表示の一例を示す。図11に示すように、画面には、時刻T1と時刻T2での因果関係モデルを並べて表示している。そして、2つの因果関係モデルの相違点を強調表示している。すなわち、時刻T2では、サーボ1とサーボ2との間の因果関係が消滅したため、2つの因果関係モデルにおいて、サーボ1,2,及びその間のエッジを太線で示している。但し、強調表示の方法は特には限定されず、着色したり、点滅させるなど、種々の方法がある。
Therefore, the user needs to know the change of the causal relationship model due to such a change with time, and by this, repair can be easily performed when an abnormality occurs. Therefore, in the present embodiment, a causal relationship model is constructed at predetermined intervals, and when there is a change, it is displayed on the screen. FIG. 11 shows an example of screen display. As shown in FIG. 11, the causal relationship model at time T1 and time T2 is displayed side by side on the screen. It highlights the differences between the two causal models. That is, at time T2, the causal relationship between the servo 1 and the servo 2 disappeared, so in the two causal relationship models, the servos 1, 2 and the edges between them are shown by thick lines. However, the highlighting method is not particularly limited, and there are various methods such as coloring and blinking.
また、図12Aは、時刻T1におけるサーボ1とサーボ3の特徴量の1つの頻度分布、相関、時間変化を示したものであり、図12Bは、時刻T2におけるサーボ1とサーボ3の特徴量の1つの頻度分布、相関、時間変化を示したものである。このような各特徴量の個別を画面21に表示することで、因果関係モデルがなぜ変化したかを詳細に検討することができる。なお、図12で示した特徴量に係るデータは、一例であり、他の指標を用いることもできる。
Further, FIG. 12A shows one frequency distribution, correlation, and time change of the features of the servo 1 and the servo 3 at the time T1, and FIG. 12B shows the features of the servo 1 and the servo 3 at the time T2. It shows one frequency distribution, correlation, and time change. By displaying the individual features of each feature on the screen 21, it is possible to examine in detail why the causal relationship model has changed. The data related to the feature amount shown in FIG. 12 is an example, and other indexes can be used.
このような因果関係モデルの変化は、上記のように変化があったときに、解析装置1が表示装置2に表示するようにしてもよいし、ユーザが自らの操作で定期的に因果関係モデルを表示することもできる。また、音、光、画面への表示などで、変化があったときに、これを報知することもできる。
Such a change in the causal relationship model may be displayed on the display device 2 by the analysis device 1 when there is a change as described above, or the user may periodically operate the causal relationship model by his / her own operation. Can also be displayed. It is also possible to notify when there is a change in sound, light, display on the screen, or the like.
<4.特徴>
(1)本実施形態によれば、複数の時期において因果関係モデルを構築し、これらを表示するように構成されている。そのため、複数の時期において構築された因果関係モデルの比較を行うことができる。これにより、例えば、複数の時期において因果関係モデルの変化が生じたときには、異常の原因要素に何らかの経時的な変化が生じたことが分かるため、因果関係モデルの相違点を確認することで、異常の原因を容易に特定することができる。また、因果関係モデルの相違点を強調表示することで、相違点を容易に視認することができる。 <4. Features>
(1) According to the present embodiment, the causal relationship model is constructed at a plurality of periods and is configured to be displayed. Therefore, it is possible to compare causal relational models constructed at multiple times. As a result, for example, when the causal relationship model changes at multiple times, it can be seen that some change over time has occurred in the causative element of the abnormality. Therefore, by confirming the difference in the causal relationship model, the abnormality can be found. The cause of this can be easily identified. In addition, by highlighting the differences in the causal relationship model, the differences can be easily visually recognized.
(2)上記のように複数の因果関係モデルを知ることで、例えば、複数の包装機3における因果関係を複数の時期に亘って比較することもできる。これにより、複数の包装機3間の調整が容易になる。
(2) By knowing the plurality of causal relationship models as described above, for example, the causal relationships in the plurality of packaging machines 3 can be compared over a plurality of periods. This facilitates coordination between the plurality of packaging machines 3.
(3)本実施形態によれば、包装機3の概略図と、この包装機3において生じ得る異常に係る因果関係モデルと、を表示装置2の画面21に表示するようにしている。このとき、画面21には、概略図と対応するように因果関係モデルが重ねられて表示されるため、因果関係モデルに含まれる原因要素を、概略図を見ながら特定することができる。したがって、包装機3において異常がどこで生じているかを容易に視認することができる。
(3) According to the present embodiment, a schematic diagram of the packaging machine 3 and a causal relationship model related to an abnormality that may occur in the packaging machine 3 are displayed on the screen 21 of the display device 2. At this time, since the causal relational model is superimposed and displayed on the screen 21 so as to correspond to the schematic diagram, the causal element included in the causal relational model can be specified while looking at the schematic diagram. Therefore, it is possible to easily visually recognize where the abnormality is occurring in the packaging machine 3.
(4)異常イベント毎に原因要素と、それに対応する特徴量とをリスト213として画面21に表示するため、異常を解決するための原因要素と、それを制御する特徴量とを視認することができる。例えば、同じ原因要素であっても、異常によって制御されるべき特徴量が異なることがあるため、リスト213を見ることで、どの特徴量を制御すべきかを容易に知ることができる。
(4) Since the causative element and the corresponding feature amount for each abnormal event are displayed on the screen 21 as a list 213, the causal element for solving the abnormality and the feature amount for controlling the abnormality can be visually recognized. it can. For example, even if the cause elements are the same, the feature amount to be controlled may differ depending on the abnormality. Therefore, by looking at Listing 213, it is possible to easily know which feature amount should be controlled.
<5.変形例>
以上、本発明の実施の形態を詳細に説明してきたが、前述までの説明はあらゆる点において本発明の例示に過ぎない。本発明の範囲を逸脱することなく種々の改良や変形を行うことができることは言うまでもない。例えば、以下のような変更が可能である。なお、以下では、上記実施形態と同様の構成要素に関しては同様の符号を用い、上記実施形態と同様の点については、適宜説明を省略した。以下の変形例は適宜組み合わせ可能である。 <5. Modification example>
Although the embodiments of the present invention have been described in detail above, the above description is merely an example of the present invention in all respects. Needless to say, various improvements and modifications can be made without departing from the scope of the present invention. For example, the following changes can be made. In the following, the same reference numerals will be used for the same components as those in the above embodiment, and the same points as in the above embodiment will be omitted as appropriate. The following modifications can be combined as appropriate.
<5-1>
複数の因果関係モデルの画面21における表示方法は、特には限定されず、因果関係モデルの並べ方等は特には限定されない。例えば、相違点の強調表示は必須ではなく、単に因果関係モデルを並べて表示することもできる。また、3以上の時期の因果関係モデルを表示したり、各特徴量の頻度分布などの詳細なデータを合わせて表示することもできる。さらに、図9A~図9Cに示す画面21に合わせて表示することもできる。 <5-1>
The display method of the plurality of causal relational models on thescreen 21 is not particularly limited, and the arrangement of the causal relational models is not particularly limited. For example, highlighting differences is not mandatory, and causal relationships models can simply be displayed side by side. It is also possible to display a causal relationship model for three or more periods, and to display detailed data such as a frequency distribution of each feature. Further, it can be displayed according to the screen 21 shown in FIGS. 9A to 9C.
複数の因果関係モデルの画面21における表示方法は、特には限定されず、因果関係モデルの並べ方等は特には限定されない。例えば、相違点の強調表示は必須ではなく、単に因果関係モデルを並べて表示することもできる。また、3以上の時期の因果関係モデルを表示したり、各特徴量の頻度分布などの詳細なデータを合わせて表示することもできる。さらに、図9A~図9Cに示す画面21に合わせて表示することもできる。 <5-1>
The display method of the plurality of causal relational models on the
<5-2>
図9A~図9Cに示す画面21には、異常イベントの選択ボックス211、異常原因図212、リスト213、及びグラフ214が表示されているが、これに限定されるものではなく、この中のいくつかが表示されていればよい。例えば、対象となる生産設備によっては、異常イベントが1つの場合もあるため、この場合には、選択ボックス211が不要となる。また、画面21に、全ての要素211~214を表示する必要はなく、これらを複数の画面に分けて表示し、ユーザがこれらを切り替えられるようにしてもよい。 <5-2>
On thescreen 21 shown in FIGS. 9A to 9C, an abnormality event selection box 211, an abnormality cause diagram 212, a list 213, and a graph 214 are displayed, but the present invention is not limited to this, and some of them are displayed. Is displayed. For example, depending on the target production facility, there may be one abnormal event, and in this case, the selection box 211 becomes unnecessary. Further, it is not necessary to display all the elements 211 to 214 on the screen 21, and these may be displayed separately on a plurality of screens so that the user can switch between them.
図9A~図9Cに示す画面21には、異常イベントの選択ボックス211、異常原因図212、リスト213、及びグラフ214が表示されているが、これに限定されるものではなく、この中のいくつかが表示されていればよい。例えば、対象となる生産設備によっては、異常イベントが1つの場合もあるため、この場合には、選択ボックス211が不要となる。また、画面21に、全ての要素211~214を表示する必要はなく、これらを複数の画面に分けて表示し、ユーザがこれらを切り替えられるようにしてもよい。 <5-2>
On the
<5-3>
上記実施形態で示した因果関係モデルの構築は、一例であり、その他の方法であってもよい。また、他の装置で構築した概略図データ122や因果関係モデルデータ123を記憶部12に逐次記憶することもできる。 <5-3>
The construction of the causal relationship model shown in the above embodiment is an example, and may be another method. Further, theschematic diagram data 122 and the causal relationship model data 123 constructed by another device can be sequentially stored in the storage unit 12.
上記実施形態で示した因果関係モデルの構築は、一例であり、その他の方法であってもよい。また、他の装置で構築した概略図データ122や因果関係モデルデータ123を記憶部12に逐次記憶することもできる。 <5-3>
The construction of the causal relationship model shown in the above embodiment is an example, and may be another method. Further, the
<5-4>
包装機3以外の生産設備においても適用可能であり、その場合には、因果関係モデルを構築するための機構も、生産設備に応じて適宜選択することができる。また、複数の生産設備に係る概略図データを記憶部12に記憶しておき、対応する生産設備ごとに、表示装置2に表示することもできる。 <5-4>
It can also be applied to production equipment other than thepackaging machine 3, and in that case, a mechanism for constructing a causal relationship model can be appropriately selected according to the production equipment. Further, it is also possible to store schematic data relating to a plurality of production facilities in the storage unit 12 and display the corresponding production facilities on the display device 2.
包装機3以外の生産設備においても適用可能であり、その場合には、因果関係モデルを構築するための機構も、生産設備に応じて適宜選択することができる。また、複数の生産設備に係る概略図データを記憶部12に記憶しておき、対応する生産設備ごとに、表示装置2に表示することもできる。 <5-4>
It can also be applied to production equipment other than the
<5-5>
本発明に係る表示システムは、上記生産システムにおける解析装置1と表示装置2により構成することができる。したがって、上記実施形態の表示装置2が本発明の表示部に相当し、解析装置1の制御部11及び記憶部12が、本発明の制御部及び記憶部に相当する。例えば、本発明に係る制御部、記憶部、及び表示部をタブレットPCなどで構成することもできる。 <5-5>
The display system according to the present invention can be configured by theanalysis device 1 and the display device 2 in the production system. Therefore, the display device 2 of the above embodiment corresponds to the display unit of the present invention, and the control unit 11 and the storage unit 12 of the analysis device 1 correspond to the control unit and the storage unit of the present invention. For example, the control unit, the storage unit, and the display unit according to the present invention can be configured by a tablet PC or the like.
本発明に係る表示システムは、上記生産システムにおける解析装置1と表示装置2により構成することができる。したがって、上記実施形態の表示装置2が本発明の表示部に相当し、解析装置1の制御部11及び記憶部12が、本発明の制御部及び記憶部に相当する。例えば、本発明に係る制御部、記憶部、及び表示部をタブレットPCなどで構成することもできる。 <5-5>
The display system according to the present invention can be configured by the
1…解析装置、
11…制御部
12…記憶部、
14…入力装置(入力部)
2…表示装置(表示部)
3…包装機(生産設備) 1 ... Analytical device,
11 ...Control unit 12 ... Storage unit,
14 ... Input device (input unit)
2 ... Display device (display unit)
3 ... Packaging machine (production equipment)
11…制御部
12…記憶部、
14…入力装置(入力部)
2…表示装置(表示部)
3…包装機(生産設備) 1 ... Analytical device,
11 ...
14 ... Input device (input unit)
2 ... Display device (display unit)
3 ... Packaging machine (production equipment)
Claims (6)
- 製品を生産する生産設備であって、当該生産設備の駆動を行う少なくとも1つの駆動手段及び前記生産の監視を行う少なくとも1つの監視手段を有し、前記駆動手段及び監視手段が、制御可能な少なくとも1つの特徴量を有している、生産設備に設けられる表示システムであって、
制御部と、
表示部と、
記憶部と、
を備え、
前記制御部は、
前記駆動手段及び監視手段の少なくとも1つから経時的に出力される前記特徴量を取得して前記記憶部に記憶させ、
前記駆動手段及び前記監視手段の中から少なくとも1つ選択され、前記生産設備に生じ得る少なくとも1つの異常の原因要素と、当該原因要素の関係と、を示す因果関係モデルを、取得された前記特徴量に基づいて、所定の時期ごとに構築し、
複数の前記時期において構築された複数の前記因果関係モデルを、前記表示部に表示するように構成されている、表示システム。 A production facility that produces a product, which has at least one driving means for driving the production facility and at least one monitoring means for monitoring the production, and the driving means and the monitoring means can be controlled at least. A display system installed in a production facility that has one feature.
Control unit and
Display and
Memory and
With
The control unit
The feature amount output over time from at least one of the driving means and the monitoring means is acquired and stored in the storage unit.
The feature obtained by selecting at least one of the driving means and the monitoring means and acquiring a causal relationship model showing a causal element of at least one abnormality that can occur in the production equipment and the relationship between the causative elements. Build at regular intervals based on quantity,
A display system configured to display a plurality of the causal relationship models constructed at the plurality of times on the display unit. - 前記制御部は、複数の前記因果関係モデルにおける相違点を強調して前記表示部に表示するように構成されている、請求項1に記載の表示システム。 The display system according to claim 1, wherein the control unit is configured to emphasize differences in the plurality of causal relational models and display them on the display unit.
- 前記制御部は、前記各因果関係モデルにおける前記原因要素の特徴量の経時的変化を、前記表示部に、表示する、請求項1または2に記載の表示システム。 The display system according to claim 1 or 2, wherein the control unit displays on the display unit the change over time in the feature amount of the causal element in each causal relationship model.
- 複数の前記時期において構築された複数の前記因果関係モデルに相違点が生じたときに、報知を行う、報知部をさらに備えている、請求項1から3のいずれかに記載の表示システム。 The display system according to any one of claims 1 to 3, further comprising a notification unit that notifies when a difference occurs between a plurality of the causal relationship models constructed at the plurality of times.
- 製品を生産する生産設備であって、当該生産設備の駆動を行う少なくとも1つの駆動手段及び前記生産の監視を行う少なくとも1つの監視手段を有する生産設備において生じ得る異常の因果関係を表示部に表示するための表示方法であって、
前記駆動手段及び監視手段の少なくとも1つから経時的に出力される前記特徴量を取得するステップと、
前記駆動手段及び前記監視手段の中から少なくとも1つ選択され、前記生産設備に生じ得る少なくとも1つの異常の原因要素と、当該原因要素の関係と、を示す因果関係モデルを、取得された前記特徴量に基づいて、所定の時期ごとに構築するステップと、
複数の前記時期において構築された複数の前記因果関係モデルを、前記表示部に表示するステップと、
を備えている、表示方法。 The display unit displays the causal relationship of abnormalities that may occur in a production facility that produces a product and has at least one driving means for driving the production facility and at least one monitoring means for monitoring the production. It is a display method for
A step of acquiring the feature amount output over time from at least one of the driving means and the monitoring means, and
The feature obtained by selecting at least one of the driving means and the monitoring means and acquiring a causal relationship model showing a causal element of at least one abnormality that can occur in the production equipment and the relationship between the causative elements. Steps to build at regular intervals based on quantity,
A step of displaying a plurality of the causal relationship models constructed at the plurality of times on the display unit, and
The display method. - 製品を生産する生産設備であって、当該生産設備の駆動を行う少なくとも1つの駆動手段及び前記生産の監視を行う少なくとも1つの監視手段を有する生産設備において生じ得る異常の因果関係を表示部に表示するための表示プログラムであって、
コンピュータに、
前記駆動手段及び監視手段の少なくとも1つから経時的に出力される前記特徴量を取得するステップと、
前記駆動手段及び前記監視手段の中から少なくとも1つ選択され、前記生産設備に生じ得る少なくとも1つの異常の原因要素と、当該原因要素の関係と、を示す因果関係モデルを、取得された前記特徴量に基づいて、所定の時期ごとに構築するステップと、
複数の前記時期において構築された複数の前記因果関係モデルを、前記表示部に表示するステップと、
を実行させる、表示プログラム。 A causal relationship of abnormalities that may occur in a production facility that produces a product and has at least one driving means for driving the production facility and at least one monitoring means for monitoring the production is displayed on the display unit. It is a display program for
On the computer
A step of acquiring the feature amount output over time from at least one of the driving means and the monitoring means, and
The feature obtained by selecting at least one of the driving means and the monitoring means and acquiring a causal relationship model showing a causal element of at least one abnormality that can occur in the production equipment and the relationship between the causative elements. Steps to build at regular intervals based on quantity,
A step of displaying a plurality of the causal relationship models constructed at the plurality of times on the display unit, and
A display program that executes.
Priority Applications (3)
| Application Number | Priority Date | Filing Date | Title |
|---|---|---|---|
| CN202080004364.0A CN112534373A (en) | 2019-03-13 | 2020-02-03 | Display system |
| EP20769632.9A EP3940489A4 (en) | 2019-03-13 | 2020-02-03 | Display system |
| US17/269,535 US20210200194A1 (en) | 2019-03-13 | 2020-02-03 | Display system, display method, and non-transitory computer-readable recording medium recording display program |
Applications Claiming Priority (2)
| Application Number | Priority Date | Filing Date | Title |
|---|---|---|---|
| JP2019-045646 | 2019-03-13 | ||
| JP2019045646A JP7272020B2 (en) | 2019-03-13 | 2019-03-13 | display system |
Publications (1)
| Publication Number | Publication Date |
|---|---|
| WO2020183975A1 true WO2020183975A1 (en) | 2020-09-17 |
Family
ID=72426734
Family Applications (1)
| Application Number | Title | Priority Date | Filing Date |
|---|---|---|---|
| PCT/JP2020/003870 WO2020183975A1 (en) | 2019-03-13 | 2020-02-03 | Display system |
Country Status (5)
| Country | Link |
|---|---|
| US (1) | US20210200194A1 (en) |
| EP (1) | EP3940489A4 (en) |
| JP (1) | JP7272020B2 (en) |
| CN (1) | CN112534373A (en) |
| WO (1) | WO2020183975A1 (en) |
Cited By (1)
| Publication number | Priority date | Publication date | Assignee | Title |
|---|---|---|---|---|
| JP7011106B1 (en) * | 2021-08-25 | 2022-01-26 | ファナック株式会社 | Status determination device and status determination method |
Families Citing this family (1)
| Publication number | Priority date | Publication date | Assignee | Title |
|---|---|---|---|---|
| JP2022029983A (en) * | 2020-08-06 | 2022-02-18 | オムロン株式会社 | Display system, display method, and display program |
Citations (7)
| Publication number | Priority date | Publication date | Assignee | Title |
|---|---|---|---|---|
| JP2003162504A (en) * | 2001-11-26 | 2003-06-06 | Hitachi Ltd | Support system for trouble analysis |
| JP2008003920A (en) * | 2006-06-23 | 2008-01-10 | Toshiba Corp | Device and program for prediction/diagnosis of time-series data |
| JP2010277199A (en) | 2009-05-26 | 2010-12-09 | Nippon Steel Corp | Facility-diagnosing device, facility-diagnosing method and facility-diagnosing program for production system, and computer-readable recording medium which records the program |
| JP2015172945A (en) | 2009-08-28 | 2015-10-01 | 株式会社日立製作所 | Facility state monitoring method and apparatus for the same |
| WO2018073960A1 (en) * | 2016-10-21 | 2018-04-26 | 日本電気株式会社 | Display method, display device, and program |
| JP2018116545A (en) * | 2017-01-19 | 2018-07-26 | オムロン株式会社 | Prediction model creating device, production facility monitoring system, and production facility monitoring method |
| JP2018181021A (en) * | 2017-04-14 | 2018-11-15 | オムロン株式会社 | Industrial control apparatus, control method, program, packaging machine, and packaging machine control apparatus |
Family Cites Families (12)
| Publication number | Priority date | Publication date | Assignee | Title |
|---|---|---|---|---|
| JP2005141292A (en) * | 2003-11-04 | 2005-06-02 | Yamatake Corp | Equipment maintenance/operation knowledge tradition system and method and knowledge base construction system and method |
| JP2006330878A (en) * | 2005-05-24 | 2006-12-07 | Toshiba Corp | Plant monitor controller |
| CN101414186A (en) * | 2007-03-09 | 2009-04-22 | 欧姆龙株式会社 | Factor estimating support device and method of controlling the same, |
| US7765020B2 (en) * | 2007-05-04 | 2010-07-27 | Applied Materials, Inc. | Graphical user interface for presenting multivariate fault contributions |
| JP5129725B2 (en) * | 2008-11-19 | 2013-01-30 | 株式会社日立製作所 | Device abnormality diagnosis method and system |
| CN102713777B (en) * | 2010-01-22 | 2015-07-01 | 株式会社日立制作所 | Diagnostic apparatus and diagnostic method |
| JP5740338B2 (en) * | 2012-03-29 | 2015-06-24 | 株式会社日立ソリューションズ | Virtual environment operation support system |
| JP6216242B2 (en) * | 2013-12-13 | 2017-10-18 | 株式会社日立ハイテクノロジーズ | Anomaly detection method and apparatus |
| JP2017111657A (en) * | 2015-12-17 | 2017-06-22 | 株式会社日立製作所 | Design support apparatus, design support method, and design support program |
| JP6837893B2 (en) * | 2017-03-31 | 2021-03-03 | 住友重機械工業株式会社 | Failure diagnosis system |
| JP2018200556A (en) * | 2017-05-26 | 2018-12-20 | 株式会社東芝 | Information processor, information processing method and program |
| JP6551565B2 (en) * | 2017-06-02 | 2019-07-31 | オムロン株式会社 | Process analysis apparatus, process analysis method, and process analysis program |
-
2019
- 2019-03-13 JP JP2019045646A patent/JP7272020B2/en active Active
-
2020
- 2020-02-03 CN CN202080004364.0A patent/CN112534373A/en active Pending
- 2020-02-03 WO PCT/JP2020/003870 patent/WO2020183975A1/en unknown
- 2020-02-03 US US17/269,535 patent/US20210200194A1/en active Pending
- 2020-02-03 EP EP20769632.9A patent/EP3940489A4/en active Pending
Patent Citations (7)
| Publication number | Priority date | Publication date | Assignee | Title |
|---|---|---|---|---|
| JP2003162504A (en) * | 2001-11-26 | 2003-06-06 | Hitachi Ltd | Support system for trouble analysis |
| JP2008003920A (en) * | 2006-06-23 | 2008-01-10 | Toshiba Corp | Device and program for prediction/diagnosis of time-series data |
| JP2010277199A (en) | 2009-05-26 | 2010-12-09 | Nippon Steel Corp | Facility-diagnosing device, facility-diagnosing method and facility-diagnosing program for production system, and computer-readable recording medium which records the program |
| JP2015172945A (en) | 2009-08-28 | 2015-10-01 | 株式会社日立製作所 | Facility state monitoring method and apparatus for the same |
| WO2018073960A1 (en) * | 2016-10-21 | 2018-04-26 | 日本電気株式会社 | Display method, display device, and program |
| JP2018116545A (en) * | 2017-01-19 | 2018-07-26 | オムロン株式会社 | Prediction model creating device, production facility monitoring system, and production facility monitoring method |
| JP2018181021A (en) * | 2017-04-14 | 2018-11-15 | オムロン株式会社 | Industrial control apparatus, control method, program, packaging machine, and packaging machine control apparatus |
Cited By (2)
| Publication number | Priority date | Publication date | Assignee | Title |
|---|---|---|---|---|
| JP7011106B1 (en) * | 2021-08-25 | 2022-01-26 | ファナック株式会社 | Status determination device and status determination method |
| WO2023026416A1 (en) * | 2021-08-25 | 2023-03-02 | ファナック株式会社 | State determination device and state determination method |
Also Published As
| Publication number | Publication date |
|---|---|
| EP3940489A4 (en) | 2022-11-30 |
| EP3940489A1 (en) | 2022-01-19 |
| US20210200194A1 (en) | 2021-07-01 |
| CN112534373A (en) | 2021-03-19 |
| JP2020149291A (en) | 2020-09-17 |
| JP7272020B2 (en) | 2023-05-12 |
Similar Documents
| Publication | Publication Date | Title |
|---|---|---|
| WO2020183973A1 (en) | Display system, display method, and display program | |
| US11106197B2 (en) | Prediction model creation apparatus, production facility monitoring system, and production facility monitoring method | |
| WO2020183975A1 (en) | Display system | |
| WO2022030568A1 (en) | Display system, display method, and display program | |
| CN105539948A (en) | Control apparatus, system, and program library | |
| WO2020183974A1 (en) | Display system | |
| JP2018177268A (en) | Packaging machine | |
| WO2022030567A1 (en) | Display system, display method, and display program | |
| US11078041B2 (en) | Monitoring method for monitoring an unwinding process, unwinding device and unwinding system | |
| WO2021044500A1 (en) | Abnormality processing support device | |
| WO2021053782A1 (en) | Analysis device for event that can occur in production facility | |
| JP6459686B2 (en) | Control device, system, and library program | |
| EP4286822A1 (en) | Virtual sensing system for condition monitoring of a container packaging machine | |
| US11932991B2 (en) | Systems and methods for monitoring and controlling industrial processes | |
| US11816893B1 (en) | Systems and methods for monitoring and controlling industrial processes | |
| WO2022176760A1 (en) | Model generation device, model generation method, model generation program, estimation device, estimation method, and estimation program | |
| WO2022063373A1 (en) | Optical assessment of packaging film welds | |
| CA3179932A1 (en) | Adaptive-learning, auto-labeling method and system for predicting and diagnosing web breaks in paper machine |
Legal Events
| Date | Code | Title | Description |
|---|---|---|---|
| 121 | Ep: the epo has been informed by wipo that ep was designated in this application |
Ref document number: 20769632 Country of ref document: EP Kind code of ref document: A1 |
|
| NENP | Non-entry into the national phase |
Ref country code: DE |
|
| ENP | Entry into the national phase |
Ref document number: 2020769632 Country of ref document: EP Effective date: 20211013 |