JP6216242B2 - Anomaly detection method and apparatus - Google Patents
Anomaly detection method and apparatus Download PDFInfo
- Publication number
- JP6216242B2 JP6216242B2 JP2013258215A JP2013258215A JP6216242B2 JP 6216242 B2 JP6216242 B2 JP 6216242B2 JP 2013258215 A JP2013258215 A JP 2013258215A JP 2013258215 A JP2013258215 A JP 2013258215A JP 6216242 B2 JP6216242 B2 JP 6216242B2
- Authority
- JP
- Japan
- Prior art keywords
- abnormality
- learning
- measure
- sensor signal
- feature vector
- Prior art date
- Legal status (The legal status is an assumption and is not a legal conclusion. Google has not performed a legal analysis and makes no representation as to the accuracy of the status listed.)
- Active
Links
Images


Classifications
-
- G—PHYSICS
- G06—COMPUTING; CALCULATING OR COUNTING
- G06F—ELECTRIC DIGITAL DATA PROCESSING
- G06F11/00—Error detection; Error correction; Monitoring
-
- G—PHYSICS
- G05—CONTROLLING; REGULATING
- G05B—CONTROL OR REGULATING SYSTEMS IN GENERAL; FUNCTIONAL ELEMENTS OF SUCH SYSTEMS; MONITORING OR TESTING ARRANGEMENTS FOR SUCH SYSTEMS OR ELEMENTS
- G05B23/00—Testing or monitoring of control systems or parts thereof
- G05B23/02—Electric testing or monitoring
- G05B23/0205—Electric testing or monitoring by means of a monitoring system capable of detecting and responding to faults
- G05B23/0218—Electric testing or monitoring by means of a monitoring system capable of detecting and responding to faults characterised by the fault detection method dealing with either existing or incipient faults
- G05B23/0224—Process history based detection method, e.g. whereby history implies the availability of large amounts of data
- G05B23/0227—Qualitative history assessment, whereby the type of data acted upon, e.g. waveforms, images or patterns, is not relevant, e.g. rule based assessment; if-then decisions
- G05B23/0235—Qualitative history assessment, whereby the type of data acted upon, e.g. waveforms, images or patterns, is not relevant, e.g. rule based assessment; if-then decisions based on a comparison with predetermined threshold or range, e.g. "classical methods", carried out during normal operation; threshold adaptation or choice; when or how to compare with the threshold
-
- G—PHYSICS
- G05—CONTROLLING; REGULATING
- G05B—CONTROL OR REGULATING SYSTEMS IN GENERAL; FUNCTIONAL ELEMENTS OF SUCH SYSTEMS; MONITORING OR TESTING ARRANGEMENTS FOR SUCH SYSTEMS OR ELEMENTS
- G05B23/00—Testing or monitoring of control systems or parts thereof
- G05B23/02—Electric testing or monitoring
- G05B23/0205—Electric testing or monitoring by means of a monitoring system capable of detecting and responding to faults
- G05B23/0218—Electric testing or monitoring by means of a monitoring system capable of detecting and responding to faults characterised by the fault detection method dealing with either existing or incipient faults
- G05B23/0243—Electric testing or monitoring by means of a monitoring system capable of detecting and responding to faults characterised by the fault detection method dealing with either existing or incipient faults model based detection method, e.g. first-principles knowledge model
-
- G—PHYSICS
- G05—CONTROLLING; REGULATING
- G05B—CONTROL OR REGULATING SYSTEMS IN GENERAL; FUNCTIONAL ELEMENTS OF SUCH SYSTEMS; MONITORING OR TESTING ARRANGEMENTS FOR SUCH SYSTEMS OR ELEMENTS
- G05B23/00—Testing or monitoring of control systems or parts thereof
- G05B23/02—Electric testing or monitoring
- G05B23/0205—Electric testing or monitoring by means of a monitoring system capable of detecting and responding to faults
- G05B23/0259—Electric testing or monitoring by means of a monitoring system capable of detecting and responding to faults characterized by the response to fault detection
- G05B23/0275—Fault isolation and identification, e.g. classify fault; estimate cause or root of failure
- G05B23/0281—Quantitative, e.g. mathematical distance; Clustering; Neural networks; Statistical analysis
-
- G—PHYSICS
- G06—COMPUTING; CALCULATING OR COUNTING
- G06N—COMPUTING ARRANGEMENTS BASED ON SPECIFIC COMPUTATIONAL MODELS
- G06N20/00—Machine learning
Description
本発明は、プラントや設備などの出力する多次元時系列データをもとに異常を早期に検知する異常検知方法およびその装置に関する。 The present invention relates to an abnormality detection method and apparatus for detecting an abnormality at an early stage based on multidimensional time-series data output from a plant or equipment.
電力会社では、ガスタービンの廃熱などを利用して地域暖房用温水を供給したり、工場向けに高圧蒸気や低圧蒸気を供給したりしている。石油化学会社では、ガスタービンなどを電源設備として運転している。このようにガスタービンなどを用いた各種プラントや設備において、設備の不具合あるいはその兆候を検知する異常検知は、社会へのダメージを最小限に抑えるためにも極めて重要である。 Electric power companies use waste heat from gas turbines to supply hot water for district heating, and supply high-pressure steam and low-pressure steam to factories. Petrochemical companies operate gas turbines and other power sources. As described above, in various plants and facilities using a gas turbine or the like, abnormality detection for detecting a malfunction of the facility or its sign is extremely important for minimizing damage to society.
ガスタービンや蒸気タービンのみならず、水力発電所での水車、原子力発電所の原子炉、風力発電所の風車、航空機や重機のエンジン、鉄道車両や軌道、エスカレータ、エレベータ、MRI,X線CTなどの医用診断装置、機器・部品レベルでも、搭載電池の劣化・寿命など、上記のような予防保全を必要とする設備は枚挙に暇がない。 Not only gas turbines and steam turbines, water turbines at hydroelectric power plants, nuclear reactors at nuclear power plants, wind turbines at wind power plants, engines of aircraft and heavy machinery, railway vehicles and tracks, escalators, elevators, MRI, X-ray CT, etc. Even in the medical diagnostic apparatus, equipment and parts level, there is no spare time for facilities that require preventive maintenance as described above, such as deterioration and life of on-board batteries.
このため、対象設備やプラントに複数のセンサを取り付け、センサ毎の監視基準に従って正常か異常かを判断することが行われている。特開2011―70635号公報(特許文献1)には、過去の正常データから作成されたモデルとの比較によって算出される異常測度に基づいて異常の有無を検知する異常検知方法において、正常モデルを局所部分空間法によって作成することが開示されている。正常モデルに基づく異常検知では、感度が学習データの質に影響されるため、網羅的かつ正確に正常データを収集する必要がある。網羅性については学習期間を長くすることで対応可能である。正確性については、異常が混入していると、適正なしきい値を設定できずに感度が低下するため、学習データから自動的に異常データを除外する必要がある。 For this reason, attaching a some sensor to object equipment or a plant, and judging whether it is normal or abnormal according to the monitoring standard for every sensor is performed. Japanese Patent Application Laid-Open No. 2011-70635 (Patent Document 1) discloses a normal model in an abnormality detection method for detecting the presence or absence of an abnormality based on an abnormality measure calculated by comparison with a model created from past normal data. The creation by a local subspace method is disclosed. In the anomaly detection based on the normal model, the sensitivity is affected by the quality of the learning data, so it is necessary to collect normal data comprehensively and accurately. Coverage can be dealt with by lengthening the learning period. As for accuracy, if an abnormality is mixed, an appropriate threshold value cannot be set and the sensitivity is lowered. Therefore, it is necessary to automatically exclude the abnormality data from the learning data.
このようなニーズに対応するため、特開2011―70635号公報(特許文献1)には、特徴毎、周期毎の平均と分散に基づいて、他から外れる周期の学習データを除外する方法、特徴毎の1周期の波形モデルからの外れ回数に基づいて学習データを除外する方法が開示されている。また、正常データを周期単位にランダムにサンプリングして複数個の正常モデルを作成し、これを用いて算出した異常測度の上位数個の平均によって異常かどうかを識別し、異常を含む周期の学習データを除外する方法が開示されている。 In order to meet such needs, Japanese Patent Application Laid-Open No. 2011-70635 (Patent Document 1) describes a method and a feature for excluding learning data with a period that deviates from others based on the average and variance for each feature and each cycle. A method of excluding learning data based on the number of deviations from the waveform model of one cycle for each period is disclosed. In addition, normal data is randomly sampled on a periodic basis to create multiple normal models, which are used to identify abnormalities based on the average of the top several abnormalities calculated, and learn cycles that include abnormalities. A method for excluding data is disclosed.
特許文献1に記載の特徴毎、周期毎の平均と分散に基づいて異常の有無を検知する異常検知方法や、特徴毎の1周期の波形モデルからの外れ回数に基づいて異常の有無を検知する異常検知方法では、規則正しいオペレーションの設備以外には適用困難であるという問題がある。また、ランダムにサンプリングして作成した複数の正常モデルに基づく方法は、計算時間が長いという問題がある。
An abnormality detection method for detecting the presence / absence of abnormality based on the average and variance for each feature and period described in
そこで、本発明の目的は、上記課題を解決し、多次元時系列センサ信号を用いた正常モデルに基づく異常検知において適正なしきい値を設定するため、学習データに異常なデータが混入している場合は異常データを簡便な方法で適切に除外する異常検知方法およびその装置を提供することにある。 Therefore, an object of the present invention is to solve the above-mentioned problem and to set an appropriate threshold value in abnormality detection based on a normal model using a multidimensional time series sensor signal, abnormal data is mixed in learning data. In this case, it is an object of the present invention to provide an abnormality detection method and apparatus for appropriately excluding abnormal data by a simple method.
上記課題を解決するために、本発明では、設備または装置が稼働中に設備または装置に装着されたセンサから出力される多次元時系列センサ信号を用いて前記設備または装置の異常を検知する方法であって、多次元時系列センサ信号のうち、予め指定された学習期間のセンサ信号から特徴ベクトルを抽出する第1工程と、学習期間の特徴ベクトルから除外候補区間の特徴ベクトルを除外した学習データを抽出する第2工程と、学習データの異常測度を算出する第3工程と、学習期間のうち除外候補区間を除く期間における異常測度の最大値を抽出し、当該異常測度の最大値が、所定の更新条件を満たす場合には、異常判定しきい値を当該異常測度の最大値に更新し、除外候補区間を除外する第4工程と、異常測度の最大値の区間を除外候補区間に追加する第5工程と、所定の停止条件を満たすか否か判定を行う第6工程と、を含み、第6工程における判定の結果に基づいて、所定の停止条件を満たさない場合、第2工程、第3工程、第4工程、第5工程、第6工程の処理を行い、学習期間の特徴ベクトルから、第6工程における所定の停止条件を満たしたときの学習除外区間の特徴ベクトルを除外した学習データを抽出し、多次元時系列センサ信号のうち、予め指定されたテスト期間または新たに取得された期間のセンサ信号から特徴ベクトルを抽出して観測ベクトルとし、観測ベクトルと学習データとを用いて、観測ベクトルの異常測度を算出し、当該算出した観測ベクトルの異常測度と前記所定の停止条件を満たしたときの異常判定しきい値とを比較して、設備または前記装置の異常を検知することを特徴とする
In order to solve the above problems, in the present invention, a method of detecting an abnormality of the equipment or device using a multidimensional time series sensor signal output from a sensor attached to the equipment or device while the equipment or device is operating. a is, among the multi-dimensional time-series sensor signal, a first step of extracting a feature vector from the sensor signal pre-specified learning period, learning data excluding the feature vector of excluded candidate section from the feature vectors of the training period The second step of extracting the abnormal value, the third step of calculating the abnormal measure of the learning data , the maximum value of the abnormal measure in the period excluding the exclusion candidate section in the learning period is extracted, and the maximum value of the abnormal measure is predetermined. If the update condition is satisfied, the abnormality determination threshold is updated to the maximum value of the abnormality measure, the fourth step of excluding the exclusion candidate section, and the section of the maximum value of the abnormality measure is excluded If the predetermined stop condition is not satisfied based on the result of the determination in the sixth step, the second step is included.
また、上記した課題を解決するために、本発明では、設備または装置が稼働中に設備または装置に装着されたセンサから出力される多次元時系列センサ信号を用いて前記設備または装置の異常を検知する方法であって、設備または装置の異常を検知する方法は学習する工程と異常を検知する工程とを含み、学習する工程において、異常測度最大値に基づいて、学習除外区間を設定し、多次元時系列センサ信号のうち予め指定された期間のセンサ信号から前記学習除外区間のセンサ信号を除外して学習データを作成し、該作成した学習データから異常判定しきい値を算出し、前記異常を検知する工程において、学習データを用いて正常モデルを作成し、多次元時系列センサ信号から特徴ベクトルを観測ベクトルとして抽出し、抽出した観測ベクトルと作成した正常モデルとを用いて観測ベクトルの異常測度を算出し、算出した観測ベクトルの異常測度と異常判定しきい値とを比較して設備または装置の異常を検知するようにした。
In order to solve the above-described problems, in the present invention, an abnormality of the facility or apparatus is detected using a multidimensional time series sensor signal output from a sensor attached to the facility or apparatus during operation of the facility or apparatus. a method for detecting a method for detecting the abnormality of the equipment or apparatus includes the steps of detecting an abnormality and a step of learning, in the process of learning, based on the anomaly measure maximum value, set the learning exclusion zone, The learning data is created by excluding the sensor signal of the learning exclusion section from the sensor signal of the period specified in advance among the multi-dimensional time series sensor signal, the abnormality determination threshold is calculated from the created learning data, In the process of detecting anomalies, a normal model is created using learning data, feature vectors are extracted as observation vectors from multidimensional time-series sensor signals, and extracted observation vectors are extracted. Using a normal model created with Le calculates the anomaly measure of observation vectors, and configured to detect the abnormality of the equipment or device is compared with the anomaly measure of the calculated observation vector and the abnormality determination threshold value.
更に、上記課題を解決するために、本発明では、設備または装置が稼働中に設備または装置に装着されたセンサから出力される多次元時系列センサ信号を用いて設備または装置の異常を検知する装置であって、多次元時系列センサ信号を蓄積するセンサ信号蓄積部と、多次元時系列センサ信号をもとに特徴ベクトルを抽出する特徴ベクトル抽出部と、特徴ベクトル抽出部で抽出された予め指定された学習期間の特徴ベクトルから学習除外区間の特徴ベクトルを除外して学習データを作成するする学習データ作成部と、学習データ作成部で作成された学習データを用いて各時刻の特徴ベクトルに対応する正常モデルを作成する正常モデル作成部と、特徴ベクトル抽出部で抽出された各時刻の特徴ベクトルと前記正常モデル作成部で作成された正常モデルとを用いて異常測度を算出する異常測度算出部と、異常測度最大値に基づいて、前記学習除外区間の設定をする除外区間設定部と、学習データ作成部で作成された学習データについて異常測度算出部で算出した異常測度に基づいてしきい値を算出するしきい値算出部と、異常測度算出部で算出された各特徴ベクトルの異常測度としきい値算出部で算出されたしきい値とを比較することにより設備または装置の異常を検知する異常検知部とを備えて構成した。
Furthermore, in order to solve the above-described problem, in the present invention, an abnormality of the facility or apparatus is detected using a multidimensional time series sensor signal output from a sensor attached to the facility or apparatus while the facility or apparatus is in operation. an apparatus, a sensor signal storage unit for storing multi-dimensional time-series sensor signal, a feature vector extraction unit for extracting based on the feature vectors of multidimensional time-series sensor signals, previously extracted by the feature vector extraction unit A learning data creation unit that creates the learning data by excluding the feature vectors of the learning exclusion period from the feature vectors of the specified learning period, and the feature data at each time using the learning data created by the learning data creation unit A normal model creation unit that creates a corresponding normal model, a feature vector at each time extracted by the feature vector extraction unit, and a normal model created by the normal model creation unit Model and the anomaly measure calculating unit for calculating the anomaly measure with, based on the anomaly measure the maximum value, the excluded section setting unit for setting the learning exclusion zone, abnormal learning data created by the learning data creation section A threshold value calculation unit for calculating a threshold value based on the anomaly measure calculated by the measure calculation unit, an anomaly measure for each feature vector calculated by the anomaly measure calculation unit, and a threshold value calculated by the threshold value calculation unit And an abnormality detection unit that detects an abnormality of the facility or the apparatus by comparing with the above.
本発明によれば、学習データから異常測度が高い区間を除外して異常測度を再計算することを逐次繰り返し、各回の結果に基づいて学習データから除外する区間と異常判定しきい値を設定するため、適切に学習データから異常な区間を除外して低い異常判定しきい値を設定することができ、高感度な異常検知を実現できる。
以上の手法を適用したシステムにより、ガスタービンや蒸気タービンなどの設備のみならず、水力発電所での水車、原子力発電所の原子炉、風力発電所の風車、航空機や重機のエンジン、鉄道車両や軌道、エスカレータ、エレベータ、工場の生産設備、そして機器・部品レベルでは、搭載電池の劣化・寿命など、あるいは脳波や心電図など人を対象としたセンシングデータにおいて、対象の異常を早期に検出することが可能となる。
According to the present invention, it is successively repeated to exclude a section having a high abnormality measure from learning data and recalculate the abnormality measure, and to set a section to be excluded from the learning data and an abnormality determination threshold based on each result. Therefore, it is possible to appropriately exclude abnormal sections from the learning data and set a low abnormality determination threshold value, thereby realizing highly sensitive abnormality detection.
By applying the above method, not only equipment such as gas turbines and steam turbines, but also water turbines at hydroelectric power plants, nuclear reactors at nuclear power plants, wind turbines at wind power plants, engines for aircraft and heavy machinery, railway vehicles, At the orbit, escalator, elevator, factory production equipment, and equipment / parts level, it is possible to detect the abnormality of the target early in sensing data targeting humans such as the deterioration / life of the on-board battery or brain waves and electrocardiograms. It becomes possible.
本発明は、設備に装着されたセンサから出力されるセンサ信号に基づいて前記設備の異常を検知する異常検知装置、及び設備の異常を検知する異常検知方法において、学習データから異常測度が高い区間を除外して異常測度を再計算することを逐次繰り返し、各回の結果に基づいて学習データから除外する区間と異常判定しきい値を設定するようにして、適切に学習データから異常な区間を除外して低い異常判定しきい値を設定することができるようにし、高感度な異常検知を実現できるようにしたものである。
以下に、本発明の実施例を、図を用いて説明する。
The present invention relates to an abnormality detection device that detects an abnormality of the equipment based on a sensor signal output from a sensor attached to the equipment, and an abnormality detection method that detects an abnormality of the equipment, and a section having a high abnormality measure from learning data. And recalculate the anomaly measure one after the other, and by setting the interval to be excluded from the learning data and the anomaly judgment threshold based on the results of each time, the abnormal interval is appropriately excluded from the learning data Thus, a low abnormality determination threshold value can be set so that highly sensitive abnormality detection can be realized.
Embodiments of the present invention will be described below with reference to the drawings.
図1に、本発明の異常検知方法を実現するための異常検知システム100の一構成例を示す。
本異常検知システム100は、センサ信号解析部120と、入出力部130とを備えている。センサ信号解析部120は、設備101から出力されるセンサ信号102を生データとして蓄積するセンサ信号蓄積部103、センサ信号102をもとに特徴ベクトルを抽出する特徴ベクトル抽出部104、予め指定された学習期間の特徴ベクトルから学習除外区間の特徴ベクトルを除外する学習データ選別部105、選別された学習データを用いて各時刻の特徴ベクトルに対応する正常モデルを作成する正常モデル作成部106、各時刻の特徴ベクトルと作成された正常モデルに基づいて異常測度を算出する異常測度算出部107、選別された学習データの異常測度に基づいて学習データから除外する区間を設定する除外区間設定部108、選別された学習データの異常測度に基づいてしきい値を算出するしきい値算出部109、各特徴ベクトルの異常測度と算出されたしきい値との比較により異常を検出(検知)する異常検出部110を備えて構成される。入出力部130は、表示画面131を備えている。
FIG. 1 shows a configuration example of an
The
本異常検知システム100の動作には、蓄積されたデータを用いて学習データの生成、保存を行う「学習」と入力信号に基づき異常を検知する「異常検知」の二つのフェーズがある。基本的に前者はオフラインの処理、後者はオンラインの処理である。ただし、後者をオフラインの処理とすることも可能である。以下の説明では、それらを学習時、異常検知時という言葉で区別する。
The operation of the
本異常検知システム100で状態監視の対象とする設備101は、例えばガスタービンや蒸気タービンなどの設備やプラントである。設備101は、その状態を表すセンサ信号102を出力する。センサ信号102はセンサ信号蓄積部103に蓄積されている。センサ信号102をリスト化して表形式に表した例を図2に示す。センサ信号102は一定間隔毎に取得される多次元時系列信号であり、それをリスト化した表は、図2に示すように、日時の欄201と設備101に設けられた複数のセンサ値のデータの欄202からなる。センサの種類は、数百から数千といった数になる場合もあり、例えば、シリンダ、オイル、冷却水などの温度、オイルや冷却水の圧力、軸の回転速度、室温、運転時間などである。出力や状態を表すのみならず、何かをある値に制御するための制御信号の場合もある。
The
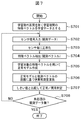
センサ信号解析部120における学習時の処理の流れを図3を用いて説明する。学習時はセンサ信号蓄積部103に蓄積されたデータのうち指定された期間のデータを用いて、特徴ベクトルを抽出する。ここで抽出されたデータを学習データと呼ぶ。除外区間を除く学習データの異常測度を交差検証により算出し、その結果に基づき学習から除外する区間を決定し異常判定のしきい値を算出することを繰り返す。異常検知時には繰り返しが終了したときの学習除外区間と異常判定しきい値を採用する。
The flow of processing during learning in the sensor
まず、特徴ベクトル抽出部104、学習データ選別部105、正常モデル作成部106、異常測度算出部107、除外区間設定部108、しきい値算出部109における処理の流れを、図3を用いて説明する。
始めに、特徴ベクトル抽出部104において、センサ信号蓄積部103から学習期間として指定された期間のセンサ信号102を入力し(S301)、センサ信号毎に正準化した後(S302)、特徴ベクトルの抽出を行い(S303)、特徴ベクトルを複数区間、例えば1日につき一つの区間に分ける(S304)。次に、除外区間設定部108で除外区間を決めるためのパラメータを入力する(S305)。パラメータは、最大繰り返し回数N、最大保留回数M、有効下がり幅Δである。予め、パラメータファイルまたはGUIにより設定しておく。
First, the flow of processing in the feature
First, in the feature
次に、異常測度算出部107で学習期間の全特徴ベクトルの異常測度算出し、除外区間設定部108で設定した除外候補区間を除く学習期間における異常測度の最大値を抽出する(S306)。初回は、除外候補区間はなしである。初回の場合、または、(前回までに設定されたしきい値−異常測度最大値)で算出される下がり幅がパラメータΔより大きい場合は(S307)、しきい値算出部109において、異常測度最大値をしきい値とし、除外区間設定部108において、除外候補区間を学習除外区間にとする(S308)。
Next, the abnormal
ステップS307でNOの場合(2回目以降、または、下がり幅がパラメータΔ以下の場合)は、しきい値はそれまでの値を継承する。また、学習除外区間もそのままとする。そして、下がり幅をチェックし(S309)、下がり幅が負、すなわち増加する場合(S309でYESの場合)、保留回数をカウントアップする(S310)。保留回数の初期値は図示していないがもちろん0である。一方、下がり幅が正又はゼロ、すなわち減少または変化しない場合(S309でNOの場合)、保留回数はそのままとする。
In the case of NO in step S307 (after the second time, or when the decrease width is equal to or smaller than the parameter Δ), the threshold value inherits the value up to that point. Also, the learning exclusion section is left as it is. Then, the decrease width is checked (S309), and if the decrease width is negative, that is, increases (YES in S309), the number of suspensions is counted up (S310). Although the initial value of the number of times of holding is not shown, it is of
ステップS308またはS309またはS310の処理の後、除外区間設定部108において、異常測度最大値の区間を除外候補区間に追加する(S311)。繰り返し回数及び保留回数をチェックし(S312)、繰り返し回数がN回目または保留回数がパラメータMより大きい場合(S312でYESの場合)、処理を終了し、S307へ進む。終了時の学習除外区間としきい値を学習結果として記録しておく。
ここで繰り返し回数とはステップS306を実行した回数のことであり、保留回数とはステップS310でカウントされる数のことである。ステップS312においてNOの場合(繰り返し回数がN回目より少なく、かつ、保留回数がパラメータM以下の場合、ステップS306に戻る。
After the process of step S308, S309, or S310, the exclusion
Here, the number of repetitions is the number of times that step S306 has been executed, and the number of times of suspension is the number counted in step S310. If NO in step S312 (if the number of repetitions is less than the Nth and the number of suspensions is equal to or less than parameter M, the process returns to step S306.
次に、主なステップについて詳細に説明する。
ステップS302においては、特徴ベクトル抽出部104において、各センサ信号の正準化を行う。例えば、指定された期間の各センサ信号の平均と標準偏差を用いて、平均を0、分散を1となるように変換する。異常検知時に同じ変換ができるよう、各センサ信号の平均と標準偏差を記憶しておく。あるいは、各センサ信号の指定された期間の最大値と最小値を用いて最大が1、最小が0となるように変換する。あるいは、最大値と最小値の代わりに予め設定した上限値と下限値を用いてもよい。異常検知時に同じ変換ができるよう、各センサ信号の最大値と最小値または上限値と下限値を記憶しておく。センサ信号の正準化は、単位およびスケールの異なるセンサ信号を同時に扱うためのものである。
Next, main steps will be described in detail.
In step S302, the feature
ステップS303においては、特徴ベクトル抽出部104において、時刻毎に特徴ベクトル抽出を行う。センサ信号を正準化したものをそのまま並べることが考えられるが、ある時刻に対して±1,±2,…のウィンドウを設け,ウィンドウ幅(3,5,…)×センサ数の特徴ベクトルにより、データの時間変化を表す特徴を抽出することもできる。また、離散ウェーブレット変換(DWT: Discrete Wavelet Transform)を施して、周波数成分に分解してもよい。さらに、ステップS303において、特徴選択を行う。最低限の処理として、分散が非常に小さいセンサ信号および単調増加するセンサ信号を除く必要がある。
In step S303, the feature
また、相関解析による無効信号を削除することも考えられる。これは、多次元時系列信号に対して相関解析を行い、相関値が1に近い複数の信号があるなど、極めて類似性が高い場合に、これらは冗長だとして、この複数の信号から重複する信号を削除し、重複しないものを残す方法である。 It is also conceivable to delete invalid signals by correlation analysis. This is because when a correlation analysis is performed on a multidimensional time series signal and there are a plurality of signals having a correlation value close to 1, such that there is a high similarity, these are redundant and duplicated from the plurality of signals. This is a method of deleting signals and leaving non-overlapping ones.
このほか、ユーザが指定するようにしてもよい。また、長期変動が大きい特徴を除くことも考えられる。長期変動が大きい特徴を用いることは正常状態の状態数を多くすることにつながり、学習データの不足を引き起こすためである。例えば、1周期期間毎の平均と分散を算出し、それらのばらつきによって長期変動の大きさを推定できる。 In addition, the user may specify. It is also possible to exclude features with large long-term fluctuations. This is because the use of features with large long-term fluctuations leads to an increase in the number of states in the normal state and causes a shortage of learning data. For example, the average and variance for each period can be calculated, and the magnitude of long-term fluctuation can be estimated based on these variations.
ステップS306における処理の詳細を、図4を用いて説明する。始めに、学習データ選別部105において、全学習期間で抽出された特徴ベクトルから、除外区間設定部108において設定された除外候補区間に含まれる特徴ベクトルを除いたものを学習データとする(S401)。次に、学習期間の特徴ベクトルの中から1個目の特徴ベクトルに注目し(S402)、正常モデル作成部106において、注目ベクトルと同じ区間を除く学習データを用いて、正常モデルを作成する(S403)。なお、ここでの区間はステップS401における区間と同じ分割に基づくものでもよいし、独立した分割を定義してもよい。異常測度算出部107において、注目ベクトルと正常モデルの距離に基づいて異常測度を算出する(S404)。全ベクトルの異常測度算出が終了していれば(S405)、ステップS306の処理を終了してステップS307へ進む。ステップS405において全ての異常測度算出が終了していなければ、次の特徴ベクトルに注目し(S406)、ステップS403からS405の処理を繰り返す。
Details of the processing in step S306 will be described with reference to FIG. First, the learning
正常モデル作成手法としては、局所部分空間法(LSC: Local Sub−space Classifier)や投影距離法(PDM: Projection Distance Method)が考えられる。 As a normal model creation method, a local subspace method (LSC) or a projection distance method (PDM) can be considered.
局所部分空間法は、注目ベクトルqのk−近傍ベクトルを用いてk−1次元のアフィン部分空間を作成する方法である。図5にk=3の場合の例を示す。図5に示すように、異常測度は図に示す投影距離で表されるため、注目ベクトルqに最も近いアフィン部分空間上の点を求めればよい。評価データqとそのk−近傍ベクトルxi( i = 1,…,k )から算出することができる、qをk個並べた行列Qとxiを並べた行列Xから The local subspace method is a method of creating a k−1 dimensional affine subspace using the k−neighbor vector of the vector of interest q. FIG. 5 shows an example in the case of k = 3. As shown in FIG. 5, since the abnormal measure is represented by the projection distance shown in the figure, a point on the affine subspace closest to the vector of interest q may be obtained. From the evaluation data q and its k-neighbor vector xi (i = 1, ..., k)
![]()
![]()

異常測度dはqとXbの間の距離であるから次式で表される。 Since the abnormal measure d is a distance between q and Xb, it is expressed by the following equation.
![]()
![]()
なお、図2ではk=3の場合を説明したが、特徴ベクトルの次元数より十分小さければいくつでもよい。k=1の場合は、最近傍法と等価の処理になる。 In FIG. 2, the case of k = 3 has been described, but any number may be used as long as it is sufficiently smaller than the number of dimensions of the feature vector. When k = 1, the processing is equivalent to the nearest neighbor method.
投影距離法は、選択された特徴ベクトルに対し独自の原点をもつ部分空間すなわちアフィン部分空間(分散最大の空間)を作成する方法である。なんらかの方法で注目ベクトルに対応する複数の特徴ベクトルを選択し、以下の方法でアフィン部分空間を算出する。まず、選択された特徴ベクトルの平均μと共分散行列Σを求め、次にΣの固有値問題を解いて値の大きい方から予め指定したr個の固有値に対応する固有ベクトルを並べた行列Uをアフィン部分空間の正規直交基底とする。rは特徴ベクトルの次元より小さくかつ選択データ数より小さい数とする。あるいはrを固定した数とせず、固有値の大きい方から累積した寄与率が予め指定した割合を超えたときの値としてもよい。異常測度は、注目ベクトルのアフィン部分空間への投影距離とする。ここで、複数の特徴ベクトルの選択方法としては、予め指定した数十から数百の数の特徴ベクトルを注目ベクトルから近い順に選択する方法が考えられる。また、学習対象の特徴ベクトルを予めクラスタリングしておき、注目ベクトルに最も近いクラスタに含まれる特徴ベクトルを選択するようにしてもよい。
この他、注目ベクトルqのk−近傍ベクトルの平均ベクトルまでの距離を異常測度とする局所平均距離法や、ガウシアンプロセスなどを用いてもよい。
The projection distance method is a method of creating a subspace having an original origin for a selected feature vector, that is, an affine subspace (space of maximum dispersion). A plurality of feature vectors corresponding to the vector of interest are selected by some method, and the affine subspace is calculated by the following method. First, the average μ of the selected feature vectors and the covariance matrix Σ are obtained, and then the eigenvalue problem of Σ is solved, and a matrix U in which eigenvectors corresponding to r eigenvalues designated in advance from the largest value are arranged is affine. Let it be an orthonormal basis of the subspace. r is a number smaller than the dimension of the feature vector and smaller than the number of selected data. Alternatively, r may not be a fixed number, and may be a value when the contribution rate accumulated from the larger eigenvalue exceeds a predesignated ratio. The anomaly measure is the projection distance of the vector of interest onto the affine subspace. Here, as a method for selecting a plurality of feature vectors, a method of selecting several tens to several hundreds of feature vectors specified in advance in order from the vector of interest is conceivable. Further, feature vectors to be learned may be clustered in advance, and feature vectors included in a cluster closest to the vector of interest may be selected.
In addition, a local average distance method in which the distance from the k-neighbor vector to the average vector of the attention vector q is an abnormal measure, a Gaussian process, or the like may be used.
ステップS308では、しきい値算出部109において異常測度最大値をしきい値として設定することを説明したが、それ以外のしきい値算出方法の変形例を説明する。異常測度最大値以外のしきい値としては、除外候補区間を除く学習期間の全特徴ベクトルの異常測度を昇順にソートし、予め指定した1に近い比率に到達する値をしきい値とする方法が有る。あるいはこの値にオフセットを加える、定数倍するなどの処理によりしきい値を算出することも可能である。この場合、異常測度最大値を第一のしきい値、上記手順で算出されたしきい値を第二のしきい値とし、ステップS307における比較で用いるのは第一のしきい値とし、ステップS308では、第一のしきい値と第二のしきい値の両方を更新し、処理終了後(S313)、第二のしきい値を異常判定しきい値として記録する。
In step S308, it has been described that the threshold
上記に示したように、異常測度最大の区間を学習から除外することを逐次的に行い、予め定めたパラメータに従って学習除外区間の決定と繰り返しの停止を行うことにより、適切な除外区間を見つけ、適切なしきい値を設定して高感度な異常検知を実現可能とする。逐次的に行うのは、学習データが変化すると各特徴ベクトルの異常測度が変化するためである。 As shown above, it is sequentially performed to exclude the section with the maximum abnormal measure from the learning, and by determining the learning exclusion section and stopping the repetition according to the predetermined parameter, find the appropriate exclusion section, An appropriate threshold value is set to enable highly sensitive abnormality detection. The reason for performing sequentially is that the abnormality measure of each feature vector changes when the learning data changes.
ステップS307における下がり幅は、除外した区間の妥当性を評価する目安である。下がり幅が大きいときには除外した区間のデータが他の区間の学習データから離れており、学習にもあまり使われていないことを示している。すなわち異常である可能性が高いため除外すべきである。小さい場合は、除外することによるしきい値の低下が小さいということであり、メリットがなく異常かどうかの判断が難しいため除外しなくてもよい。負の場合は、除外することによりしきい値が上昇するということであり、除外した区間のデータが他の区間のデータの学習に使用されていたことを示している。本来は除外すべきではないが、類似する異常が2つの区間で発生していた場合、一方を除外するともう一方の異常測度が上昇することが起こるため、保留という考えを導入した。最大保留回数Mの設定により、このような対になる異常区間をM組までまとめて除外することが可能となる。 The descending width in step S307 is a measure for evaluating the validity of the excluded section. When the drop width is large, the data of the excluded section is separated from the learning data of the other sections, indicating that it is not used much for learning. In other words, it should be excluded because it is likely to be abnormal. If it is small, it means that the drop in the threshold value due to the exclusion is small, and there is no merit and it is difficult to determine whether it is abnormal. A negative value means that the threshold value increases by the exclusion, indicating that the data in the excluded section was used for learning the data in other sections. Although it should not be excluded originally, if a similar anomaly occurred in two sections, the exclusion of one would raise the other anomaly measure, so the idea of suspension was introduced. By setting the maximum number of suspensions M, it is possible to exclude up to M pairs of such abnormal sections together.
図3に示すフローでは、除外候補区間を一つずつ追加していたが、複数追加するようにしてもよい。その場合、ステップS306において、区間別に異常測度最大値を算出する。さらに、ステップS311において、区間別の異常測度最大値が(しきい値−Δ)より大きい全ての区間を除外候補区間とする。 In the flow shown in FIG. 3, the exclusion candidate sections are added one by one, but a plurality may be added. In that case, in step S306, the abnormal measure maximum value is calculated for each section. Furthermore, in step S311, all the sections where the abnormal measure maximum value for each section is larger than (threshold value −Δ) are set as exclusion candidate sections.
学習時の処理の流れの、図3で説明した処理フローとは別の実施例を図6を用いて説明する。始めに、特徴ベクトル抽出部104において、センサ信号蓄積部103から学習期間として指定された期間のセンサ信号102を入力し(S601)、センサ信号毎に正準化した後(S602)、特徴ベクトルの抽出を行い(S603)、特徴ベクトルを複数区間、例えば1日につき一つの区間に分ける(S604)。ここまでの処理は、図3に示したステップS301〜S304までと同じである。
An embodiment different from the processing flow described in FIG. 3 in the flow of processing during learning will be described with reference to FIG. First, in the feature
次に、除外区間を決めるためのパラメータを入力する(S605)。入力するパラメータは、最大繰り返し回数Nと除外ペナルティ係数pである。予め、パラメータファイルまたはGUIにより設定しておく。次に、学習期間のベクトルの異常測度算出を実行する(S606)。初回は、除外候補区間は無い。除外区間設定部108において、除外候補区間を除く異常測度最大値の区間を除外候補区間に追加する(S607)。次に、繰り返し回数をチェックし(S608)、繰り返し回数がN回目の場合(S608でYESの場合)、(異常測度最大値+繰り返し回数*p)が最小となるときの異常測度最大値をしきい値とし、そのときの除外候補区間を学習除外期間とし(S609)、処理を終了する。学習除外区間としきい値を学習結果として記録しておく。ステップS608において繰り返し回数がN回未満であった場合(S608でNOの場合)、ステップS606に戻る。
Next, parameters for determining the excluded section are input (S605). The parameters to be input are the maximum number of repetitions N and the exclusion penalty coefficient p. It is set in advance using a parameter file or GUI. Next, the abnormal measure calculation of the learning period vector is executed (S606). At the first time, there is no exclusion candidate section. In the excluded
上記に示したように、異常測度最大の区間を学習から除外することを予め決められた回数だけ逐次的に行い、各回の結果に基づいて予め決められたパラメータに従って学習除外区間としきい値を決定することにより、適切な除外区間を見つけ、適切なしきい値を設定して高感度な異常検知を実現可能とする。除外ペナルティ係数pには、図3に示す処理フローにおける有効下がり幅Mと類似した作用がある。pを0とすると、しきい値が最も低くなるように学習除外区間が決定される。pを0より大きくすると、異常かどうか判断の微妙な区間の除外を抑制する。 As shown above, the section with the maximum anomaly measure is excluded from learning sequentially for a predetermined number of times, and the learning exclusion section and the threshold are determined according to the predetermined parameters based on the results of each time. By doing so, it is possible to find an appropriate exclusion section and set an appropriate threshold value to realize highly sensitive abnormality detection. The exclusion penalty coefficient p has an action similar to the effective fall width M in the processing flow shown in FIG. When p is 0, the learning exclusion period is determined so that the threshold value becomes the lowest. When p is larger than 0, the exclusion of subtle sections for determining whether or not there is an abnormality is suppressed.
異常検知時の処理の流れを図7を用いて説明する。異常検知時はセンサ信号蓄積部103に蓄積されたデータのうち指定された期間のデータあるいは新たに観測されたデータの異常測度を算出し、正常か異常かの判定を行う。
図7は、特徴ベクトル抽出部104、学習データ選別部105、正常モデル作成部106、異常測度算出部107、異常検出部110における異常検知時の処理の流れを説明する図である。始めに、学習データ選別部105において、学習除外区間を除く学習期間の特徴ベクトルを学習対象の特徴ベクトルとする(S701)。これらの特徴ベクトルを単に学習データと呼ぶこととする。次に、特徴ベクトル抽出部104において、センサ信号蓄積部103または設備101からセンサ信号102を入力し(S702)、センサ信号毎に正準化した後(S703)、特徴ベクトルの抽出を行う(S704)。
The flow of processing when an abnormality is detected will be described with reference to FIG. When an abnormality is detected, an abnormality measure of data for a specified period or newly observed data among the data accumulated in the sensor
FIG. 7 is a diagram for explaining the flow of processing at the time of abnormality detection in the feature
センサ信号の正準化には、図3のステップS302に示す処理において、学習データの正準化に用いたものと同じパラメータを用いる。特徴ベクトルの抽出は、ステップS303の処理と同じ方法で行う。したがって、ステップS303において特徴選択を実行した場合は同じ特徴を選択する。ここで抽出された特徴ベクトルを、学習データと区別するために観測ベクトルと呼ぶこととする。 For the canonicalization of the sensor signal, the same parameters as those used for the canonicalization of the learning data are used in the process shown in step S302 of FIG. The feature vector is extracted by the same method as that in step S303. Therefore, when the feature selection is executed in step S303, the same feature is selected. The feature vector extracted here is referred to as an observation vector in order to distinguish it from learning data.
次に、正常モデル作成部106において、学習データを用いて正常モデルを作成し(S705)、異常測度算出部107において、正常モデルと観測ベクトルの距離に基づいて異常測度を算出する(S706)。正常モデル作成の方法は学習時と同じ方法とする。異常検出部110において、学習時に算出したしきい値と異常測度を比較して、異常測度がしきい値より大きければ異常、そうでなければ正常と判定する(S707)。次に、未処理の観測データがないかをチェックし(S708)未処理の観測データがない場合には(S708でYESの場合)、処理を終了する。一方、未処理の観測データが残っている場合には(S708でNOの場合)、ステップS702からS707までの処理を対象データがある限り、繰り返す。
Next, the normal
以上の方法を実現する異常検知システム100の入出力部130の表示部131に表示するGUIの実施例を説明する。
学習期間および処理パラメータ設定のためのGUIの例を、図8に示す。以下の説明ではこの設定のことを単にレシピ設定と呼ぶことにする。また、過去のセンサ信号102は設備IDおよび時刻と対応付けられてデータベースに保存されているものとする。表示部131に表示されるレシピ設定画面801では、対象装置、学習期間、使用センサ、基準算出パラメータ、しきい値設定パラメータを入力する。
An embodiment of a GUI displayed on the
An example of a GUI for setting the learning period and processing parameters is shown in FIG. In the following description, this setting is simply referred to as recipe setting. The
設備ID入力ウィンドウ802には、対象とする設備のIDを入力する。設備リスト表示ボタン803押下により図示はしていないがデータベースに保存されているデータの装置IDのリストが表示されるので、リストから選択入力する。学習期間入力ウィンドウ804には、学習データを抽出したい期間の開始日と終了日を入力する。センサ選択ウィンドウ805には、使用するセンサを入力する。
In the facility
リスト表示ボタン806のクリックによりセンサリスト807が表示されるので、カーソル820をリスト上の所望のセンサに上に移動させてクリックすることにより選択入力する。リストから複数選択することも可能である。正常モデルパラメータ入力ウィンドウ808には、正常モデル作成において使用するパラメータを入力する。
By clicking the
図は正常モデルとして局所部分空間を採用した場合の例であり、モデル作成に使う近傍ベクトル数と正則化パラメータを入力する。正則化パラメータは、数2において相関行列Cの逆行列が求められないことを防ぐため、対角成分に加算する小さい数である。しきい値設定パラメータ入力ウィンドウ809には、しきい値設定処理において使用するパラメータを入力する。図は、累積ヒストグラムに適用する比率の例である。ここには0以上1以下の実数を入力する。1の場合、ステップS308において異常測度最大値をしきい値とする。1未満の場合、変形例として説明したように、除外候補区間を除く学習期間の全特徴ベクトルの異常測度を昇順にソートし、ここで指定した比率に達する値を第二のしきい値とし、繰り返し終了後に第二のしきい値を異常判定しきい値とする。
The figure shows an example in which a local subspace is adopted as a normal model, and the number of neighboring vectors used for model creation and regularization parameters are input. The regularization parameter is a small number added to the diagonal component in order to prevent the inverse matrix of the correlation matrix C from being obtained in
レシピ名入力ウィンドウ811には、入力された情報に対応付けるユニークな名前を入力する。全ての情報を入力したらテスト期間入力ウィンドウ1311にテスト対象期間を入力する。ここは空欄にしてもよい。その場合は学習のみ行う。以上の情報を入力後、テストボタン813の押下により、レシピのテストを行う。
この操作により、同じレシピ名で実行したテストの通し番号が採番される。装置ID情報、使用センサ情報、学習期間、特徴ベクトル抽出に用いるパラメータ、正常モデルパラメータをレシピ名およびこのテスト番号と対応付けて保存しておく。
In the recipe
By this operation, the serial number of the test executed with the same recipe name is assigned. Device ID information, use sensor information, learning period, parameters used for feature vector extraction, and normal model parameters are stored in association with recipe names and test numbers.
次に、図3に示した処理フローに従って学習を実行する。ステップS302の正準化においては、指定した学習期間の全センサ信号を用いて平均と標準偏差を求める。この平均と標準偏差の値は、センサ毎にレシピ名およびテスト番号に対応付けて保存しておく。ステップS304における区間の分割は例えば1日毎とし分割番号を日付に対応付けて保存しておく。 Next, learning is executed according to the processing flow shown in FIG. In canonicalization in step S302, an average and a standard deviation are obtained using all sensor signals in a designated learning period. The average and standard deviation values are stored in association with the recipe name and test number for each sensor. The division in step S304 is, for example, every day, and the division number is stored in association with the date.
ステップS306からS311までの処理は、ステップS312において終了条件を満たすまで繰り返される。繰り返しの際には、1から始まる処理番号を順に振っておく。ステップS306における除外候補区間の番号、算出された全学習期間の異常測度および異常測度最大値、ステップS308において決定した、あるいは前回から継承されたしきい値と学習除外区間、その時点での保留回数を処理番号と併せて保存しておく。また、図3には示されていないが、表示のため、ステップS306において算出された異常測度最大値をしきい値として全学習期間の異常判定を行い、結果を保存しておく。また、繰り返し終了時のしきい値と学習除外区間が決定された処理番号も保存しておく。 The processing from step S306 to S311 is repeated until the end condition is satisfied in step S312. When iterating, process numbers starting from 1 are assigned in order. The number of exclusion candidate sections in step S306, the calculated anomaly measure and anomaly measure maximum value for all learning periods, the threshold value and the learning exclusion section determined in step S308 or inherited from the previous time, and the number of holds at that time Is stored together with the process number. Although not shown in FIG. 3, for the purpose of display, the abnormality determination for the entire learning period is performed using the abnormality measure maximum value calculated in step S306 as a threshold value, and the result is stored. Further, the threshold value at the end of repetition and the process number for which the learning exclusion section is determined are also stored.
次に、テスト期間のセンサ信号102を用いて、学習時の処理番号に対応させて、図7に示す異常検知の処理を行い、異常測度と判定結果を処理番号と併せて保存する。各回のステップS701における学習除外区間は、学習時の対応する処理番号のステップS306において使用された除外候補区間とする。各回のステップS707におけるしきい値は、学習時の対応する処理番号のステップS306において算出された異常測度最大値とする。
Next, using the
レシピテスト終了後、テストの結果がユーザに示される。そのためのGUIの例を図9Aおよび図9Bおよび図9Cに示す。各画面の上部に表示されたタブを選択することにより、結果表示画面901と結果拡大表示画面902と学習データ選別詳細表示画面903を切り換えることができる。
After the recipe test, the test result is shown to the user. Examples of GUIs for this purpose are shown in FIGS. 9A, 9B, and 9C. By selecting a tab displayed at the top of each screen, the
図9Aには、表示部131に表示される結果表示画面901を示す。結果表示画面901には、指定された全期間の異常測度、しきい値、判定結果とセンサ信号の時系列グラフなどの全体を表示する。期間表示ウィンドウ904には、指定された学習期間およびテスト期間が表示される。処理番号表示ウィンドウ905には、表示中のデータの処理番号を表示する。最初は、繰り返し終了時のしきい値と学習除外区間が決定された処理番号が表示されるものとする。異常測度表示ウィンドウ906には、指定された学習期間およびテスト期間および処理番号の異常測度としきい値と判定結果が表示される。また、学習に使用した区間に丸印が表示される。センサ信号表示ウィンドウ907には、指定された期間の指定されたセンサの出力値が表示される。センサの指定は、センサ名選択ウィンドウ908への入力によって行う。ただし、ユーザが指定する前は、先頭のセンサが選択されている。カーソル909は、拡大表示の時の起点を表し、マウス操作により移動できる。表示日数指定ウィンドウ910には、この画面では使用しないが、結果拡大表示画面902での、拡大表示の起点から終点までの日数が表示される。この画面で入力することもできる。日付表示ウィンドウ911には、カーソル位置の日付が、表示される。終了ボタン912押下により結果表示画面901、結果拡大表示画面902、学習データ選別詳細表示画面903とも消去し終了する。
FIG. 9A shows a
図9Bには、結果拡大表示画面902を示す。結果拡大表示画面902には、結果表示画面901において、カーソル909で示された日付を起点として、指定された日数の異常測度、しきい値、判定結果とセンサ信号の拡大した時系列グラフを表示する。期間表示ウィンドウ904には、結果表示画面901と同じ情報が表示される。異常測度表示ウィンドウ906およびセンサ信号表示ウィンドウ907には、結果表示画面901と同様の情報が、拡大表示される。表示日数指定ウィンドウ910で、拡大表示の起点から終点までの日数を指定する。日付表示ウィンドウ911には、拡大表示の起点の日付が表示されている。スクロールバー913で表示の起点を変更することも可能であり、この変更はカーソル909の位置と日付表示ウィンドウ911の表示に反映される。スクロールバー表示領域914の全体の長さは結果表示画面901に表示されている全期間に相当する。また、スクロールバー914の長さは表示日数指定ウィンドウ910で指定された日数に相当し、スクロールバー913の左端部が拡大表示の起点に対応する。終了ボタン912押下により終了する。
FIG. 9B shows a result
図9Cには、表示部131に表示される学習データ選別詳細表示画面903の例を示す。学習データ選別詳細表示画面903には、しきい値、学習除外区間、区間毎の異常検知結果を処理番号別に表示する。期間表示ウィンドウ904には、指定された学習期間およびテスト期間が表示される。パラメータ表示ウィンドウ915には、学習データ選別のためのパラメータが表示される。
FIG. 9C shows an example of a learning data selection
学習データ選別詳細表示ウィンドウ916は、処理番号欄917、しきい値欄918、更新チェック欄919、区間表示欄920、学習区間チェック欄921、異常検知区間チェック欄922からなる。処理番号欄917には処理番号、しきい値欄918には、異常測度最大値が表示される。更新チェック欄919には、各処理番号に対し、図3のステップS308の処理を行った場合に丸印を表示する。そのうち、繰り返しの中で最後になる場合は二重丸を表示する。区間表示欄920には区間を表す情報を表示する。この例では月と日である。区間の分け方に合わせて時間を表示してもよいし、単純に区間番号を表示してもよい。学習区間チェック欄921には、対応する区間が対応する処理番号において、学習期間の除外候補区間の場合はバツ印、その他の場合は丸印、テスト期間の場合はハイフンを表示する。異常検知区間チェック欄922には、対応する区間が対応する処理番号において、一度でも異常検知された場合は丸印を表示する。一度も検知されない場合は空欄とする。
The learning data selection detail display window 916 includes a processing number column 917, a threshold value column 918, an update check column 919, a section display column 920, a learning
最終結果表示ウィンドウ923には、繰り返し処理終了後に確定したしきい値と学習除外区間と確定したときの処理番号、すなわち更新チェック欄919に二重丸が表示された処理番号を表示する。ここに表示されるのは学習結果であるが、異なる処理番号の結果を学習結果として保存したい場合、処理番号入力ウィンドウ924に番号を入力し、処理番号変更ボタン925を押下することにより、最終結果表示ウィンドウ923に表示される内容が入力された処理番号に対応する情報に書き換えられる。また、入力された処理番号が学習結果として保存される。終了ボタン912押下により終了する。
In the final result display window 923, the process number when the threshold value and the learning exclusion period determined after the end of the repetition process are determined, that is, the process number displayed with a double circle in the update check column 919 is displayed. Although the learning result is displayed here, if it is desired to save the result of the different process number as the learning result, the final result is obtained by inputting the number in the process number input window 924 and pressing the process number change button 925. The content displayed in the display window 923 is rewritten with information corresponding to the input process number. Further, the input process number is stored as a learning result. The process ends when the
図9A〜Cに示すいずれかの画面で、終了ボタン912押下により異常検出結果および学習データ選別結果の確認が終了したら、図8に示すレシピ設定画面801の表示に戻る。テスト番号表示ウィンドウ814には、上記のテストで採番された番号が表示されている。確認した内容に問題があれば、学習期間や選択センサ、パラメータなどを変更し、テストボタン813の押下により、再度テストを行う。あるいは、一度行ったテストの結果を再度確認することもできる。テスト番号表示ウィンドウ814からテスト番号を選択入力し、表示ボタン815を押下する。この操作により、レシピ名とテスト番号に対応付けて保存された情報をロードし結果表示画面901を表示する。タブの切り替えにより結果拡大表示画面902または学習データ選別詳細表示画面903を表示させることもできる。確認が済んだら終了ボタン912押下により、レシピ設定画面801の表示に戻る。
When the confirmation of the abnormality detection result and the learning data selection result is completed by pressing the
レシピ設定画面801上においてカーソル820を登録ボタン816の上に移動させて登録ボタン816を押下げる(クリックする)ことにより、上記レシピ名とテスト番号表示ウィンドウ814に表示中のテスト番号に対応付けて保存されている情報をレシピ名と対応付けて登録し、終了する。キャンセルボタン817が押下された場合は、何も保存しないで終了する。
By moving the
また、テスト結果一覧ボタン818が押下された場合は、図10に示す、テスト結果一覧表示画面1001を表示する。テスト結果リスト1002には、全てのテストの学習期間、テスト期間、選択センサ番号、正常モデル作成パラメータ、しきい値設定パラメータ学習データ選別パラメータなどのレシピ情報と、しきい値、学習除外区間、異常区間数などの学習・テスト結果情報を表示する。リストの左端に選択チェックボタンがあり、いずれか一つのみ選択することができる。詳細表示ボタン1003押下により、レシピ名とテスト番号に対応付けて保存された情報をロードし、結果表示画面901を表示する。タブの切り替えにより結果拡大表示画面902または異常検知結果表示画面903を表示させることもできる。
When the test result list button 818 is pressed, a test result
確認が済んだら終了ボタン912の押下により、テスト結果一覧表示画面1001の表示に戻る。登録ボタン1004の押下により、選択中のテスト番号に対応付けて保存されている情報をレシピ名と対応付けて登録し、テスト結果一覧表示画面1001の表示およびレシピ設定画面801の表示を終了する。戻るボタン1005が押下された場合は、レシピの登録は行わずにレシピ設定画面801の表示に戻る。
After confirmation, the
登録されたレシピは、活性か不活性かのラベルをつけて管理され、新しく観測されたデータに対しては、装置IDが一致する活性なレシピの情報を用いて図7を用いて説明した特徴ベクトル抽出から異常検出までの処理を行い、結果をレシピ名と対応付けて保存しておく。 Registered recipes are managed with active or inactive labels, and for newly observed data, the features described with reference to FIG. 7 using information on active recipes with matching device IDs Processing from vector extraction to abnormality detection is performed, and the result is stored in association with the recipe name.
以上の異常検知処理の結果を表示画面131上に表示するGUIの例を、図11に示す。図11は、表示対象を指定するGUIの例である。表示対象指定画面1101から表示対象の設備、レシピおよび期間を指定する。始めに、装置ID選択ウィンドウ1102により装置IDを選択する。次に、レシピ名選択ウィンドウ1103により、装置IDを対象としたレシピのリストから表示対象のレシピを選択する。データ記録期間表示部1104には、入力されたレシピを用いて処理され、記録が残されている期間の開始日と終了日が表示される。結果表示期間指定ウィンドウ1105には、結果を表示したい期間の開始日と終了日を入力する。表示センサ指定ウィンドウ1106には、表示したいセンサの名を入力する。表示ボタン1107押下により図9Aに示す結果表示画面901を表示する。終了ボタン912押下により終了する。
An example of a GUI that displays the result of the above abnormality detection processing on the
結果表示にかかわるGUIの画面および操作は、図9Aおよび図9Bに示すテスト結果表示にかかわるGUIとほぼ同じであるため、異なる部分のみ説明する。結果表示画面901、結果拡大表示画面902における期間表示ウィンドウ904には、図12に示すように結果表示期間指定ウィンドウ1105で指定された表示期間1201が表示される。結果表示画面901において、異常測度表示ウィンドウ906には、指定された表示期間の異常測度としきい値と判定結果が表示される。また、学習に使用した区間に丸印9061が表示される。センサ信号表示ウィンドウ907には、指定された期間の、表示センサ指定ウィンドウ1106により指定されたセンサの出力値が表示される。表示対象センサは、センサ名選択ウィンドウ908への入力によって変更することも可能である。新しく観測されたデータの結果表示の時には、学習データ選別詳細表示画面903は表示されない。
Since the GUI screen and operation related to the result display are substantially the same as the GUI related to the test result display shown in FIGS. 9A and 9B, only different parts will be described. In the
以上に説明したようなGUI上で、センサ信号、抽出した特徴、異常測度、しきい値を視覚的に確認しながら除外区間を設定して異常を検出するための正常モデルを設定することができるので、異常データを含まないデータを用いてよりよい正常モデルを作成することが可能になった。 On the GUI as described above, it is possible to set a normal model for detecting anomalies by setting exclusion sections while visually checking sensor signals, extracted features, abnormality measures, and threshold values. Therefore, it has become possible to create a better normal model using data that does not include abnormal data.
上記実施例は学習データ設定をオフライン、異常検知処理をリアルタイム、結果表示をオフラインでそれぞれ処理するものであるが、結果表示もリアルタイムに行うことが可能である。その場合、表示期間の長さ、表示対象とするレシピ、表示対象とする情報を予め定めておき、一定時間毎に最新の情報を表示するよう構成すればよい。
逆に、任意の期間を設定し、レシピを選択して、オフラインで異常検知処理を行う機能を付加したものも本発明の範囲に含まれる。
In the above embodiment, the learning data setting is performed offline, the abnormality detection process is processed in real time, and the result display is performed offline. However, the result display can also be performed in real time. In that case, the length of the display period, the recipe to be displayed, and the information to be displayed may be determined in advance, and the latest information may be displayed at regular intervals.
Conversely, the addition of a function for setting an arbitrary period, selecting a recipe, and performing an abnormality detection process offline is also included in the scope of the present invention.
本異常検知システム100は、センサ信号解析部120と、入出力部130とを備えている。
実施例1においては、設備から出力されるセンサ信号に基づき異常検知する方法の実施例を説明したが、別の実施例として、さらに、設備から出力されるイベント信号も利用して異常検知する方法を説明する。図13Aに、本実施例における異常検知方法を実現する異常検知システム1300の構成を示す。異常検知システム1300は、センサ信号解析部1320と、入出力部1330とを備えている。本実施例における異常検知システム1300は、図1に示した実施例1における異常検知システム100のセンサ信号解析部120の構成に、モード分割部1302を加えたものとなっている。図1で説明した構成と同じ番号を付した部分は、実施例1で説明したのと同じ機構を備えているので、説明を省略する。
The
In Example 1, although the Example of the method of detecting abnormality based on the sensor signal output from an installation was described, as another Example, the method of detecting an abnormality further using the event signal output from an installation further Will be explained. FIG. 13A shows a configuration of an
モード分割部1302は、設備101からイベント信号1301を入力し、これに基づき設備101の稼動状態を表すモードに分割する。モード分割の結果は、除外区間設定部108およびしきい値算出部109に入力され、図3で説明した処理フローと同じ処理が実施され、モード別にしきい値が設定される。除外区間の設定には、予め指定した1つのモードのみに着目しステップS306からS311までの処理を実施する。ただし、異常測度最大値は毎回モード別に記録しておく。また、異常検出部110におけるステップS707の異常判定を、対応するモードのしきい値を用いて行う。
The
あるいは、除外区間もモード別に設定することが考えられる。その場合は、全てのモードについて、1つずつ、着目したモードのみの異常測度に基づいて学習除外区間を決定する。このように決められた除外区間の対応するモードの部分を学習データから除外する。 Alternatively, it is conceivable to set the excluded section for each mode. In this case, the learning exclusion section is determined for each mode one by one based on the abnormality measure of only the focused mode. The portion of the mode corresponding to the excluded section determined in this way is excluded from the learning data.
次に、全てのモードについて、1つずつ、着目したモードのみの異常測度に基づいて学習除外区間を決定する処理のフローを、図13Bを用いて説明する。
始めに、特徴ベクトル抽出部104において、センサ信号蓄積部103から学習期間として指定された期間のセンサ信号102を入力し(S1341)、センサ信号毎に正準化した後(S1342)、特徴ベクトルの抽出を行い(S1343)、特徴ベクトルを複数区間、例えば1日につき一つの区間に分ける(S1344)。次に、除外区間設定部108で除外区間を決めるためのパラメータを入力する(S1345)。パラメータは、最大繰り返し回数N、最大保留回数M、有効下がり幅Δである。予め、パラメータファイルまたはGUIにより設定しておく。
Next, a flow of processing for determining a learning exclusion section based on the abnormality measure of only the mode of interest for each mode will be described with reference to FIG. 13B.
First, in the feature
一方、設備101から出力されたイベント信号1301をモード分割部1302に入力し(S1361)、不定期に出力される設備の操作開始・操作停止・故障・警告を表す信号であるイベント信号を図14Aに示す様な所定の文字列またはコードで表示したデータの中から検索して起動シーケンスと停止シーケンスの切り出しを行う(S1402)。その結果をもとに、停止シーケンスの終了時刻から、図14Bに示すような、起動シーケンスの開始時刻までの「定常OFF」モード1411、起動シーケンス中の「起動」モード1412、起動シーケンスの終了時刻から停止シーケンスの開始時刻までの「定常ON」モード1413、停止シーケンス中の「停止」モード1414の4つの稼動状態に分割する(S1363)。
On the other hand, the event signal 1301 output from the
次に、S1344で複数区間に分けた特徴ベクトルのうち、S1363で分割したモードのn番目のモードに対応する特徴ベクトルを抽出し(S1364)、異常測度算出部107でn番目のモードに対応する特徴ベクトルの異常測度算出し、除外区間設定部108で設定した除外候補区間を除く異常測度最大値を算出する(S1346)。初回は、除外候補区間はなしである。初回の場合、または、(前回までに設定されたしきい値−異常測度最大値)で算出される下がり幅がパラメータΔより大きい場合は(S1347)、しきい値算出部109において、異常測度最大値をしきい値とし、除外区間設定部108において、除外候補区間を学習除外区間にとする(S1348)。
Next, among the feature vectors divided into a plurality of sections in S1344, a feature vector corresponding to the nth mode of the mode divided in S1363 is extracted (S1364), and the abnormal
ステップS1347でNOの場合(2回目以降、または、下がり幅がパラメータΔ以下の場合)は、しきい値はそれまでの値を継承する。また、学習除外区間もそのままとする。そして、下がり幅をチェックし(S1349)、下がり幅が負、すなわち増加する場合(S1349でYESの場合)、保留回数をカウントアップする(S1350)。保留回数の初期値は図示していないがもちろん0である。一方、下がり幅が正又はゼロ、すなわち減少または変化しない場合(S1349でNOの場合)、保留回数はそのままとする。
In the case of NO in step S1347 (after the second time or when the descending width is equal to or smaller than the parameter Δ), the threshold value inherits the value up to that point. Also, the learning exclusion section is left as it is. Then, the drop width is checked (S1349). If the drop width is negative, that is, increases (YES in S1349), the number of suspensions is counted up (S1350). Although the initial value of the number of times of holding is not shown, it is of
ステップS1348またはS1349またはS1350の処理の後、除外区間設定部108において、異常測度最大値の区間を除外候補区間に追加する(S1351)。繰り返し回数及び保留回数をチェックし(S1352)、繰り返し回数がN回目または保留回数がパラメータMより大きい場合(S1352でYESの場合)、S1363で分割した全てのモードについて処理を行ったかをチェックし(S1365)、YESの場合は処理を終了し、終了時の学習除外区間としきい値を学習結果として記録しておく。ここで繰り返し回数とはステップS1346を実行した回数のことであり、保留回数とはステップS1350でカウントされる数のことである。
After the process of step S1348, S1349, or S1350, the excluded
ステップS1352においてNOの場合(繰り返し回数がN回目より少なく、かつ、保留回数がパラメータM以下の場合、ステップS1346に戻る。
また、ステップS1365においてNOの場合(全てのモードについて除外区間の設定が完了していない場合)には、nを1繰り上げて(S1366)、新たなモードのセンサ信号に対してS1364からS1351までの処理を実行する。
In the case of NO in step S1352 (if the number of repetitions is less than the Nth and the number of suspensions is equal to or less than parameter M, the process returns to step S1346.
If NO in step S1365 (if the exclusion section has not been set for all modes), n is incremented by 1 (S1366), and S1364 to S1351 for the new mode sensor signal. Execute the process.
実施例1で説明した処理と異なる部分であるイベント信号に基づくモード分割方法の実施例を図14A及びBを用いて説明する。イベント信号の例を図14Aに示す。不定期に出力される設備の操作・故障・警告を表す信号であり、時刻と操作・故障・警告を表す文字列またはコードからなる。図14Bには、停止シーケンスの終了時刻から起動シーケンスの開始時刻までの「定常OFF」モード1411、起動シーケンス中の「起動」モード1412、起動シーケンスの終了時刻から停止シーケンスの開始時刻までの「定常ON」モード1413、停止シーケンス中の「停止」モード1414の4つの稼動状態に分割した例を示す。
An embodiment of a mode division method based on an event signal, which is a part different from the processing described in the first embodiment, will be described with reference to FIGS. 14A and 14B. An example of the event signal is shown in FIG. 14A. This is an irregularly output signal indicating the operation / failure / warning of the equipment, and consists of a character string or code representing the time and operation / failure / warning. FIG. 14B shows a “steady OFF”
シーケンス切り出しのためには、予めシーケンスの開始イベントおよび終了イベントを指定しておき、イベント信号の先頭から最後まで以下の要領でスキャンしながら切り出していく。
(1)シーケンスの途中でない場合は、開始イベントを探索する。見つかったらシーケンスの開始とする。
(2)シーケンスの途中の場合は、終了イベントを探索する。見つかったらシーケンスの終了とする。ここで終了イベントとは、指定の終了イベントのほか、故障、警告、指定の開始イベントとする。
In order to cut out a sequence, a start event and an end event of the sequence are designated in advance, and the event signal is cut out while scanning from the beginning to the end in the following manner.
(1) If it is not in the middle of the sequence, search for a start event. When it is found, the sequence starts.
(2) In the middle of a sequence, search for an end event. If found, end the sequence. Here, the end event is a specified end event, a failure, a warning, or a specified start event.
以上のように、イベント信号を利用することにより、多様な稼動状態を正確に分けることができ、モード別にしきい値を設定することにより、「起動」モード1412および「停止」モード1414の過渡期において学習データ不足により感度を落とす必要がある場合でも、「定常OFF」モード1411および「定常ON」モード1413では高感度な異常検知が可能になる。
As described above, by using the event signal, it is possible to accurately divide various operating states, and by setting a threshold value for each mode, the transition period between the “start”
実施例1および2では、異常測度算出結果に基づいて学習除外区間を決定していたが、本実施例では、ユーザが指定した区間やユーザが指定した条件を満たす区間を学習除外区間として初期設定する。実施例1において図3を用いて説明した学習時のステップS305あるいは図6のステップS605の前に、学習除外区間を設定するステップを挿入する。 In the first and second embodiments, the learning exclusion section is determined based on the abnormal measure calculation result. However, in this embodiment, the section specified by the user or the section satisfying the condition specified by the user is initially set as the learning exclusion section. To do. A step of setting a learning exclusion section is inserted before step S305 at the time of learning described with reference to FIG. 3 in the first embodiment or step S605 of FIG.
ユーザによる区間指定の方法は、専用のGUIを用いても良いし、ファイル入力でもよい。例えば1行に1個年月日を表す「20090726」のような数値を書いておく。これは2009年7月26日のことである。もちろん区間番号で指定するようにしてもよい。 As a method for designating a section by the user, a dedicated GUI may be used, or file input may be used. For example, a numerical value such as “20090726” representing one date is written in one line. This is July 26, 2009. Of course, it may be specified by a section number.
ユーザによる条件指定の方法の例を以下に示す。
第一の例は、イベント信号を利用した学習除外区間設定処理である。基本的には、イベント信号に基づき異常状態を含む区間かどうかを判断する。異常状態と判断する条件は例えば以下のとおりである。(1)故障あるいは警告のイベントが発生、(2)異常な起動シーケンスを含む、(3)起動シーケンスの回数が所定範囲外、(4)終了シーケンスからの経過時間が所定範囲外である起動シーケンスを含む、(5)頻度の低いイベントが発生などである。(1)(3)(5)の条件指定は、イベント番号と許容回数によって行える。(1)の場合は故障・警告に対応するイベントを指定し、(5)の場合は、予めイベントの頻度を調べておき、頻度の低いイベントを指定する。1回以上指定イベントが含まれる区間は異常であるとする。(3)の場合は、起動シーケンスの開始イベントを指定し、1区間で許容される回数を指定する。(2)の条件指定は、3つのイベント番号の指定によって行う。起動シーケンスの開始イベント、起動シーケンスの終了イベントと異常終了イベントの組合せである。異常終了イベントには、起動開始イベントと停止開始イベントがある。起動シーケンスの開始イベント、起動シーケンスの終了イベントの間に異常終了イベントがある場合は、異常終了イベントを含む区間を異常とする。(4)の条件指定は2つのイベント番号指定とイベント間の時間間隔の許容範囲によって行う。停止シーケンスの開始イベントと起動シーケンスの開始イベントを指定し、それらのイベント間の時間間隔が許容範囲外であれば、起動シーケンスの開始イベントが含まれる区間を異常とする。
An example of how to specify conditions by the user is shown below.
The first example is a learning exclusion section setting process using an event signal. Basically, based on the event signal, it is determined whether or not the section includes an abnormal state. Conditions for determining an abnormal state are, for example, as follows. (1) A failure or warning event occurs, (2) An abnormal start sequence is included, (3) The number of start sequences is outside the specified range, and (4) The start sequence is out of the specified range after the end sequence (5) Infrequent events occur. (1) (3) (5) can be specified by event number and allowable number of times. In the case of (1), an event corresponding to a failure / warning is specified. In the case of (5), the event frequency is checked in advance, and an event with a low frequency is specified. Assume that a section including a specified event one or more times is abnormal. In the case of (3), specify the start event of the start sequence and specify the number of times allowed in one section. The condition specification in (2) is performed by specifying three event numbers. A start sequence start event, a start sequence end event, and an abnormal end event combination. The abnormal end event includes a start start event and a stop start event. If there is an abnormal end event between the start event of the start sequence and the end event of the start sequence, the section including the abnormal end event is abnormal. The condition specification in (4) is performed according to the specification of two event numbers and the allowable range of the time interval between events. If the start event of the stop sequence and the start event of the start sequence are specified and the time interval between these events is outside the allowable range, the section including the start event of the start sequence is regarded as abnormal.
第二の例は、センサ信号を利用した学習除外区間設定処理である。予め指定したセンサ信号に対する条件を満たす時間を含む区間を除外区間とする。図15は、条件を記述したファイルの例である。条件の記述はセンサ名1501、符号1502、しきい値1503からなる。符号は「=」、「<」、「<=」、「>=」「>」、「<>」からなる。それぞれ等しい、未満、以下、以上、より大きい、異なる、を意味する。図の例では、「Sensor.A」が−100未満または「Sensor.D」が500以上の場合に異常状態であると判断し、異常状態を含む区間を除外する。
The second example is a learning exclusion section setting process using a sensor signal. A section including a time that satisfies a condition for a sensor signal designated in advance is set as an excluded section. FIG. 15 is an example of a file describing conditions. The description of the condition consists of a
100…異常検知システム 101…設備 102…センサ信号 103…センサ信号蓄積部 104…特徴ベクトル抽出部 105…学習データ選別部 106…正常モデル作成部 107…異常測度算出部 108…除外区間設定部 109…しきい値算出部 110…異常検出部 120…センサ信号解析部120 130…入出力部130。
DESCRIPTION OF
Claims (9)
前記多次元時系列センサ信号のうち、予め指定された学習期間のセンサ信号から特徴ベクトルを抽出する第1工程と、
前記学習期間の特徴ベクトルから除外候補区間の特徴ベクトルを除外した学習データを抽出する第2工程と、
前記学習データの異常測度を算出する第3工程と、
前記学習期間のうち前記除外候補区間を除く期間における異常測度の最大値を抽出し、当該異常測度の最大値が、所定の更新条件を満たす場合には、異常判定しきい値を当該異常測度の最大値に更新し、前記除外候補区間を除外する第4工程と、
前記異常測度の最大値の区間を前記除外候補区間に追加する第5工程と、
所定の停止条件を満たすか否か判定を行う第6工程と、を含み、
前記第6工程における前記判定の結果に基づいて、
前記所定の停止条件を満たさない場合、前記第2工程、前記第3工程、前記第4工程、前記第5工程、前記第6工程の処理を行い、
前記学習期間の特徴ベクトルから、前記第6工程における前記所定の停止条件を満たしたときの学習除外区間の特徴ベクトルを除外した学習データを抽出し、
前記多次元時系列センサ信号のうち、予め指定された期間または新たに取得された期間のセンサ信号から特徴ベクトルを抽出して観測ベクトルとし、
前記観測ベクトルと前記学習データとを用いて、前記観測ベクトルの異常測度を算出し、当該算出した観測ベクトルの異常測度と前記所定の停止条件を満たしたときの異常判定しきい値とを比較して、前記設備または前記装置の異常を検知することを特徴とする異常検知方法。 A method of detecting an abnormality of the facility or apparatus using a multidimensional time series sensor signal output from a sensor attached to the facility or apparatus during operation of the facility or apparatus,
A first step of extracting a feature vector from sensor signals in a learning period designated in advance among the multi-dimensional time-series sensor signals;
A second step of extracting learning data excluding the feature vector of the exclusion candidate section from the feature vector of the learning period;
A third step of calculating an abnormal measure of the learning data ;
In the learning period, the maximum value of the abnormality measure in the period excluding the exclusion candidate section is extracted, and when the maximum value of the abnormality measure satisfies a predetermined update condition, the abnormality determination threshold is set to the abnormality measure. A fourth step of updating to the maximum value and excluding the exclusion candidate section;
A fifth step of adding a section of the maximum value of the abnormal measure to the exclusion candidate section;
A sixth step of determining whether or not a predetermined stop condition is satisfied,
Based on the result of the determination in the sixth step,
If the predetermined stop condition is not satisfied, the second step, the third step, the fourth step, the fifth step, and the sixth step are performed,
Extracting learning data excluding the feature vector of the learning exclusion section when the predetermined stop condition in the sixth step is satisfied from the feature vector of the learning period,
Of the multi-dimensional time series sensor signal , extract a feature vector from a sensor signal in a predetermined period or a newly acquired period as an observation vector,
Using the observation vector and the learning data, an abnormality measure of the observation vector is calculated, and the abnormality measure of the calculated observation vector is compared with an abnormality determination threshold value when the predetermined stop condition is satisfied. An abnormality detection method comprising detecting an abnormality in the facility or the apparatus.
該設備または装置の異常を検知する方法は学習する工程と異常を検知する工程とを含み、
前記学習する工程において、
異常測度最大値に基づいて、学習除外区間を設定し、
前記多次元時系列センサ信号のうち予め指定された期間のセンサ信号から前記学習除外区間のセンサ信号を除外して学習データを作成し、
該作成した学習データから異常判定しきい値を算出し、
前記異常を検知する工程において、
前記学習データを用いて正常モデルを作成し、
前記多次元時系列センサ信号から特徴ベクトルを観測ベクトルとして抽出し、
該抽出した観測ベクトルと前記作成した正常モデルとを用いて前記観測ベクトルの異常測度を算出し、
該算出した観測ベクトルの異常測度と前記異常判定しきい値とを比較して前記設備または装置の異常を検知することを特徴とする異常検知方法。 A method of detecting an abnormality of the facility or apparatus using a multidimensional time series sensor signal output from a sensor attached to the facility or apparatus during operation of the facility or apparatus,
A method for detecting an abnormality of the facility or apparatus includes a learning step and a step of detecting the abnormality,
In the learning step,
Based on the abnormal measure maximum value, set the learning exclusion interval,
The learning data is created by excluding the sensor signal of the learning exclusion section from the sensor signal of a predetermined period among the multi-dimensional time series sensor signal,
An abnormality determination threshold value is calculated from the created learning data,
In the step of detecting the abnormality,
Create a normal model using the learning data,
Extracting a feature vector as an observation vector from the multi-dimensional time series sensor signal;
An abnormal measure of the observation vector is calculated using the extracted observation vector and the created normal model,
An abnormality detection method comprising: detecting an abnormality of the facility or apparatus by comparing the abnormality measure of the calculated observation vector with the abnormality determination threshold value.
該決定した除外する区間を除いた前記センサ信号の特徴ベクトルを用いて前記学習データを作成することを特徴とする異常検知方法。 5. The abnormality detection method according to claim 4, wherein in the learning step, the learning data is created by extracting a feature vector from the sensor signal of the predetermined period of the multidimensional time series sensor signal. Calculating an abnormal measure of the extracted feature vector, and determining an interval to be excluded from the sensor signals of the predetermined period using the calculated abnormal measure information,
An abnormality detection method, wherein the learning data is created using a feature vector of the sensor signal excluding the determined excluded section.
前記多次元時系列センサ信号を蓄積するセンサ信号蓄積部と、
前記多次元時系列センサ信号をもとに特徴ベクトルを抽出する特徴ベクトル抽出部と、
該特徴ベクトル抽出部で抽出された予め指定された学習期間の特徴ベクトルから学習除外区間の特徴ベクトルを除外して学習データを作成するする学習データ作成部と、
該学習データ作成部で作成された学習データを用いて各時刻の特徴ベクトルに対応する正常モデルを作成する正常モデル作成部と、
前記特徴ベクトル抽出部で抽出された各時刻の特徴ベクトルと前記正常モデル作成部で作成された正常モデルとを用いて異常測度を算出する異常測度算出部と、
異常測度最大値に基づいて、前記学習除外区間の設定をする除外区間設定部と、
前記学習データ作成部で作成された学習データについて前記異常測度算出部で算出した異常測度に基づいてしきい値を算出するしきい値算出部と、
前記異常測度算出部で算出された各特徴ベクトルの異常測度と前記しきい値算出部で算出されたしきい値とを比較することにより前記設備または装置の異常を検知する異常検知部とを備えたことを特徴とする異常検知装置。 An apparatus for detecting an abnormality of the facility or apparatus using a multidimensional time series sensor signal output from a sensor attached to the facility or apparatus during operation of the facility or apparatus,
A sensor signal storage unit for storing the multi-dimensional time series sensor signal;
A feature vector extraction unit that extracts a feature vector based on the multidimensional time-series sensor signal;
A learning data creating unit that creates learning data by excluding the feature vectors of the learning exclusion period from the feature vectors of the learning period specified in advance extracted by the feature vector extracting unit;
A normal model creation unit that creates a normal model corresponding to a feature vector at each time using the learning data created by the learning data creation unit;
An anomaly measure calculating unit that calculates an anomaly measure using the feature vector at each time extracted by the feature vector extracting unit and the normal model created by the normal model creating unit;
An exclusion interval setting unit configured to set the learning exclusion interval based on the abnormal measure maximum value ;
A threshold value calculation unit for calculating a threshold value based on the abnormality measure calculated by the abnormality measure calculation unit for the learning data created by the learning data creation unit;
An anomaly detector that detects an anomaly of the facility or apparatus by comparing an anomaly measure of each feature vector calculated by the anomaly measure calculator with a threshold calculated by the threshold value calculator; An abnormality detection device characterized by that.
Priority Applications (3)
| Application Number | Priority Date | Filing Date | Title |
|---|---|---|---|
| JP2013258215A JP6216242B2 (en) | 2013-12-13 | 2013-12-13 | Anomaly detection method and apparatus |
| EP14197018.6A EP2884363B1 (en) | 2013-12-13 | 2014-12-09 | Anomaly detecting method, and apparatus for the same |
| US14/568,268 US9940184B2 (en) | 2013-12-13 | 2014-12-12 | Anomaly detecting method, and apparatus for the same |
Applications Claiming Priority (1)
| Application Number | Priority Date | Filing Date | Title |
|---|---|---|---|
| JP2013258215A JP6216242B2 (en) | 2013-12-13 | 2013-12-13 | Anomaly detection method and apparatus |
Publications (3)
| Publication Number | Publication Date |
|---|---|
| JP2015114967A JP2015114967A (en) | 2015-06-22 |
| JP2015114967A5 JP2015114967A5 (en) | 2016-11-04 |
| JP6216242B2 true JP6216242B2 (en) | 2017-10-18 |
Family
ID=52144399
Family Applications (1)
| Application Number | Title | Priority Date | Filing Date |
|---|---|---|---|
| JP2013258215A Active JP6216242B2 (en) | 2013-12-13 | 2013-12-13 | Anomaly detection method and apparatus |
Country Status (3)
| Country | Link |
|---|---|
| US (1) | US9940184B2 (en) |
| EP (1) | EP2884363B1 (en) |
| JP (1) | JP6216242B2 (en) |
Families Citing this family (42)
| Publication number | Priority date | Publication date | Assignee | Title |
|---|---|---|---|---|
| US10572368B2 (en) * | 2014-11-24 | 2020-02-25 | Micro Focus Llc | Application management based on data correlations |
| FR3032273B1 (en) * | 2015-01-30 | 2019-06-21 | Safran Aircraft Engines | METHOD, SYSTEM AND COMPUTER PROGRAM FOR LEARNING PHASE OF ACOUSTIC OR VIBRATORY ANALYSIS OF A MACHINE |
| US9824243B2 (en) * | 2015-09-11 | 2017-11-21 | Nxp Usa, Inc. | Model-based runtime detection of insecure behavior for system on chip with security requirements |
| WO2017135947A1 (en) * | 2016-02-04 | 2017-08-10 | Hewlett Packard Enterprise Development Lp | Real-time alerts and transmission of selected signal samples under a dynamic capacity limitation |
| JP6451662B2 (en) * | 2016-02-23 | 2019-01-16 | 株式会社安川電機 | Abnormality determination device, abnormality determination program, abnormality determination system, and motor control device |
| US10333958B2 (en) * | 2016-07-19 | 2019-06-25 | Cisco Technology, Inc. | Multi-dimensional system anomaly detection |
| JP6675297B2 (en) * | 2016-12-09 | 2020-04-01 | Dmg森精機株式会社 | Information processing method, information processing system, and information processing apparatus |
| US10677943B2 (en) * | 2016-12-16 | 2020-06-09 | Smiths Detection, Llc | System and method for monitoring a computed tomography imaging system |
| JP6545728B2 (en) * | 2017-01-11 | 2019-07-17 | 株式会社東芝 | ABNORMALITY DETECTING APPARATUS, ABNORMALITY DETECTING METHOD, AND ABNORMALITY DETECTING PROGRAM |
| CN110226140B (en) * | 2017-01-25 | 2023-04-11 | Ntn株式会社 | State monitoring method and state monitoring device |
| CN110268350B (en) * | 2017-03-03 | 2022-12-20 | 松下知识产权经营株式会社 | Additional learning method for deterioration diagnosis system |
| JP6778132B2 (en) * | 2017-03-13 | 2020-10-28 | 株式会社日立製作所 | Abnormality diagnosis system for equipment |
| JP6831729B2 (en) * | 2017-03-23 | 2021-02-17 | 株式会社日立パワーソリューションズ | Anomaly detection device |
| US10719772B2 (en) * | 2017-10-27 | 2020-07-21 | The Boeing Company | Unsupervised multivariate relational fault detection system for a vehicle and method therefor |
| JP7106847B2 (en) * | 2017-11-28 | 2022-07-27 | 横河電機株式会社 | Diagnostic device, diagnostic method, program, and recording medium |
| US11509540B2 (en) * | 2017-12-14 | 2022-11-22 | Extreme Networks, Inc. | Systems and methods for zero-footprint large-scale user-entity behavior modeling |
| JP7043831B2 (en) * | 2017-12-26 | 2022-03-30 | 宇部興産株式会社 | Plant management system, plant management server, plant management device, estimation model generation method, and learning data generation method |
| JP7339382B2 (en) * | 2017-12-26 | 2023-09-05 | Ube三菱セメント株式会社 | Plant management system, plant management server, plant management device, estimation model generation method, and learning data generation method |
| US10664966B2 (en) * | 2018-01-25 | 2020-05-26 | International Business Machines Corporation | Anomaly detection using image-based physical characterization |
| JP7108417B2 (en) * | 2018-01-29 | 2022-07-28 | 株式会社日立製作所 | Anomaly detection system |
| US11036715B2 (en) * | 2018-01-29 | 2021-06-15 | Microsoft Technology Licensing, Llc | Combination of techniques to detect anomalies in multi-dimensional time series |
| JP2019179395A (en) * | 2018-03-30 | 2019-10-17 | オムロン株式会社 | Abnormality detection system, support device and abnormality detection method |
| EP3553615A1 (en) | 2018-04-10 | 2019-10-16 | Siemens Aktiengesellschaft | Method and system for managing a technical installation |
| JP7217593B2 (en) * | 2018-05-24 | 2023-02-03 | 株式会社日立ハイテクソリューションズ | Predictive diagnosis system |
| JP7378089B2 (en) * | 2018-06-13 | 2023-11-13 | パナソニックIpマネジメント株式会社 | Unauthorized communication detection device, unauthorized communication detection method, and manufacturing system |
| CN112272763B (en) | 2018-06-14 | 2023-05-19 | 三菱电机株式会社 | Abnormality detection device, abnormality detection method, and computer-readable storage medium |
| US10579932B1 (en) * | 2018-07-10 | 2020-03-03 | Uptake Technologies, Inc. | Computer system and method for creating and deploying an anomaly detection model based on streaming data |
| CN112567306A (en) * | 2018-08-31 | 2021-03-26 | 东芝三菱电机产业系统株式会社 | Manufacturing process monitoring device |
| JP7272020B2 (en) * | 2019-03-13 | 2023-05-12 | オムロン株式会社 | display system |
| JP7230600B2 (en) * | 2019-03-13 | 2023-03-01 | オムロン株式会社 | display system |
| DE102019112099B3 (en) * | 2019-05-09 | 2020-06-18 | Dürr Systems Ag | Monitoring method for an application system and corresponding application system |
| JP7344015B2 (en) * | 2019-06-13 | 2023-09-13 | 株式会社日立ハイテクソリューションズ | Anomaly detection device and anomaly detection method |
| US11184222B2 (en) * | 2019-09-27 | 2021-11-23 | Ciena Corporation | Learning alarm and PM threshold values in network elements based on actual operating conditions |
| WO2021149226A1 (en) * | 2020-01-23 | 2021-07-29 | 三菱電機株式会社 | Anomaly detection device, anomaly detection method, and anomaly detection program |
| EP4099112A4 (en) * | 2020-01-31 | 2023-07-19 | Panasonic Intellectual Property Corporation of America | Anomaly detection method and anomaly detection device |
| DE102020205895A1 (en) | 2020-05-11 | 2021-11-11 | Iba Ag | Method and device for the automatic monitoring of a cyclical process |
| KR102298708B1 (en) * | 2020-06-15 | 2021-09-07 | 한국생산기술연구원 | Method of inspecting defects present in the inspection object and apparatuses performing the same |
| DE102020208642A1 (en) | 2020-07-09 | 2022-01-13 | Robert Bosch Gesellschaft mit beschränkter Haftung | Method and device for anomaly detection in technical systems |
| JP7318612B2 (en) * | 2020-08-27 | 2023-08-01 | 横河電機株式会社 | MONITORING DEVICE, MONITORING METHOD, AND MONITORING PROGRAM |
| CN113595784A (en) * | 2021-07-26 | 2021-11-02 | 招商银行股份有限公司 | Network flow detection method, device, equipment, storage medium and program product |
| JP7304401B1 (en) | 2021-12-20 | 2023-07-06 | エヌ・ティ・ティ・コミュニケーションズ株式会社 | Support device, support method and support program |
| CN117370916B (en) * | 2023-11-30 | 2024-02-23 | 南方电网科学研究院有限责任公司 | Transformer winding vibration abnormality diagnosis method and device, electronic equipment and medium |
Family Cites Families (4)
| Publication number | Priority date | Publication date | Assignee | Title |
|---|---|---|---|---|
| JP5431235B2 (en) * | 2009-08-28 | 2014-03-05 | 株式会社日立製作所 | Equipment condition monitoring method and apparatus |
| JP5363927B2 (en) * | 2009-09-07 | 2013-12-11 | 株式会社日立製作所 | Abnormality detection / diagnosis method, abnormality detection / diagnosis system, and abnormality detection / diagnosis program |
| JP5364530B2 (en) * | 2009-10-09 | 2013-12-11 | 株式会社日立製作所 | Equipment state monitoring method, monitoring system, and monitoring program |
| JP5342708B1 (en) * | 2013-06-19 | 2013-11-13 | 株式会社日立パワーソリューションズ | Anomaly detection method and apparatus |
-
2013
- 2013-12-13 JP JP2013258215A patent/JP6216242B2/en active Active
-
2014
- 2014-12-09 EP EP14197018.6A patent/EP2884363B1/en active Active
- 2014-12-12 US US14/568,268 patent/US9940184B2/en active Active
Also Published As
| Publication number | Publication date |
|---|---|
| EP2884363A2 (en) | 2015-06-17 |
| US9940184B2 (en) | 2018-04-10 |
| JP2015114967A (en) | 2015-06-22 |
| EP2884363A3 (en) | 2015-07-22 |
| EP2884363B1 (en) | 2019-10-02 |
| US20150169393A1 (en) | 2015-06-18 |
Similar Documents
| Publication | Publication Date | Title |
|---|---|---|
| JP6216242B2 (en) | Anomaly detection method and apparatus | |
| JP6076751B2 (en) | Abnormality diagnosis method and apparatus | |
| EP2905665B1 (en) | Information processing apparatus, diagnosis method, and program | |
| JP5945350B2 (en) | Equipment condition monitoring method and apparatus | |
| JP5301717B1 (en) | Equipment condition monitoring method and apparatus | |
| JP5431235B2 (en) | Equipment condition monitoring method and apparatus | |
| JP6740247B2 (en) | Anomaly detection system, anomaly detection method, anomaly detection program and learned model generation method | |
| JP5342708B1 (en) | Anomaly detection method and apparatus | |
| JP5538597B2 (en) | Anomaly detection method and anomaly detection system | |
| JP5331774B2 (en) | Equipment state monitoring method and apparatus, and equipment state monitoring program | |
| JP5364530B2 (en) | Equipment state monitoring method, monitoring system, and monitoring program | |
| WO2013011745A1 (en) | Facility state monitoring method and device therefor | |
| JP5530045B1 (en) | Health management system and health management method | |
| JP6223936B2 (en) | Abnormal trend detection method and system | |
| JP2013143009A (en) | Equipment state monitoring method and device using the same | |
| WO2010095314A1 (en) | Abnormality detecting method and abnormality detecting system | |
| JP2015088079A (en) | Abnormality diagnosis system and method | |
| JP2023106472A (en) | Abnormality detection device and abnormality detection method |
Legal Events
| Date | Code | Title | Description |
|---|---|---|---|
| A521 | Request for written amendment filed |
Free format text: JAPANESE INTERMEDIATE CODE: A523 Effective date: 20160915 |
|
| A621 | Written request for application examination |
Free format text: JAPANESE INTERMEDIATE CODE: A621 Effective date: 20160915 |
|
| A977 | Report on retrieval |
Free format text: JAPANESE INTERMEDIATE CODE: A971007 Effective date: 20170608 |
|
| A131 | Notification of reasons for refusal |
Free format text: JAPANESE INTERMEDIATE CODE: A131 Effective date: 20170613 |
|
| A521 | Request for written amendment filed |
Free format text: JAPANESE INTERMEDIATE CODE: A523 Effective date: 20170809 |
|
| TRDD | Decision of grant or rejection written | ||
| A01 | Written decision to grant a patent or to grant a registration (utility model) |
Free format text: JAPANESE INTERMEDIATE CODE: A01 Effective date: 20170905 |
|
| A61 | First payment of annual fees (during grant procedure) |
Free format text: JAPANESE INTERMEDIATE CODE: A61 Effective date: 20170922 |
|
| R150 | Certificate of patent or registration of utility model |
Ref document number: 6216242 Country of ref document: JP Free format text: JAPANESE INTERMEDIATE CODE: R150 |
|
| S531 | Written request for registration of change of domicile |
Free format text: JAPANESE INTERMEDIATE CODE: R313531 |
|
| S533 | Written request for registration of change of name |
Free format text: JAPANESE INTERMEDIATE CODE: R313533 |
|
| R350 | Written notification of registration of transfer |
Free format text: JAPANESE INTERMEDIATE CODE: R350 |