US10719772B2 - Unsupervised multivariate relational fault detection system for a vehicle and method therefor - Google Patents
Unsupervised multivariate relational fault detection system for a vehicle and method therefor Download PDFInfo
- Publication number
- US10719772B2 US10719772B2 US15/795,823 US201715795823A US10719772B2 US 10719772 B2 US10719772 B2 US 10719772B2 US 201715795823 A US201715795823 A US 201715795823A US 10719772 B2 US10719772 B2 US 10719772B2
- Authority
- US
- United States
- Prior art keywords
- component
- vehicle
- data
- time series
- control module
- Prior art date
- Legal status (The legal status is an assumption and is not a legal conclusion. Google has not performed a legal analysis and makes no representation as to the accuracy of the status listed.)
- Active, expires
Links
- 238000001514 detection method Methods 0.000 title claims abstract description 85
- 238000000034 method Methods 0.000 title claims description 44
- 230000008859 change Effects 0.000 claims description 115
- 230000000694 effects Effects 0.000 claims description 20
- 230000002547 anomalous effect Effects 0.000 claims description 18
- 230000007423 decrease Effects 0.000 claims description 8
- 238000012935 Averaging Methods 0.000 claims description 2
- 230000006399 behavior Effects 0.000 description 23
- 238000012423 maintenance Methods 0.000 description 22
- 230000006870 function Effects 0.000 description 11
- 238000004519 manufacturing process Methods 0.000 description 8
- 238000004458 analytical method Methods 0.000 description 7
- 230000008878 coupling Effects 0.000 description 7
- 238000010168 coupling process Methods 0.000 description 7
- 238000005859 coupling reaction Methods 0.000 description 7
- 230000001419 dependent effect Effects 0.000 description 7
- 230000007613 environmental effect Effects 0.000 description 5
- 230000004048 modification Effects 0.000 description 5
- 238000012986 modification Methods 0.000 description 5
- 230000009471 action Effects 0.000 description 4
- 238000010586 diagram Methods 0.000 description 4
- 230000001747 exhibiting effect Effects 0.000 description 4
- 238000010801 machine learning Methods 0.000 description 3
- 230000008569 process Effects 0.000 description 2
- 230000004044 response Effects 0.000 description 2
- 238000012549 training Methods 0.000 description 2
- BCCGKQFZUUQSEX-WBPXWQEISA-N (2r,3r)-2,3-dihydroxybutanedioic acid;3,4-dimethyl-2-phenylmorpholine Chemical compound OC(=O)[C@H](O)[C@@H](O)C(O)=O.OC(=O)[C@H](O)[C@@H](O)C(O)=O.O1CCN(C)C(C)C1C1=CC=CC=C1 BCCGKQFZUUQSEX-WBPXWQEISA-N 0.000 description 1
- 238000004378 air conditioning Methods 0.000 description 1
- 230000004075 alteration Effects 0.000 description 1
- 230000008901 benefit Effects 0.000 description 1
- 238000004422 calculation algorithm Methods 0.000 description 1
- 238000004364 calculation method Methods 0.000 description 1
- 238000004590 computer program Methods 0.000 description 1
- 238000001816 cooling Methods 0.000 description 1
- 238000013500 data storage Methods 0.000 description 1
- 238000013461 design Methods 0.000 description 1
- 238000011161 development Methods 0.000 description 1
- 230000018109 developmental process Effects 0.000 description 1
- 239000012530 fluid Substances 0.000 description 1
- 230000010354 integration Effects 0.000 description 1
- 239000000463 material Substances 0.000 description 1
- 238000003032 molecular docking Methods 0.000 description 1
- 230000003287 optical effect Effects 0.000 description 1
- 230000008520 organization Effects 0.000 description 1
- 238000012545 processing Methods 0.000 description 1
- 238000009419 refurbishment Methods 0.000 description 1
- 230000008439 repair process Effects 0.000 description 1
- 239000007787 solid Substances 0.000 description 1
- 238000007619 statistical method Methods 0.000 description 1
- 230000001960 triggered effect Effects 0.000 description 1
Images


Classifications
-
- G—PHYSICS
- G06—COMPUTING; CALCULATING OR COUNTING
- G06N—COMPUTING ARRANGEMENTS BASED ON SPECIFIC COMPUTATIONAL MODELS
- G06N5/00—Computing arrangements using knowledge-based models
- G06N5/04—Inference or reasoning models
-
- B—PERFORMING OPERATIONS; TRANSPORTING
- B64—AIRCRAFT; AVIATION; COSMONAUTICS
- B64D—EQUIPMENT FOR FITTING IN OR TO AIRCRAFT; FLIGHT SUITS; PARACHUTES; ARRANGEMENTS OR MOUNTING OF POWER PLANTS OR PROPULSION TRANSMISSIONS IN AIRCRAFT
- B64D45/00—Aircraft indicators or protectors not otherwise provided for
-
- B—PERFORMING OPERATIONS; TRANSPORTING
- B64—AIRCRAFT; AVIATION; COSMONAUTICS
- B64F—GROUND OR AIRCRAFT-CARRIER-DECK INSTALLATIONS SPECIALLY ADAPTED FOR USE IN CONNECTION WITH AIRCRAFT; DESIGNING, MANUFACTURING, ASSEMBLING, CLEANING, MAINTAINING OR REPAIRING AIRCRAFT, NOT OTHERWISE PROVIDED FOR; HANDLING, TRANSPORTING, TESTING OR INSPECTING AIRCRAFT COMPONENTS, NOT OTHERWISE PROVIDED FOR
- B64F5/00—Designing, manufacturing, assembling, cleaning, maintaining or repairing aircraft, not otherwise provided for; Handling, transporting, testing or inspecting aircraft components, not otherwise provided for
- B64F5/10—Manufacturing or assembling aircraft, e.g. jigs therefor
-
- B—PERFORMING OPERATIONS; TRANSPORTING
- B64—AIRCRAFT; AVIATION; COSMONAUTICS
- B64F—GROUND OR AIRCRAFT-CARRIER-DECK INSTALLATIONS SPECIALLY ADAPTED FOR USE IN CONNECTION WITH AIRCRAFT; DESIGNING, MANUFACTURING, ASSEMBLING, CLEANING, MAINTAINING OR REPAIRING AIRCRAFT, NOT OTHERWISE PROVIDED FOR; HANDLING, TRANSPORTING, TESTING OR INSPECTING AIRCRAFT COMPONENTS, NOT OTHERWISE PROVIDED FOR
- B64F5/00—Designing, manufacturing, assembling, cleaning, maintaining or repairing aircraft, not otherwise provided for; Handling, transporting, testing or inspecting aircraft components, not otherwise provided for
- B64F5/40—Maintaining or repairing aircraft
-
- G—PHYSICS
- G05—CONTROLLING; REGULATING
- G05B—CONTROL OR REGULATING SYSTEMS IN GENERAL; FUNCTIONAL ELEMENTS OF SUCH SYSTEMS; MONITORING OR TESTING ARRANGEMENTS FOR SUCH SYSTEMS OR ELEMENTS
- G05B23/00—Testing or monitoring of control systems or parts thereof
- G05B23/02—Electric testing or monitoring
- G05B23/0205—Electric testing or monitoring by means of a monitoring system capable of detecting and responding to faults
- G05B23/0218—Electric testing or monitoring by means of a monitoring system capable of detecting and responding to faults characterised by the fault detection method dealing with either existing or incipient faults
- G05B23/0224—Process history based detection method, e.g. whereby history implies the availability of large amounts of data
- G05B23/0227—Qualitative history assessment, whereby the type of data acted upon, e.g. waveforms, images or patterns, is not relevant, e.g. rule based assessment; if-then decisions
- G05B23/0232—Qualitative history assessment, whereby the type of data acted upon, e.g. waveforms, images or patterns, is not relevant, e.g. rule based assessment; if-then decisions based on qualitative trend analysis, e.g. system evolution
-
- G—PHYSICS
- G05—CONTROLLING; REGULATING
- G05B—CONTROL OR REGULATING SYSTEMS IN GENERAL; FUNCTIONAL ELEMENTS OF SUCH SYSTEMS; MONITORING OR TESTING ARRANGEMENTS FOR SUCH SYSTEMS OR ELEMENTS
- G05B23/00—Testing or monitoring of control systems or parts thereof
- G05B23/02—Electric testing or monitoring
- G05B23/0205—Electric testing or monitoring by means of a monitoring system capable of detecting and responding to faults
- G05B23/0259—Electric testing or monitoring by means of a monitoring system capable of detecting and responding to faults characterized by the response to fault detection
- G05B23/0283—Predictive maintenance, e.g. involving the monitoring of a system and, based on the monitoring results, taking decisions on the maintenance schedule of the monitored system; Estimating remaining useful life [RUL]
-
- G—PHYSICS
- G07—CHECKING-DEVICES
- G07C—TIME OR ATTENDANCE REGISTERS; REGISTERING OR INDICATING THE WORKING OF MACHINES; GENERATING RANDOM NUMBERS; VOTING OR LOTTERY APPARATUS; ARRANGEMENTS, SYSTEMS OR APPARATUS FOR CHECKING NOT PROVIDED FOR ELSEWHERE
- G07C5/00—Registering or indicating the working of vehicles
- G07C5/08—Registering or indicating performance data other than driving, working, idle, or waiting time, with or without registering driving, working, idle or waiting time
- G07C5/0808—Diagnosing performance data
-
- G—PHYSICS
- G07—CHECKING-DEVICES
- G07C—TIME OR ATTENDANCE REGISTERS; REGISTERING OR INDICATING THE WORKING OF MACHINES; GENERATING RANDOM NUMBERS; VOTING OR LOTTERY APPARATUS; ARRANGEMENTS, SYSTEMS OR APPARATUS FOR CHECKING NOT PROVIDED FOR ELSEWHERE
- G07C5/00—Registering or indicating the working of vehicles
- G07C5/08—Registering or indicating performance data other than driving, working, idle, or waiting time, with or without registering driving, working, idle or waiting time
- G07C5/0816—Indicating performance data, e.g. occurrence of a malfunction
- G07C5/0825—Indicating performance data, e.g. occurrence of a malfunction using optical means
-
- G—PHYSICS
- G07—CHECKING-DEVICES
- G07C—TIME OR ATTENDANCE REGISTERS; REGISTERING OR INDICATING THE WORKING OF MACHINES; GENERATING RANDOM NUMBERS; VOTING OR LOTTERY APPARATUS; ARRANGEMENTS, SYSTEMS OR APPARATUS FOR CHECKING NOT PROVIDED FOR ELSEWHERE
- G07C5/00—Registering or indicating the working of vehicles
- G07C5/08—Registering or indicating performance data other than driving, working, idle, or waiting time, with or without registering driving, working, idle or waiting time
- G07C5/0841—Registering performance data
- G07C5/085—Registering performance data using electronic data carriers
-
- B—PERFORMING OPERATIONS; TRANSPORTING
- B64—AIRCRAFT; AVIATION; COSMONAUTICS
- B64D—EQUIPMENT FOR FITTING IN OR TO AIRCRAFT; FLIGHT SUITS; PARACHUTES; ARRANGEMENTS OR MOUNTING OF POWER PLANTS OR PROPULSION TRANSMISSIONS IN AIRCRAFT
- B64D45/00—Aircraft indicators or protectors not otherwise provided for
- B64D2045/0085—Devices for aircraft health monitoring, e.g. monitoring flutter or vibration
Definitions
- the exemplary embodiments generally relate to fault detection and in particular to fault detection using an unsupervised fault detection system that incorporates domain knowledge of one or more vehicle systems by identifying relationships among component parameters.
- fault detection in vehicles is performed using some form of statistical analysis.
- digital sensor data is obtained in a time series of sensor data and is converted into a mathematical form for statistical (or other) processing using, for example, machine learning based solutions.
- machine learning based solutions extract statistical measures, known as features, from a dataset, such as the time series of sensor data. Examples of the features include a minimum, a maximum, or an average parameter value over the course of an entire vehicle excursion (which in the case of an aircraft is an entire flight). Values for the features are compared across a series of vehicle excursions in an attempt to identify a trend in the time series of sensor data that precedes a vehicle component fault.
- a vehicle fault detection system comprising: a first sensor coupled to a vehicle system and configured to detect a first time series of data of a first component parameter; a second sensor coupled to the vehicle system and configured to detect a second time series of data of a second component parameter; a vehicle control module coupled to the first sensor and the second sensor, the vehicle control module being configured to determine an existence of a relationship between the first component parameter and the second component parameter, and identify anomalies in the one or more of the first time series of data and the second time series of data based on the relationship between the first component parameter and the second component parameter; and a user interface coupled to the vehicle control module, the user interface being configured to present to an operator an indication of the anomalies in the one or more of the first time series of data and the second time series of data.
- a vehicle fault detection system comprising: a plurality of sensors coupled to a vehicle system and configured to detect respective time series of data, each time series of data corresponding to a component parameter of a plurality of component parameters; a vehicle control module coupled to the plurality of sensors, the vehicle control module being configured to determine an existence of one or more relationships between the plurality of component parameters, and identify anomalies in the respective time series of data based on the one or more relationships between the plurality of component parameters; and a user interface coupled to the vehicle control module, the user interface being configured to present to an operator an indication of the anomalies in the respective time series of data.
- Still another example of the subject matter according to the present disclosure relates to a method for vehicle fault detection, the method comprising: detecting, with a plurality of sensors coupled to a vehicle system, respective time series of data, each time series of data corresponding to a component parameter of a plurality of component parameters; determining, with a vehicle control module coupled to the plurality of sensors, an existence of one or more relationships between the plurality of component parameters; identifying, with the vehicle control module, anomalies in the respective time series of data based on the one or more relationships between the plurality of component parameters; and presenting to an operator, with a user interface coupled to the vehicle control module, an indication of the anomalies in the respective time series of data.
- FIG. 1 is a schematic block diagram of a vehicle fault detection system in accordance with aspects of the present disclosure
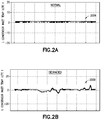
- FIG. 2A is an exemplary illustration of a normal time series of data obtained under fault free normal operating conditions of a vehicle component in accordance with aspects of the present disclosure
- FIG. 2B is an exemplary illustration of a degraded time series of data exhibiting degraded performance of the vehicle component referred to in the description of FIG. 2A in accordance with aspects of the present disclosure
- FIG. 2C is an exemplary illustration of a fault time series of data exhibiting faulty performance of the vehicle component referred to in the description of FIG. 2A in accordance with aspects of the present disclosure
- FIGS. 3A, 3B, and 3C illustrates a relationship between two time series of data corresponding to a first component parameter and a second component parameter occurring over three different excursions of a vehicle, where FIG. 3A corresponds to the first excursion. FIG. 3B corresponds to the second excursion, and FIG. 3C corresponds to the third excursion in accordance with aspects of the present disclosure;
- FIG. 4A is an exemplary graph showing time series of data for respective component parameters of a plurality of vehicle system components and illustrating different operating modes of the plurality of vehicle system components in accordance with aspects of the present disclosure
- FIG. 4B is an exemplary graph showing time series of data for respective component parameters of a plurality of vehicle system components and illustrating different operating modes of the plurality of vehicle system components in accordance with aspects of the present disclosure
- FIG. 4C is an exemplary graph showing time series of data for respective component parameters of a plurality of vehicle system components and illustrating different operating modes of the plurality of vehicle system components in accordance with aspects of the present disclosure
- FIG. 5A is an exemplary illustration of a categorical time series of data in accordance with aspects of the present disclosure
- FIG. 5B is an exemplary illustration of a continuous time series of data in accordance with aspects of the present disclosure.
- FIG. 6A is an exemplary graph illustrating a lack of a relationship between component parameters in accordance with aspects of the present disclosure:
- FIG. 6B is an exemplary graph illustrating a possible relationship between component parameters in accordance with aspects of the present disclosure:
- FIG. 6C is an exemplary graph illustrating a determination of a correlation between component parameters before or after a vehicle system component mode change in accordance with aspects of the present disclosure
- FIG. 6D is an exemplary graph illustrating a determination of a slope change of a component parameter before and after a vehicle system component mode change in accordance with aspects of the present disclosure
- FIG. 6E is an exemplary graph illustrating a determination of a value change of a component parameter before and after a vehicle system component mode change
- FIGS. 7A and 7B are illustrations of an exemplary relationship output in accordance with aspects of the present disclosure.
- FIGS. 8A and 8B are exemplary graphs of time series of data illustrating a detection of an anomaly in the time series of data in accordance with aspects of the present disclosure
- FIG. 9A is an exemplary flow diagram for a method of determining faults in a vehicle system in accordance with aspects of the present disclosure
- FIG. 9B is an exemplary flow diagram of a portion of the method of FIG. 9A in accordance with aspects of the present disclosure
- FIG. 10 is an exemplary illustration of the vehicle in FIG. 1 in accordance with aspects of the present disclosure.
- FIG. 11 is an exemplary flow diagram of an aircraft production and service methodology.
- the vehicle fault detection system 199 will be described with respect to a fixed wing aircraft, such as aircraft 100 A for exemplary purposes only. However, it should be understood that the vehicle fault detection system 199 may be deployed in any suitable vehicle 100 , including but not limited to aerospace vehicles, rotary wing aircraft, unmanned aerial vehicles (UAVs), fixed wing aircraft, lighter than air vehicles, maritime vehicles, and automotive vehicles.
- the vehicle 100 includes one or more vehicle systems 110 each having one or more (e.g., a plurality of) respective components (e.g., engines and components thereof, air conditioning systems and components thereof etc.).
- the vehicle systems 110 may include propulsion systems 110 A, hydraulic systems 110 E, electrical systems 110 D, main landing gear systems 110 B, and nose landing gear system 110 C.
- the vehicle 100 may also include an interior 100 INT having an environmental system 110 G.
- the vehicle systems 110 may also include one or more control systems coupled to an airframe 100 FRM of the vehicle 100 , such as for example, flaps, spoilers, ailerons, slats, rudders, elevators, and trim tabs.
- the aspects of the present disclosure provide for a system 199 and method 900 (see FIG. 9A ) for determining vehicle system 110 faults that may provide for the proactive repair and/or replacement of vehicle system 110 components based upon anomalies detected and identified through an analysis of relationships 140 between the vehicle system 110 components.
- Complex systems such as the vehicle systems 110 described herein, may have many components that interact with each other.
- the aspects of the present disclosure provides for the identification of normal vehicle system 110 behavior through an unsupervised analysis of one or more relationships 140 between the vehicle system 110 components, where the relationships 140 are determined using sensor data from components of the vehicle system 110 .
- the term “normal” refers to the operation of a vehicle system 110 without any faults (e.g., normal operating conditions as understood in the art).
- the aspects of the present disclosure provide for the identification of normal vehicle system 110 behavior, the aspects of the present disclosure may also provide for the identification of anomalous behavior which precedes component faults.
- anomalous refers to a deviation from fault free operation and includes degraded vehicle system 110 (or a component thereof) performance and faulty performance of the vehicle system 110 (or a component thereof).
- one or more of vehicle system 110 component control signals, vehicle system 110 component inferred operating modes, and sensor data may be analyzed for determining and/or providing a prediction of the vehicle system 110 faults.
- the inclusion of control signals in the fault determination analysis (e.g., to infer operating mode changes) may eliminate dependency on subject matter experts for fault detection.
- the aspects of the present disclosure may also reduce or eliminate false positive fault detection by identifying effects on one vehicle system 110 component caused by an operating mode change of another vehicle system 110 component.
- the aspects of the present disclosure may identify a type and strength of relationships 140 between time series of data from a plurality of sensors 101 (e.g., component parameters).
- the aspects of the present disclosure provide for a data driven fault analysis by categorizing the time series of data obtained from the plurality of sensors 101 and analyzes the time series depending on the categorization.
- the aspects of the present disclosure may also provide for the identification of significant changes (e.g., large changes in sensor values) in component parameter values that may constantly fluctuate as part of their normal behavior as well as relationships between vehicle system 110 component parameters that may only exist in certain circumstances, and are not always present in the sensor data.
- the fault detection system 199 and method 900 described herein is highly scalable and can be run on many (e.g., tens, hundreds, thousands, etc.) vehicle system 110 component parameters substantially at once over the course of several vehicle excursions (where, in the case of the aircraft 100 A, each excursion is an individual flight of the vehicle).
- the aspects of the present disclosure may provide for the identification of normal (and/or anomalous) behavior of vehicle system 110 components on large, diverse data sets without the need for domain knowledge from subject matter experts.
- the vehicle fault detection system 199 includes plurality of sensors 101 including at least a first sensor 101 A and a second sensor 101 B.
- Each sensor in the plurality of sensors is configured for coupling with a respective component of a respective vehicle system 110 for detecting respective time series of data of a respective component parameter ( FIG. 9A , Block 910 ).
- the first sensor 101 A may be configured for coupling with a first component 111 A of the vehicle system 110 to detect a first time series of data 123 TS of a first component parameter 123 .
- the second sensor 101 B may be configured for coupling with a second component 111 B of the vehicle system 110 to detect a second time series of data 125 TS of a second component parameter 125 .
- the aspects of the present disclosure may be applied to multiple vehicle systems 110 to determine the relationships 140 between the components of the multiple vehicle systems for detecting faults in one or more of the multiple vehicle systems.
- a vehicle control module 120 is coupled to the plurality of sensors 101 (e.g., such as the first sensor 101 A and the second sensors 101 B) in any suitable manner, such as through any suitable wired or wireless connection.
- the vehicle control module 120 may be any suitable controller onboard the vehicle 100 or any suitable controller that is wirelessly coupled to or hardwired to the vehicle 100 (e.g., such as a vehicle maintenance controller).
- the vehicle control module 120 may include any suitable memory 121 and processor 130 configured with any suitable data storage and non-transitory computer program code for carrying out the aspects of the present disclosure as described herein, where for example, the plurality of sensors 101 are coupled to the memory 121 so that data (e.g., such as first component data 122 and second component data 124 ) from the plurality of sensors 101 is stored in the memory 121 in any suitable manner.
- the vehicle fault detection system 199 may also include any suitable user interface 175 coupled to the vehicle control module 120 .
- the user interface 175 may be a display/interface of the vehicle 100 or a display/interface coupled to the vehicle 100 through a wired or wireless connection.
- the user interface 175 is configured to present to an operator of the vehicle 100 at least an indication of the anomalies 177 in one or more of the first time series of data 123 TS and the second time series of data 125 TS. In other aspects, the user interface 175 is configured to present to an operator of the vehicle 100 one or more of an indication of anomalies 177 , a prediction of fault 178 , preventative maintenance corrective action 179 , and a post excursion vehicle maintenance report 176 (where the post excursion vehicle maintenance report includes at least one of the indication of anomalies 177 , corrective action 179 and the prediction of fault 178 ) for the vehicle system 110 . In one aspect, user interface 175 may provide, in any suitable manner such as through the post excursion vehicle maintenance report 176 or other suitable report, a vehicle system lockout indication 174 as described herein.
- vehicle system 110 components such as the first component 111 A and the second component 111 B, exhibit differing performance throughout a service life of the component.
- FIG. 2A illustrates a normal time series of data 200 N obtained under fault free normal operating conditions of the component.
- FIG. 2B illustrates a degraded time series of data 200 D exhibiting degraded component performance, which may indicates the vehicle component is nearing an end of its service life.
- FIG. 2C illustrates a fault time series of data 200 F exhibiting faulty component performance which may indicate an end of service life for the vehicle system 110 component.
- the time series of data may also provide an indication that a sudden change/spike (e.g. large increase in sensor values) in the time series of data is a normal operating characteristic of the vehicle system 110 component.
- FIGS. 3A-3C illustrates time series of data for three different excursions of the vehicle 100 where each of FIGS. 3A-3C show time series of data corresponding to a first component parameter 123 (for the first component 111 A) and a second component parameter 125 (for the second component 111 B).
- a sudden change/spike e.g. large increase in sensor values
- a first time series of data for the first and second excursion 123 TSE 1 , 123 TSE 2 illustrates normal operation of the first component 111 A
- the a second time series of data for the first and second excursion 125 TSE 2 , 125 TSE 2 illustrates normal operation of the second component 111 B
- the first time series of data for the third excursion 123 TSE 3 of the first component 111 A shows a first sensor data spike 300 (e.g., large change in sensor values) toward the right hand side of the graph.
- the first sensor data spike 300 in the first time series of data for the third excursion 123 TSE 3 considered alone may be indicative of an anomaly and indicate a fault in the first component parameter 123 ; however, when the first sensor data spike 300 is considered in conjunction with the second time series of data for the third excursion 125 TSE 3 of the second component 111 B, it can be seen that the second time series of data for the third excursion 125 TSE 3 includes a corresponding second sensor data spike 310 .
- the corresponding first and second sensor data spikes 300 , 310 may indicate a relationship 140 between the first component parameter 123 and the second component parameter 125 , and the aspects of the present disclosure may identify this relationship 140 in the fault analysis.
- the second data spike 310 may be the result of a mode change of the second component 111 B that causes an effect on the first component parameter 123 under normal operating conditions.
- vehicle systems 110 have different operating states or operating modes when interpreting time series of data, such as the first time series of data 123 TS and the second time series of data 125 TS.
- time series of data such as the first time series of data 123 TS and the second time series of data 125 TS.
- vehicle system 110 parameters such as the first component parameter 123 and the second component parameter 125 , to exhibit distinct behavior in various operating modes.
- the different operating modes of the plurality of vehicle system 110 components 111 and their respective component parameters may be triggered by a control signal 400 sent to one of the plurality of components 111 by any suitable controller of the vehicle 100 and/or controller of the vehicle system 110 .
- FIG. 4A illustrates a plot comparing a first time series of data 123 TS for the first component 111 A, a second time series of data 125 TS for the second component 111 B and a third time series of data 126 TS of a third component 111 C with the control signal 400 .
- FIG. 4A illustrates a plot comparing a first time series of data 123 TS for the first component 111 A, a second time series of data 125 TS for the second component 111 B and a third time series of data 126 TS of a third component 111 C with the control signal 400 .
- the control signal 400 causes a change in operating modes of the first time series of data 123 TS so that the first time series of data 123 TS exhibits three modes of operation, e.g., mode A, mode B and mode C, where the change between adjacent modes A, B, C are indicated by the mode changes 410 , 411 .
- the control signal 400 changes the first component 111 A, the second component 111 B, and the third component 111 C each exhibit distinctly different behavior where the change in behaviors is used by the fault detection system 199 described herein to identify normal vehicle system 110 behavior.
- the fault detection system 199 is an unsupervised system that incorporates domain knowledge of the vehicle system 110 substantially without the need for subject matter experts.
- the plurality of sensors 101 can be monitored to detect degraded performance (as illustrated in FIG. 4B by the mode change delay ⁇ X in the second and third time series of data 125 TS, 126 TS after the mode change 411 ) and/or predict faults as described herein.
- the fault detection system 199 is configured to identify sub-mode changes which may further identify sub-relationships 140 between the vehicle system 110 components, such as the first component 111 A, the second component 111 B, and the third component 111 C.
- sub-mode changes may further identify sub-relationships 140 between the vehicle system 110 components, such as the first component 111 A, the second component 111 B, and the third component 111 C.
- it may be desired to identify complex operational modes, in which multiple operational modes occur substantially simultaneously (e.g., one or more mode changes of one component parameter within at least one mode of another component parameter), even though the component parameters may be controlled independently of one another.
- FIG. 4C illustrates the control signal 400 causing mode changes 410 , 411 in the first component parameter 123 so that the first component parameter 123 exhibits three operational modes, e.g., modes A, B, C.
- a control signal 400 A may be sent to the third component 111 C at mode change 412 where the mode change 412 of third component parameter 126 effects a change in the second component parameter 125 , but not the first component parameter 123 .
- the change in the second component parameter 125 at the mode change 412 may indicate a further relationship 140 between the second component parameter 125 and the third component parameter 126 within operational mode B of the first component parameter 123 .
- the fault detection system 199 may also incorporate domain knowledge of the vehicle system 110 sub-modes substantially without the need for subject matter experts, for identifying normal vehicle system behavior 110 .
- the vehicle control module 120 includes a relationship determining module 131 configured to determine the existence of a relationship 140 between the plurality component parameters 460 , such as the first component parameter 123 and the second component parameter 125 , corresponding to the plurality of vehicle components 111 .
- the relationship determining module 131 is configured to classify one or more (or each) of the plurality of component parameters 460 ( FIGS. 4A-4C ) ( FIG.
- the categorical component parameters include, for example, sensor values that represent discrete states/operational modes, such as on/off, open/closed, etc.
- FIG. 5A illustrates a time series of data representing an open and closed position of, for example, a valve of the environmental system 110 G (see FIG. 10 ).
- Continuous component parameters include sensor values that may have an infinite number of sensor value possibilities (e.g., a percentage, voltage, current, temperature, etc.).
- FIG. 5B illustrates a time series of sensor data representing a percentage the valve of the environmental system 110 G (see FIG. 10 ) is open.
- the relationship determining module 131 may be configured to categorize the plurality component parameters 460 ( FIGS. 4A-4C ) by, for example, counting the unique/distinct values exhibited by the component parameters. As an example, if a component parameter has less than about 15 unique/distinct values (or any other suitable value) the component parameter is classified as categorical, otherwise the component parameter is classified as continuous.
- the vehicle control module 120 determines the existence of the relationship 140 between the plurality of component parameters 460 by determining any effects on one of the plurality of component parameters (e.g., such as one of the first component parameter 123 and the second component parameter 125 ) caused by another of the plurality of component parameters (e.g., such as another of the first component parameter 123 and the second component parameter 125 ).
- the vehicle control module 120 is configured to identify mode change 410 - 412 (see FIGS. 4-4C ) events ( FIG.
- the mode change 410 - 412 events may be different for the categorical and continuous classifications of the plurality of component parameters 460 .
- a mode change 411 event for a component parameter having a categorical classification (such as the first component parameter 123 shown in FIG. 5A ) is identified with each value change of the first component parameter 123 .
- a mode change 410 - 412 event for a component parameter having a continuous classification (such as the second component parameter 125 shown in FIG.
- the significant change in value may be defined as a change in value of the second time series of data 125 TS that is greater than two standard deviations within about a five second (or other suitable time) time window.
- the mode change 410 - 412 events may be identified as increases or decreases, where increases or decreases in value of a component parameter may effect different types of behavior with other component parameters in the plurality of component parameters 460 as described herein.
- the vehicle control module 120 is configured to determine whether a relationship 140 exists between one or more of the plurality of component parameters 460 by performing relational calculations ( FIG.
- the vehicle control module 120 is configured to apply the formula to at least one combination of plurality of component parameters 460 (e.g., the formula is applied to two component parameters). In other aspects, the vehicle control module 120 is configured to apply the formula for every combination of the plurality of component parameters 460 (e.g., referring to FIG.
- the combinations may include the first and second component parameters 123 , 125 , the first and third component parameters 123 , 126 , the second and third component parameters 125 , 126 , etc.).
- the control signal 400 is applied to the first component 111 A so that the first component parameter 123 has two mode change 410 , 411 events.
- the first component parameter 123 is considered as the controlling component parameter (x) for defining the mode changes 410 , 411 for purposes of applying the above formula.
- the second and third component parameters 125 , 126 are referred to herein as dependent component parameters because the values of the second and third component parameters may depend/be related (based on the outcome of the above formula) to the first component parameter as shown by the changes of the second and third component parameters 125 , 126 at the mode changes 410 , 411 illustrated in FIG. 4A .
- the formula, as written above, would be applied to the first and second component parameters 123 , 125 and to the first and third component parameters 123 , 126 to determine whether each of the second and third component parameters 125 , 126 have a relationship with the first component parameter 123 .
- the vehicle control module 120 is configured to determine any effects on one of the plurality of component parameters 460 (such as the first component parameter 123 and the second component parameter 125 ) caused by another of the plurality of component parameters 460 (such as the first component parameter 123 and the second component parameter 125 ) by comparing a predetermined characteristic of one or more of the respective time series of data (such as the first time series of data 123 TS and/or the second time series of data 125 TS) before and after the mode change events 410 - 412 .
- the vehicle control module 120 may be configured to define a predetermined time period T 1 , T 2 (such as about thirty seconds or any other suitable time period—see FIGS.
- FIGS. 6A and 6B illustrate the first time series of data 123 TS and the second time series of data 125 TS before and after the mode change 411 .
- the predetermined characteristic is a coefficient of determination r 2 of one or more of the respective time series of data 123 TS, 125 TS across the mode change 411 event(s).
- the vehicle control module 120 may define a predetermined threshold value for the coefficient of determination r 2 , where if the value of coefficient of determination r 2 is above the threshold any possible relationship between the component parameters 123 , 125 corresponding to the time series of data (such as the first and second time series of data 123 TS, 125 TS) is ignored.
- the predetermined threshold value for the coefficient of determination r 2 is about 0.9 or greater or about 0.0 for segments of a time series of data on both sides of a mode change and about 0.6 or greater or about 0.0 for a segment of a time series on only one side of a mode change (in other aspects the predetermined threshold value may be any suitable value between 0.0 and 1.0). As shown in FIG.
- the coefficient of determination r 2 for the first and second time series of data 123 TS, 125 TS is about 0.98 and as such it is determined that no relationship exists between the first component parameter 123 and the second component parameter 125 .
- the coefficient of determination r 2 for the first and second time series of data 123 TS, 125 TS is about 0.64 and as such it is determined that a relationship 140 may exist between the first component parameter 123 and the second component parameter 125 .
- the vehicle control module 120 determines with part 2 of the above formula whether a correlation exists, either before or after the mode change (such as mode change 411 ) between the plurality of component parameters 460 .
- a correlation exists after the mode change 411 but not before the mode change 411 illustrates an example where a correlation exists after the mode change 411 but not before the mode change 411 .
- the vehicle control module 120 determines with part 3 of the above formula, where the component parameter is categorized as continuous, a change in slope of the respective time series of data across the mode change events. For example, the vehicle control module 120 is configured to determine whether a correlation exists before and after the mode change (such as mode change 411 ) between the plurality of component parameters 460 , and whether the slope M x of one of the component parameters 123 , 125 (where the component parameter has a continuous classification) has changed.
- FIG. 6D is an illustration of where the slope M x of the time series of data 125 TS for the second component parameter 125 has changed from a positive slope M x to a negative slope M x .
- the vehicle control module 120 determines with part 4 of the above formula, where the component parameter is categorized as categorical or continuous, a change in magnitude of the respective time series of data across the mode change events. For example, the vehicle control module 120 is configured to determine whether a correlation exists, either before or after the mode change (such as mode change 411 ) between the plurality of component parameters 460 , and whether the slope M x of one of the component parameters 123 , 125 differs (where the component parameter has a categorical or continuous classification).
- the mean ⁇ and standard deviation a are calculated for the interval before the mode change 411 .
- FIG. 6E illustrates an example where the slopes M x do not differ and the value for the coefficient of determination r 2 is above the predetermined threshold value for the coefficient of determination r 2 (e.g., there is no significant value change).
- the vehicle control module 120 is configured to score the relationships ( FIG. 9B , Block 924 ) in any suitable manner.
- score the relationships the values for parts 1-4 of the formula are combined according to the formula where:
- part 1 will evaluate to a 1 if there is not a strong correlation for the total segment (before and after the mode change 411 , see e.g., FIG. 4A ) of the time series of data for the dependent component parameter,
- part 2 will evaluate to 1 if one of the slopes (before or after the mode change, but not both) of the time series of data for the dependent component parameter has a strong correlation
- part 3 will evaluate to 1 if both of the slopes (before and after the mode change) have a strong correlation and the slopes are in different directions, and
- part 4 will evaluate to 1 if both of the slopes (before and after the mode change) have a strong correlation and at least one of the values after the mode change is more than 2 standard deviations away from the mean before the mode change.
- the vehicle control module determines that a relationship exists between the component parameters being evaluated in the component parameter combination(s). Based on the formula the relationship score 141 may be a value between 0 and 3.
- the relationship scores 141 are averaged over multiple excursions of the vehicle ( FIG. 9B . Block 925 ) to produce an average relationship score 142 which may be represented as a relationship percentage (see FIG. 7 ) for the plurality of component parameters 460 .
- an exemplary relationship output 700 of the vehicle control module 120 is illustrated in FIG. 7 and may be included in a post excursion vehicle maintenance report 176 presented on the user interface 175 .
- the relationship output 700 represents twelve sensor parameters (e.g., the plurality of component parameters 460 ) from an environmental system 110 G (see FIG. 10 ) of the aircraft 100 A.
- Parameter 1 in the relationship output 700 represents the controlling component parameter and parameter 2 in the output represents the dependent component parameter or vice versa (e.g., for purposes of applying the above formula).
- the mode change 410 - 412 events may be identified as increases or decreases, where increases or decreases (e.g., a change type) in value of a component parameter may effect different types of behavior with other component parameters in the plurality of component parameters 460 .
- the change types may be indicated in the relationship output 700 to identify how the change type of the controlling component parameter effects the dependent component parameter. For example, an increasing change (+) to the left economy cooling valve results in a slope change to the left condenser inlet temperature. In the relationship output 700 the higher the relationship percentage the greater the relationship is between the component parameters.
- the vehicle control module 120 is configured to identify anomalies in the respective time series of data (such as one or more of the first and second time series of data 123 TS, 125 TS for the first and second component parameters 123 , 125 ) ( FIG. 9A , Block 930 ) based on the one or more relationships 140 between the plurality of component parameters 460 (such as the first and second component parameters 123 , 125 ).
- the vehicle control module 120 is configured to receive or otherwise obtain, from any suitable data source or data base, respective historical time series of data (such as first and second historical time series of data 123 HS, 125 HS) for the plurality of component parameters 460 .
- the vehicle control module obtains the first historical time series of data 123 HS which includes historical data for the first component parameter 123 , and obtains the second historical time series of data 125 HS which includes historical data for the second component parameter 125 .
- Each of the respective historical time series of data 123 HS, 125 HS includes respective component data that is labeled as corresponding to one or more of normal component operation 123 HN, 125 HN and anomalous component operation 123 HA, 125 HA.
- the vehicle control module 120 is configured to determine an existence of one or more historical relationships 145 between the plurality of component parameters 460 using the labeled historical time series of data 123 HS, 125 HS in the manner described above, such as by determining operating modes/sub-modes based on one or more control signals and using the formula in the manner described above.
- the vehicle control module 120 includes an anomaly identification module 132 that includes any suitable machine learning algorithm/model 132 M that is trained using the historical relationships 145 .
- the anomaly identification module 132 is configured to compare the relationships 140 with the historical relationships 145 so as to detect any anomalies in one or more of, for example, the first and second times series of data 123 TS, 125 TS. As an example, referring to FIG.
- FIG. 8A illustrates an example, where the performance of the second component parameter 125 has degraded such that the second time series of data 125 TS for the second component parameter 125 has a positive slope M x before and after the mode change 411 .
- This anomaly (e.g., the positive slope of the second time series of data 125 TS before and after the mode change 411 ) is identified by the anomaly identification module 132 as an impending fault and may be presented by the user interface 175 to an operator as an indication of anomalies 177 .
- the indication of anomalies 177 may be included in the post excursion (flight) vehicle maintenance report 176 .
- the vehicle control module is configured to predict a failure of a vehicle system 110 component corresponding to one or more of the plurality of component parameters 460 based on the anomalies in the respective time series of data. For example, based on the training of the anomaly detection module, it may be known how long degraded performance of a vehicle system 110 component may persist before a fault occurs with the vehicle system 110 component. For example, when the degraded performance of the second component parameter 125 , as illustrated in FIG. 8B persists or increases the anomaly identification module 132 is configured to determine a failure time frame during which the second component 111 B may fail. This failure time frame may be presented on the user interface 175 to an operator as a prediction of fault 178 . In one aspect, the prediction of fault 178 may be included in the post excursion (flight) vehicle maintenance report 176 .
- the vehicle control module 120 is configured to cause the user interface to graphically present to the operator one or more of the one or more relationships between the plurality of component parameters 460 (as shown in, e.g., the relationship output 700 of FIG. 7 or any other suitable presentation format), the indication of anomalies 177 , and the prediction of fault 178 .
- the indication of anomalies 177 and/or the prediction of fault 178 may be presented in a graphical form such as the time series of data graphs illustrated herein, as bar graphs, or in any other suitable presentation format.
- one or more of the relationship output 700 , the indication of anomalies 177 , and the prediction of fault 178 includes groups of component parameters that are related following a control signal change and the expected behavior of the effected parameters.
- the operator may perform any suitable preventative maintenance ( FIG. 9A , Block 940 ) based on the information provided in the indication of anomalies 177 , and the prediction of fault 178 , and/or the post excursion (flight) vehicle maintenance report 176 .
- the vehicle fault detection system 199 such as through the vehicle control module 120 , is configured to provide the operator with preventative maintenance corrective action(s) 179 (e.g., such as to replace a component in a vehicle system, secure a fastener in a vehicle system, etc.) in the post excursion vehicle maintenance report 176 .
- the post vehicle excursion maintenance report 176 may be generated automatically by the vehicle control module 120 after an excursion, may be generated by the vehicle control module 120 in response to a detection of an anomaly by the vehicle fault detection system 199 and/or at the request of an operator/maintenance personnel of the vehicle.
- the vehicle fault detection system 199 such as through the vehicle control module 120 and/or interlock 197 described below, is configured to “lock out” a component of a vehicle system or the entire vehicle system in response to a detection of an anomaly.
- a vehicle system lock out indication 174 may be provided with one or more of the indication of anomalies 177 , the prediction of fault 178 and the corrective action 179 .
- respective time series of data 123 TS, 125 TS are detected with the plurality of sensors 101 coupled to the vehicle system 110 ( FIG. 9A , Block 910 ), where each time series of data 123 TS, 125 TS corresponds to a component parameter 123 , 125 of a plurality of component parameters 460 .
- the vehicle control module 120 is coupled to the plurality of sensors and determines an existence of one or more relationships between the plurality of component parameters 460 ( FIG. 9A , Block 920 ) in the manner described above with respect to FIG. 9B .
- the vehicle control module 120 identifies anomalies in the respective time series of data 123 TS, 125 TS ( FIG. 9A , Block 930 ) based on the one or more relationships between the plurality of component parameters 460 . At least the indication of the anomalies 177 in the respective time series of data 123 TS, 125 TS is presented to an operator ( FIG. 9A , Block 940 ) with the user interface 175 coupled to the vehicle control module 120 .
- the vehicle control module 120 may perform the above-described fault detection and fault prediction analysis at vehicle 100 startup and/or prior to any suitable specified operation of the vehicle 100 (e.g., for example, dropping an anchor, docking with a space station, operating a robotic arm of the vehicle, etc.). In other aspects, the vehicle control module 120 may perform the above-described fault detection and fault prediction analysis at vehicle 100 shutdown.
- the vehicle fault detection system 199 may include a vehicle interlock 197 coupled with the vehicle control module 120 and one or more of the vehicle systems 110 .
- the vehicle interlock 197 is configured to prevent an operation (corresponding to a vehicle system 110 coupled to the interlock 197 ) of the vehicle 100 based on a detection of the anomalous behavior that is indicative of a component fault/failure.
- the vehicle control module 120 detects anomalous behavior of a vehicle system 110 component the vehicle interlock 197 may “lock out” the vehicle system component and/or vehicle system by preventing the operation of the vehicle system component/vehicle system or by providing a limited operational capability of the vehicle system component and/or vehicle system.
- anomalous behavior is detected for a robotic arm of a spacecraft (that includes the fault detection system 199 described herein) the vehicle interlock 197 may prevent the operation of the robotic arm to allow for the performance of preventative maintenance.
- the vehicle interlock 197 may be configured to provide limited/restricted use of the vehicle component/system when anomalous behavior of the vehicle system 110 component is detected by the vehicle fault detection system 199 .
- the vehicle interlock 197 is configured to communicate with the vehicle control module 120 so that the vehicle system lockout indication 174 is presented to the operator through the user interface 175 to indicate which vehicle component and/or system is being locked out.
- illustrative method 1100 may include specification and design (block 1110 ) of aircraft 100 A and material procurement (block 1120 ). During production, component and subassembly manufacturing (block 1130 ) and system integration (block 1140 ) of aircraft 100 A may take place. Thereafter, aircraft 100 A may go through certification and delivery (block 1150 ) to be placed in service (block 1160 ).
- routine maintenance and service may include modification, reconfiguration, refurbishment, etc. of one or more systems of aircraft 100 A which may include and/or be facilitated by the fault determination described herein.
- a system integrator may include, without limitation, any number of aircraft manufacturers and major-system subcontractors; a third party may include, without limitation, any number of vendors, subcontractors, and suppliers; and an operator may be an airline, leasing company, military entity, service organization, and so on.
- the apparatus(es), system(s), and method(s) shown or described herein may be employed during any one or more of the stages of the manufacturing and service method 1100 .
- components or subassemblies corresponding to component and subassembly manufacturing (block 1130 ) may be fabricated or manufactured in a manner similar to components or subassemblies produced while aircraft 100 A is in service (block 1160 ).
- one or more examples of the apparatus or method realizations, or a combination thereof, may be utilized, for example and without limitation, while aircraft 100 A is in service (block 1160 ) and/or during maintenance and service (block 1170 ).
- a vehicle fault detection system comprising:
- a first sensor coupled to a vehicle system and configured to detect a first time series of data of a first component parameter
- a second sensor coupled to the vehicle system and configured to detect a second time series of data of a second component parameter
- vehicle control module coupled to the first sensor and the second sensor, the vehicle control module being configured to
- a user interface coupled to the vehicle control module, the user interface being configured to present to an operator an indication of the anomalies in the one or more of the first time series of data and the second time series of data.
- vehicle control module is configured to predict a failure of a vehicle system component corresponding to one or more of the first component parameter and the second component parameter based on the anomalies in the one or more of the first time series of data and the second time series of data
- user interface is configured to present to the operator prediction of the failure of the vehicle system component
- vehicle control module is configured to classify each of the first component parameter and the second component parameter as being one of categorical or continuous.
- vehicle control module is configured to determine the existence of the relationship between the first component parameter and the second component parameter by determining any effects on one of the first component parameter and the second component parameter caused by another of the first component parameter and the second component parameter.
- A6 The vehicle fault detection system of paragraph A5, wherein the vehicle control module is configured to:
- a mode change event is one of an increase in value or a decrease in value of a respective one of the first time series of data and the second time series of data.
- A8 The vehicle fault detection system of paragraph A6, wherein the predetermined characteristic is the coefficient of determination of one or more of the first time series of data and the second time series across the mode change events.
- A9 The vehicle fault detection system of paragraph A5, wherein the vehicle control module is configured to determine a correlation between the first component parameter and the second component parameter before and after the mode change events.
- the vehicle control module is configured to determine a change in slope of a respective one of the first time series of data and the second time series of data across the mode change events;
- the vehicle control module is configured to determine a change in magnitude of a respective one of the first time series of data and the second time series of data across the mode change events.
- vehicle control module is configured to:
- A13 The vehicle fault detection system of paragraph A1, wherein the user interface is configured to present the indication of the anomalies and a failure prediction based on the anomalies in a post-flight vehicle maintenance report.
- A14 The vehicle fault detection system of paragraph A1, wherein the vehicle control module is configured to identify the anomalies by:
- first historical time series of data for the first component parameter, where the first historical time series of data includes first component data that is labeled as corresponding to one or more of normal first component operation and anomalous first component operation;
- the second historical time series of data includes second component data that is labeled as corresponding to one or more of normal second component operation and anomalous second component operation;
- the vehicle fault detection system of paragraph A1 further comprising a vehicle interlock coupled with the vehicle control module, the vehicle interlock being configured to prevent an operation of the vehicle based on a detection of the anomalous behavior.
- a vehicle fault detection system comprising:
- a plurality of sensors coupled to a vehicle system and configured to detect respective time series of data, each time series of data corresponding to a component parameter of a plurality of component parameters;
- vehicle control module coupled to the plurality of sensors, the vehicle control module being configured to
- a user interface coupled to the vehicle control module, the user interface being configured to present to an operator an indication of the anomalies in the respective time series of data.
- vehicle control module is configured to determine the existence of the one or more relationships between the plurality of component parameters by determining any effects on one of the plurality of component parameters caused by another of the plurality of component parameters.
- a mode change event is one of an increase in value or a decrease in value of the respective time series of data.
- the vehicle control module is configured to determine a change in slope of the respective time series of data across the mode change events;
- the vehicle control module is configured to determine a change in magnitude of the respective time series of data across the mode change events.
- each of the respective historical time series of data includes respective component data that is labeled as corresponding to one or more of normal component operation and anomalous component operation;
- the vehicle fault detection system of paragraph A1 further comprising a vehicle interlock coupled with the vehicle control module, the vehicle interlock being configured to prevent an operation of the vehicle based on a detection of the anomalous behavior.
- a method for vehicle fault detection comprising:
- the vehicle control module determines a change in slope of the respective time series of data across the mode change events
- the vehicle control module determines a change in magnitude of the respective time series of data across the mode change events.
- each of the respective historical time series of data includes respective component data that is labeled as corresponding to one or more of normal component operation and anomalous component operation;
- solid lines, if any, connecting various elements and/or components may represent mechanical, electrical, fluid, optical, electromagnetic, wireless and other couplings and/or combinations thereof.
- “coupled” means associated directly as well as indirectly.
- a member A may be directly associated with a member B, or may be indirectly associated therewith, e.g., via another member C. It will be understood that not all relationships among the various disclosed elements are necessarily represented. Accordingly, couplings other than those depicted in the drawings may also exist.
- Dashed lines, if any, connecting blocks designating the various elements and/or components represent couplings similar in function and purpose to those represented by solid lines; however, couplings represented by the dashed lines may either be selectively provided or may relate to alternative examples of the present disclosure.
- elements and/or components, if any, represented with dashed lines indicate alternative examples of the present disclosure.
- One or more elements shown in solid and/or dashed lines may be omitted from a particular example without departing from the scope of the present disclosure.
- Environmental elements, if any, are represented with dotted lines. Virtual (imaginary) elements may also be shown for clarity.
- FIGS. 9A, 9B, and 11 referred to above, the blocks may represent operations and/or portions thereof and lines connecting the various blocks do not imply any particular order or dependency of the operations or portions thereof. Blocks represented by dashed lines indicate alternative operations and/or portions thereof. Dashed lines, if any, connecting the various blocks represent alternative dependencies of the operations or portions thereof. It will be understood that not all dependencies among the various disclosed operations are necessarily represented. FIGS. 9A, 9B, and 11 , and the accompanying disclosure describing the operations of the method(s) set forth herein should not be interpreted as necessarily determining a sequence in which the operations are to be performed.
- first,” “second,” etc. are used herein merely as labels, and are not intended to impose ordinal, positional, or hierarchical requirements on the items to which these terms refer. Moreover, reference to, e.g., a “second” item does not require or preclude the existence of e.g., a “first” or lower-numbered item, and/or, e.g., a “third” or higher-numbered item.
- a system, apparatus, structure, article, element, component, or hardware “configured to” perform a specified function is indeed capable of performing the specified function without any alteration, rather than merely having potential to perform the specified function after further modification.
- the system, apparatus, structure, article, element, component, or hardware “configured to” perform a specified function is specifically selected, created, implemented, utilized, programmed, and/or designed for the purpose of performing the specified function.
- “configured to” denotes existing characteristics of a system, apparatus, structure, article, element, component, or hardware which enable the system, apparatus, structure, article, element, component, or hardware to perform the specified function without further modification.
- a system, apparatus, structure, article, element, component, or hardware described as being “configured to” perform a particular function may additionally or alternatively be described as being “adapted to” and/or as being “operative to” perform that function.
Abstract
Description
[r ba 2 <t 1][([[r b 2 >t 2]+[r a 2 >t 2]=1]+[[r b 2 >t 2]+[r a 2 >t 2]=2]*[[m b>0]+[m a>0]=1]+[[r b 2 >t 2+[r a 2 >t 2]=2]*[[Σi=0 30[x>abs(λ·2σ)]]>0])>0]
[r ba 2 <t 1] [part 1]
[[r b 2 >t 2]+[r a 2 >t 2]=1] [part 2]
[[r b 2 t 2]+[[r a 2 >t 2]=2]*[[m b>0]+[m a>0]=1] [part 3]
[[r b 2 >t 2]+[r a 2 >t 2]=2]*[[Σi=0 30[x>abs(μ*2σ)]]>0] [part 4]
Claims (20)
Priority Applications (6)
| Application Number | Priority Date | Filing Date | Title |
|---|---|---|---|
| US15/795,823 US10719772B2 (en) | 2017-10-27 | 2017-10-27 | Unsupervised multivariate relational fault detection system for a vehicle and method therefor |
| JP2018173473A JP7174578B2 (en) | 2017-10-27 | 2018-09-18 | Unsupervised multivariate relational failure detection system and method for vehicles |
| EP18196193.9A EP3477410B1 (en) | 2017-10-27 | 2018-09-24 | Unsupervised multivariate relational fault detection system for a vehicle and method therefor |
| CA3020861A CA3020861C (en) | 2017-10-27 | 2018-10-15 | Unsupervised multivariate relational fault detection system for a vehicle and method therefor |
| CN201811256277.5A CN109727336B (en) | 2017-10-27 | 2018-10-26 | Vehicle fault detection system and method for vehicle fault detection |
| US16/901,714 US11315027B2 (en) | 2017-10-27 | 2020-06-15 | Unsupervised multivariate relational fault detection system for a vehicle and method therefor |
Applications Claiming Priority (1)
| Application Number | Priority Date | Filing Date | Title |
|---|---|---|---|
| US15/795,823 US10719772B2 (en) | 2017-10-27 | 2017-10-27 | Unsupervised multivariate relational fault detection system for a vehicle and method therefor |
Related Child Applications (1)
| Application Number | Title | Priority Date | Filing Date |
|---|---|---|---|
| US16/901,714 Continuation US11315027B2 (en) | 2017-10-27 | 2020-06-15 | Unsupervised multivariate relational fault detection system for a vehicle and method therefor |
Publications (2)
| Publication Number | Publication Date |
|---|---|
| US20190130288A1 US20190130288A1 (en) | 2019-05-02 |
| US10719772B2 true US10719772B2 (en) | 2020-07-21 |
Family
ID=63914748
Family Applications (2)
| Application Number | Title | Priority Date | Filing Date |
|---|---|---|---|
| US15/795,823 Active 2038-05-24 US10719772B2 (en) | 2017-10-27 | 2017-10-27 | Unsupervised multivariate relational fault detection system for a vehicle and method therefor |
| US16/901,714 Active 2037-12-27 US11315027B2 (en) | 2017-10-27 | 2020-06-15 | Unsupervised multivariate relational fault detection system for a vehicle and method therefor |
Family Applications After (1)
| Application Number | Title | Priority Date | Filing Date |
|---|---|---|---|
| US16/901,714 Active 2037-12-27 US11315027B2 (en) | 2017-10-27 | 2020-06-15 | Unsupervised multivariate relational fault detection system for a vehicle and method therefor |
Country Status (5)
| Country | Link |
|---|---|
| US (2) | US10719772B2 (en) |
| EP (1) | EP3477410B1 (en) |
| JP (1) | JP7174578B2 (en) |
| CN (1) | CN109727336B (en) |
| CA (1) | CA3020861C (en) |
Cited By (2)
| Publication number | Priority date | Publication date | Assignee | Title |
|---|---|---|---|---|
| US11453511B1 (en) * | 2021-07-13 | 2022-09-27 | Beta Air, Llc | Systems and methods for data verification at start up |
| US11928971B2 (en) | 2021-04-01 | 2024-03-12 | Boeing Company | Detection of anomalous states in multivariate data |
Families Citing this family (7)
| Publication number | Priority date | Publication date | Assignee | Title |
|---|---|---|---|---|
| DE102015207895A1 (en) * | 2015-04-29 | 2016-11-03 | Continental Automotive Gmbh | Method for monitoring an electronic control unit and control unit for a motor vehicle |
| FR3074590B1 (en) * | 2017-12-04 | 2023-03-17 | Soc Air France | METHOD FOR PREDICTING AN MALFUNCTION OF ONE OR MORE EQUIPMENT OF A SET |
| JP6978975B2 (en) * | 2018-04-13 | 2021-12-08 | 本田技研工業株式会社 | Information output device and information output method |
| WO2020166011A1 (en) * | 2019-02-14 | 2020-08-20 | 日本電気株式会社 | Time-series data processing method |
| CN112036581B (en) * | 2019-05-15 | 2024-03-26 | 上海杰之能软件科技有限公司 | Performance detection method and device for vehicle air conditioning system, storage medium and terminal |
| JP2022068872A (en) * | 2020-10-22 | 2022-05-10 | マサチューセッツ インスティテュート オブ テクノロジー | Modular general-purpose automated anomalous data synthesizer for rotary plant |
| US11667376B1 (en) * | 2021-11-12 | 2023-06-06 | Beta Air, Llc | System and method for flight control compensation for component degradation |
Citations (7)
| Publication number | Priority date | Publication date | Assignee | Title |
|---|---|---|---|---|
| GB2448351A (en) | 2007-04-12 | 2008-10-15 | Itacs Ltd | Method and apparatus for active system safety |
| US20090216393A1 (en) * | 2008-02-27 | 2009-08-27 | James Schimert | Data-driven anomaly detection to anticipate flight deck effects |
| US20100241293A1 (en) * | 2006-08-04 | 2010-09-23 | Honeywell International Inc. | Tunable architecture for aircraft fault detection |
| US9116520B2 (en) * | 2011-07-26 | 2015-08-25 | Airbus Operations (Sas) | Automatic estimation process and device for a flight parameter vector in an aircraft, as well as detection methods and assemblies for a failure affecting such a vector |
| US20160340059A1 (en) * | 2014-01-20 | 2016-11-24 | Jean-Hugues PETTRE | Method for predicting an operational malfunction in the equipment of an aircraft or aircraft fleet |
| US20170106997A1 (en) * | 2012-12-18 | 2017-04-20 | Joseph Bekanich | Autonomous distressed aircraft tracking system |
| US10089203B2 (en) * | 2015-05-27 | 2018-10-02 | Tata Consultancy Services Limited | Artificial intelligence based health management of host system |
Family Cites Families (10)
| Publication number | Priority date | Publication date | Assignee | Title |
|---|---|---|---|---|
| DE19920532A1 (en) * | 1999-05-05 | 2000-11-16 | Mika Heiztechnik Gmbh | Device for monitoring operating parameters on systems having an electrical or electronic control device |
| US6860244B2 (en) * | 2002-11-08 | 2005-03-01 | Ford Global Technologies, Llc | Engine control with operating mode detection |
| EP1793296A1 (en) * | 2005-12-05 | 2007-06-06 | Insyst Ltd. | An apparatus and method for the analysis of a process having parameter-based faults |
| US8018703B2 (en) * | 2006-12-12 | 2011-09-13 | Schneider Electric Industries Sas | Auxiliary device and data transmission method, auxiliary unit and electrical circuit breaker comprising said device |
| CN101308385B (en) * | 2008-07-11 | 2011-04-13 | 东北大学 | Non-linear procedure failure testing method based on two-dimensional dynamic kernel principal component analysis |
| GB2516035B (en) | 2013-07-08 | 2017-03-29 | Jaguar Land Rover Ltd | Adaptive powertrain control for optimized performance |
| JP6216242B2 (en) * | 2013-12-13 | 2017-10-18 | 株式会社日立ハイテクノロジーズ | Anomaly detection method and apparatus |
| JP6223936B2 (en) * | 2014-09-12 | 2017-11-01 | 株式会社日立ハイテクノロジーズ | Abnormal trend detection method and system |
| JP6588814B2 (en) * | 2015-12-17 | 2019-10-09 | 株式会社東芝 | Abnormality diagnosis apparatus and method |
| CN106527413B (en) * | 2017-01-06 | 2020-06-05 | 国网福建省电力有限公司 | On-site fault diagnosis system |
-
2017
- 2017-10-27 US US15/795,823 patent/US10719772B2/en active Active
-
2018
- 2018-09-18 JP JP2018173473A patent/JP7174578B2/en active Active
- 2018-09-24 EP EP18196193.9A patent/EP3477410B1/en active Active
- 2018-10-15 CA CA3020861A patent/CA3020861C/en active Active
- 2018-10-26 CN CN201811256277.5A patent/CN109727336B/en active Active
-
2020
- 2020-06-15 US US16/901,714 patent/US11315027B2/en active Active
Patent Citations (7)
| Publication number | Priority date | Publication date | Assignee | Title |
|---|---|---|---|---|
| US20100241293A1 (en) * | 2006-08-04 | 2010-09-23 | Honeywell International Inc. | Tunable architecture for aircraft fault detection |
| GB2448351A (en) | 2007-04-12 | 2008-10-15 | Itacs Ltd | Method and apparatus for active system safety |
| US20090216393A1 (en) * | 2008-02-27 | 2009-08-27 | James Schimert | Data-driven anomaly detection to anticipate flight deck effects |
| US9116520B2 (en) * | 2011-07-26 | 2015-08-25 | Airbus Operations (Sas) | Automatic estimation process and device for a flight parameter vector in an aircraft, as well as detection methods and assemblies for a failure affecting such a vector |
| US20170106997A1 (en) * | 2012-12-18 | 2017-04-20 | Joseph Bekanich | Autonomous distressed aircraft tracking system |
| US20160340059A1 (en) * | 2014-01-20 | 2016-11-24 | Jean-Hugues PETTRE | Method for predicting an operational malfunction in the equipment of an aircraft or aircraft fleet |
| US10089203B2 (en) * | 2015-05-27 | 2018-10-02 | Tata Consultancy Services Limited | Artificial intelligence based health management of host system |
Non-Patent Citations (1)
| Title |
|---|
| European Search Report, European Application No. 18196193 dated Mar. 15, 2019. |
Cited By (4)
| Publication number | Priority date | Publication date | Assignee | Title |
|---|---|---|---|---|
| US11928971B2 (en) | 2021-04-01 | 2024-03-12 | Boeing Company | Detection of anomalous states in multivariate data |
| US11453511B1 (en) * | 2021-07-13 | 2022-09-27 | Beta Air, Llc | Systems and methods for data verification at start up |
| US20230015710A1 (en) * | 2021-07-13 | 2023-01-19 | Beta Air, Llc | Systems and methods for data verification at start up |
| US11897627B2 (en) * | 2021-07-13 | 2024-02-13 | Beta Air, Llc | Systems and methods for data verification at start up |
Also Published As
| Publication number | Publication date |
|---|---|
| JP2019089537A (en) | 2019-06-13 |
| US11315027B2 (en) | 2022-04-26 |
| EP3477410B1 (en) | 2021-06-23 |
| CA3020861A1 (en) | 2019-04-27 |
| CN109727336B (en) | 2022-04-22 |
| JP7174578B2 (en) | 2022-11-17 |
| CA3020861C (en) | 2023-09-19 |
| US20190130288A1 (en) | 2019-05-02 |
| EP3477410A1 (en) | 2019-05-01 |
| US20200311582A1 (en) | 2020-10-01 |
| CN109727336A (en) | 2019-05-07 |
Similar Documents
| Publication | Publication Date | Title |
|---|---|---|
| US11315027B2 (en) | Unsupervised multivariate relational fault detection system for a vehicle and method therefor | |
| US11594082B2 (en) | Vehicle fault detection system and method utilizing graphically converted temporal data | |
| US10891406B2 (en) | Prediction methods and systems for structural repair during heavy maintenance of aircraft | |
| US11080948B2 (en) | System and method for aircraft fault detection | |
| Lee et al. | Prognostics and health management design for rotary machinery systems—Reviews, methodology and applications | |
| US20170284896A1 (en) | System and method for unsupervised anomaly detection on industrial time-series data | |
| US20050209820A1 (en) | Diagnostic data detection and control | |
| US11518545B2 (en) | Supplemental cooling unit prediction system | |
| Mazzoleni et al. | Condition monitoring of electro-mechanical actuators for aerospace using batch change detection algorithms | |
| US10706361B1 (en) | Hybrid feature selection for performance prediction of fluid control valves | |
| Brown et al. | Characterization and prognosis of multirotor failures | |
| Jacobs et al. | Gas turbine engine condition monitoring using Gaussian mixture and hidden Markov models | |
| Baptista et al. | A comparison of data-driven techniques for engine bleed valve prognostics using aircraft-derived fault messages | |
| Müller et al. | Predicting failures in 747–8 aircraft hydraulic pump systems | |
| Romanova | Applying intelligent data analysis technologies for detecting damages to UAVs | |
| Babu et al. | Deep PHM: IoT-Based Deep Learning Approach on Prediction of Prognostics and Health Management of an Aircraft Engine | |
| Rognvaldsson et al. | A self-organized approach for unsupervised fault detection in multiple systems | |
| US20240132230A1 (en) | Systems, Methods, and Apparatus For Fault Diagnosis Of Systems | |
| Wigren | A Study on Condition-Based Maintenance with Applications to Industrial Vehicles | |
| Niu et al. | System Support and Logistics | |
| Maccarana | Health Monitoring of Electro-Mechanical Actuators for primary flight surfaces | |
| Rognvaldsson et al. | Halmstad University Post-Print | |
| Das et al. | Adaptive prognostic approaches combining regime identification with equipment operating history |
Legal Events
| Date | Code | Title | Description |
|---|---|---|---|
| AS | Assignment |
Owner name: THE BOEING COMPANY, ILLINOIS Free format text: ASSIGNMENT OF ASSIGNORS INTEREST;ASSIGNOR:BOGGIO, JOHN M.;REEL/FRAME:043970/0613 Effective date: 20171024 |
|
| FEPP | Fee payment procedure |
Free format text: ENTITY STATUS SET TO UNDISCOUNTED (ORIGINAL EVENT CODE: BIG.); ENTITY STATUS OF PATENT OWNER: LARGE ENTITY |
|
| STPP | Information on status: patent application and granting procedure in general |
Free format text: DOCKETED NEW CASE - READY FOR EXAMINATION |
|
| STPP | Information on status: patent application and granting procedure in general |
Free format text: NON FINAL ACTION MAILED |
|
| STPP | Information on status: patent application and granting procedure in general |
Free format text: RESPONSE TO NON-FINAL OFFICE ACTION ENTERED AND FORWARDED TO EXAMINER |
|
| STPP | Information on status: patent application and granting procedure in general |
Free format text: FINAL REJECTION MAILED |
|
| STPP | Information on status: patent application and granting procedure in general |
Free format text: NOTICE OF ALLOWANCE MAILED -- APPLICATION RECEIVED IN OFFICE OF PUBLICATIONS |
|
| STCF | Information on status: patent grant |
Free format text: PATENTED CASE |
|
| MAFP | Maintenance fee payment |
Free format text: PAYMENT OF MAINTENANCE FEE, 4TH YEAR, LARGE ENTITY (ORIGINAL EVENT CODE: M1551); ENTITY STATUS OF PATENT OWNER: LARGE ENTITY Year of fee payment: 4 |