WO2020136833A1 - 総蛋白質量測定装置及び総蛋白質量測定方法 - Google Patents
総蛋白質量測定装置及び総蛋白質量測定方法 Download PDFInfo
- Publication number
- WO2020136833A1 WO2020136833A1 PCT/JP2018/048266 JP2018048266W WO2020136833A1 WO 2020136833 A1 WO2020136833 A1 WO 2020136833A1 JP 2018048266 W JP2018048266 W JP 2018048266W WO 2020136833 A1 WO2020136833 A1 WO 2020136833A1
- Authority
- WO
- WIPO (PCT)
- Prior art keywords
- unit
- blood
- total protein
- light
- detection
- Prior art date
- Legal status (The legal status is an assumption and is not a legal conclusion. Google has not performed a legal analysis and makes no representation as to the accuracy of the status listed.)
- Ceased
Links
Images







Classifications
-
- G—PHYSICS
- G01—MEASURING; TESTING
- G01N—INVESTIGATING OR ANALYSING MATERIALS BY DETERMINING THEIR CHEMICAL OR PHYSICAL PROPERTIES
- G01N21/00—Investigating or analysing materials by the use of optical means, i.e. using sub-millimetre waves, infrared, visible or ultraviolet light
- G01N21/17—Systems in which incident light is modified in accordance with the properties of the material investigated
- G01N21/25—Colour; Spectral properties, i.e. comparison of effect of material on the light at two or more different wavelengths or wavelength bands
- G01N21/27—Colour; Spectral properties, i.e. comparison of effect of material on the light at two or more different wavelengths or wavelength bands using photo-electric detection ; circuits for computing concentration
-
- G—PHYSICS
- G01—MEASURING; TESTING
- G01N—INVESTIGATING OR ANALYSING MATERIALS BY DETERMINING THEIR CHEMICAL OR PHYSICAL PROPERTIES
- G01N21/00—Investigating or analysing materials by the use of optical means, i.e. using sub-millimetre waves, infrared, visible or ultraviolet light
- G01N21/17—Systems in which incident light is modified in accordance with the properties of the material investigated
- G01N21/47—Scattering, i.e. diffuse reflection
- G01N21/49—Scattering, i.e. diffuse reflection within a body or fluid
-
- G—PHYSICS
- G01—MEASURING; TESTING
- G01N—INVESTIGATING OR ANALYSING MATERIALS BY DETERMINING THEIR CHEMICAL OR PHYSICAL PROPERTIES
- G01N33/00—Investigating or analysing materials by specific methods not covered by groups G01N1/00 - G01N31/00
- G01N33/48—Biological material, e.g. blood, urine; Haemocytometers
- G01N33/483—Physical analysis of biological material
Definitions
- the present invention relates to a total protein mass measuring device and a total protein mass measuring method.
- Patent Document 1 discloses a device for irradiating blood with light and receiving scattered light scattered by blood to measure the concentration of red blood cells. This device separately detects scattered light scattered in a plurality of directions by blood, and measures the concentration of red blood cells by utilizing the characteristics of each scattered light. Further, Patent Document 2 discloses a device (blood information measuring device) for measuring the amount of total protein in a sample by the Biuret method.
- Patent No. 4451567 Japanese Patent Laid-Open No. 2004-258025
- the device of Patent Document 1 does not specify the amount of total protein.
- the blood information measuring device of Patent Document 2 uses the measuring method by the Biuret method, it is necessary to specify the amount of total protein after reacting serum or plasma extracted from blood with a reagent. Therefore, in the case of this blood information measuring device, a certain amount of time (time for reacting serum or plasma extracted from blood with a reagent) is required for measurement. Furthermore, in the case of this blood information measuring device, light having a wavelength of 400 nm to 750 nm is used as irradiation light, so that absorption, reflection, scattering, etc. of light by substances not contained in serum such as hemoglobin occur in whole blood. Conceivable. Therefore, in the case of this blood information measuring device, it is considered difficult to measure the absorbance of only proteins in whole blood.
- the problem to be solved by the present invention is to specify the amount of total protein contained in blood by using the detection results of the light reflected by the blood flowing through the channel and the light transmitted through the blood flowing through the channel.
- An example is to provide a total protein mass measuring device capable of performing the above.
- the invention according to claim 1 is An irradiation unit that irradiates light obliquely to the flow path for flowing blood, A first detection unit that detects the light that is irradiated by the irradiation unit and that is reflected by the blood flowing through the flow path; A second detection unit that detects light that is emitted by the irradiation unit and that has transmitted through blood flowing through the flow path; An identification unit that identifies the amount of total protein contained in blood using the detection results of the first detection unit and the second detection unit; It is a total protein mass measuring device provided with.
- FIG. 1 It is a schematic diagram of a total protein mass measuring device and a tube of a 1st embodiment. It is a figure (transverse cross section) for demonstrating the positional relationship of the irradiation part which comprises the total protein mass measuring apparatus of 1st Embodiment, a 1st detection part, a 2nd detection part, and a tube. It is a figure (perspective view) for demonstrating the positional relationship of the irradiation part and tube which comprise the total protein mass measuring apparatus of 1st Embodiment. It is a graph which shows the relationship between the side scattered light (detection amount) measured using the total protein mass measuring apparatus of 1st Embodiment, and total protein (g/dl).
- 7 is a table showing the relationship between the amount of total protein of each hematocrit value (each Ht value) and the corrected reflected light amount in the case of the first embodiment. It is the graph which made the table of 1st Embodiment into two dimensions. It is a graph at the time of removing Ht value ⁇ 25% from the table of 1st Embodiment.
- .. 7 is a graph showing iso-Ht lines obtained from the relationship between the corrected reflected light amount (vertical axis) and the forward scattered light whose logarithm is 2 (horizontal axis) in the total protein mass measurement apparatus of the second embodiment.
- .. 9 is a table showing the relationship between the amount of total protein at each hematocrit value (each Ht value) and the corrected reflected light amount in the case of the second embodiment. It is the graph which made the table of 2nd Embodiment into two dimensions. It is a graph at the time of removing Ht value ⁇ 25% from the table of 2nd Embodiment. It is a schematic diagram of a total protein mass measuring device and a tube of a 3rd embodiment.
- the total protein mass measuring apparatus 10 of the first embodiment (hereinafter referred to as the measuring apparatus 10) will be described with reference to FIGS. 1 to 8.
- the measuring apparatus 10 of this embodiment will be described with reference to FIGS. 1 to 8.
- the function and configuration of the measuring apparatus 10 of this embodiment will be described.
- the measuring operation of the measuring apparatus 10 of this embodiment will be described.
- the effect of this embodiment will be described.
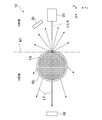
- FIG. 1 is a schematic diagram of a measuring device 10 and a tube TB (an example of a flow path) of this embodiment.
- the measuring device 10 of the present embodiment includes the light L1 reflected from the blood BL flowing in the tube TB and the light L2 transmitted through the blood BL flowing in the tube TB after the light L is irradiated from the oblique direction toward the tube TB. It has a function of specifying the amount of total protein contained in blood BL using the detection result.
- the “amount of protein” means the amount of total protein (g/dL) in 1 dL of serum (plasma).
- the measuring device 10 of the present embodiment includes an irradiation unit 20, a first detection unit 30, a second detection unit 40, and a control unit 50 (an example of a specifying unit).
- the tube TB is not a constituent element of the measuring apparatus 10 of this embodiment, but is a constituent element that is greatly related to the measuring apparatus 10.
- the tube TB is, for example, a tubular body having a perfect circular cross section (see FIGS. 1 to 3), and is formed of a transmissive material that transmits the light L emitted by the irradiation unit 20 described later.
- the tube TB is used as a flow path for flowing the blood BL, and the measurement operation by the measuring device 10 of the present embodiment described later causes the blood BL to flow in the tube TB from one end side to the other end side of the tube TB. It is supposed to be done in a flowing state.
- the irradiation unit 20 is, for example, a laser light source, and has a function of irradiating the blood BL flowing in the tube TB with the light L, as shown in FIG. 1.
- the irradiation unit 20 is arranged such that the light L emitted by the irradiation unit 20 has an optical axis LA in an oblique direction with respect to the tube TB, that is, the flowing direction (blood flow direction A) of the blood BL flowing through the tube TB.
- the angle ⁇ 1 is, for example, other than 90° (90° ⁇ 5°) and 45° (45° ⁇ 5°). It is an angle.
- the reason why the angle ⁇ 1 is set to such an angle is as follows. The reason why the angle ⁇ 1 is not close to 90° is to facilitate the arrangement of the first detection unit 30, and the reason that the angle ⁇ 1 is not close to 45° is to the first detection unit 30. This is to prevent (or make it difficult to enter) strong scattered light including
- the first detection unit 30 has a function of detecting the light L1 reflected by the blood BL flowing through the tube TB among the lights L emitted by the irradiation unit 20 (see FIG. 1). Specifically, the first detection unit 30 has a component (side scattering component) of the light L scattered by the red blood cells of the blood BL flowing in the tube TB, which is scattered in a direction different from the direction in which the irradiation unit 20 is located. ) Is detected. The first detection unit 30 outputs the detected detection signal to the control unit 50.
- the second detection unit 40 has a function of detecting the light L2 transmitted through the blood BL flowing through the tube TB among the light L emitted by the irradiation unit 20 (see FIG. 1). Specifically, the second detection unit 40 is configured to detect, of the light L scattered by the red blood cells of the blood BL flowing through the tube TB, the component that has passed through the blood BL (forward scattered component). The second detection unit 40 outputs the detected detection signal to the control unit 50.
- FIG. 2 is a cross-sectional view for explaining the positional relationship between the irradiation unit 20, the first detection unit 30, the second detection unit 40, and the tube TB.
- FIG. 3 is a perspective view for explaining the positional relationship between the irradiation unit 20 and the tube TB. The two-dot chain line in FIG.
- FIG. 2 indicates an imaginary line M1 that includes the irradiation position (irradiation point) of the light L from the irradiation unit 20 on the tube TB and is perpendicular to the optical axis LA.
- Two regions divided by the virtual line M1 are referred to as an A region and a B region, respectively.
- the irradiation unit 20 is arranged in the B region
- the first detection unit 30 is arranged in the B region
- the second detection unit 40 is arranged in the A region.
- the first detection unit 30 is configured to detect the light L1 reflected by the blood BL flowing through the tube TB in the light L emitted by the irradiation unit 20 (see FIG. 1). Then, as shown in FIGS. 2 and 3, the first detection unit 30 is arranged in the region B, so that the first detection unit 30 is arranged at a position where the light L1 reflected by the blood BL can be detected. It can be said that it has been done.
- the first detection unit 30 is for detecting the side scattered component of the reflected light L1 as described above. Therefore, the first detection unit 30 is arranged in the region B in FIGS. 2 and 3 and downstream of the irradiation unit 20 in the blood flow direction A (see FIG. 1 ).
- the second detection unit 40 is configured to detect the light L2 transmitted through the blood BL flowing through the tube TB among the light L emitted by the irradiation unit 20 (see FIG. 1). Then, as shown in FIGS. 2 and 3, since the second detection unit 40 is arranged in the area A, the second detection unit 40 is arranged at a position where the light L2 transmitted through the blood BL can be detected. Can be said.
- the virtual plane M2 surrounded by the chain double-dashed line in FIG. 3 means the surface formed by the virtual line M1 in FIG.
- the control unit 50 has a function of controlling the irradiation unit 20, the first detection unit 30, and the second detection unit 40.
- the control unit 50 detects the detection signals output by the first detection unit 30 and the second detection unit 40 during the measurement operation described below, that is, the detection of the first detection unit 30 and the second detection unit 40. It has a function of specifying the amount of total protein contained in blood BL using the result.
- the specific function of the control unit 50 of this embodiment will be described in the description of the measurement operation of this embodiment described later.
- the control unit 50 causes the irradiation unit 20, the first detection unit 30, and the second detection unit 40 to operate.
- the irradiation unit 20 irradiates the blood BL flowing through the tube TB with the light L (see FIG. 1 ).
- a part (light L1) of the light L with which the blood BL is irradiated is reflected by the blood BL and detected by the first detection unit 30. That is, the first detection unit 30 detects the side scattered component of the light L emitted by the irradiation unit 20 and scattered by the blood BL. Then, the first detection unit 30 outputs the detected detection signal to the control unit 50.
- the remaining part of the light (light L2) applied to blood BL passes through blood BL and is detected by second detector 40. That is, the second detection unit 40 detects the forward scattering component of the light L emitted by the irradiation unit 20 and scattered by the blood BL. Then, the second detection unit 40 outputs the detected detection signal to the control unit 50.
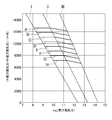
- the control unit 50 to which the detection signals output from the first detection unit 30 and the second detection unit 40 are input is included in the blood BL using the graph shown in FIG. 7 or the graph shown in FIG. Identify the amount of total protein.
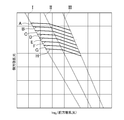
- the graph of FIG. 7 is a two-dimensional graph of a table (data) showing the relationship between the detection results of the first detection unit 30 and the second detection unit 40 and the amount of total protein contained in the blood BL. ..
- the graph of FIG. 7 includes the above detection results, that is, the output of the forward scattering component that is the detection result of the second detection unit 40 and the output of the side scattering component that is the detection result of the first detection unit 30. It is composed of a plurality of polygonal lines A to H.
- the control unit 50 uses the detection results of the first detection unit 30 and the second detection unit 40 and the graph (table) of FIG. 7 to identify the amount of total protein contained in the blood BL.
- the graph of FIG. 8 is a graph when the portion where the hematocrit value (Ht value) is less than 25% is removed from the graph of FIG. 7.
- the tables represented by the graphs of FIGS. 7 and 8 are stored as data in a storage device (not shown) included in the control unit 50.
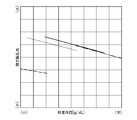
- FIG. 4 is a graph showing the relationship between (the amount of detection) of side scattered light measured using the measuring device 10 of the present embodiment and the amount of total protein (g/dl), which is plotted for each Ht value. It is four approximation lines for each Ht value of the value. From the graph of FIG. 4, it is assumed by the inventors of the present application that each approximation line has a constant slope (that is, if the total protein and the side scattered light have a linear function relationship). ), a predetermined total protein amount and side scattered light have a corresponding relationship. In other words, the inventors of the present application have derived that, when the amount of total protein contained in blood BL is a predetermined amount, the side scattered light is detected with a predetermined detection amount.
- the inventors of the present application have derived that when the side scattered light is detected in a predetermined detection amount, the amount of total protein contained in blood BL is detected in a predetermined amount.
- the horizontal axis in the graph of FIG. 4 is the logarithmic value of the total protein (g/dl) with 2 as the base.
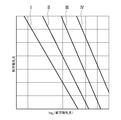
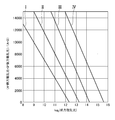
- the graph of FIG. 5 is a graph of a calibration curve (equal Ht line) of the hematocrit value (Ht value) measured using the measuring device 10 of this embodiment.
- Lines I, II, III and IV in FIG. 5 are for Ht values of 55%, 40%, 25% and 10%, respectively.
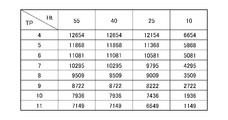
- the table of FIG. 6 is a table showing the relationship of the corrected side scattered light (reflected light) corresponding to the amount (TP) of total protein at each hematocrit value (each Ht value).
- the table of FIG. 6 is derived from the results of FIG.
- each parameter of (Formula 1) is as follows.
- Y ref Intersection of the calibration curve of reference total protein Y dif : Y value when total protein increases by 1 Difference
- the graph of FIG. 7 is a polygonal line AH formed by plotting the values of the corrected side scattered light (reflected light) in the table of FIG. 6 on the graph of FIG. 5 and connecting the points with a line for each total protein. .. Lines A to H show calibration curves for each total protein. Then, in the measurement operation of the present embodiment, the control unit 50, to which the detection signals output from the first detection unit 30 and the second detection unit 40 are input, specifies the amount of total protein based on the above mechanism.
- the above is a description of the specific mechanism of the amount of total protein in the measurement operation.
- the above is the description of the measurement operation of the present embodiment.
- the measurement apparatus 10 of the present embodiment uses the detection results of the light L1 reflected by the blood BL flowing in the tube TB and the light L2 transmitted through the blood BL flowing in the tube TB.
- the amount of total protein contained in blood BL can be specified.
- the measurement apparatus 10 of the present embodiment uses the detection results of the first detection unit 30 and the second detection unit 40 and the data prepared in advance (the table that is the basis of the graph of FIG. 7 or 8). Thus, the amount of total protein contained in blood BL can be specified.
- the graph of FIG. 8 is a graph obtained by removing the portion where the hematocrit value (Ht value) is less than 25% from the graph of FIG. 7.
- An Ht value of less than 25% is a rare value in the case of human blood BL. Therefore, when the test target of the measuring apparatus 10 of the present embodiment is human blood BL, the graph of FIG. 8 (the table that is the basis of the graph of FIG. 8) may be used. In this case, that is, when the graph of FIG. 8 is used, it can be said that it is advantageous in that the calculation for specifying the amount of total protein is easier than when the graph of FIG. 7 is used. Further, from FIGS.
- FIG. 9 is a schematic diagram of the measuring device 10A and the tube TB (an example of a flow path) of the present embodiment.
- the measurement apparatus 10A of the present embodiment further includes a third detection unit 60 in addition to the configuration of the measurement apparatus 10 of the first embodiment.
- the 3rd detection part 60 is arrange
- the third detection unit 60 detects the component (backscattering component) scattered in the direction in which the irradiation unit 20 is located, of the light L scattered by the red blood cells of the blood BL flowing through the tube TB. It has become.
- the direction in which the irradiation unit 20 is located is closer to the irradiation unit 20 than the one-dot chain line B (a virtual straight line B drawn from the intersection of the optical axis LA and the center of the tube TB in the radial direction) in FIG. 9. means.
- the third detection unit 60 outputs the detected detection signal to the control unit 50.
- control unit 50 of the present embodiment uses the detection results of the first detection unit 30, the second detection unit 40, and the third detection unit 60 to specify the amount of total protein contained in the blood BL. ing.
- the above is the description of the function and configuration of the measuring apparatus 10A of the present embodiment.
- the control unit 50 uses the detection outputs of the first detection unit 30, the second detection unit 40, and the third detection unit 60 and the graph shown in FIG. 13 or the graph shown in FIG.
- the amount of total protein contained in blood BL is specified.
- the table showing the relationship between the detection results of the first detection unit 30, the second detection unit 40, and the third detection unit 60 and the amount of total protein contained in blood BL is two-dimensionalized. It is a graph.
- the graph of FIG. 13 shows the output of the forward scattering component, which is the detection result of the second detection unit 40, and the output of the side scattering component, which is the detection result of the first detection unit 30, which are the detection results.
- FIG. 14 is a graph in the case where the portion where the hematocrit value (Ht value) is less than 25% is removed from the graph of FIG. 13. Note that the tables represented by the graphs of FIGS. 13 and 14 are stored as data in a storage device (not shown) included in the control unit 50.
- FIG. 10 shows specific values and total protein amounts (g/dl) obtained from the side scattered light (detection amount) and the back scattered light (detection amount) measured using the measuring apparatus 10A of the present embodiment.
- FIG. 4 is a graph showing the relationship of the above, and is four approximation lines for each Ht value of the values plotted for each Ht value. From the graph of FIG. 10, the inventors of the present application assume that each approximation line has a constant slope (that is, assuming that the total protein and the specific value have a linear function relationship). It has been deduced that the amount of a given total protein and a specific value have a corresponding relationship.
- the inventors of the present application have derived that a predetermined specific value can be obtained when the amount of total protein contained in blood BL is a predetermined amount.
- the inventors of the present application detect that the amount of total protein contained in blood BL is a predetermined amount.
- the horizontal axis in the graph of FIG. 10 is the logarithmic value of the total protein (g/dl) whose base is 2.
- the graph of FIG. 11 is a graph of a calibration curve (equal Ht line) of the hematocrit value (Ht value) measured using the measuring device 10A of this embodiment.
- Lines I, II, III and IV in FIG. 11 are for Ht values of 55%, 40%, 25% and 10%, respectively.
- the table of FIG. 12 is a table showing the relationship of the corrected side scattered light (reflected light) corresponding to the amount (TP) of total protein at each hematocrit value (each Ht value).
- the table of FIG. 12 is derived from the results of FIG.
- each parameter is as follows.
- X log2 obtained by measurement (detection output of the second detection unit 40)
- Y Ax (detection output of the first detection unit 30 obtained by measurement)+Bx (detection output of the third detection unit 60 obtained by measurement)
- B coefficient to be multiplied
- slope of detection amount TP ref reference total protein
- Y ref intercept of standard curve of standard total protein
- Y dif difference in Y value when total protein increases by 1
- the graph of FIG. 13 is a polygonal line A to H formed by plotting the values of the corrected side scattered light (reflected light) in the table of FIG. 12 on the graph of FIG. 11 and connecting the points with a line for each total protein. .. Lines A to H show calibration curves for each total protein. Then, in the measurement operation of the present embodiment, the control unit 50 to which the detection signals output from the first detection unit 30, the second detection unit 40, and the third detection unit 60 are input, based on the above mechanism, Specify the amount.
- the measurement device 10 of the present embodiment shows the detection results of the lights L1 and L3 reflected by the blood BL flowing in the tube TB and the light L2 transmitted through the blood BL flowing in the tube TB. It can be used to identify the amount of total protein contained in blood BL. Further, the measuring apparatus 10 of the present embodiment detects the detection results of the first detection unit 30, the second detection unit 40, and the third detection unit 60, and the data prepared in advance (which is the basis of the graph of FIG. 13 or FIG. 14). Table) can be used to specify the amount of total protein contained in blood BL. The effect of the graph of FIG. 14 on the graph of FIG. 13 is the same as that of the graph of FIG. 8 on the graph of FIG. 7 in the first embodiment.
- the plurality of broken lines A to H are flat between the line I and the line II, and in the case of the first embodiment (FIGS. 7 and 8). Different). Therefore, in the case of the present embodiment, it can be said that the amount of total protein can be specified with high accuracy in that the process required for specifying the amount of total protein can be simplified compared to the first embodiment.
- measuring device 10B a total protein mass measuring device 10B of the third embodiment (hereinafter, referred to as measuring device 10B, see FIG. 15) will be described.
- measuring device 10B see FIG. 15
- FIG. 15 a total protein mass measuring device 10B of the third embodiment
- the same constituent elements as those of the first and second embodiments are used in this embodiment, the same reference numerals as those of the constituent elements of the first and second embodiments are used.
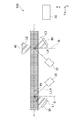
- FIG. 15 is a schematic view of the measuring device 10B and the tube TB of this embodiment.
- the measuring apparatus 10B of the present embodiment has the following configuration as compared with the measuring apparatus 10A of the second embodiment. That is, the second detection unit 40 and the third detection unit 60 are arranged at positions upstream of the irradiation unit 20 (an example of the first irradiation unit) and the first detection unit 30 in the blood flow direction A. Further, in the case of the present embodiment, the light that is the source of the lights L2 and L3 detected by the second detection unit 40 and the third detection unit 60 is the newly provided irradiation unit 22 (an example of the second irradiation unit). The light LB is emitted by.
- the irradiating unit 22 irradiates the tube TB with the light LB from an oblique direction at an incident position different from the incident position of the light L emitted by the irradiating unit 20 in the tube TB.
- the irradiation unit 20 and the irradiation unit 22 are, for example, different in the wavelengths of the lights L and LB that they irradiate.
- the irradiation unit 20 emits light having a wavelength of 822 nm
- the irradiation unit 22 emits light having a wavelength of 795 nm.
- the measuring apparatus 10B of this embodiment has the same effects as the effects of the second embodiment.
- the first detection unit 30 and the third detection unit 60 detect the lights L1 and L3 scattered at different positions.
- the wavelength of the light L that is the source of the light L1 detected by the first detection unit 30 and the wavelength of the light LB that is the source of the light L3 detected by the third detection unit 60 are different. Therefore, in the case of the present embodiment, unlike the case of the second embodiment, it is possible to measure the enzyme saturation of the blood BL, and there is an effect that is not provided in the case of the second embodiment.
- the present embodiment it is also possible to correct scattering and absorption due to a change in the volume of red blood cells due to a difference in enzyme saturation. Further, in the case of the present embodiment, since the enzyme saturation can be measured, the influence of scattering due to the enzyme saturation can be eliminated (or made less susceptible) when measuring a blood component. Furthermore, in the case of the present embodiment, it is possible to measure the blood component in whole blood having a flow velocity, and it is possible to obtain the measurement result in real time (measurement result that changes with time).
- the present invention has been described by taking the first to third embodiments as an example, but the present invention is not limited to these embodiments.
- the technical scope of the present invention includes, for example, the following forms (modifications).
- the tube TB is, as an example, a tubular body having a perfect circular cross section (see FIGS. 1 to 3, etc.).
- the shape of the tube TB does not have to be a cylindrical body whose cross section is a perfect circle.
- a surface may be formed at the light irradiation position.
- the irradiation units 20 and 22 have been described as being laser light sources. However, for example, an LED light source may be used instead of the laser light source.
- control unit 50 uses the table to specify the amount of total protein
- the table is based on the concept of multiplying the detection results of the detection units 30, 40 and 60 by a predetermined coefficient. You may change. That is, it may be data.
- the irradiation unit 20 emits light having a wavelength of 822 nm
- the irradiation unit 22 emits light having a wavelength of 795 nm, but light having a different wavelength may be used.
- one of the wavelengths of the light emitted by the irradiation units 20 and 22 may be red light and the other wavelength may be infrared light.
- the irradiation unit 20 and the irradiation unit 22 have different wavelengths of the light L and LB emitted by the irradiation unit 20 as an example, but the wavelengths may be the same.
- the second detection unit 40 is moved upstream of the first detection unit 30 in the blood flow direction A based on the second embodiment, but the second detection unit 40 is moved. You don't have to.
Landscapes
- Physics & Mathematics (AREA)
- Health & Medical Sciences (AREA)
- Life Sciences & Earth Sciences (AREA)
- Chemical & Material Sciences (AREA)
- Engineering & Computer Science (AREA)
- Biochemistry (AREA)
- General Health & Medical Sciences (AREA)
- General Physics & Mathematics (AREA)
- Immunology (AREA)
- Pathology (AREA)
- Analytical Chemistry (AREA)
- Biomedical Technology (AREA)
- Molecular Biology (AREA)
- Hematology (AREA)
- Biophysics (AREA)
- Urology & Nephrology (AREA)
- Food Science & Technology (AREA)
- Medicinal Chemistry (AREA)
- Mathematical Physics (AREA)
- Theoretical Computer Science (AREA)
- Spectroscopy & Molecular Physics (AREA)
- Investigating Or Analysing Materials By Optical Means (AREA)
- Investigating Or Analysing Biological Materials (AREA)
Abstract
本発明の総蛋白質量測定装置(10)は、血液(BL)を流すための流路(TB)に対し斜め方向から光(L)を照射する照射部(20)と、照射部(20)が照射し流路(TB)を流れる血液(BL)に反射された光(L1)を検出する第1検出部(30)と、照射部(20)が照射し流路(TB)を流れる血液(BL)を透過した光(L2)を検出する第2検出部(40)と、第1検出部(30)及び第2検出部(40)の検出結果を用いて血液(BL)に含まれる総蛋白質の量を特定する特定部(50)と、を備える。
Description
本発明は、総蛋白質量測定装置及び総蛋白質量測定方法に関する。
特許文献1には、血液に光を照射するとともに血液により散乱された散乱光を受光して、赤血球の濃度を計測する装置が開示されている。この装置は、血液により複数の方向に散乱された散乱光を別々に検出することで、それぞれの散乱光の特性を利用して赤血球の濃度を計測している。
また、特許文献2には、ビウレット法により試料中の総蛋白質の量を測定する装置(血液情報測定装置)が開示されている。
また、特許文献2には、ビウレット法により試料中の総蛋白質の量を測定する装置(血液情報測定装置)が開示されている。
ところで、特許文献1の装置は、総蛋白質の量を特定するものではない。
また、特許文献2の血液情報測定装置は、ビウレット法による測定方法を用いるものであるから、血液から取り出した血清又は血漿を試薬と反応させてから総蛋白質の量を特定する必要がある。そのため、この血液情報測定装置の場合、測定にある程度の時間(血液から取り出した血清又は血漿を試薬と反応させるための時間)を必要とする。さらに、この血液情報測定装置の場合、400nm~750nmの波長の光を照射光として用いているため、全血においてヘモグロビン等の血清中に含有されない物質による光の吸収、反射、散乱等が生じると考えられる。そのため、この血液情報測定装置の場合、全血中の蛋白質のみの吸光度を測定することは困難と考えられる。
また、特許文献2の血液情報測定装置は、ビウレット法による測定方法を用いるものであるから、血液から取り出した血清又は血漿を試薬と反応させてから総蛋白質の量を特定する必要がある。そのため、この血液情報測定装置の場合、測定にある程度の時間(血液から取り出した血清又は血漿を試薬と反応させるための時間)を必要とする。さらに、この血液情報測定装置の場合、400nm~750nmの波長の光を照射光として用いているため、全血においてヘモグロビン等の血清中に含有されない物質による光の吸収、反射、散乱等が生じると考えられる。そのため、この血液情報測定装置の場合、全血中の蛋白質のみの吸光度を測定することは困難と考えられる。
本発明が解決しようとする課題としては、流路を流れる血液に反射された光及び流路を流れる血液を透過した光の検出結果を用いて、血液に含まれる総蛋白質の量を特定することができる総蛋白質量測定装置を提供することが一例として挙げられる。
請求項1に記載の発明は、
血液を流すための流路に対し斜め方向から光を照射する照射部と、
前記照射部が照射し前記流路を流れる血液に反射された光を検出する第1検出部と、
前記照射部が照射し前記流路を流れる血液を透過した光を検出する第2検出部と、
前記第1検出部及び前記第2検出部の検出結果を用いて血液に含まれる総蛋白質の量を特定する特定部と、
を備える総蛋白質量測定装置である。
血液を流すための流路に対し斜め方向から光を照射する照射部と、
前記照射部が照射し前記流路を流れる血液に反射された光を検出する第1検出部と、
前記照射部が照射し前記流路を流れる血液を透過した光を検出する第2検出部と、
前記第1検出部及び前記第2検出部の検出結果を用いて血液に含まれる総蛋白質の量を特定する特定部と、
を備える総蛋白質量測定装置である。
上述した目的及びその他の目的、特徴並びに利点は、以下に述べる好適な実施の形態及びそれに付随する以下の図面によって更に明らかになる。
≪概要≫
以下、本実施形態(本発明の一例)について第1~第3実施形態に分けて、これらの記載順で図面を参照しながら説明する。なお、本明細書において参照するすべての図面では同様の機能を有する構成要素に同様の符号を付し、適宜説明を省略する。
以下、本実施形態(本発明の一例)について第1~第3実施形態に分けて、これらの記載順で図面を参照しながら説明する。なお、本明細書において参照するすべての図面では同様の機能を有する構成要素に同様の符号を付し、適宜説明を省略する。
≪第1実施形態≫
以下、第1実施形態の総蛋白質量測定装置10(以下、測定装置10という。)について図1~図8を参照しながら説明する。まず、本実施形態の測定装置10の機能及び構成について説明する。次いで、本実施形態の測定装置10の測定動作について説明する。次いで、本実施形態の効果について説明する。
以下、第1実施形態の総蛋白質量測定装置10(以下、測定装置10という。)について図1~図8を参照しながら説明する。まず、本実施形態の測定装置10の機能及び構成について説明する。次いで、本実施形態の測定装置10の測定動作について説明する。次いで、本実施形態の効果について説明する。
<第1実施形態の機能及び構成>
図1は、本実施形態の測定装置10及びチューブTB(流路の一例)の概略図である。本実施形態の測定装置10は、チューブTBに向けて斜め方向から光Lが照射された後に、チューブTBを流れる血液BLに反射された光L1及びチューブTBを流れる血液BLを透過した光L2の検出結果を用いて、血液BLに含まれる総蛋白質の量を特定する機能を有する。ここで、本明細書では、「蛋白質の量」とは、血清(血漿)1dL中の総蛋白質の量(g/dL)を意味する。
本実施形態の測定装置10は、照射部20と、第1検出部30と、第2検出部40と、制御部50(特定部の一例)とを備えている。
なお、チューブTBは、本実施形態の測定装置10の構成要素ではないが測定装置10と大きく関わる構成要素である。チューブTBは、一例として、横断面が真円の筒状体とされ(図1~図3参照)、後述する照射部20が照射する光Lを透過させる透過材で形成されている。そして、チューブTBは血液BLを流すための流路とされており、後述する本実施形態の測定装置10による測定動作はチューブTB内にチューブTBの一端側から他端側に向けて血液BLを流した状態で行われるようになっている。
図1は、本実施形態の測定装置10及びチューブTB(流路の一例)の概略図である。本実施形態の測定装置10は、チューブTBに向けて斜め方向から光Lが照射された後に、チューブTBを流れる血液BLに反射された光L1及びチューブTBを流れる血液BLを透過した光L2の検出結果を用いて、血液BLに含まれる総蛋白質の量を特定する機能を有する。ここで、本明細書では、「蛋白質の量」とは、血清(血漿)1dL中の総蛋白質の量(g/dL)を意味する。
本実施形態の測定装置10は、照射部20と、第1検出部30と、第2検出部40と、制御部50(特定部の一例)とを備えている。
なお、チューブTBは、本実施形態の測定装置10の構成要素ではないが測定装置10と大きく関わる構成要素である。チューブTBは、一例として、横断面が真円の筒状体とされ(図1~図3参照)、後述する照射部20が照射する光Lを透過させる透過材で形成されている。そして、チューブTBは血液BLを流すための流路とされており、後述する本実施形態の測定装置10による測定動作はチューブTB内にチューブTBの一端側から他端側に向けて血液BLを流した状態で行われるようになっている。
〔照射部〕
照射部20は、一例としてレーザー光源とされ、図1に示されるように、チューブTB内を流れる血液BLに対して光Lを照射する機能を有する。照射部20は、自身が出射する光LがチューブTB、すなわち、チューブTBを流れる血液BLの流れる方向(血流方向A)に対して斜め方向に光軸LAを有するように配置されている。ここで、本実施形態では、チューブTBに対する光軸LAの角度を角度θ1とすると、角度θ1は一例として90°近傍(90°±5°)及び45°近傍(45°±5°)以外の角度とされている。なお、角度θ1をこのような角度にする理由は以下のとおりである。角度θ1が90°近傍となることを避ける理由は第1検出部30の配置を容易とするためであり、角度θ1が45°近傍となることを避ける理由は第1検出部30に後方散乱成分を含む強い散乱光が入射してしまうことを防止するため(又は入射し難くするため)である。
照射部20は、一例としてレーザー光源とされ、図1に示されるように、チューブTB内を流れる血液BLに対して光Lを照射する機能を有する。照射部20は、自身が出射する光LがチューブTB、すなわち、チューブTBを流れる血液BLの流れる方向(血流方向A)に対して斜め方向に光軸LAを有するように配置されている。ここで、本実施形態では、チューブTBに対する光軸LAの角度を角度θ1とすると、角度θ1は一例として90°近傍(90°±5°)及び45°近傍(45°±5°)以外の角度とされている。なお、角度θ1をこのような角度にする理由は以下のとおりである。角度θ1が90°近傍となることを避ける理由は第1検出部30の配置を容易とするためであり、角度θ1が45°近傍となることを避ける理由は第1検出部30に後方散乱成分を含む強い散乱光が入射してしまうことを防止するため(又は入射し難くするため)である。
〔第1検出部〕
第1検出部30は、照射部20が照射した光LのうちチューブTBを流れる血液BLに反射された光L1を検出する機能を有する(図1参照)。具体的には、第1検出部30は、チューブTBを流れる血液BLの赤血球で散乱された光Lのうち、照射部20が位置する方向とは異なる方向に散乱された成分(側方散乱成分)を検出するようになっている。
なお、第1検出部30は、検出した検出信号を制御部50に出力するようになっている。
第1検出部30は、照射部20が照射した光LのうちチューブTBを流れる血液BLに反射された光L1を検出する機能を有する(図1参照)。具体的には、第1検出部30は、チューブTBを流れる血液BLの赤血球で散乱された光Lのうち、照射部20が位置する方向とは異なる方向に散乱された成分(側方散乱成分)を検出するようになっている。
なお、第1検出部30は、検出した検出信号を制御部50に出力するようになっている。
〔第2検出部〕
第2検出部40は、照射部20が照射した光LのうちチューブTBを流れる血液BLを透過した光L2を検出する機能を有する(図1参照)。具体的には、第2検出部40は、チューブTBを流れる血液BLの赤血球で散乱された光Lのうち、血液BLを透過した成分(前方散乱成分)を検出するようになっている。
なお、第2検出部40は、検出した検出信号を制御部50に出力するようになっている。
第2検出部40は、照射部20が照射した光LのうちチューブTBを流れる血液BLを透過した光L2を検出する機能を有する(図1参照)。具体的には、第2検出部40は、チューブTBを流れる血液BLの赤血球で散乱された光Lのうち、血液BLを透過した成分(前方散乱成分)を検出するようになっている。
なお、第2検出部40は、検出した検出信号を制御部50に出力するようになっている。
〔照射部、第1検出部及び第2検出部の位置関係〕
次に、照射部20、第1検出部30及び第2検出部40の位置関係について、図1~図3を参照しながら説明する。ここで、図2は、照射部20、第1検出部30及び第2検出部40と、チューブTBとの位置関係を説明するための横断面図である。図3は、照射部20と、チューブTBとの位置関係を説明するための斜視図である。
図2における2点鎖線は、チューブTBにおける照射部20からの光Lの照射位置(照射点)を含み、かつ、光軸LAに垂直な仮想線M1を示す。仮想線M1により分けられる2つの領域を、それぞれA領域及びB領域とする。ここで、照射部20がB領域に配置されているとすると、第1検出部30はB領域に配置され、第2検出部40はA領域に配置される。
次に、照射部20、第1検出部30及び第2検出部40の位置関係について、図1~図3を参照しながら説明する。ここで、図2は、照射部20、第1検出部30及び第2検出部40と、チューブTBとの位置関係を説明するための横断面図である。図3は、照射部20と、チューブTBとの位置関係を説明するための斜視図である。
図2における2点鎖線は、チューブTBにおける照射部20からの光Lの照射位置(照射点)を含み、かつ、光軸LAに垂直な仮想線M1を示す。仮想線M1により分けられる2つの領域を、それぞれA領域及びB領域とする。ここで、照射部20がB領域に配置されているとすると、第1検出部30はB領域に配置され、第2検出部40はA領域に配置される。
前述のとおり、第1検出部30は、照射部20が照射した光LのうちチューブTBを流れる血液BLに反射された光L1を検出するようになっている(図1参照)。そして、図2及び図3に示されるように、第1検出部30がB領域に配置されていることで、第1検出部30は血液BLに反射された光L1を検出可能な位置に配置されているといえる。なお、第1検出部30は、前述のとおり、反射された光L1のうち側方散乱成分を検出するためのものである。そのため、第1検出部30は、図2及び図3におけるB領域であって、照射部20よりも血流方向Aの下流側に配置される(図1参照)。
また、前述のとおり、第2検出部40は、照射部20が照射した光LのうちチューブTBを流れる血液BLを透過した光L2を検出するようになっている(図1参照)。そして、図2及び図3に示されるように、第2検出部40がA領域に配置されていることで、第2検出部40は血液BLを透過した光L2を検出可能な位置に配置されているといえる。
なお、図3における2点鎖線で囲まれた仮想平面M2は、図2の仮想線M1により形成される面を意味する。
また、前述のとおり、第2検出部40は、照射部20が照射した光LのうちチューブTBを流れる血液BLを透過した光L2を検出するようになっている(図1参照)。そして、図2及び図3に示されるように、第2検出部40がA領域に配置されていることで、第2検出部40は血液BLを透過した光L2を検出可能な位置に配置されているといえる。
なお、図3における2点鎖線で囲まれた仮想平面M2は、図2の仮想線M1により形成される面を意味する。
〔制御部〕
次に、本実施形態の制御部50について説明する。制御部50は、照射部20、第1検出部30及び第2検出部40を制御する機能を有する。また、制御部50は、後述する測定動作時に、第1検出部30及び第2検出部40がそれぞれ検出して出力する検出信号から、すなわち、第1検出部30及び第2検出部40の検出結果を用いて血液BLに含まれる総蛋白質の量を特定する機能を有する。
なお、本実施形態の制御部50の具体的な機能については、後述する本実施形態の測定動作の説明の中で説明する。
次に、本実施形態の制御部50について説明する。制御部50は、照射部20、第1検出部30及び第2検出部40を制御する機能を有する。また、制御部50は、後述する測定動作時に、第1検出部30及び第2検出部40がそれぞれ検出して出力する検出信号から、すなわち、第1検出部30及び第2検出部40の検出結果を用いて血液BLに含まれる総蛋白質の量を特定する機能を有する。
なお、本実施形態の制御部50の具体的な機能については、後述する本実施形態の測定動作の説明の中で説明する。
以上が、本実施形態の測定装置10についての説明である。
<第1実施形態の測定動作>
次に、第1実施形態の測定装置10を用いた測定動作について、主に図4~図8を参照しながら説明する。以下、まず測定動作の概要について説明し、次いで測定動作における総蛋白質の量の特定のメカニズムについて説明する。
次に、第1実施形態の測定装置10を用いた測定動作について、主に図4~図8を参照しながら説明する。以下、まず測定動作の概要について説明し、次いで測定動作における総蛋白質の量の特定のメカニズムについて説明する。
〔測定動作の概要〕
まず、測定者が測定装置10の測定開始スイッチ(図示省略)をオンにすると、制御部50による制御が開始される。これ伴い、制御部50は、チューブTBに取り付けられているチューブポンプ(図示省略)を作動させて血液BLをチューブTBに流す。
まず、測定者が測定装置10の測定開始スイッチ(図示省略)をオンにすると、制御部50による制御が開始される。これ伴い、制御部50は、チューブTBに取り付けられているチューブポンプ(図示省略)を作動させて血液BLをチューブTBに流す。
次いで、制御部50は、制御部50は、照射部20、第1検出部30及び第2検出部40を作動させる。これに伴い、照射部20は、チューブTBを流れる血液BLに向けて光Lを照射する(図1参照)。血液BLに照射された光Lの一部(光L1)は、血液BLにより反射されて第1検出部30により検出される。すなわち、第1検出部30は、照射部20が照射して血液BLに散乱された光Lのうち側方散乱成分を検出する。そして、第1検出部30は、検出した検出信号を制御部50に出力する。
また、血液BLに照射された光の残りの一部(光L2)は、血液BLを透過して第2検出部40に検出される。すなわち、第2検出部40は、照射部20が照射して血液BLに散乱された光Lのうち前方散乱成分を検出する。そして、第2検出部40は、検出した検出信号を制御部50に出力する。
また、血液BLに照射された光の残りの一部(光L2)は、血液BLを透過して第2検出部40に検出される。すなわち、第2検出部40は、照射部20が照射して血液BLに散乱された光Lのうち前方散乱成分を検出する。そして、第2検出部40は、検出した検出信号を制御部50に出力する。
そして、第1検出部30及び第2検出部40がそれぞれ出力した検出信号が入力された制御部50は、図7に示されるグラフ又は図8に示されるグラフを用いて、血液BLに含まれる総蛋白質の量を特定する。
ここで、図7のグラフは、第1検出部30及び第2検出部40の検出結果と血液BLに含まれる総蛋白質の量との関係を示すテーブル(データ)を2次元化したグラフである。図7のグラフは、上記検出結果、すなわち、と第2検出部40の検出結果である前方散乱成分についての出力と、第1検出部30の検出結果である側方散乱成分についての出力で構成される複数の折れ線A~Hで構成されている。このグラフでは、各折れ線(折れ線A~H)上の総蛋白質の量は各折れ線で同じとされる。すなわち、制御部50は、第1検出部30及び第2検出部40の検出結果と、図7のグラフ(テーブル)とを用いて、血液BLに含まれる総蛋白質の量を特定する。図8のグラフは、図7のグラフからヘマトクリット値(Ht値)が25%未満である部分を除いた場合のグラフである。
なお、図7及び図8のグラフで表されるテーブルは、データとして制御部50が有する記憶装置(図示省略)に記憶されている。
ここで、図7のグラフは、第1検出部30及び第2検出部40の検出結果と血液BLに含まれる総蛋白質の量との関係を示すテーブル(データ)を2次元化したグラフである。図7のグラフは、上記検出結果、すなわち、と第2検出部40の検出結果である前方散乱成分についての出力と、第1検出部30の検出結果である側方散乱成分についての出力で構成される複数の折れ線A~Hで構成されている。このグラフでは、各折れ線(折れ線A~H)上の総蛋白質の量は各折れ線で同じとされる。すなわち、制御部50は、第1検出部30及び第2検出部40の検出結果と、図7のグラフ(テーブル)とを用いて、血液BLに含まれる総蛋白質の量を特定する。図8のグラフは、図7のグラフからヘマトクリット値(Ht値)が25%未満である部分を除いた場合のグラフである。
なお、図7及び図8のグラフで表されるテーブルは、データとして制御部50が有する記憶装置(図示省略)に記憶されている。
以上が、測定動作の概要についての説明である。
〔測定動作における総蛋白質の量の特定のメカニズム〕
次に、測定動作における総蛋白質の量の特定のメカニズムについて説明する。
次に、測定動作における総蛋白質の量の特定のメカニズムについて説明する。
図4は、本実施形態の測定装置10を用いて測定した側方散乱光(の検出量)と、総蛋白質の量(g/dl)との関係を示すグラフであって、Ht値別にプロットした値のHt値別の4本の近似線である。本願の発明者らは、図4のグラフから、各近似線がそれぞれ一定の傾きを有すると仮定すれば(すなわち、総蛋白質と側方散乱光とは1次関数の関係を有すると仮定すれば)、所定の総蛋白質の量と側方散乱光とがそれぞれ対応する関係を有することを導き出した。別言すると、本願の発明者らは、血液BLに含まれる総蛋白質の量が所定の量の場合、側方散乱光は所定の検出量で検出されることを導き出した。さらに別言すると、本願の発明者らは、側方散乱光が所定の検出量で検出される場合、血液BLに含まれる総蛋白質の量は所定の量で検出されることを導き出した。
なお、図4のグラフにおける横軸は、2を底とする総蛋白質(g/dl)の対数の値である。
なお、図4のグラフにおける横軸は、2を底とする総蛋白質(g/dl)の対数の値である。
図5のグラフは、本実施形態の測定装置10を用いて測定したヘマトクリット値(Ht値)の検量線(等Ht線)のグラフである。図5の線I、線II、線III及び線IVは、それぞれHt値が55%、40%、25%及び10%の場合のものである。また、図6の表は、各ヘトマクリット値(各Ht値)の総蛋白質の量(TP)に対応する補正側方散乱光(反射光)の関係を示す表である。図6の表は、図4の結果により導いたものである。
本実施形態の各ヘトマクリット値(各Ht値)の総蛋白質の量(TP)は、以下の(式1)で導出される。
(式1) TP={(Y-a×X-Yref)/Ydif}+TPref
ここで、(式1)の各パラメータは以下のとおりである。
X: 測定により求められるlоg2(第2検出部40の検出出力)
Y: 測定により求められる第1検出部30の検出出力
a: 検出量の傾き
TPref: 基準総蛋白質
Yref: 基準総蛋白質の検量線の切片
Ydif: 総蛋白質が1増えるときのY値の差分
(式1) TP={(Y-a×X-Yref)/Ydif}+TPref
ここで、(式1)の各パラメータは以下のとおりである。
X: 測定により求められるlоg2(第2検出部40の検出出力)
Y: 測定により求められる第1検出部30の検出出力
a: 検出量の傾き
TPref: 基準総蛋白質
Yref: 基準総蛋白質の検量線の切片
Ydif: 総蛋白質が1増えるときのY値の差分
図7のグラフは、図5のグラフに、図6の表の補正側方散乱光(反射光)の値をプロットし、点を総蛋白質ごとに線で結んでできた折れ線A~Hである。折れ線A~Hは、総蛋白質ごとの検量線を示している。
そして、本実施形態の測定動作では、第1検出部30及び第2検出部40がそれぞれ出力した検出信号が入力された制御部50は、上記メカニズムに基づき、総蛋白質の量を特定する。
そして、本実施形態の測定動作では、第1検出部30及び第2検出部40がそれぞれ出力した検出信号が入力された制御部50は、上記メカニズムに基づき、総蛋白質の量を特定する。
以上が、測定動作における総蛋白質の量の特定のメカニズムについての説明である。また、以上が、本実施形態の測定動作についての説明である。
<第1実施形態の効果>
次に、本実施形態の効果について説明する。
本実施形態の測定動作の説明のとおり、本実施形態の測定装置10は、チューブTBを流れる血液BLに反射された光L1及びチューブTBを流れる血液BLを透過した光L2の検出結果を用いて、血液BLに含まれる総蛋白質の量を特定することができる。
また、本実施形態の測定装置10は、第1検出部30及び第2検出部40の検出結果と、予め用意したデータ(図7又は図8のグラフのもととなるテーブル)とを用いることで、血液BLに含まれる総蛋白質の量を特定することができる。
次に、本実施形態の効果について説明する。
本実施形態の測定動作の説明のとおり、本実施形態の測定装置10は、チューブTBを流れる血液BLに反射された光L1及びチューブTBを流れる血液BLを透過した光L2の検出結果を用いて、血液BLに含まれる総蛋白質の量を特定することができる。
また、本実施形態の測定装置10は、第1検出部30及び第2検出部40の検出結果と、予め用意したデータ(図7又は図8のグラフのもととなるテーブル)とを用いることで、血液BLに含まれる総蛋白質の量を特定することができる。
なお、前述のとおり、図8のグラフは、図7のグラフからヘマトクリット値(Ht値)が25%未満である部分を除いた場合のグラフである。Ht値が25%未満は、人間の血液BLの場合には稀な値である。そのため、本実施形態の測定装置10による検査対象が人間の血液BLの場合には、図8のグラフ(図8のグラフのもととなるテーブル)を用いてもよい。この場合、すなわち、図8のグラフを用いる場合、図7のグラフを用いる場合に比べて、総蛋白質の量を特定するための計算が容易になる点で有利といえる。また、図7及び図8から、Ht値が25%未満の部分は、前方散乱光に対する側方散乱光の変化率が大きい(急勾配である)。そのため、この部分は測定誤差等により大きく影響を受けるといえる。そのため、図8のグラフを用いる場合は、この点からも有利といえる。
以上が本実施形態の効果についての説明である。また、以上が第1実施形態についての説明である。
≪第2実施形態≫
次に、第2実施形態の総蛋白質量測定装置10A(以下、測定装置10Aという。図9参照)について説明する。以下、本実施形態における第1実施形態(図1参照)と異なる部分についてのみ説明する。また、以下の説明では、本実施形態において第1実施形態の構成要素と同じ構成要素を用いる場合、第1実施形態の構成要素と同じ符号を用いることとする。
次に、第2実施形態の総蛋白質量測定装置10A(以下、測定装置10Aという。図9参照)について説明する。以下、本実施形態における第1実施形態(図1参照)と異なる部分についてのみ説明する。また、以下の説明では、本実施形態において第1実施形態の構成要素と同じ構成要素を用いる場合、第1実施形態の構成要素と同じ符号を用いることとする。
<第2実施形態の機能及び構成>
図9は、本実施形態の測定装置10A及びチューブTB(流路の一例)の概略図である。本実施形態の測定装置10Aは、第1実施形態の測定装置10の構成に対し、更に、第3検出部60を備えている。
ここで、第3検出部60は、B領域(図2及び図3参照)における、第1検出部30と異なる位置に配置され、照射部20が照射した光Lのうち血液BLにより反射された光L3を検出する機能を有する。具体的には、第3検出部60は、チューブTBを流れる血液BLの赤血球で散乱された光Lのうち、照射部20が位置する方向に散乱された成分(後方散乱成分)を検出するようになっている。ここで、照射部20が位置する方向とは、図9における、1点鎖線B(光軸LAとチューブTBの中心との交点から径方向に引いた仮想直線B)よりも照射部20側を意味する。
なお、第3検出部60は、検出した検出信号を制御部50に出力するようになっている。
また、本実施形態の制御部50は、第1検出部30、第2検出部40及び第3検出部60の検出結果を用いて、血液BLに含まれる総蛋白質の量を特定するようになっている。
以上が、本実施形態の測定装置10Aの機能及び構成についての説明である。
図9は、本実施形態の測定装置10A及びチューブTB(流路の一例)の概略図である。本実施形態の測定装置10Aは、第1実施形態の測定装置10の構成に対し、更に、第3検出部60を備えている。
ここで、第3検出部60は、B領域(図2及び図3参照)における、第1検出部30と異なる位置に配置され、照射部20が照射した光Lのうち血液BLにより反射された光L3を検出する機能を有する。具体的には、第3検出部60は、チューブTBを流れる血液BLの赤血球で散乱された光Lのうち、照射部20が位置する方向に散乱された成分(後方散乱成分)を検出するようになっている。ここで、照射部20が位置する方向とは、図9における、1点鎖線B(光軸LAとチューブTBの中心との交点から径方向に引いた仮想直線B)よりも照射部20側を意味する。
なお、第3検出部60は、検出した検出信号を制御部50に出力するようになっている。
また、本実施形態の制御部50は、第1検出部30、第2検出部40及び第3検出部60の検出結果を用いて、血液BLに含まれる総蛋白質の量を特定するようになっている。
以上が、本実施形態の測定装置10Aの機能及び構成についての説明である。
<第2実施形態の測定動作>
次に、本実施形態の測定装置10Aを用いて総蛋白質の量の特定動作について主に図10~図14を参照しながら説明する。
次に、本実施形態の測定装置10Aを用いて総蛋白質の量の特定動作について主に図10~図14を参照しながら説明する。
本実施形態の場合、制御部50は、第1検出部30、第2検出部40及び第3検出部60の検出出力と、図13に示されるグラフ又は図14に示されるグラフを用いて、血液BLに含まれる総蛋白質の量を特定する。
ここで、図13のグラフは、第1検出部30、第2検出部40及び第3検出部60の検出結果と血液BLに含まれる総蛋白質の量との関係を示すテーブルを2次元化したグラフである。図13のグラフは、上記検出結果とされる、第2検出部40の検出結果である前方散乱成分についての出力と、第1検出部30の検出結果である側方散乱成分についての出力及び第3検出部60の検出結果である後方散乱光成分についての出力から得られる値(以下、特定値という。)とで構成される複数の折れ線A~Hで構成されている。このグラフでは、各折れ線(折れ線A~H)上の総蛋白質の量は各折れ線で同じとされる。すなわち、制御部50は、第1検出部30、第2検出部40及び第3検出部60の検出結果と、図13のグラフ(テーブル)とを用いて、血液BLに含まれる総蛋白質の量を特定する。図14のグラフは、図13のグラフからヘマトクリット値(Ht値)が25%未満である部分を除いた場合のグラフである。
なお、図13及び図14のグラフで表されるテーブルは、データとして制御部50が有する記憶装置(図示省略)に記憶されている。
ここで、図13のグラフは、第1検出部30、第2検出部40及び第3検出部60の検出結果と血液BLに含まれる総蛋白質の量との関係を示すテーブルを2次元化したグラフである。図13のグラフは、上記検出結果とされる、第2検出部40の検出結果である前方散乱成分についての出力と、第1検出部30の検出結果である側方散乱成分についての出力及び第3検出部60の検出結果である後方散乱光成分についての出力から得られる値(以下、特定値という。)とで構成される複数の折れ線A~Hで構成されている。このグラフでは、各折れ線(折れ線A~H)上の総蛋白質の量は各折れ線で同じとされる。すなわち、制御部50は、第1検出部30、第2検出部40及び第3検出部60の検出結果と、図13のグラフ(テーブル)とを用いて、血液BLに含まれる総蛋白質の量を特定する。図14のグラフは、図13のグラフからヘマトクリット値(Ht値)が25%未満である部分を除いた場合のグラフである。
なお、図13及び図14のグラフで表されるテーブルは、データとして制御部50が有する記憶装置(図示省略)に記憶されている。
次に、本実施形態の測定動作における総蛋白質の量の特定のメカニズムについて説明する。
図10は、本実施形態の測定装置10Aを用いて測定した側方散乱光(の検出量)及び後方散乱光(の検出量)から得られる特定値並びに総蛋白質の量(g/dl)との関係を示すグラフであって、Ht値別にプロットした値のHt値別の4本の近似線である。本願の発明者らは、図10のグラフから、各近似線がそれぞれ一定の傾きを有すると仮定すれば(すなわち、総蛋白質と特定値とは1次関数の関係を有すると仮定すれば)、所定の総蛋白質の量と特定値とがそれぞれ対応する関係を有することを導き出した。別言すると、本願の発明者らは、血液BLに含まれる総蛋白質の量が所定の量の場合、所定の特定値が得られることを導き出した。さらに別言すると、本願の発明者らは、側方散乱光及び後方散乱光がそれぞれ所定の検出量で検出される場合、血液BLに含まれる総蛋白質の量は所定の量で検出されることを導き出した。
なお、図10のグラフにおける横軸は、2を底とする総蛋白質(g/dl)の対数の値である。
図10は、本実施形態の測定装置10Aを用いて測定した側方散乱光(の検出量)及び後方散乱光(の検出量)から得られる特定値並びに総蛋白質の量(g/dl)との関係を示すグラフであって、Ht値別にプロットした値のHt値別の4本の近似線である。本願の発明者らは、図10のグラフから、各近似線がそれぞれ一定の傾きを有すると仮定すれば(すなわち、総蛋白質と特定値とは1次関数の関係を有すると仮定すれば)、所定の総蛋白質の量と特定値とがそれぞれ対応する関係を有することを導き出した。別言すると、本願の発明者らは、血液BLに含まれる総蛋白質の量が所定の量の場合、所定の特定値が得られることを導き出した。さらに別言すると、本願の発明者らは、側方散乱光及び後方散乱光がそれぞれ所定の検出量で検出される場合、血液BLに含まれる総蛋白質の量は所定の量で検出されることを導き出した。
なお、図10のグラフにおける横軸は、2を底とする総蛋白質(g/dl)の対数の値である。
図11のグラフは、本実施形態の測定装置10Aを用いて測定したヘマトクリット値(Ht値)の検量線(等Ht線)のグラフである。図11の線I、線II、線III及び線IVは、それぞれHt値が55%、40%、25%及び10%の場合のものである。また、図12の表は、各ヘトマクリット値(各Ht値)の総蛋白質の量(TP)に対応する補正側方散乱光(反射光)の関係を示す表である。図12の表は、図10の結果により導いたものである。
ここで、本実施形態の各ヘトマクリット値(各Ht値)の総蛋白質の量(TP)は、第1実施形態の(式1)で導出される。ただし、本実施形態の場合、各パラメータは以下のとおりである。
X: 測定により求められるlоg2(第2検出部40の検出出力)
Y: A×(測定により求められる第1検出部30の検出出力)+B×(測定により求められる第3検出部60の検出出力)
A: 乗算する係数
B: 乗算する係数
a: 検出量の傾き
TPref: 基準総蛋白質
Yref: 基準総蛋白質の検量線の切片
Ydif: 総蛋白質が1増えるときのY値の差分
X: 測定により求められるlоg2(第2検出部40の検出出力)
Y: A×(測定により求められる第1検出部30の検出出力)+B×(測定により求められる第3検出部60の検出出力)
A: 乗算する係数
B: 乗算する係数
a: 検出量の傾き
TPref: 基準総蛋白質
Yref: 基準総蛋白質の検量線の切片
Ydif: 総蛋白質が1増えるときのY値の差分
図13のグラフは、図11のグラフに、図12の表の補正側方散乱光(反射光)の値をプロットし、点を総蛋白質ごとに線で結んでできた折れ線A~Hである。折れ線A~Hは、総蛋白質ごとの検量線を示している。
そして、本実施形態の測定動作では、第1検出部30、第2検出部40及び第3検出部60がそれぞれ出力した検出信号が入力された制御部50は、上記メカニズムに基づき、総蛋白質の量を特定する。
そして、本実施形態の測定動作では、第1検出部30、第2検出部40及び第3検出部60がそれぞれ出力した検出信号が入力された制御部50は、上記メカニズムに基づき、総蛋白質の量を特定する。
以上が、本実施形態の測定動作における総蛋白質の量の特定のメカニズムについての説明である。また、以上が、本実施形態の測定動作についての説明である。
<第2実施形態の効果>
次に、本実施形態の効果について説明する。
本実施形態の測定動作の説明のとおり、本実施形態の測定装置10は、チューブTBを流れる血液BLに反射された光L1、L3及びチューブTBを流れる血液BLを透過した光L2の検出結果を用いて、血液BLに含まれる総蛋白質の量を特定することができる。
また、本実施形態の測定装置10は、第1検出部30、第2検出部40及び第3検出部60の検出結果と、予め用意したデータ(図13又は図14のグラフのもととなるテーブル)とを用いることで、血液BLに含まれる総蛋白質の量を特定することができる。
なお、図13のグラフに対する図14のグラフについての効果は、第1実施形態の場合の図7のグラフに対する図8のグラフの場合と同様である。
次に、本実施形態の効果について説明する。
本実施形態の測定動作の説明のとおり、本実施形態の測定装置10は、チューブTBを流れる血液BLに反射された光L1、L3及びチューブTBを流れる血液BLを透過した光L2の検出結果を用いて、血液BLに含まれる総蛋白質の量を特定することができる。
また、本実施形態の測定装置10は、第1検出部30、第2検出部40及び第3検出部60の検出結果と、予め用意したデータ(図13又は図14のグラフのもととなるテーブル)とを用いることで、血液BLに含まれる総蛋白質の量を特定することができる。
なお、図13のグラフに対する図14のグラフについての効果は、第1実施形態の場合の図7のグラフに対する図8のグラフの場合と同様である。
また、本実施形態の場合(図13及び図14参照)、複数の折れ線A~Hは線Iと線IIとの間においてフラットになる点で、第1実施形態の場合(図7及び図8参照)と異なる。そのため、本実施形態の場合、第1実施形態に比べて、総蛋白質の量の特定の処理に要する処理を簡素化できる点、高精度に総蛋白質の量を特定できるといえる。
以上が本実施形態の効果についての説明である。また、以上が第2実施形態についての説明である。
≪第3実施形態≫
次に、第3実施形態の総蛋白質量測定装置10B(以下、測定装置10Bという。図15参照)について説明する。以下、本実施形態における第1実施形態(図1参照)及び第2実施形態(図9参照)と異なる部分についてのみ説明する。また、以下の説明では、本実施形態において第1及び第2実施形態の構成要素と同じ構成要素を用いる場合、第1及び第2実施形態の構成要素と同じ符号を用いることとする。
次に、第3実施形態の総蛋白質量測定装置10B(以下、測定装置10Bという。図15参照)について説明する。以下、本実施形態における第1実施形態(図1参照)及び第2実施形態(図9参照)と異なる部分についてのみ説明する。また、以下の説明では、本実施形態において第1及び第2実施形態の構成要素と同じ構成要素を用いる場合、第1及び第2実施形態の構成要素と同じ符号を用いることとする。
<第3実施形態の機能及び構成>
図15は、本実施形態の測定装置10B及びチューブTBの概略図である。本実施形態の測定装置10Bは、第2実施形態の測定装置10Aと比べると、以下のような構成とされている。すなわち、照射部20(第1照射部の一例)及び第1検出部30に対し、第2検出部40及び第3検出部60が血流方向Aの上流側の位置に配置されている。さらに、本実施形態の場合、第2検出部40及び第3検出部60が検出する光L2、L3のもととなる光は、新たに設けられた照射部22(第2照射部の一例)により照射された光LBとされる。ここで、照射部22は、チューブTBにおける照射部20が照射する光Lの入射位置と異なる入射位置に、チューブTBに対し斜め方向から光LBを照射するようになっている。
また、本実施形態の場合、照射部20と照射部22とは、一例として、それぞれが照射する光L、LBの波長が異なる。例えば、照射部20は822nmの波長の光を照射し、照射部22は795nmの波長の光を照射するようになっている。
以上が、本実施形態の測定装置10Bの機能及び構成についての説明である。
図15は、本実施形態の測定装置10B及びチューブTBの概略図である。本実施形態の測定装置10Bは、第2実施形態の測定装置10Aと比べると、以下のような構成とされている。すなわち、照射部20(第1照射部の一例)及び第1検出部30に対し、第2検出部40及び第3検出部60が血流方向Aの上流側の位置に配置されている。さらに、本実施形態の場合、第2検出部40及び第3検出部60が検出する光L2、L3のもととなる光は、新たに設けられた照射部22(第2照射部の一例)により照射された光LBとされる。ここで、照射部22は、チューブTBにおける照射部20が照射する光Lの入射位置と異なる入射位置に、チューブTBに対し斜め方向から光LBを照射するようになっている。
また、本実施形態の場合、照射部20と照射部22とは、一例として、それぞれが照射する光L、LBの波長が異なる。例えば、照射部20は822nmの波長の光を照射し、照射部22は795nmの波長の光を照射するようになっている。
以上が、本実施形態の測定装置10Bの機能及び構成についての説明である。
<第3実施形態の測定動作>
本実施形態の測定動作は、第2実施形態の場合と同様である。
本実施形態の測定動作は、第2実施形態の場合と同様である。
<第3実施形態の効果>
本実施形態の測定装置10Bは、第2実施形態の効果と同様の効果を奏する。
また、本実施形態の場合、図15に示されるように、第1検出部30と第3検出部60とはそれぞれ異なる位置で散乱した光L1、L3を検出する。また、本実施形態の場合、第1検出部30が検出する光L1のもととなる光Lの波長と、第3検出部60が検出する光L3のもととなる光LBの波長とが異なる。そのため、本実施形態の場合、第2実施形態の場合と異なり、血液BLの酵素飽和度の測定も可能となる点で、第2実施形態の場合にない効果を奏する。これに伴い、本実施形態の場合、酵素飽和度の違いによる赤血球の容積変化などによる散乱、吸収の補正も可能となる。また、本実施形態の場合、酵素飽和度が測定可能となることで、血液成分を測定する際に酵素飽和度による散乱の影響を排除(又は受け難くする)ことができる。
さらに、本実施形態の場合、流速を帯びた全血中の血液成分の測定を可能とし、リアルタイムでの測定結果(経時変化する測定結果)を得ることができる。
本実施形態の測定装置10Bは、第2実施形態の効果と同様の効果を奏する。
また、本実施形態の場合、図15に示されるように、第1検出部30と第3検出部60とはそれぞれ異なる位置で散乱した光L1、L3を検出する。また、本実施形態の場合、第1検出部30が検出する光L1のもととなる光Lの波長と、第3検出部60が検出する光L3のもととなる光LBの波長とが異なる。そのため、本実施形態の場合、第2実施形態の場合と異なり、血液BLの酵素飽和度の測定も可能となる点で、第2実施形態の場合にない効果を奏する。これに伴い、本実施形態の場合、酵素飽和度の違いによる赤血球の容積変化などによる散乱、吸収の補正も可能となる。また、本実施形態の場合、酵素飽和度が測定可能となることで、血液成分を測定する際に酵素飽和度による散乱の影響を排除(又は受け難くする)ことができる。
さらに、本実施形態の場合、流速を帯びた全血中の血液成分の測定を可能とし、リアルタイムでの測定結果(経時変化する測定結果)を得ることができる。
以上が本実施形態の効果についての説明である。また、以上が第3実施形態についての説明である。
以上のとおり、本発明について第1~第3実施形態を一例として説明したが、本発明はこれらの実施形態に限定されるものではない。本発明の技術的範囲には、例えば、下記のような形態(変形例)も含まれる。
例えば、各実施形態の説明では、チューブTBは、一例として、横断面が真円の筒状体とされているとした(図1~図3等参照)。しかしながら、チューブTBの形状は横断面が真円の筒状体でなくてもよい。例えば、光の照射位置に対して面が形成されるようにすればよい。
また、照射部20、22は、レーザー光源であるとして説明した。しかしながら、例えば、レーザー光源に換えてLED光源であってもよい。
また、制御部50が総蛋白質の量を特定するために、テーブルを用いるとしたが、テーブルは各検出部30、40、60の検出結果に対して、所定の係数を乗算することの概念に換えてもよい。すなわち、データであればよい。
また、第3実施形態では、照射部20は822nmの波長の光を照射し、照射部22は795nmの波長の光を照射するとしたが、この場合と異なる波長の光であってもよい。また、例えば、照射部20及び照射部22が照射する光の波長の一方を赤色光、他方を赤外光としてもよい。
また、第3実施形態では、照射部20と照射部22とは、一例として、それぞれが照射する光L、LBの波長が異なるとしたが、波長が同じでもよい。
また、第3実施形態では、第2実施形態を基準として第2検出部40を第1検出部30よりも血流方向Aの上流側に移動させているが、第2検出部40を移動させなくてもよい。
Claims (9)
- 血液を流すための流路に対し斜め方向から光を照射する照射部と、
前記照射部が照射し前記流路を流れる血液に反射された光を検出する第1検出部と、
前記照射部が照射し前記流路を流れる血液を透過した光を検出する第2検出部と、
前記第1検出部及び前記第2検出部の検出結果を用いて血液に含まれる総蛋白質の量を特定する特定部と、
を備える総蛋白質量測定装置。 - 前記特定部は、前記検出結果と血液に含まれる総蛋白質の量との関係を示すデータを用いて、血液に含まれる総蛋白質の量を特定する、
請求項1に記載の総蛋白質量測定装置。 - 血液を流すための流路に対し斜め方向から光を照射する照射部と、
前記照射部が照射し前記流路を流れる血液に反射された光を検出する第1検出部と、
前記照射部が照射し前記流路を流れる血液を透過した光を検出する第2検出部と、
前記第1検出部と異なる位置に配置され、前記照射部が照射し前記流路を流れる血液に反射された光を検出する第3検出部と、
前記第1検出部、前記第2検出部及び前記第3検出部の検出結果を用いて血液に含まれる総蛋白質の量を特定する特定部と、
を備える総蛋白質量測定装置。 - 血液を流すための流路に対し斜め方向から光を照射する第1照射部と、
前記第1照射部が照射し前記流路を流れる血液に反射された光を検出する第1検出部と、
前記流路における前記第1照射部が照射する光の入射位置と異なる入射位置に、前記流路に対し斜め方向から光を照射する第2照射部と、
前記第2照射部が照射し前記流路を流れる血液を透過した光を検出する第2検出部と、
前記第2照射部が照射し前記流路を流れる血液に反射された光を検出する第3検出部と、
前記第1検出部、前記第2検出部及び前記第3検出部の検出結果を用いて血液に含まれる総蛋白質の量を特定する特定部と、
を備える総蛋白質量測定装置。 - 前記第2照射部が照射する光の波長は、前記第1照射部が照射する光の波長と異なる波長とされる、
請求項4に記載の総蛋白質量測定装置。 - 前記特定部は、前記検出結果と血液に含まれる総蛋白質の量との関係を示すデータを用いて、血液に含まれる総蛋白質の量を特定する、
請求項3~5のいずれか1項に記載の総蛋白質量測定装置。 - 血液を流すための流路に対し斜め方向から照射部により光を照射し、
前記照射部が照射し前記流路を流れる血液に反射された光を第1検出部により検出し、
前記照射部が照射し前記流路を流れる血液を透過した光を第2検出部により検出し、
前記第1検出部及び前記第2検出部の検出結果を用いて血液に含まれる総蛋白質の量を特定部により特定する、
総蛋白質量測定方法。 - 血液を流すための流路に対し斜め方向から照射部により光を照射し、
前記照射部が照射し前記流路を流れる血液に反射された光を第1検出部により検出し、
前記照射部が照射し前記流路を流れる血液を透過した光を第2検出部により検出し、
前記第1検出部と異なる位置に配置され、前記照射部が照射し前記流路を流れる血液に反射された光を第3検出部により検出し、
前記第1検出部、前記第2検出部及び前記第3検出部の検出結果を用いて血液に含まれる総蛋白質の量を特定部により特定する、
総蛋白質量測定方法。 - 血液を流すための流路に対し斜め方向から第1照射部により光を照射し、
前記第1照射部が照射し前記流路を流れる血液に反射された光を第1検出部により検出し、
前記流路における前記第1照射部が照射する光の入射位置と異なる入射位置に、前記流路に対し斜め方向から光を第2照射部により照射し、
前記第2照射部が照射し前記流路を流れる血液を透過した光を第2検出部により検出し、
前記第2照射部が照射し前記流路を流れる血液に反射された光を第3検出部により検出し、
前記第1検出部、前記第2検出部及び前記第3検出部の検出結果を用いて血液に含まれる総蛋白質の量を特定部により特定する、
総蛋白質量測定方法。
Priority Applications (2)
| Application Number | Priority Date | Filing Date | Title |
|---|---|---|---|
| JP2020562241A JP7285503B2 (ja) | 2018-12-27 | 2018-12-27 | 総蛋白質量測定装置及び総蛋白質量測定方法 |
| PCT/JP2018/048266 WO2020136833A1 (ja) | 2018-12-27 | 2018-12-27 | 総蛋白質量測定装置及び総蛋白質量測定方法 |
Applications Claiming Priority (1)
| Application Number | Priority Date | Filing Date | Title |
|---|---|---|---|
| PCT/JP2018/048266 WO2020136833A1 (ja) | 2018-12-27 | 2018-12-27 | 総蛋白質量測定装置及び総蛋白質量測定方法 |
Publications (1)
| Publication Number | Publication Date |
|---|---|
| WO2020136833A1 true WO2020136833A1 (ja) | 2020-07-02 |
Family
ID=71129256
Family Applications (1)
| Application Number | Title | Priority Date | Filing Date |
|---|---|---|---|
| PCT/JP2018/048266 Ceased WO2020136833A1 (ja) | 2018-12-27 | 2018-12-27 | 総蛋白質量測定装置及び総蛋白質量測定方法 |
Country Status (2)
| Country | Link |
|---|---|
| JP (1) | JP7285503B2 (ja) |
| WO (1) | WO2020136833A1 (ja) |
Citations (6)
| Publication number | Priority date | Publication date | Assignee | Title |
|---|---|---|---|---|
| JPH07286953A (ja) * | 1994-04-19 | 1995-10-31 | Toa Medical Electronics Co Ltd | イメージングフローサイトメータ |
| JPH09215679A (ja) * | 1996-02-09 | 1997-08-19 | Matsushita Electric Works Ltd | 体液成分濃度測定装置 |
| JP2002122537A (ja) * | 2000-10-17 | 2002-04-26 | National Food Research Institute | 近赤外分光法を用いた血液分析法および血液分析装置 |
| JP2002531824A (ja) * | 1998-11-30 | 2002-09-24 | ガンブロ アクチボラグ | 血液パラメータを測定する方法および装置 |
| US20090124964A1 (en) * | 2003-12-05 | 2009-05-14 | Dexcom, Inc. | Integrated device for continuous in vivo analyte detection and simultaneous control of an infusion device |
| JP2013164372A (ja) * | 2012-02-13 | 2013-08-22 | Tokyo Medical & Dental Univ | 血液情報の測定方法及び装置 |
-
2018
- 2018-12-27 JP JP2020562241A patent/JP7285503B2/ja active Active
- 2018-12-27 WO PCT/JP2018/048266 patent/WO2020136833A1/ja not_active Ceased
Patent Citations (6)
| Publication number | Priority date | Publication date | Assignee | Title |
|---|---|---|---|---|
| JPH07286953A (ja) * | 1994-04-19 | 1995-10-31 | Toa Medical Electronics Co Ltd | イメージングフローサイトメータ |
| JPH09215679A (ja) * | 1996-02-09 | 1997-08-19 | Matsushita Electric Works Ltd | 体液成分濃度測定装置 |
| JP2002531824A (ja) * | 1998-11-30 | 2002-09-24 | ガンブロ アクチボラグ | 血液パラメータを測定する方法および装置 |
| JP2002122537A (ja) * | 2000-10-17 | 2002-04-26 | National Food Research Institute | 近赤外分光法を用いた血液分析法および血液分析装置 |
| US20090124964A1 (en) * | 2003-12-05 | 2009-05-14 | Dexcom, Inc. | Integrated device for continuous in vivo analyte detection and simultaneous control of an infusion device |
| JP2013164372A (ja) * | 2012-02-13 | 2013-08-22 | Tokyo Medical & Dental Univ | 血液情報の測定方法及び装置 |
Also Published As
| Publication number | Publication date |
|---|---|
| JPWO2020136833A1 (ja) | 2021-11-04 |
| JP7285503B2 (ja) | 2023-06-02 |
Similar Documents
| Publication | Publication Date | Title |
|---|---|---|
| JP2009541755A (ja) | 分光検出器、および液体中で血液や生体マーカー物質を判定する方法 | |
| US9417231B2 (en) | Urine sample analyzing method and sample analyzer including classifying epithelial cells into at least two types based on the change of polarization condition | |
| JP6359535B2 (ja) | 血液沈降速度およびそれに関連する他のパラメータを決定する装置および方法 | |
| EP2477024A2 (en) | Analyzer | |
| CN113196039B (zh) | 样本光学检测装置、样本检测方法及样本分析仪 | |
| WO2020136833A1 (ja) | 総蛋白質量測定装置及び総蛋白質量測定方法 | |
| CN115598042A (zh) | 血细胞检测装置、血细胞检测方法及存储介质 | |
| JPWO2015132880A1 (ja) | 測定装置及び測定方法 | |
| JP2008008794A (ja) | 分析装置 | |
| US10139263B2 (en) | Method to calibrate disposable cartridge cuvette thickness in-situ | |
| CN110095264B (zh) | 棱镜胶合检测方法、检测装置及计算机可读存储介质 | |
| JP6191477B2 (ja) | 粒子径測定装置及び粒子径測定方法 | |
| EP2505991A1 (en) | Biological material analyzer and biological material analysis method | |
| EP3690425B1 (en) | Measurement device and measurement method for hematoctrit | |
| JPH0277636A (ja) | 粒子測定装置 | |
| JP6422414B2 (ja) | 検体の比濁分析決定(nephelometricdetermination)を行う方法 | |
| WO2018135503A1 (ja) | 光学式検体検出システムにおけるセンサーチップの位置検出方法及び位置検出装置 | |
| US8665444B2 (en) | Optical member and surface plasmon resonance measuring apparatus | |
| CN103487237B (zh) | 一种激光光束分析仪探测面定位方法及系统 | |
| JPS6314295B2 (ja) | ||
| CN116858740A (zh) | 一种提高基于激光散射的粉尘浓度测量精度的方法 | |
| JP2004138561A (ja) | 赤血球蓄積負荷状態測定方法および装置 | |
| US12480873B2 (en) | Determining time response value of an analyte in a liquid | |
| US20180045642A1 (en) | Gas detection device and method for detecting gas concentration | |
| CN223021900U (zh) | 一种光源强度分光及烟气透射散射信号检测装置 |
Legal Events
| Date | Code | Title | Description |
|---|---|---|---|
| 121 | Ep: the epo has been informed by wipo that ep was designated in this application |
Ref document number: 18944492 Country of ref document: EP Kind code of ref document: A1 |
|
| ENP | Entry into the national phase |
Ref document number: 2020562241 Country of ref document: JP Kind code of ref document: A |
|
| NENP | Non-entry into the national phase |
Ref country code: DE |
|
| 122 | Ep: pct application non-entry in european phase |
Ref document number: 18944492 Country of ref document: EP Kind code of ref document: A1 |