WO2020070786A1 - 識別器の生成方法 - Google Patents
識別器の生成方法Info
- Publication number
- WO2020070786A1 WO2020070786A1 PCT/JP2018/036801 JP2018036801W WO2020070786A1 WO 2020070786 A1 WO2020070786 A1 WO 2020070786A1 JP 2018036801 W JP2018036801 W JP 2018036801W WO 2020070786 A1 WO2020070786 A1 WO 2020070786A1
- Authority
- WO
- WIPO (PCT)
- Prior art keywords
- peak
- waveform data
- data
- peaks
- unseparated
- Prior art date
- Legal status (The legal status is an assumption and is not a legal conclusion. Google has not performed a legal analysis and makes no representation as to the accuracy of the status listed.)
- Ceased
Links
Images




Classifications
-
- G—PHYSICS
- G01—MEASURING; TESTING
- G01N—INVESTIGATING OR ANALYSING MATERIALS BY DETERMINING THEIR CHEMICAL OR PHYSICAL PROPERTIES
- G01N30/00—Investigating or analysing materials by separation into components using adsorption, absorption or similar phenomena or using ion-exchange, e.g. chromatography or field flow fractionation
- G01N30/02—Column chromatography
- G01N30/86—Signal analysis
- G01N30/8675—Evaluation, i.e. decoding of the signal into analytical information
- G01N30/8682—Group type analysis, e.g. of components having structural properties in common
-
- G—PHYSICS
- G01—MEASURING; TESTING
- G01N—INVESTIGATING OR ANALYSING MATERIALS BY DETERMINING THEIR CHEMICAL OR PHYSICAL PROPERTIES
- G01N25/00—Investigating or analyzing materials by the use of thermal means
- G01N25/20—Investigating or analyzing materials by the use of thermal means by investigating the development of heat, i.e. calorimetry, e.g. by measuring specific heat, by measuring thermal conductivity
-
- G—PHYSICS
- G01—MEASURING; TESTING
- G01N—INVESTIGATING OR ANALYSING MATERIALS BY DETERMINING THEIR CHEMICAL OR PHYSICAL PROPERTIES
- G01N30/00—Investigating or analysing materials by separation into components using adsorption, absorption or similar phenomena or using ion-exchange, e.g. chromatography or field flow fractionation
- G01N30/02—Column chromatography
- G01N30/86—Signal analysis
- G01N30/8624—Detection of slopes or peaks; baseline correction
- G01N30/8631—Peaks
-
- G—PHYSICS
- G01—MEASURING; TESTING
- G01N—INVESTIGATING OR ANALYSING MATERIALS BY DETERMINING THEIR CHEMICAL OR PHYSICAL PROPERTIES
- G01N30/00—Investigating or analysing materials by separation into components using adsorption, absorption or similar phenomena or using ion-exchange, e.g. chromatography or field flow fractionation
- G01N30/02—Column chromatography
- G01N30/86—Signal analysis
- G01N30/8624—Detection of slopes or peaks; baseline correction
- G01N30/8644—Data segmentation, e.g. time windows
-
- G—PHYSICS
- G01—MEASURING; TESTING
- G01N—INVESTIGATING OR ANALYSING MATERIALS BY DETERMINING THEIR CHEMICAL OR PHYSICAL PROPERTIES
- G01N30/00—Investigating or analysing materials by separation into components using adsorption, absorption or similar phenomena or using ion-exchange, e.g. chromatography or field flow fractionation
- G01N30/02—Column chromatography
- G01N30/86—Signal analysis
- G01N30/8651—Recording, data aquisition, archiving and storage
-
- G—PHYSICS
- G01—MEASURING; TESTING
- G01N—INVESTIGATING OR ANALYSING MATERIALS BY DETERMINING THEIR CHEMICAL OR PHYSICAL PROPERTIES
- G01N30/00—Investigating or analysing materials by separation into components using adsorption, absorption or similar phenomena or using ion-exchange, e.g. chromatography or field flow fractionation
- G01N30/02—Column chromatography
- G01N30/86—Signal analysis
- G01N30/8675—Evaluation, i.e. decoding of the signal into analytical information
- G01N30/8689—Peak purity of co-eluting compounds
-
- G—PHYSICS
- G01—MEASURING; TESTING
- G01N—INVESTIGATING OR ANALYSING MATERIALS BY DETERMINING THEIR CHEMICAL OR PHYSICAL PROPERTIES
- G01N30/00—Investigating or analysing materials by separation into components using adsorption, absorption or similar phenomena or using ion-exchange, e.g. chromatography or field flow fractionation
- G01N30/02—Column chromatography
- G01N30/86—Signal analysis
- G01N30/8624—Detection of slopes or peaks; baseline correction
- G01N2030/8648—Feature extraction not otherwise provided for
Definitions
- the present invention relates to a method for generating a classifier.
- a sample containing various components is introduced into a column, and various components are separated in the time direction as the sample passes through the column, and detected by a detector provided at the outlet of the column. I do. Peaks corresponding to the components in the sample appear in the chromatogram obtained by the detector. Since the time during which the peak is observed (retention time) corresponds to the type of the component, the component can be specified from the retention time of the peak, that is, qualitative analysis can be performed. In addition, since the height and area of the peak correspond to the concentration or content of the component, the concentration or content of the component can be obtained from the height or area value of the peak, that is, quantitative analysis can be performed. .
- peak detection (including determination of the start and end points of the peak and determination of the intensity at the peak position) must be performed on the chromatogram waveform.
- unseparated peaks may be detected due to overlapping of peaks derived from a plurality of components.
- the operator needs to set detection parameters. Therefore, depending on the skill of the operator, there is a problem that the peak detection cannot be performed accurately, or the peak detection requires excessive trial and error, and it takes time.
- the present invention provides a method for generating a classifier capable of accurately detecting peaks of various components even in an unseparated peak in which the peaks of various components overlap, in order to solve the above problem. Aim.
- An exemplary method for generating a discriminator is a method for generating a discriminator for performing peak detection, comprising: obtaining first waveform data having a first peak; Obtaining second waveform data having a second peak having a different peak position from the first waveform data, and obtaining the second peak of the first waveform data and the second peak of the second waveform data.
- the peak detection includes, for example, detection of a peak position, detection of a peak start / end point, detection of a peak intensity, detection of an area, and the like.
- the learning data of the unseparated peak is generated by superimposing the peaks of the various components obtained by the measurement, each peak before the generation of the unseparated peak can be used as the teacher data.
- the accuracy of machine learning can be improved, and peaks of various components of the sample to be measured can be accurately detected.
- FIG. 2 is a block diagram illustrating a functional configuration of the data analysis device.
- FIG. 3 is a block diagram illustrating a functional configuration of a computer.
- FIG. 9 is a diagram for explaining a conventional method of learning an unseparated peak.
- FIG. 9 is a diagram for explaining a conventional method of learning an unseparated peak.
- FIG. 9 is a diagram for explaining a conventional method of learning an unseparated peak.
- FIG. 9 is a diagram for explaining a conventional method of learning an unseparated peak.
- 4 is a flowchart illustrating an operation of a computer that performs machine learning for determining an optimal method for separating unseparated peaks according to the present embodiment.
- FIG. 9 is a flowchart illustrating an operation of a computer that performs machine learning for determining an optimal method for separating unseparated peaks according to the present embodiment.
- FIG. 4 is a diagram for explaining a method of learning an unseparated peak according to the present embodiment.
- FIG. 4 is a diagram for explaining a method of learning an unseparated peak according to the present embodiment.
- FIG. 4 is a diagram for explaining a method of learning an unseparated peak according to the present embodiment.
- FIG. 1 is a block diagram illustrating an example of a functional configuration of the data analysis device 1.
- the data analysis device 1 includes a measurement device 10 and a calculation device 60.
- the measurement device 10 includes a mobile phase container 100, a liquid sending pump 110, a sample injection unit 120, a column 130, and a detector 140.
- the mobile phase container 100 is a container for storing a mobile phase.
- the liquid sending pump 110 sucks the mobile phase stored in the mobile phase container 100 and sends it at a constant flow rate.
- the sample injection unit 120 selects one liquid sample from a plurality of liquid samples such as a standard sample and an unknown sample, and injects the selected liquid sample into the mobile phase sent from the liquid sending pump 110. If necessary, a pretreatment such as dilution or concentration may be performed on the sample, and then the sample after the treatment may be injected into the mobile phase.
- the column 130 temporally separates the components contained in the sample while the sample injected into the mobile phase passes.
- the detector 140 is, for example, a detector using a spectrometer, and converts the components of the sample separated by the column 130 into waveform data (may be referred to as a spectrum) of an electric signal, and sends the data to the data processing unit 30. Output.
- the waveform data includes two-dimensional data in which a second variable (for example, the intensity on the vertical axis) is plotted with respect to the first variable (for example, the frequency on the horizontal axis), or the first variable, Three-dimensional data obtained by adding a third variable (for example, wavelength, mass number) in addition to the second variable is included.
- the peak of the waveform data means that the value of the second variable has a local maximum or a maximum value with respect to the peak position as the predetermined value of the first variable.
- the peak has a predetermined width (peak width), which means that the peak width spreads symmetrically or asymmetrically with respect to the peak position which is the peak center of the first variable.
- the arithmetic device 60 includes the control unit 20, the data processing unit 30, the input unit 40, the display unit 50, and the interface 52.
- the control unit 20 is connected to the liquid feed pump 110, the sample injection unit 120, the detector 140, the data processing unit 30, the input unit 40, the display unit 50, and the interface 52.
- the control unit 70 includes, for example, a CPU (Central Processing Unit) and controls the operation of the entire apparatus by executing a program stored in a memory such as a ROM (Read Only Memory), a program of the data processing unit 30, and the like. I do.
- a CPU Central Processing Unit
- ROM Read Only Memory
- the data processing unit 30 is connected to each of the control unit 20 and the detector 140, and is embodied by the control unit 20 and a program.
- the data processing unit 30 includes a data collection unit 310, a peak detection processing unit 320, and a qualitative / quantitative analysis unit 330.
- the data collection unit 310 collects waveform data of chromatograms based on various components of the sample measured by the measurement device 10, and stores the collected waveform data.
- the peak detection processing unit 320 has a learned model storage unit 322 and a peak determination unit 324 as functional blocks.
- a learned model created by a computer described later is stored in a memory in the data processing unit 30 and functions as a learned model storage unit 322.
- the learned model is obtained by machine learning a discriminator described later using teacher data.
- the peak determination unit 324 of the peak detection processing unit 320 uses the learned model stored in the learned model storage
- the separation peak is automatically separated into a plurality of peaks corresponding to various components. Thereby, separation peaks corresponding to various components can be detected.
- the qualitative / quantitative analysis unit 330 identifies a component corresponding to each peak based on the peak information given from the peak detection processing unit 320, calculates a peak height and a peak area value, and calculates a value of each component from the value. Calculate concentration or content.
- the data processing unit 30 is implemented by a computer system including a personal computer on which predetermined software is installed, a higher-performance workstation, or a high-performance computer connected to these computers via a communication line. It is. That is, the function of each block included in the data processing unit 30 is implemented by executing software installed in a computer system including a single computer or a plurality of computers.
- the input unit 40 includes, for example, a keyboard, a mouse, and a touch panel, and performs various operations of the measurement device 10 and performs operations such as analysis of waveform data of chromatograms supplied from the measurement device 10.
- the display unit 50 is, for example, a monitor formed of a liquid crystal display or the like, and displays waveform data of various components detected by the detector 140 and the like, and displays qualitative / quantitative analysis results.
- the interface 52 is configured by a LAN (Local Area Network), a WAN (Wide Area Network), a USB (Universal Serial Bus), or the like.
- the interface 52 performs bidirectional communication with a computer 2 described later, and is created on the computer 2 side.
- the learned model that has been learned is received.
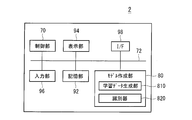
- FIG. 2 is a block diagram illustrating an example of a functional configuration of the computer 2.
- the computer 2 includes a control unit 70, a model creation unit 80, a storage unit 92, a display unit 94, an input unit 96, and an interface 98.
- the control unit 70, the model creation unit 80, the storage unit 92, the display unit 94, the input unit 96, and the interface 98 are connected to each other via a bus 72.
- the control unit 70 includes, for example, a CPU, and controls the operation of the entire apparatus by executing a program stored in a memory such as a ROM or a program of the model creation unit 80, and estimates a method of separating unseparated peaks.
- a program stored in a memory such as a ROM or a program of the model creation unit 80
- the model creation unit 80 constructs a learned model for determining an optimal separation method for an unseparated peak in which a plurality of peaks overlap, for example.
- the model creation unit 80 has a learning data generation unit 810 and a classifier 820 as functional blocks. Note that the model creation unit 80 can also be stored in the storage unit 92.
- the learning data generation unit 810 generates learning waveform data including unseparated peaks in which a plurality of peaks overlap, using waveform data of chromatograms of various samples measured by the data analysis device 1. Further, the learning data generating unit 810 associates the generated waveform data including the unseparated peak with the waveform data of each peak before the superimposition of the unseparated peak as the teacher data. As the teacher data, for example, an area value and a height value of each peak of the waveform data can be used. Further, the learning data generation unit 810 also obtains various separated waveform data other than the unseparated peak by measurement in consideration of the case where the sample measured by the data analyzer 1 does not include the waveform data of the unseparated peak. I do.
- the learning data generator 810 of the computer 2 creates the waveform data D12 of the unseparated peak, and loads the created waveform data D12 into the discriminator 820 to perform machine learning.
- waveform data D12 including unseparated peaks is created from the acquired waveform data D1 and D2, and the created waveform data D12 is input to the discriminator 820 of the computer 2. Is also good.
- waveform data of a sample used in machine learning is acquired using the measurement device 10 of the data analysis device 1 shown in FIG. 1 for convenience.
- the waveform data of the learning sample can also be obtained using another measurement device having
- the discriminator 820 performs machine learning using learning data including the waveform data of the unseparated peaks generated by the learning data generation unit 810 and the waveform data of each peak before the generation of the unseparated peaks. Create a trained model to determine the best separation method for peaks. In the present embodiment, since the teacher data of each peak constituting the unseparated peak is attached to the unseparated peak, the accuracy of machine learning can be improved.
- the discriminator 820 also takes in the waveform data other than the unseparated peaks, performs machine learning, and includes in the learned model a function capable of accurately detecting peaks other than the unseparated peaks.
- a known algorithm such as a neural network, an SVM (support vector machine), or AdaBoost can be used.
- the storage unit 92 is configured by a nonvolatile storage device such as a ROM (Read Only Memory), a flash memory, an EPROM (Erasable Programmable ROM), an HDD (Hard Disc Drive), and an SSD (Solid State Drive).
- the storage unit 92 stores, for example, an OS (Operating System).
- the display unit 94 is a monitor including, for example, a liquid crystal display.
- the input unit 96 includes, for example, a keyboard, a mouse, and a touch panel, and performs various operations related to execution of machine learning.
- the interface 98 is configured by a LAN, a WAN, a USB, or the like, performs bidirectional communication with the data analyzer 1, for example, receives chromatogram waveform data from the data analyzer 1, and executes the created trained model. The data is transmitted to the data analyzer 1.
- ⁇ Machine learning method> when the chromatogram of the sample measured by the data analyzer 1 is an unseparated peak in which a plurality of peaks are overlapped, a learned model for accurately separating the peaks of various components using the discriminator 820.
- a machine learning method for constructing is described. Hereinafter, a conventional machine learning method will be described, and subsequently, a machine learning method according to the present embodiment will be described.
- a sample to be separated and detected by the data analyzer 1 for example, a sample containing components A and B is used.
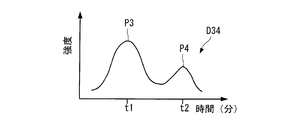
- FIG. 3A shows an example of the waveform data D34.
- the waveform data D34 has a peak P3 of the component A at the holding time t1, and a peak P4 of the component B at the holding time t2.
- the acquired waveform data D34 is input to the classifier 820 as learning data.
- teacher data corresponding to the waveform data D34 is prepared in order to accurately separate the peak P3 of the component A and the peak P4 of the component B in the unseparated peak.
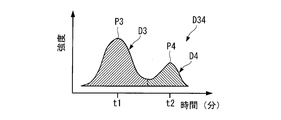
- the teacher data for example, waveform data D3 including a peak P3 and waveform data D4 including a peak P4 obtained by separating an unseparated peak by an operator can be used.
- the peaks P3 and P4 can be separated from the unseparated peaks in the input waveform data D34.
- the separation of unseparated peaks can be automatically performed by an algorithm using a computer.
- FIG. 3B shows the vertical division method.
- a vertical line perpendicular to the baseline is drawn from a point (hereinafter, referred to as a boundary point) where the amplitude value between the peak P3 and the peak P4 in the waveform data D34 is minimum.
- Peak P3 and peak P4 are separated to obtain waveform data D3 and waveform data D4.
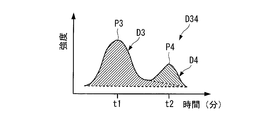
- FIG. 3C shows a first baseline division method.
- a base line is drawn between the start point at peak P3 and the boundary point, and the base line is drawn between the boundary point and end point at peak P4.
- the peak P3 and the peak P4 are separated, and waveform data D3 and waveform data D4 are obtained.
- FIG. 3D shows a second baseline dividing method different from FIG. 3C.
- a base line is drawn between the start point of the peak P3 and the end point of the peak P4, and the base line is drawn between the boundary point and the end point of the peak P4.
- the peak P3 and the peak P4 are separated, and waveform data D3 and waveform data D4 are obtained.
- Each of the waveform data D3 including the peak P3 and the waveform data D4 including the peak P4 obtained by each of the above-described separation methods is input to the classifier as teacher data.
- the discriminator performs machine learning using the waveform data D34 of the unseparated peak and the waveform data D3 and D4 as teacher data corresponding to the waveform data D34, and accurately separates the unseparated peak into each peak.
- the above-described method for separating unseparated peaks has the following problems. That is, there is a problem that the area value and the height value of each peak after the separation differ depending on the type of the separation method. Therefore, the teacher data of the peaks P3 and P4 also vary depending on the type of the separation method to be used, so that there is a problem that highly accurate machine learning cannot be performed. As a result, there is a problem that peaks of various components in a predetermined sample cannot be detected accurately. Therefore, the following conventional problem is solved by the following machine learning method according to the present embodiment.
- FIG. 4 is a flowchart illustrating an example of a machine learning method for constructing a discriminator 820 that separates unseparated peaks of components A and B according to the present embodiment.
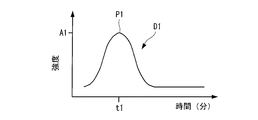
- FIG. 5A shows an example of the waveform data D1 of the component A.
- FIG. 5B shows an example of the waveform data D2 of the component B.
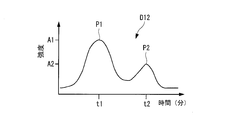
- FIG. 5C shows an example of the waveform data D12.
- the computer 2 executes the operation illustrated in FIG. 4 by executing a program such as the model creation unit 80.
- step S10 the input unit 96 of the computer 2 receives the input of the waveform data D1 of the component A measured by the data analyzer 1 shown in FIG. 1, for example. As shown in FIG. 5A, a peak P1 of the amplitude A1 corresponding to the component A appears at the holding time t1 in the waveform data D1.
- step S20 the input unit 96 of the computer 2 receives the input of the waveform data D2 of the component B by the data analysis device 1.
- a peak P2 of the amplitude A2 corresponding to the component B appears at the holding time t2 in the waveform data D2.
- the holding time t2 is a time later than the holding time t1, and the peak P2 has a different peak position from the peak P1.
- the amplitude A1 is larger than the amplitude A2.
- step S30 the learning data generation unit 810 of the computer 2 superimposes the waveform data D1 and the waveform data D2, which are time-series signals received from the input unit 96, to generate waveform data D12 including unseparated peaks. That is, the waveform data D12 is intentionally created such that the peak P1 and the peak P2 are not separated. As shown in FIG. 5C, the waveform data D12 has a peak P1 at the retention time t1, a peak P2 at the retention time t2, and an end point of the adjacent peak P1 and a start point of the peak P2 that are not separated. Has become.
- step S40 the discriminator 820 of the computer 2 captures the created unseparated peak waveform data D12 as learning data, and captures the waveform data D1 and D2 corresponding to the waveform data D12 as teacher data. As described above, the area values of the peaks P1 and P2 are used as the teacher data.
- step S50 the discriminator 820 of the computer 2 performs machine learning using the acquired waveform data D12 and the waveform data D1 and D2 as teacher data, and performs an accurate separation method of an unseparated peak based on the learning result. Build a trained model for estimating (separation position).
- the trained model created by such a learning method is stored in a memory such as the storage unit 92 of the computer 2, for example.
- the learned model described above is transmitted to the data analysis device 1 shown in FIG. 1 via a communication line, and is stored in the learned model storage unit 322.
- the data analyzer 1 when an unseparated peak is detected at the time of peak detection of a predetermined sample, the waveform data of the unseparated peak is separated into peaks for each component by using the learned model of the learned model storage unit 322. I do.
- a trained model that has performed machine learning on unseparated peaks, for example, it is possible to calculate at which position of an unseparated peak it is optimal to split, so that unseparated peaks can be accurately converted to peaks corresponding to various components Can be separated.
- the learning data of the unseparated peak is generated by superimposing the peaks of the respective components that have been independently measured in advance, each peak before the generation of the unseparated peak is generated.
- unseparated peaks can be separated using machine learning with improved accuracy, so that peaks of various components of a sample to be measured can be accurately detected.
- the learning data can be generated by superimposing a plurality of peaks. The accuracy of learning can be improved.
- each peak P1 and P2 before the generation of the unseparated peak is used as a teacher.
- the data is correlated as data and input to the discriminator 820. Since the peaks P1 and P2 are independently detected by the data analyzer 1, accurate area values of the peaks P1 and P2 can be obtained in advance. As a result, machine learning for accurately separating unseparated peaks can be performed using the known area values of the respective peaks P1 and P2, so that an optimal separation method for unseparated peaks is determined. Can be constructed.
- the learning data to be expanded is not limited to the data obtained by superimposing the peaks of the spectrum actually measured using the analyzer, and the data obtained by superimposing the peaks of the spectrum simulating the actually measured spectrum. It may be.
- the simulated spectrum may be, for example, simulated peak broadening (including tailing and reading), appearance of a shoulder peak, peak cracking, and the like, simulated baseline drift, and noise.
- the simulated peak can be created using a known algorithm, for example, i-PDeA II (manufactured by Shimadzu Corporation).
- an unseparated peak is intentionally generated by superimposing the two peaks P1 and P2 of the components A and B, but the present invention is not limited to this.
- an unseparated peak can be generated by superimposing three or more peaks in three or more components, and this can be used as learning data.
- the area value of each peak can be used as teacher data.
- each of the peaks P1 and P2 of the components A and B may include two or more peaks. Even when three or more peaks of three or more components are used, two or more peaks may be used for each peak. May contain peaks.
Landscapes
- Physics & Mathematics (AREA)
- Health & Medical Sciences (AREA)
- Life Sciences & Earth Sciences (AREA)
- Chemical & Material Sciences (AREA)
- Analytical Chemistry (AREA)
- Biochemistry (AREA)
- General Health & Medical Sciences (AREA)
- General Physics & Mathematics (AREA)
- Immunology (AREA)
- Pathology (AREA)
- Engineering & Computer Science (AREA)
- Library & Information Science (AREA)
- Other Investigation Or Analysis Of Materials By Electrical Means (AREA)
- Automatic Analysis And Handling Materials Therefor (AREA)
Abstract
Description
まず、試料に含まれる各種成分のピークを検出するデータ解析装置1について説明する。本実施の形態では、データ解析装置1として、例えば液体クロマトグラフを採用した例について説明する。図1は、データ解析装置1の機能構成の一例を示すブロック図である。
次に、入力される学習データに基づいて機械学習を行うコンピュータ2について説明する。図2は、コンピュータ2の機能構成の一例を示すブロック図である。
次に、データ解析装置1により測定される試料のクロマトグラムが複数のピークが重なり合った未分離ピークである場合に、識別器820を用いて各種成分のピークを正確に分離するための学習済みモデルを構築する機械学習方法について説明する。以下では、従来における機械学習方法について説明し、続けて、本実施の形態における機械学習方法について説明する。また、データ解析装置1により分離、検出を行う試料としては、例えば、成分A,Bを含む試料を用いるものとする。
まず、データ解析装置1により成分A、Bを含む試料の分離、検出を行い、成分AのピークP3と成分BのピークP4とが重ね合わされた未分離ピークを含む波形データD34を取得する。図3Aは、波形データD34の一例を示している。図3Aに示すように、波形データD34は、保持時間t1に成分AのピークP3を有し、保持時間t2に成分BのピークP4を有する。取得した波形データD34は、学習データとして識別器820に入力される。
図4は、本実施の形態に係る成分A,Bの未分離ピークを分離する識別器820を構築するための機械学習方法の一例を示すフローチャートである。図5Aは、成分Aの波形データD1の一例を示している。図5Bは、成分Bの波形データD2の一例を示している。図5Cは、波形データD12の一例を示している。コンピュータ2は、モデル作成部80等のプログラムを実行することにより、図4に示す動作を実行する。
2 コンピュータ
80 モデル作成部
810 学習データ生成部
820 識別器
D1,D2,D12 波形データ
P1,P2 ピーク
Claims (5)
- ピーク検出を行うための識別器を生成する方法であって、
第1のピークを有する第1の波形データを得る工程と、
前記第1のピークとは異なるピーク位置を有する第2のピークを有する第2の波形データとを得る工程と、
前記第1の波形データの前記第1のピークと前記第2の波形データの前記第2のピークとを重ね合わせて未分離波形データを生成する工程と、
前記未分離波形データを含む教師データを識別器に入力して学習を行う工程と、
を有する、識別器の生成方法。 - 前記第1及び第2の波形データのうち少なくとも一方は、実測により得られた波形データである、
請求項1に記載の識別器の生成方法。 - 前記第1及び第2の波形データのうち少なくとも一方は、実測により得られる波形データを模擬して作成した波形データである、
請求項1に記載の識別器の生成方法。 - 前記第3の工程において、前記識別器に入力する教師データとして、前記未分離ピークを生成する前の前記第1および第2の波形データのうち少なくとも一方を用いる、
請求項1から3の何れか一項に記載の識別器の生成方法。 - 前記第1および第2の波形データにおける前記第1および第2のピークのうち少なくとも一方の面積値を用いる、
請求項4に記載の識別器の生成方法。
Priority Applications (4)
| Application Number | Priority Date | Filing Date | Title |
|---|---|---|---|
| JP2020550973A JP7056750B2 (ja) | 2018-10-02 | 2018-10-02 | 識別器の生成方法 |
| PCT/JP2018/036801 WO2020070786A1 (ja) | 2018-10-02 | 2018-10-02 | 識別器の生成方法 |
| CN201880099838.7A CN113167777B (zh) | 2018-10-02 | 2018-10-02 | 鉴别器的生成方法 |
| US17/218,861 US12571779B2 (en) | 2018-10-02 | 2018-10-02 | Method for creating discriminator |
Applications Claiming Priority (1)
| Application Number | Priority Date | Filing Date | Title |
|---|---|---|---|
| PCT/JP2018/036801 WO2020070786A1 (ja) | 2018-10-02 | 2018-10-02 | 識別器の生成方法 |
Publications (1)
| Publication Number | Publication Date |
|---|---|
| WO2020070786A1 true WO2020070786A1 (ja) | 2020-04-09 |
Family
ID=70055713
Family Applications (1)
| Application Number | Title | Priority Date | Filing Date |
|---|---|---|---|
| PCT/JP2018/036801 Ceased WO2020070786A1 (ja) | 2018-10-02 | 2018-10-02 | 識別器の生成方法 |
Country Status (4)
| Country | Link |
|---|---|
| US (1) | US12571779B2 (ja) |
| JP (1) | JP7056750B2 (ja) |
| CN (1) | CN113167777B (ja) |
| WO (1) | WO2020070786A1 (ja) |
Cited By (6)
| Publication number | Priority date | Publication date | Assignee | Title |
|---|---|---|---|---|
| CN111812149A (zh) * | 2020-07-20 | 2020-10-23 | 南京工业大学 | 一种基于机器学习的绝热加速量热方法 |
| WO2021210228A1 (ja) * | 2020-04-17 | 2021-10-21 | 株式会社島津製作所 | 波形情報推定方法及び装置、並びに、ピーク波形処理方法及び装置 |
| JP2022052158A (ja) * | 2020-09-23 | 2022-04-04 | 株式会社島津製作所 | 学習用データの生成装置、モデル学習装置、試料の特性推定装置、及びクロマトグラフ質量分析装置 |
| JP2022098024A (ja) * | 2020-12-21 | 2022-07-01 | 株式会社島津製作所 | 波形処理支援装置および波形処理支援方法 |
| JPWO2022195935A1 (ja) * | 2021-03-19 | 2022-09-22 | ||
| JP2023135276A (ja) * | 2022-03-15 | 2023-09-28 | 株式会社島津製作所 | 学習方法、および学習プログラム |
Families Citing this family (2)
| Publication number | Priority date | Publication date | Assignee | Title |
|---|---|---|---|---|
| CN116628541B (zh) * | 2022-02-18 | 2025-07-25 | 株式会社岛津制作所 | 学习支援方法 |
| JP2023128342A (ja) * | 2022-03-03 | 2023-09-14 | 株式会社島津製作所 | 学習用データの作成方法、波形解析装置、波形解析方法、およびコンピュータプログラム |
Citations (2)
| Publication number | Priority date | Publication date | Assignee | Title |
|---|---|---|---|---|
| JPH0694696A (ja) * | 1992-09-17 | 1994-04-08 | Hitachi Ltd | クロマトグラム解析方法及びクロマトグラフ装置 |
| JP2016136125A (ja) * | 2015-01-23 | 2016-07-28 | 株式会社日立ハイテクサイエンス | 熱分析データの処理方法および熱分析装置 |
Family Cites Families (4)
| Publication number | Priority date | Publication date | Assignee | Title |
|---|---|---|---|---|
| JP2016028229A (ja) * | 2014-07-08 | 2016-02-25 | キヤノン株式会社 | データ処理装置、及びそれを有するデータ表示システム、試料情報取得システム、データ処理方法、プログラム、記憶媒体 |
| CN107076712B (zh) * | 2014-09-03 | 2019-01-11 | 株式会社岛津制作所 | 色谱数据处理方法以及装置 |
| JP6834126B2 (ja) | 2015-11-26 | 2021-02-24 | 株式会社リコー | 情報処理装置、欠陥検出方法およびプログラム |
| EP3572805B1 (en) * | 2017-01-19 | 2026-05-13 | Shimadzu Corporation | Analysis data analytics method and analysis data analytics device |
-
2018
- 2018-10-02 JP JP2020550973A patent/JP7056750B2/ja active Active
- 2018-10-02 WO PCT/JP2018/036801 patent/WO2020070786A1/ja not_active Ceased
- 2018-10-02 US US17/218,861 patent/US12571779B2/en active Active
- 2018-10-02 CN CN201880099838.7A patent/CN113167777B/zh active Active
Patent Citations (2)
| Publication number | Priority date | Publication date | Assignee | Title |
|---|---|---|---|---|
| JPH0694696A (ja) * | 1992-09-17 | 1994-04-08 | Hitachi Ltd | クロマトグラム解析方法及びクロマトグラフ装置 |
| JP2016136125A (ja) * | 2015-01-23 | 2016-07-28 | 株式会社日立ハイテクサイエンス | 熱分析データの処理方法および熱分析装置 |
Non-Patent Citations (2)
| Title |
|---|
| "Wave", TOSHIBA, vol. 21, May 2017 (2017-05-01), pages 6, 7, Retrieved from the Internet <URL:https://www.tjsys.co.jp/wave/files/Wave-21-06.pdf> [retrieved on 20180109] * |
| HU , Y. Z. ET AL.: "Assessment of chromatographic peak purity by means of artificial neural networks", JORNAL OF CHROMATOGRAPHY A, 1996, pages 259 - 270, XP000589681, DOI: 10.1016/0021-9673(95)01303-2 * |
Cited By (19)
| Publication number | Priority date | Publication date | Assignee | Title |
|---|---|---|---|---|
| CN115398226A (zh) * | 2020-04-17 | 2022-11-25 | 株式会社岛津制作所 | 波形信息估计方法及装置以及峰波形处理方法及装置 |
| WO2021210228A1 (ja) * | 2020-04-17 | 2021-10-21 | 株式会社島津製作所 | 波形情報推定方法及び装置、並びに、ピーク波形処理方法及び装置 |
| JPWO2021210228A1 (ja) * | 2020-04-17 | 2021-10-21 | ||
| US12535471B2 (en) | 2020-04-17 | 2026-01-27 | Shimadzu Corporation | Waveform information inference method and device, and peak waveform processing method and device |
| CN115398226B (zh) * | 2020-04-17 | 2024-02-09 | 株式会社岛津制作所 | 波形信息估计方法及装置以及峰波形处理方法及装置 |
| JP7414125B2 (ja) | 2020-04-17 | 2024-01-16 | 株式会社島津製作所 | 波形情報推定方法及び装置、並びに、ピーク波形処理方法及び装置 |
| CN111812149B (zh) * | 2020-07-20 | 2021-10-15 | 南京工业大学 | 一种基于机器学习的绝热加速量热方法 |
| CN111812149A (zh) * | 2020-07-20 | 2020-10-23 | 南京工业大学 | 一种基于机器学习的绝热加速量热方法 |
| JP2022052158A (ja) * | 2020-09-23 | 2022-04-04 | 株式会社島津製作所 | 学習用データの生成装置、モデル学習装置、試料の特性推定装置、及びクロマトグラフ質量分析装置 |
| JP7537203B2 (ja) | 2020-09-23 | 2024-08-21 | 株式会社島津製作所 | 学習用データの生成装置、モデル学習装置、試料の特性推定装置、及びクロマトグラフ質量分析装置 |
| JP7472775B2 (ja) | 2020-12-21 | 2024-04-23 | 株式会社島津製作所 | 波形処理支援装置および波形処理支援方法 |
| JP2022098024A (ja) * | 2020-12-21 | 2022-07-01 | 株式会社島津製作所 | 波形処理支援装置および波形処理支援方法 |
| WO2022195935A1 (ja) * | 2021-03-19 | 2022-09-22 | 株式会社島津製作所 | 学習用データ作成方法及び学習用データ作成装置 |
| JPWO2022195935A1 (ja) * | 2021-03-19 | 2022-09-22 | ||
| EP4310494A4 (en) * | 2021-03-19 | 2024-09-11 | Shimadzu Corporation | TRAINING DATA GENERATING METHOD AND TRAINING DATA GENERATING APPARATUS |
| JP7616350B2 (ja) | 2021-03-19 | 2025-01-17 | 株式会社島津製作所 | 学習用データ作成方法及び学習用データ作成装置 |
| JP2023135276A (ja) * | 2022-03-15 | 2023-09-28 | 株式会社島津製作所 | 学習方法、および学習プログラム |
| JP7841297B2 (ja) | 2022-03-15 | 2026-04-07 | 株式会社島津製作所 | 学習方法、および学習プログラム |
| US12625119B2 (en) | 2022-03-15 | 2026-05-12 | Shimadzu Corporation | Training method |
Also Published As
| Publication number | Publication date |
|---|---|
| CN113167777A (zh) | 2021-07-23 |
| JP7056750B2 (ja) | 2022-04-19 |
| US12571779B2 (en) | 2026-03-10 |
| JPWO2020070786A1 (ja) | 2021-09-02 |
| CN113167777B (zh) | 2024-01-05 |
| US20220128532A1 (en) | 2022-04-28 |
Similar Documents
| Publication | Publication Date | Title |
|---|---|---|
| JP7056750B2 (ja) | 識別器の生成方法 | |
| US11302039B2 (en) | Waveform analyzer | |
| JP6245387B2 (ja) | 3次元スペクトルデータ処理装置及び処理方法 | |
| CN111316095B (zh) | 波形分析装置 | |
| CN108780074B (zh) | 色谱数据处理方法以及色谱数据处理装置 | |
| JP6156501B2 (ja) | クロマトグラムデータ処理装置 | |
| JP6037040B2 (ja) | クロマトグラムデータ処理装置 | |
| JP5962845B2 (ja) | クロマトグラムデータ処理装置及び処理方法 | |
| CN115856180B (zh) | 数据处理方法及数据处理系统 | |
| CN109073615A (zh) | 数据处理装置 | |
| JP6036838B2 (ja) | 包括的2次元クロマトグラフ用データ処理装置 | |
| US20150198569A1 (en) | Mass analysis method and mass analysis system | |
| WO2001023880A1 (en) | Method and apparatus for chromatographic data processing, and chromatograph | |
| CN107615059B (zh) | 色谱数据处理装置以及程序 | |
| JP5742749B2 (ja) | クロマトグラフ用データ処理装置及びデータ処理方法 | |
| Stevenson et al. | Cumulative area of peaks in a multidimensional high performance liquid chromatogram | |
| JPH11326304A (ja) | クロマトグラフ用データ処理装置 | |
| JP2020064060A (ja) | 解析方法、解析装置、解析プログラム、及び標準シェイプの生成方法 | |
| JP2936700B2 (ja) | クロマトグラムピークの成分純度測定装置 | |
| JP2016017941A (ja) | クロマトグラフ用データ処理装置及びデータ処理方法並びにクロマトグラフ分析システム | |
| JP3648883B2 (ja) | クロマトグラフ用データ処理装置 | |
| JP2015200532A (ja) | 信号波形データ処理装置 | |
| JP2023049244A (ja) | 分析法開発支援方法及び分析法開発支援プログラム | |
| JP2017223670A (ja) | 液体クロマトグラフおよび液体クロマトグラフの検出器出力値変動補正手段 | |
| US20250334555A1 (en) | Waveform-Analyzing Method and Waveform-Analyzing Device |
Legal Events
| Date | Code | Title | Description |
|---|---|---|---|
| 121 | Ep: the epo has been informed by wipo that ep was designated in this application |
Ref document number: 18936004 Country of ref document: EP Kind code of ref document: A1 |
|
| ENP | Entry into the national phase |
Ref document number: 2020550973 Country of ref document: JP Kind code of ref document: A |
|
| NENP | Non-entry into the national phase |
Ref country code: DE |
|
| 122 | Ep: pct application non-entry in european phase |
Ref document number: 18936004 Country of ref document: EP Kind code of ref document: A1 |
|
| WWG | Wipo information: grant in national office |
Ref document number: 17218861 Country of ref document: US |