WO2020054473A1 - 電解質濃度測定装置 - Google Patents
電解質濃度測定装置 Download PDFInfo
- Publication number
- WO2020054473A1 WO2020054473A1 PCT/JP2019/034355 JP2019034355W WO2020054473A1 WO 2020054473 A1 WO2020054473 A1 WO 2020054473A1 JP 2019034355 W JP2019034355 W JP 2019034355W WO 2020054473 A1 WO2020054473 A1 WO 2020054473A1
- Authority
- WO
- WIPO (PCT)
- Prior art keywords
- potential
- response curve
- ion
- electrode
- unit
- Prior art date
Links
Images


Classifications
-
- G—PHYSICS
- G01—MEASURING; TESTING
- G01N—INVESTIGATING OR ANALYSING MATERIALS BY DETERMINING THEIR CHEMICAL OR PHYSICAL PROPERTIES
- G01N27/00—Investigating or analysing materials by the use of electric, electrochemical, or magnetic means
- G01N27/26—Investigating or analysing materials by the use of electric, electrochemical, or magnetic means by investigating electrochemical variables; by using electrolysis or electrophoresis
- G01N27/416—Systems
- G01N27/4163—Systems checking the operation of, or calibrating, the measuring apparatus
-
- G—PHYSICS
- G01—MEASURING; TESTING
- G01N—INVESTIGATING OR ANALYSING MATERIALS BY DETERMINING THEIR CHEMICAL OR PHYSICAL PROPERTIES
- G01N27/00—Investigating or analysing materials by the use of electric, electrochemical, or magnetic means
- G01N27/26—Investigating or analysing materials by the use of electric, electrochemical, or magnetic means by investigating electrochemical variables; by using electrolysis or electrophoresis
- G01N27/416—Systems
- G01N27/4166—Systems measuring a particular property of an electrolyte
-
- G—PHYSICS
- G01—MEASURING; TESTING
- G01N—INVESTIGATING OR ANALYSING MATERIALS BY DETERMINING THEIR CHEMICAL OR PHYSICAL PROPERTIES
- G01N27/00—Investigating or analysing materials by the use of electric, electrochemical, or magnetic means
- G01N27/26—Investigating or analysing materials by the use of electric, electrochemical, or magnetic means by investigating electrochemical variables; by using electrolysis or electrophoresis
- G01N27/28—Electrolytic cell components
- G01N27/30—Electrodes, e.g. test electrodes; Half-cells
- G01N27/301—Reference electrodes
-
- G—PHYSICS
- G01—MEASURING; TESTING
- G01N—INVESTIGATING OR ANALYSING MATERIALS BY DETERMINING THEIR CHEMICAL OR PHYSICAL PROPERTIES
- G01N27/00—Investigating or analysing materials by the use of electric, electrochemical, or magnetic means
- G01N27/26—Investigating or analysing materials by the use of electric, electrochemical, or magnetic means by investigating electrochemical variables; by using electrolysis or electrophoresis
- G01N27/28—Electrolytic cell components
- G01N27/30—Electrodes, e.g. test electrodes; Half-cells
- G01N27/333—Ion-selective electrodes or membranes
Definitions
- the present invention relates to an electrolyte concentration measuring device for measuring the concentration of an electrolyte in a liquid.
- An automatic analyzer is known as an apparatus for analyzing a sample containing a protein contained in a specimen such as blood or urine with high accuracy and high throughput.
- An electrolyte concentration measuring device is often mounted on such an automatic analyzer, but there are also a composite measuring device with blood gas and the like, and an electrolyte concentration measuring device alone.
- the electrolyte concentration measuring device is configured to analyze electrolyte components such as sodium (Na) ions, potassium (K) ions, and chlorine (Cl) ions in a sample.
- ISE method measures an electrolyte concentration in a sample by measuring a potential difference between an ion-selective electrode (ISE electrode) and a reference electrode that generates a reference potential.
- ISE electrode ion-selective electrode
- the ion-selective electrode includes an ion-sensitive membrane that generates a potential difference in response to an ionic component.
- these electrodes are consumables, for example, have a useful life of 2-3 months or thousands of tests and are replaced with new electrodes.
- reagents are constantly used in the electrolyte concentration measuring device.
- the type of reagent to be used varies depending on the device configuration, and includes, for example, an internal standard solution, a diluting solution for diluting the sample, and a comparative electrode solution supplied to the comparative electrode and forming a liquid junction with the sample solution.
- Patent Literature 1 in order to manage an electrode from manufacture to life, the type of ion to be measured, the expiration date after manufacture of the electrode, the number of days of use by the current user of the electrode, the number of measurement samples of the electrode, The electrode sensitivity (latest sensitivity measurement result), electrode accuracy (latest accuracy measurement result), electrode accuracy (latest accuracy measurement result), and electrode potential (latest potential measurement result) are described. It has an information table, and calculates a prediction of the performance life (replacement time) of the electrode based on each information stored in the information table and a calculation formula or a criterion provided in advance by the manufacturer or the user. Techniques are disclosed.
- Patent Document 2 discloses a technique in which potential data from suction of a sample liquid to stabilization of the potential are measured before and after suction. A technique is disclosed in which, when the value falls outside the allowable range calculated from the value of the potential difference of the sample solution, the analysis data of the sample after suction is abnormal.
- the timing of replacing various components and electrodes is determined based on the set period and the number of samples to be analyzed.
- a slope (slope) of the calibration curve, an electromotive force, a change in measurement reproducibility, and the like are also used as a material for determining the timing of replacement.
- the present invention is capable of accurately detecting various signs of abnormality of an apparatus while operating the apparatus, enabling optimization of maintenance frequency and calibration frequency, and improving substantial throughput. It is an object of the present invention to provide an electrolyte concentration measuring device capable of performing the following.
- An electrolyte concentration measurement device is an electrolyte concentration measurement device for measuring the concentration of ions in a liquid, wherein the liquid is supplied with an ion-selective electrode, a reference electrode serving as a potential reference, and the ion-selectivity.
- a potential measuring unit for acquiring the potential of the electrode, a concentration calculating unit for calculating the concentration of ions contained in the liquid from the potential acquired by the potential measuring unit, and a potential for monitoring the potential of the ion-selective electrode.
- a potential monitoring unit that generates a response curve
- a timing signal acquisition unit that acquires a timing signal related to the timing of various operations
- a potential response curve analysis that detects an abnormality sign of the device based on the relationship between the potential response curve and the timing signal Unit.
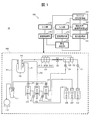
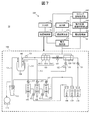
- FIG. 1 is a schematic diagram illustrating an example of a flow-type electrolyte concentration measurement device 10 according to a first embodiment. It is a flow chart explaining a procedure of measurement of an electrolyte concentration measuring device concerning a 1st embodiment.
- 5 is an example of a graph of a potential response curve acquired by a potential monitoring unit.
- FIG. 1 is a schematic diagram illustrating an example of a flow-type electrolyte concentration measurement device 10 according to the first embodiment.
- the electrolyte concentration measuring device 10 is generally constituted by a measuring unit 100 and a calculation control unit 200.
- the electrolyte concentration measuring device 10 measures the potential difference between the electrodes by alternately performing the measurement of the sample and the measurement of the internal standard solution, and can measure the concentration of a specific ion in the sample using the potential difference and the calibration curve. It is configured.
- the electrolyte concentration measuring apparatus 10 physically deteriorates the electrodes and the like and controls the slow leak of the solenoid valve based on a timing signal instructing a predetermined operation and a potential response curve indicating a potential change.
- the apparatus is configured to be able to detect an abnormality of the apparatus including the above.
- the measuring unit 100 includes an ion-selective electrode 101, a comparative electrode 102, a pinch valve 103, a dilution tank 104, a syringe pump 105 for an internal standard solution, a syringe pump 106 for a diluent solution, a sipper syringe pump 107, an internal standard solution bottle 108, A liquid bottle 109, a comparative electrode liquid bottle 110, a waste liquid tank 111, and a vacuum pump 112 are provided.
- the ion-selective electrode 101 includes, for example, a chlorine ion electrode 101A, a potassium ion electrode 101B, and a sodium ion electrode 101C.
- the ion-selective electrode 101 is supplied with a diluted sample liquid (diluted sample liquid) or an internal standard solution mixed with a diluent from a dilution tank 104 via a sipper nozzle N0.
- the comparative electrode 102 is supplied with a comparative electrode solution as described later.
- the comparative electrode solution is stored in the comparative electrode solution bottle 110, and is discharged to the comparative electrode 102 via a flow path provided with an electromagnetic valve V1 as appropriate.
- the chlorine ion electrode 101A, the potassium ion electrode 101B, and the sodium ion electrode 101C may be collectively referred to as "ion-selective electrodes 101A to 101C".
- the pinch valve 103 switches between opening and shutting off a flow path connecting the ion-selective electrode 101 and the comparative electrode 102.
- the dilution tank 104 is filled with a sample solution diluted with a diluent or an internal standard solution.
- the internal standard liquid syringe pump 105 is a pump for discharging the internal standard liquid toward the dilution tank 104.
- the internal standard solution is stored in an internal standard solution bottle 108 and is discharged to the dilution tank 104 by the internal standard solution syringe pump 105.
- An electromagnetic valve V2 is provided in a flow path connecting the internal standard solution bottle 108 and the internal standard solution syringe pump 105, and an electromagnetic valve V3 is provided in the internal standard solution nozzle N1.
- the internal standard solution nozzle N1 may be provided with a pre-heater (not shown) for heating the internal standard solution.
- the diluent syringe pump 106 is a pump for discharging the diluent toward the diluting tank 104.
- the diluent is stored in a diluent bottle 109 and is discharged to the diluting tank 104 by the diluent syringe pump 106.
- An electromagnetic valve V4 is provided in a flow path connecting the diluent bottle 109 and the diluent syringe pump 106, and an electromagnetic valve V5 is provided in the shipper nozzle N2.
- the sipper nozzle N2 may be provided with a preheater (not shown) for heating the diluent.
- the internal standard solution nozzle N1 and the shipper nozzle N2 can be inserted into and removed from the dilution tank 104 as needed.
- the sipper syringe pump 107 is a pump that operates when sucking a sample liquid or the like from the dilution tank 104 to the ion-selective electrode 101 side.
- the pinch valve 103 is also opened. The sample liquid sucked by the sipper syringe pump 107 is discarded as waste liquid toward the waste liquid tank 111.
- the sipper syringe pump 107 also operates when the comparative electrode solution is sucked toward the comparative electrode 102 and when the comparative electrode solution is sucked from the comparative electrode 102 and discarded.
- the electromagnetic valve V8 in the flow path between the comparison electrode 102 and the sipper syringe pump 107 and the electromagnetic valve V7 between the sipper syringe pump 107 and the waste liquid tank 111 are opened, while the pinch valve 103 is closed.
- the vacuum pump 112 operates when the waste liquid is further discharged from the waste liquid tank 111 to the outside.
- the arithmetic control unit 200 includes a potential measurement unit 171, a concentration calculation unit 172, an output unit 174, a device control unit 175, an input unit 176, a potential monitoring unit 181, a timing signal acquisition unit 182, a potential response curve analysis unit 183, The data storage unit 184 is provided.
- the potential measuring unit 171 has a function of measuring a potential difference (electromotive force) between the ion-selective electrodes 101A to 101C and the comparison electrode 102. More specifically, the potential measuring section 171 has a function of measuring a stable potential after a certain time has elapsed from the introduction of the liquid into the flow paths of the ion-selective electrodes 101A to 101C.
- the concentration calculating section 172 calculates the concentration of specific ions (Cl ⁇ , K + , Na + ) in the diluted sample solution or the internal standard solution based on the potential difference calculated by the potential measuring section 171.
- the output unit 174 includes a display and the like for outputting the calculation result and the like in the density calculation unit 172.
- the device control unit 175 controls the measurement unit 100.
- the input unit 176 is an interface for inputting various data or commands to the device control unit 175.
- the potential monitoring unit 181 continuously monitors the potentials of the ion-selective electrodes 101A to 101C and generates a potential response curve indicating a temporal change of the monitored potential. More specifically, the potential monitoring unit 181 has a function of monitoring a transient potential change (potential response curve) from the introduction of the liquid to the flow path of the ion-selective electrodes 101A to 101C until the liquid is discharged. .
- transient is different from the timing at which a stable measured potential is obtained, and is a temporary potential change caused by the actual operation of various parts, the flow of liquid in a pipe, or the diffusion of a substance or liquid. Means significant change.
- the timing signal acquisition unit 182 acquires various timing signals output from the device control unit 175 to the measurement unit 100.
- the potential response curve analysis unit 183 has a function of analyzing the potential response curve generated by the potential monitoring unit 181.
- the potential response curve analysis unit 183 also acquires the above-described timing signal from the timing signal acquisition unit 182 and associates the timing signal with the potential response curve. More specifically, the potential response curve analysis unit 183 determines a physical change of the electrode and a sign of deterioration of the various mechanisms from the waveforms of the potential response curves during and immediately after the operation of the various mechanisms.
- the potential response curve analysis unit 183 determines the surface of the ion-sensitive membrane of the ion-selective electrode 101 from the waveform of the potential response curve when the operation of the various mechanisms related to the movement of the liquid in the liquid flow path is stopped. To determine the contamination.
- the reference electrode solution introduced into the flow path of the reference electrode 102 and the diluted analyte solution (or internal standard solution) introduced into the ion-selective electrode 101 come into contact at the liquid junction 120 to form a liquid junction. .
- This liquid junction electrically connects the ion-selective electrode 101 and the comparative electrode 102.
- the potential difference (electromotive force) between each ion-selective electrode 101 and the comparison electrode 102 is determined by the analysis target ion of the diluted sample liquid (or the internal standard liquid) introduced into the flow path of the ion-selective electrode 101. Varies with concentration.
- the electromotive force can be measured by the potential measuring unit 171, and the ion concentration can be calculated by the concentration calculating unit 172. Details of the calculation method will be described later.
- FIG. 2A shows a procedure at the time of starting the apparatus
- FIG. 2B shows a procedure in the case where the sample and the internal standard solution are alternately and continuously measured after the apparatus is started (“continuous analysis”). Is shown.
- the power supply (not shown) is turned on to start up the apparatus 10 (step S201), and the reagent bottles 108, 109, and 110 are installed (step S202). Thereafter, the reagent in the reagent bottle is initially charged (reagent prime) into the device 10 (step S203).
- Step S204 After the completion of the temperature adjustment, the internal standard solution is continuously measured (Step S204), and it is confirmed that the potential of the electrode is stable. Subsequently, in order to obtain a calibration curve for the ion-selective electrodes 101A to 101C, two kinds of standard solutions having known concentrations (high concentration (H) and low concentration (L)) were measured, and the slope sensitivity SL of the calibration curve was determined. It is calculated (step S205). Subsequently, the concentration Cis of the internal standard solution is calculated based on the slope sensitivity SL obtained in step S205 and the measured electromotive force (step S206).
- a timing signal for operating the various pumps 105 to 107, the solenoid valve, and other various driving units in the electrolyte concentration measuring device 10 is output from the device control unit 175.
- the timing signal is acquired by the timing signal acquisition unit 182.
- the potentials of the ion-selective electrodes 101A to 101C fluctuate, and the fluctuations are monitored by the potential monitoring unit 181.
- the monitored potential data is also transmitted to the timing signal acquisition unit 182, and is subjected to data processing in association with the timing signal.
- the potential response curve analysis unit 183 generates a potential response curve according to the data of the potential, and associates the timing signal with the potential response curve to analyze the characteristics of the potential response curve at each timing.
- steps S205 and S206 will be described.
- a standard solution (L) having a known low concentration (concentration CL ) is dispensed into the dilution tank 104
- the diluent in the diluent bottle 109 is further dispensed into the dilution tank 104 using the diluent syringe pump 106
- a known low concentration standard solution (L) is diluted at the set ratio D1.
- the sipper syringe pump 107 is operated to suck the diluted known low-concentration standard solution (L) in the diluting tank 104 through the sipper nozzle N0 and introduce it into the flow paths of the ion-selective electrodes 101A to 101C. I do. Further, the reference electrode solution is introduced into the flow path of the reference electrode 102 from the inside of the reference electrode solution bottle 110.
- each potential difference (electromotive force EMF L of the known low-concentration standard solution (L)) between the ion-selective electrodes 101A to 101C and the reference electrode 102 is measured by the potential measurement unit 171.
- the standard solution (L) remaining in the dilution tank 104 is sucked by the vacuum suction nozzle N3 and discarded in the waste liquid tank 111. Thereafter, the internal standard solution in the internal standard solution bottle 108 is newly dispensed into the dilution tank 104 by using the internal standard solution syringe pump 105. Then, the internal standard solution in the dilution tank 104 is sucked using the sipper syringe pump 107, and the flow paths of the ion-selective electrodes 101A to 101C are filled with the internal standard solution. Subsequently, the comparative electrode solution is introduced from the comparative electrode solution bottle 110 into the flow path of the comparative electrode 102.
- the electromotive force (measured electromotive force EMF IS of the internal standard solution) of the ion-selective electrodes 101A to 101C in the state where the internal standard solution and the reference electrode solution are filled is set to the The measurement is performed by the measurement unit 171.
- the measurement unit 171 the internal standard solution remaining in the dilution tank 104 is sucked by the vacuum suction nozzle N3 and discarded in the waste liquid tank 111.
- a standard solution (H) having a known concentration (C H ) is dispensed into the dilution tank 104, and the diluent in the diluent bottle 109 is dispensed into the dilution tank 104 using the diluent syringe pump 106.
- a known high concentration standard solution (H) is diluted at the set ratio D1.
- the standard solution (H) having a known high concentration diluted in the dilution tank 104 is sucked from the sipper nozzle N0 and introduced into the flow paths of the ion-selective electrodes 101A to 101C. Further, the reference electrode solution is introduced into the flow path of the reference electrode 102 from the inside of the reference electrode solution bottle 110.
- the reference electrode solution comes into contact with the diluted standard solution (H) having a known high concentration. Thereafter, each potential difference between the ion-selective electrodes 101A to 101C and the reference electrode 102 (the electromotive force EMF H of the known high-concentration standard solution (H)) is measured by the potential measurement unit 171.
- the standard solution (H) remaining in the dilution tank 104 is sucked by the vacuum suction nozzle N3 and discarded in the waste liquid tank 111. Thereafter, the internal standard solution in the internal standard solution bottle 108 is newly dispensed into the dilution tank 104 using the internal standard solution syringe pump 105. Then, the internal standard solution in the dilution tank 104 is sucked using the sipper syringe pump 107, and the flow paths of the ion-selective electrodes 101A to 101C are filled with the internal standard solution.
- the reference electrode solution is introduced into the flow path of the reference electrode 102 from the inside of the reference electrode solution bottle 110.
- the electromotive force of the ion-selective electrodes 101A to 101C is measured by the potential measuring unit 171.
- the internal standard solution remaining in the dilution tank 104 is sucked by the vacuum suction nozzle N3 and discarded in the waste liquid tank 111.
- the concentration calculating unit 172 calculates the slope sensitivity SL of the calibration curve using the following equation (1).
- E E0 + 2.303 ⁇ (RT / zF) ⁇ log (f ⁇ C) (2)
- E0 constant potential determined by the measurement system z: valence of the ion to be measured
- F Faraday constant
- R gas constant
- T absolute temperature
- f activity coefficient
- C ion concentration
- the slope sensitivity SL can be obtained by calculation from the absolute temperature T and the valence z of the ion to be measured. However, in order to further improve the analysis accuracy, in the first embodiment, the above-described calibration is performed by executing the above calibration. The slope sensitivity SL unique to the electrode is determined.
- the concentration Cis of the internal standard solution is obtained by the following equations (3) and (4) by the measured electromotive force EMF IS of the internal standard solution.
- the calibration procedure is not limited to the above.
- the measurement of the known high concentration standard solution is performed after the measurement of the known low concentration standard solution, but this order may be reversed.
- each potential difference (electromotive force EMF S of the sample) between the ion-selective electrodes 101A to 101C and the reference electrode 102 is measured by the potential measuring unit 171 to analyze the diluted sample solution (step S211). .
- the diluted sample liquid remaining in the dilution tank 104 is sucked by the vacuum suction nozzle N3 and discarded in the waste liquid tank 111. Thereafter, an internal standard solution is newly dispensed from the internal standard solution bottle 108 into the dilution tank 104 by using the internal standard solution syringe pump 105. Then, the internal standard solution in the dilution tank 104 is sucked using the sipper syringe pump 107, and the flow paths of the ion-selective electrodes 101A to 101C are filled with the internal standard solution.
- the reference electrode solution is introduced into the flow path of the reference electrode 102 from the inside of the reference electrode solution bottle 110. Thereafter, the electromotive force of each electrode is measured by the potential measuring unit 171 and the internal standard solution is analyzed (step S212).
- the sample concentration is calculated according to the result. From the slope sensitivity SL and the concentration Cis of the internal standard solution, the concentration Cs of the sample is calculated using the following formula (step S213).
- the measurement of the internal standard solution having a constant concentration is also performed before and after the measurement of the diluted sample solution. Then, the measured value of the diluted sample solution is corrected based on the measured value of the internal standard solution. Therefore, accurate measurement can be realized even if a gradual potential change (potential drift phenomenon) occurs due to a change in the surface of the sensitive film of the ion-selective electrodes 101A to 101C or a change in temperature.
- timing signals for operating the various pumps 105 to 107, the solenoid valves V1 to V8, and other various driving units in the electrolyte concentration measuring device 10 are output from the device control unit 175. .
- the timing signal is acquired by the timing signal acquisition unit 182.
- steps S201 to S206 the potentials of the ion-selective electrodes 101A to 101C fluctuate, and the fluctuations are continuously monitored by the potential monitoring unit 181.
- the data of the potential response curve which is the data of the monitored potential, is also transmitted to the timing signal acquisition unit 182, and is subjected to data processing in association with the timing signal.
- the potential response curve analysis unit 183 associates this potential response curve with the timing signal, acquires and analyzes the characteristic amount of the potential response curve at each timing.
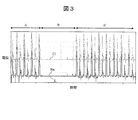
- FIG. 3 shows an example of a graph of a potential response curve obtained by the potential monitoring unit 181.
- the horizontal axis represents time, and the vertical axis represents potential.
- the potential of the chloride ion electrode 101A, the potential of the sodium ion electrode 101C, and the potential of the potassium ion electrode 101B are shown in descending order of potential.
- sections A and A ′ are measurement sections in which a diluted sample solution or an internal standard solution is measured
- section B is a temporary suspension section, including a return operation to the measurement section. That is, the sections A and A 'are measurement sections that are continuously executed with the temporary pause section B interposed therebetween.
- FIG. 3 shows only two measurement sections A and A ', such measurement sections A and A' can be executed a plurality of times.
- the internal standard solution and the diluted sample solution are alternately analyzed.
- the flow path is once shut off by the pinch valve 103.
- the ion-selective electrodes 101A to 101C are used.
- 101C sometimes shows a high potential.
- an air gap is introduced for segmentation between the diluted sample solution and the internal standard solution. In this case, too, the potentials of the ion-selective electrodes 101A to 101C may fluctuate greatly.
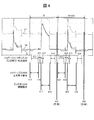
- FIG 4 shows an enlarged view of a part of the potential response curve in the measurement section A acquired by the potential monitoring unit 181 and the timing signal acquired by the timing signal acquiring unit 182 in a superimposed manner.
- the potential measuring unit 171 measures the potentials of the internal standard solution and the diluted sample solution at timings 401 and 402 at which the potential is relatively stable. At each of the timings 401 and 402, not only data at one point but also potentials can be measured a plurality of times at short time intervals, and an average value thereof can be obtained.
- the concentration calculation section 172 calculates the sample concentration using the data of the potential.
- the potential monitoring unit 181 can acquire the potential at intervals of 10 ms (sampling rate), for example. Note that the acquisition interval at the potential monitoring unit 181 can be changed, but acquisition at an interval shorter than 100 ms is suitable for monitoring a transient potential at the time of a pressure change or the like.
- the sampling rate in the potential monitoring unit 181 does not need to be always constant, and may be changed as appropriate.
- the sampling rate in the potential monitoring unit 181 may be set to a specific value only at the timing when the device component, electrode, or the like of interest operates, and may be set to a different value in other cases. Further, the sampling rate may be changed according to the type of the device component or the electrode of interest or the state of operation.
- the deterioration mode may be set, the timing at which the state change can be monitored is determined in advance, and only the potential before and after the timing is obtained by the timing signal obtaining unit 182 may be obtained by the potential monitoring unit 181.
- the sipper nozzle N0 descends into the dilution tank 104 filled with the internal standard solution (415), and the tip of the shipper nozzle N0 enters the internal standard solution in the dilution tank 104. Thereafter, the sipper syringe pump 107 is operated, and the internal standard solution is sucked from the dilution tank 104 via the sipper nozzle N0 (411) and introduced into the measurement flow paths of the ion-selective electrodes 101A to 101C.
- the tip of the sipper nozzle N0 is raised to separate the tip from the level of the internal standard solution (416), and thereafter, the air gap is introduced into the measurement flow channel by suction with the sipper syringe pump 107 (412). Thereafter, the pinch valve is closed (417), the sipper syringe pump 107 is operated again, the comparative electrode liquid is sucked from the comparative electrode liquid bottle 110 (413), and the comparative electrode liquid is introduced into the flow path of the comparative electrode 102. .
- the pinch valve is opened again (418), and after a certain period of time, the potentials of the ion-selective electrodes 101A to 101C are measured by the potential measuring unit 171 (401).
- the electromagnetic valve V8 and the like connected to the measurement flow path are closed, and the liquid in the sipper syringe pump 107 is discharged (414).
- the sample is diluted with the diluent supplied from the diluent tank 109. Thereafter, the shipper nozzle N0 descends into the dilution tank 104 filled with the diluted sample liquid (425), and the tip of the shipper nozzle N0 enters the diluted sample liquid in the dilution tank 104.
- the sipper syringe pump 107 is operated, the diluted sample liquid is sucked from the dilution tank 104 via the sipper nozzle N0 (421), and the diluted sample liquid is introduced into the measurement flow path of the ion-selective electrodes 101A to 101C. .
- the tip of the sipper nozzle N0 is raised to separate the tip from the liquid surface of the diluted sample liquid (426), and thereafter, the air gap is introduced into the measurement flow path by sucking with the sipper syringe pump 107 (422).
- the pinch valve is closed (427), the sipper syringe pump 107 is operated again, the comparative electrode solution is sucked from the comparative electrode solution bottle 110 (423), and the comparative electrode solution is introduced into the flow path of the comparative electrode 102.
- the pinch valve is opened again (428), and after a certain period of time, the potentials of the ion-selective electrodes 101A to 101C are measured by the potential measuring unit 171 (402).
- the electromagnetic valve V8 and the like connected to the measurement flow path are closed, and the liquid in the sipper syringe pump 107 is discharged (424).
- the timing signals (411 to 428) for instructing the start and end of the driving of the various members as described above are acquired from the device control unit 175 by the timing signal acquisition unit 182.
- the acquired timing signal is sent to the potential response curve analyzer 183.
- a timing signal for instructing opening and closing of the solenoid valves V1 to V8 a timing signal for instructing a dispensing operation in the dilution tank 104, and a timing for instructing a vacuum suction operation Signals and the like are also output from the device control unit 175 and acquired by the timing signal acquisition unit 182.
- the potential monitoring unit 181 can be configured to monitor the potential not only during the continuous analysis of the measurement sections A and A ′ in FIG. 3 but also during the temporary pause section B, the apparatus startup, and the calibration. .
- various information can be read by recording the timing signals 411 to 428 and the potential response curves obtained by the potential monitoring unit 181 in a time-series manner. For example, when the shipper nozzle N0 descends or rises, a potential change that appears to be caused by contact with the liquid in the dilution tank 104 or vibration of the liquid in the flow path appears on the potential response curve. Also, the suction / discharge operation of the sipper syringe pump 107 causes vibration to be transmitted to various electrodes and other components, thereby changing the potential of the potential response curve.
- the transient state acquired by the potential monitoring unit 181 is obtained. From the potential, information such as pressure fluctuation, vibration, and electrical noise can be obtained as well as the ion concentration and temperature in the liquid.
- the state (degree of deterioration, failure, etc.) of a component or an electrode to be operated at that time becomes clear from the analysis result of the potential response curve. For example, based on a potential change appearing in a potential response curve when a timing signal instructing closing of the pinch valve 103 is output, the degree of deterioration of a tube in the pinch valve 103, the presence or absence of a failure of the pinch valve 103 itself, and the like. Can be determined.
- the potential response before and after the internal standard solution, an ionic solution having a known concentration different from the internal standard solution, or an ionic solution containing interfering ions is sucked into the flow path of the ion selective electrodes 101A to 101C together with a predetermined timing signal. From the curves, it is possible to determine the contamination state of the sensitive membrane surfaces of the ion-selective electrodes 101A to 101C.
- the measurement channel is refreshed by cleaning the electrode channel including the sensitive membrane surface with a cleaning liquid during maintenance. be able to.
- any of the ion-selective electrodes 101A to 101C has a sign of deterioration or failure.
- a similar peculiar change appears in all the potentials of the ion-selective electrodes 101A to 101C, it is a sign of an abnormality not in the ion-selective electrodes 101A to 101C but in other components in the apparatus or the comparative electrode 102. It can be determined that there is a high possibility that the event has occurred.
- the ⁇ ⁇ potential response curve analysis unit 183 is provided with a data storage unit 184, which stores library data relating to the characteristic amount of the potential response curve.
- the library data is a set of data relating to various characteristic amounts relating to a standard potential response curve that may be obtained when the device is in a normal state.
- the potential response curve analysis unit 183 compares the characteristic amount of the library data with the characteristic amount of the potential response curve obtained as a result of the measurement at the timing when each timing signal is output. Thereby, it is possible to determine the state of deterioration of various electrodes and device parts, the surface contamination of the sensitive films of the ion-selective electrodes 101A to 101C, and the like.
- the library data may be standard data obtained as a result of simulation, or a potential response curve obtained immediately after the user first installs and operates the device 10 may be used as the library data.
- the library data can be appropriately updated based on the result of the measurement performed thereafter. Vibration and electric noise due to the environment and the like may differ depending on the installation location of the device 10. Therefore, it is expected that the accuracy of the abnormality sign will be improved by actually operating the device 10 and obtaining the library data.
- the library may be uploaded or downloaded via a network or the like.
- the timing signal indicating the timing of various operations is associated with the potential response curve obtained by measuring the potential of the ion-selective electrode.
- a sign of abnormality is detected and predicted, so that maintenance can be planned before abnormality appears in the measured potential, and then maintenance can be performed according to the plan.
- the potential response curve analysis unit 183 the physical change of the ion-selective electrode 101 and the deterioration of the various mechanism units are determined based on the waveforms of the potential response curves during and immediately after the operation of the various mechanism units due to the timing signal. Sign can be determined.
- the potential response curve analysis unit 183 detects the ion-selective electrode 101 based on the waveform of the potential response curve when the operation of various mechanisms related to the movement of the liquid in the liquid flow path due to the timing signal is stopped. Of the surface of the ion-sensitive membrane can be determined.
- a method of analyzing the potential response curve a general method used in analyzing time-series data can be used, and machine learning, deep learning, and the like can also be used.
- the behavior of various components and other components in the device that are affected by the operation of the electrodes according to the timing signal is predicted or simulated from the device configuration and physical equations, and the results are used to analyze the potential response curve. Can also.
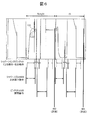
- FIG. 5 shows a potential response curve (NA1) obtained by measuring a predetermined sample liquid with the sodium ion electrode 101Ce whose storage expiration date has passed, and a relatively new sodium ion electrode 101Cn whose storage expiration date has not yet passed.
- the potential response curve (NA2) obtained by measuring the same sample liquid is shown.
- FIG. 5 also shows the timing of the suction / discharge operation of the sipper syringe pump 107, the timing of raising / lowering the sipper nozzle N0, and the timing signal for instructing the timing of the opening / closing operation of the pinch valve 103.
- the slope sensitivity of the old sodium ion electrode 101Ce was 59.2 mV / digit
- the slope sensitivity of the new sodium ion electrode 101Cn was 60.0 mV / digit, both of which were within the allowable range.
- both the potential response curve NA1 obtained by the old sodium ion electrode 101Ce and the potential response curve NA2 obtained by the new sodium ion electrode 101Cn provided measurement accuracy within an allowable range.
- the output unit 174 issues a warning to the operator to replace the sodium ion electrode 101 Ce at the next maintenance of the apparatus.
- the measurement accuracy is within the allowable range, it can be determined that there is a sign of abnormality by analyzing the shape of the potential response curve. By detecting a sign of an abnormality in this manner, the operator can accurately formulate a maintenance plan and execute maintenance according to the plan.
- FIG. 6 shows a potential response curve (Cl1) obtained by measuring a predetermined sample liquid with the chloride ion electrode 101Ae having the first state as the surface state of the ion-sensitive membrane, and a second state different from the first state.
- Cl1 a potential response curve obtained by measuring a predetermined sample liquid with the chloride ion electrode 101Ae having the first state as the surface state of the ion-sensitive membrane, and a second state different from the first state.
- 3 shows a potential response curve (Cl2) obtained by measuring the same sample liquid with the chloride ion electrode 101An having the state of FIG.
- FIG. 6 also shows the timing of the suction / discharge operation of the sipper syringe pump 107, the timing of raising / lowering the sipper nozzle N0, and the timing signal for instructing the timing of the opening / closing operation of the pinch valve 103.
- FIG. 6 is a graph when an aqueous solution containing interfering ions is measured as a measurement target (sample).
- the shape characteristic of the waveform in the potential response curve at the timing when the timing signal is output (the presence / absence of a convex peak, its amplitude, and width) is calculated as the characteristic amount, and is compared with the reference value. Signs can be determined.
- the difference between the waveforms of the potential response curves Cl1 and Cl2 at the time of sample aspiration and after the aspiration is due to the difference in the state of the ion-sensitive membrane surfaces of the chloride ion electrodes 101Ae and 101An, or the difference in the ion balance in the ion-sensitive membrane. It is considered to be based on
- FIG. 7 is a schematic diagram illustrating an example of a flow-type electrolyte concentration measurement device 10 according to the second embodiment.
- the same components as those in the first embodiment (FIG. 1) are denoted by the same reference numerals, and redundant description is omitted below.
- the electrolyte concentration measuring device 10 includes various sensors for detecting the behavior in the device 10, the detection signals of these sensors are acquired by a timing signal acquiring unit 182, and the potential response curve analyzing unit At 183, the potential response curve is analyzed based on the relevance of the timing signal, the detection signal of the sensor, and the potential response curve, and a sign of abnormality of the device is determined based on the result.
- a bubble sensor 121 that detects bubbles in the pipe and a pressure sensor 122 that is arranged in a flow path connecting the sipper syringe pump 107 and the liquid junction 120 and detects the pressure in the flow path are shown. ing.
- the type of the sensor is not limited to this.
- a liquid level sensor for detecting a change in the liquid level to the dilution tank 104 or the like, a vibration sensor for detecting the vibration of electrodes and other various components, and the like are provided in the apparatus 10.
- the bubble sensor 121 generates a pulse signal when bubbles of a predetermined size or more pass through a predetermined position.
- the pressure sensor 122 generates a pulse signal when the pressure at the measurement point reaches a predetermined value.
- the invention is not limited thereto, and the pressure value may be continuously output as needed.
- FIG. 8 shows an enlarged view of a part of the potential response curve in the measurement section A acquired by the potential monitoring unit 181, the timing signal acquired by the timing signal acquiring unit 182, and the sensor detection signal in a superimposed manner.
- the timing signal output by the device control unit 175 is acquired by the timing signal acquisition unit 182 and is associated with the potential response curve.
- the sensor 121, The sensor detection signal at 122 is also associated with the potential response curve.
- the timing at which the predetermined sensor detection signal is output is related to the timing at which the timing signal is output from the device control unit 175. Therefore, by acquiring the sensor detection signal by the timing signal acquiring unit 182, it is possible to more accurately associate the operation of the device 10 with the potential response curve, and to more accurately determine a sign of abnormality.
- the present invention is not limited to the above embodiment, and includes various modifications.
- the above embodiment has been described in detail for easy understanding of the present invention, and is not necessarily limited to one having all the described configurations.
- a part of the configuration of one embodiment can be replaced with the configuration of another embodiment, and the configuration of one embodiment can be added to the configuration of another embodiment.
- 101 ion-selective electrode
- 101A chloride ion electrode
- 101B potassium ion electrode
- 101C sodium ion electrode
- 102 comparative electrode
- 103 pinch valve
- 104 dilution tank
- 105 syringe pump for internal standard liquid
- 106 ... Syringe pump for diluting liquid
- 107 ... Shipper syringe pump
- 108 Internal standard liquid bottle
- 109 ... Diluting liquid bottle
- 110 Comparative electrode liquid bottle
- 111 ... Waste liquid tank
- 112 ... Vacuum pump
- 120 ... Liquid junction
- 121 ... bubble sensor
- 122 ... pressure sensor
- V1 to V8 ... solenoid valve 171 ...
- potential measuring unit 172 ... concentration calculating unit, 174 ... output unit, 175 ... device control unit, 176 ... input unit, 181 ... potential monitoring unit 182: timing signal acquisition unit; 183: potential response curve analysis unit; 184: data storage unit.
Landscapes
- Chemical & Material Sciences (AREA)
- Life Sciences & Earth Sciences (AREA)
- Health & Medical Sciences (AREA)
- Physics & Mathematics (AREA)
- Chemical Kinetics & Catalysis (AREA)
- Electrochemistry (AREA)
- Molecular Biology (AREA)
- Analytical Chemistry (AREA)
- Biochemistry (AREA)
- General Health & Medical Sciences (AREA)
- General Physics & Mathematics (AREA)
- Immunology (AREA)
- Pathology (AREA)
- Automatic Analysis And Handling Materials Therefor (AREA)
Priority Applications (3)
| Application Number | Priority Date | Filing Date | Title |
|---|---|---|---|
| CN201980046965.5A CN112654862B (zh) | 2018-09-13 | 2019-09-02 | 电解质浓度测量装置 |
| US17/265,698 US11782021B2 (en) | 2018-09-13 | 2019-09-02 | Electrolyte concentration measurement device |
| EP19860479.5A EP3851842A4 (de) | 2018-09-13 | 2019-09-02 | Vorrichtung zur messung der elektrolytkonzentration |
Applications Claiming Priority (2)
| Application Number | Priority Date | Filing Date | Title |
|---|---|---|---|
| JP2018171277A JP6896684B2 (ja) | 2018-09-13 | 2018-09-13 | 電解質濃度測定装置 |
| JP2018-171277 | 2018-09-13 |
Publications (1)
| Publication Number | Publication Date |
|---|---|
| WO2020054473A1 true WO2020054473A1 (ja) | 2020-03-19 |
Family
ID=69776818
Family Applications (1)
| Application Number | Title | Priority Date | Filing Date |
|---|---|---|---|
| PCT/JP2019/034355 WO2020054473A1 (ja) | 2018-09-13 | 2019-09-02 | 電解質濃度測定装置 |
Country Status (5)
| Country | Link |
|---|---|
| US (1) | US11782021B2 (de) |
| EP (1) | EP3851842A4 (de) |
| JP (1) | JP6896684B2 (de) |
| CN (1) | CN112654862B (de) |
| WO (1) | WO2020054473A1 (de) |
Cited By (1)
| Publication number | Priority date | Publication date | Assignee | Title |
|---|---|---|---|---|
| EP4001910A4 (de) * | 2019-07-19 | 2023-08-02 | Hitachi High-Tech Corporation | Analysevorrichtung und analyseverfahren |
Families Citing this family (5)
| Publication number | Priority date | Publication date | Assignee | Title |
|---|---|---|---|---|
| CN116829932A (zh) | 2021-03-02 | 2023-09-29 | 株式会社日立高新技术 | 电解质测定装置及电解质浓度测定单元的异常判定方法 |
| JP2023142443A (ja) * | 2022-03-25 | 2023-10-05 | 株式会社日立ハイテク | 電解質分析装置 |
| JP2023166170A (ja) * | 2022-05-09 | 2023-11-21 | 株式会社日立ハイテク | 分析装置および状態検知方法 |
| WO2024154466A1 (ja) * | 2023-01-16 | 2024-07-25 | 株式会社堀場アドバンスドテクノ | イオン濃度測定装置、イオン濃度測定プログラム、イオン濃度測定方法、測定装置、及び、測定方法 |
| CN117607227B (zh) * | 2023-11-27 | 2024-06-21 | 南京机电职业技术学院 | 基于深度学习的电解质分析仪实时监测与异常预警方法 |
Citations (8)
| Publication number | Priority date | Publication date | Assignee | Title |
|---|---|---|---|---|
| US4189367A (en) * | 1978-10-19 | 1980-02-19 | Leeds & Northrup Company | Method for testing ion selective electrodes in continuous measuring systems |
| JPS62185161A (ja) * | 1986-02-12 | 1987-08-13 | Toshiba Corp | 電解質測定装置 |
| JPH0242349A (ja) * | 1988-08-03 | 1990-02-13 | Hitachi Ltd | 電解質濃度測定装置 |
| JPH0376161U (de) * | 1989-11-29 | 1991-07-30 | ||
| JP2001004586A (ja) * | 1999-06-16 | 2001-01-12 | Hitachi Ltd | 電解質分析装置 |
| JP2004219352A (ja) | 2003-01-17 | 2004-08-05 | Toshiba Corp | 分析装置及び管理システム |
| JP2009121817A (ja) * | 2007-11-09 | 2009-06-04 | Olympus Corp | 分析装置 |
| JP2012042359A (ja) | 2010-08-19 | 2012-03-01 | Toshiba Corp | 自動分析装置 |
Family Cites Families (9)
| Publication number | Priority date | Publication date | Assignee | Title |
|---|---|---|---|---|
| JPS57199949A (en) * | 1981-06-03 | 1982-12-08 | Toshiba Corp | Deciding device for deterioration of ion selecting electrode |
| JPS5868656A (ja) * | 1981-10-20 | 1983-04-23 | Toshiba Corp | イオン濃度測定装置 |
| US4468608A (en) | 1981-12-11 | 1984-08-28 | Instrumentation Laboratory Inc. | Electrochemical sensor instrumentation |
| EP0241601B1 (de) * | 1986-04-15 | 1990-02-07 | Yokogawa Europe B.V. | Vorrichtung zur Prüfung der Vollständigkeit einer Elektrode in einem potentiometrischen Elektrodensystem |
| JPH0643133A (ja) * | 1992-07-23 | 1994-02-18 | Toshiba Corp | 生化学分析装置 |
| JP5331669B2 (ja) | 2009-12-08 | 2013-10-30 | 株式会社日立ハイテクノロジーズ | 電解質分析装置 |
| JP6475405B2 (ja) * | 2013-05-07 | 2019-02-27 | 株式会社日立ハイテクノロジーズ | 電解質濃度測定装置およびそれを用いた測定方法 |
| US20160341692A1 (en) * | 2015-05-21 | 2016-11-24 | Jeol Ltd. | Electrolyte Measuring Apparatus and Electrolyte Measuring Method |
| JP6250105B2 (ja) * | 2016-07-01 | 2017-12-20 | 株式会社日立ハイテクノロジーズ | 電解質分析装置及び電解質分析方法 |
-
2018
- 2018-09-13 JP JP2018171277A patent/JP6896684B2/ja active Active
-
2019
- 2019-09-02 CN CN201980046965.5A patent/CN112654862B/zh active Active
- 2019-09-02 EP EP19860479.5A patent/EP3851842A4/de active Pending
- 2019-09-02 WO PCT/JP2019/034355 patent/WO2020054473A1/ja unknown
- 2019-09-02 US US17/265,698 patent/US11782021B2/en active Active
Patent Citations (8)
| Publication number | Priority date | Publication date | Assignee | Title |
|---|---|---|---|---|
| US4189367A (en) * | 1978-10-19 | 1980-02-19 | Leeds & Northrup Company | Method for testing ion selective electrodes in continuous measuring systems |
| JPS62185161A (ja) * | 1986-02-12 | 1987-08-13 | Toshiba Corp | 電解質測定装置 |
| JPH0242349A (ja) * | 1988-08-03 | 1990-02-13 | Hitachi Ltd | 電解質濃度測定装置 |
| JPH0376161U (de) * | 1989-11-29 | 1991-07-30 | ||
| JP2001004586A (ja) * | 1999-06-16 | 2001-01-12 | Hitachi Ltd | 電解質分析装置 |
| JP2004219352A (ja) | 2003-01-17 | 2004-08-05 | Toshiba Corp | 分析装置及び管理システム |
| JP2009121817A (ja) * | 2007-11-09 | 2009-06-04 | Olympus Corp | 分析装置 |
| JP2012042359A (ja) | 2010-08-19 | 2012-03-01 | Toshiba Corp | 自動分析装置 |
Cited By (1)
| Publication number | Priority date | Publication date | Assignee | Title |
|---|---|---|---|---|
| EP4001910A4 (de) * | 2019-07-19 | 2023-08-02 | Hitachi High-Tech Corporation | Analysevorrichtung und analyseverfahren |
Also Published As
| Publication number | Publication date |
|---|---|
| JP6896684B2 (ja) | 2021-06-30 |
| EP3851842A1 (de) | 2021-07-21 |
| JP2020041968A (ja) | 2020-03-19 |
| US20210318266A1 (en) | 2021-10-14 |
| EP3851842A4 (de) | 2022-05-18 |
| CN112654862A (zh) | 2021-04-13 |
| US11782021B2 (en) | 2023-10-10 |
| CN112654862B (zh) | 2024-03-22 |
Similar Documents
| Publication | Publication Date | Title |
|---|---|---|
| WO2020054473A1 (ja) | 電解質濃度測定装置 | |
| CN112666234B (zh) | 电解质浓度测定装置、电解质浓度测定方法 | |
| WO2011070719A1 (ja) | 電解質分析装置 | |
| CN114127549B (zh) | 分析装置以及分析方法 | |
| JP6945479B2 (ja) | 分析物濃度を決定する方法 | |
| WO2023181620A1 (ja) | 電解質分析装置 | |
| CN110702767A (zh) | 自动分析装置 | |
| JP6890569B2 (ja) | 電解質測定装置 | |
| US20120121465A1 (en) | Automatic analyzer | |
| JP6738717B2 (ja) | 分析処理システム及び分析処理方法 | |
| JP2013024799A (ja) | 自動分析装置およびその制御方法 | |
| WO2023218738A1 (ja) | 分析装置および状態検知方法 | |
| CN115087864B (zh) | 电解质浓度测定装置 | |
| US20240159789A1 (en) | Automated analysis device | |
| EP4382898A1 (de) | Vorrichtung und verfahren zur benetzbarkeitsbeurteilung | |
| EP4283288A1 (de) | Elektrolytanalysevorrichtung und verfahren zur identifizierung von anomalien darin | |
| WO2022185641A1 (ja) | 電解質測定装置、および電解質濃度測定ユニットの異常判定方法 | |
| US20220026387A1 (en) | Automated analysis apparatus | |
| CN117825471A (zh) | 样本分析仪及其控制方法 | |
| EP4063869A1 (de) | Verfahren zur bestimmung der qualität eines schlauchs in einer peristaltischen pumpe |
Legal Events
| Date | Code | Title | Description |
|---|---|---|---|
| 121 | Ep: the epo has been informed by wipo that ep was designated in this application |
Ref document number: 19860479 Country of ref document: EP Kind code of ref document: A1 |
|
| NENP | Non-entry into the national phase |
Ref country code: DE |
|
| ENP | Entry into the national phase |
Ref document number: 2019860479 Country of ref document: EP Effective date: 20210413 |