WO2020039641A1 - 画像処理装置、画像処理方法、画像表示方法、および、プログラム - Google Patents
画像処理装置、画像処理方法、画像表示方法、および、プログラム Download PDFInfo
- Publication number
- WO2020039641A1 WO2020039641A1 PCT/JP2019/013968 JP2019013968W WO2020039641A1 WO 2020039641 A1 WO2020039641 A1 WO 2020039641A1 JP 2019013968 W JP2019013968 W JP 2019013968W WO 2020039641 A1 WO2020039641 A1 WO 2020039641A1
- Authority
- WO
- WIPO (PCT)
- Prior art keywords
- image processing
- image
- image data
- time
- display
- Prior art date
- Legal status (The legal status is an assumption and is not a legal conclusion. Google has not performed a legal analysis and makes no representation as to the accuracy of the status listed.)
- Ceased
Links
Images


Classifications
-
- A—HUMAN NECESSITIES
- A61—MEDICAL OR VETERINARY SCIENCE; HYGIENE
- A61B—DIAGNOSIS; SURGERY; IDENTIFICATION
- A61B8/00—Diagnosis using ultrasonic, sonic or infrasonic waves
- A61B8/13—Tomography
Definitions
- the present invention relates to information processing used in a system for generating an image by photoacoustic imaging.
- Patent Literature 1 discloses a photoacoustic image generation device that evaluates a contrast agent used for imaging lymph nodes, lymph vessels, and the like, and emits light having a wavelength that generates a photoacoustic wave when the contrast agent is absorbed. Is described.
- the present invention Time-series three-dimensional image data including three-dimensional image data generated based on a reception signal of a photoacoustic wave generated by a plurality of light irradiations on a subject and corresponding to each of the plurality of light irradiations
- An image processing apparatus for processing comprising: an acquisition unit configured to acquire flow information of a light absorber in the subject based on the time-series three-dimensional image data.
- the present invention also provides Time-series three-dimensional image data including three-dimensional image data generated based on a reception signal of a photoacoustic wave generated by a plurality of light irradiations on a subject and corresponding to each of the plurality of light irradiations An image processing method for processing An image processing method is provided, further comprising an acquisition step of acquiring flow information of a light absorber in the subject based on the time-series three-dimensional image data.
- the present invention also provides A method for displaying an image obtained by repeatedly irradiating a light pulse and obtaining a three-dimensional image of a light absorber distribution of the subject in a specific region of the subject substantially continuously, wherein a series of continuously obtained images is obtained.
- the present invention also provides Time-series three-dimensional image data including three-dimensional image data generated based on a reception signal of a photoacoustic wave generated by a plurality of light irradiations on a subject and corresponding to each of the plurality of light irradiations
- a program for causing a computer to execute an image processing method for processing The image processing method provides a program having an acquisition step of acquiring flow information of a light absorber in the subject based on the time-series three-dimensional image data.
- an information processing apparatus used for a system that generates an image in which a structure of a contrast target is easily grasped by photoacoustic imaging.
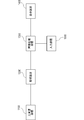
- FIG. 1 is a block diagram of a system according to an embodiment of the present invention.
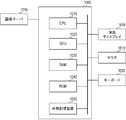
- FIG. 2 is a block diagram showing a specific example of an image processing apparatus according to an embodiment of the present invention and its peripheral configuration.
- FIG. 3 is a detailed block diagram of the photoacoustic apparatus according to one embodiment of the present invention.
- FIG. 4 is a schematic diagram of a probe according to one embodiment of the present invention.
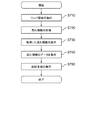
- FIG. 5 is a flowchart of an image processing method according to an embodiment of the present invention.
- FIG. 6 is a flowchart of obtaining lymph flow information according to an embodiment of the present invention.
- FIGS. 7A to 7D are contour graphs of the calculated value of Expression (1) corresponding to the contrast agent when the combination of wavelengths is changed.
- FIG. 1 is a block diagram of a system according to an embodiment of the present invention.
- FIG. 2 is a block diagram showing a specific example of an image processing apparatus according to an embodiment of the present invention and its peripheral configuration.
- FIG. 3 is
- FIG. 8 is a line graph showing the calculated values of equation (1) corresponding to the contrast agent when the concentration of ICG is changed.
- FIG. 9 is a graph showing a molar absorption coefficient spectrum of oxyhemoglobin and deoxyhemoglobin.
- FIG. 10 is a diagram illustrating a GUI according to an embodiment of the present invention.
- 11A to 11D are diagrams illustrating a method in which the image processing apparatus acquires lymph flow information.
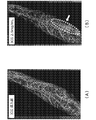
- 12A and 12B are spectral images on the right forearm extension side when the density of ICG is changed.
- 13A and 13B are spectral images on the left forearm extension side when the density of ICG is changed.
- 14A and 14B are spectral images of the inside of the right lower leg and the inside of the left lower leg when the density of CG is changed.
- the photoacoustic image obtained by the system according to the present invention reflects the absorption amount and absorption rate of light energy.
- the photoacoustic image is an image representing a spatial distribution of at least one object information such as a generated sound pressure (initial sound pressure) of a photoacoustic wave, a light absorption energy density, and a light absorption coefficient.
- the photoacoustic image may be an image representing a two-dimensional spatial distribution or an image (volume data) representing a three-dimensional spatial distribution.
- the system according to the present embodiment generates a photoacoustic image by photographing a subject into which a contrast agent has been introduced. In order to grasp the three-dimensional structure of the contrast target, the photoacoustic image may be an image representing a two-dimensional spatial distribution or a three-dimensional spatial distribution in a depth direction from the subject surface.
- the system according to the present invention can generate a spectral image of the subject using a plurality of photoacoustic images corresponding to a plurality of wavelengths.
- the spectral image of the present invention is based on a photoacoustic wave generated by irradiating a subject with light of a plurality of different wavelengths, and is an image generated using a photoacoustic signal corresponding to each of the plurality of wavelengths. is there.
- the spectral image may be an image generated using the photoacoustic signals corresponding to each of the plurality of wavelengths and indicating the concentration of the specific substance in the subject.
- an image calculated using the oxygen saturation calculation formula (1) will be described as a spectral image.
- the present inventors have calculated the optical saturation of blood hemoglobin based on the photoacoustic signal corresponding to each of the plurality of wavelengths (or an index having a correlation with the oxygen saturation).
- I (r) of a photoacoustic signal obtained with a contrast agent whose wavelength dependence of the absorption coefficient is different from that of oxyhemoglobin and deoxyhemoglobin is substituted, the numerical range in which the oxygen saturation of hemoglobin can be taken From the calculated value Is (r).
- Is (r) is a measurement value based on a photoacoustic wave generated by light irradiation of the first wavelength ⁇ 1
- I ⁇ 2 (r) is generated by light irradiation of the second wavelength ⁇ 2 This is a measurement value based on a photoacoustic wave.
- ⁇ Hb ⁇ 1 is a molar absorption coefficient of deoxyhemoglobin corresponding to the first wavelength ⁇ 1 [mm ⁇ 1 mol ⁇ 1 ]
- ⁇ Hb ⁇ 2 is a molar absorption coefficient of deoxy hemoglobin corresponding to the second wavelength ⁇ 2 [ mm -1 mol -1 ].
- ⁇ HbO ⁇ 1 is the molar absorption coefficient of oxyhemoglobin corresponding to the first wavelength ⁇ 1 [mm ⁇ 1 mol ⁇ 1 ]
- ⁇ HbO ⁇ 2 is the molar absorption coefficient of oxyhemoglobin corresponding to the second wavelength ⁇ 2 [ mm -1 mol -1 ].
- r is a position.
- the absorption coefficients ⁇ a ⁇ 1 (r) and ⁇ a ⁇ 2 (r) may be used, or the initial sound pressure P 0 ⁇ 1 (r) and P 0 ⁇ 2 (r) may be used.
- the numerical value of the molar absorption coefficient of hemoglobin may be used as it is in Expression (1).
- the spectral image Is (r) obtained in this manner is in a state where both the hemoglobin existing region (blood vessel) and the contrast agent existing region (for example, lymphatic vessel) inside the subject are separable from each other (can be distinguished). The image is rendered.
- the image value of the spectral image is calculated using Expression (1) for calculating the oxygen saturation.
- Expression (1) for calculating the oxygen saturation.
- the expression A calculation method other than (1) may be used.
- the index and the method for calculating the index known ones can be used, and a detailed description thereof will be omitted here.
- the system according to the present invention was based on the photoacoustic wave generated by the first light irradiation of the photoacoustic image and the second wavelength lambda 2, based on the photoacoustic wave generated by light irradiation of the first wavelength lambda 1
- An image indicating the ratio of the two photoacoustic images may be used as the spectral image. That is, the ratio of the second photoacoustic image based on the photoacoustic wave generated by light irradiation of the first photoacoustic image and the second wavelength lambda 2, based on the photoacoustic wave generated by light irradiation of the first wavelength lambda 1
- the image based on this may be a spectral image.
- an image generated according to the modified expression of Expression (1) can also be expressed by the ratio between the first photoacoustic image and the second photoacoustic image.
- Image (spectral image) can also be expressed by the ratio between the first photoacoustic image and the
- the spectral image may be an image representing a two-dimensional spatial distribution in the depth direction from the surface of the subject or an image representing a three-dimensional spatial distribution.
- FIG. 1 is a block diagram illustrating a configuration of a system according to the present embodiment.
- the system according to the present embodiment includes a photoacoustic device 1100, a storage device 1200, an image processing device 1300, a display device 1400, and an input device 1500. Transmission and reception of data between the devices may be performed by wire or wirelessly.
- the photoacoustic device 1100 generates a photoacoustic image by capturing an image of the subject into which the contrast agent has been introduced, and outputs the photoacoustic image to the storage device 1200.
- the photoacoustic device 1100 is a device that generates information of characteristic values corresponding to each of a plurality of positions in a subject using a reception signal obtained by receiving a photoacoustic wave generated by light irradiation. That is, the photoacoustic apparatus 1100 is an apparatus that generates a spatial distribution of characteristic value information derived from a photoacoustic wave as medical image data (photoacoustic image).
- the storage device 1200 may be a storage medium such as a ROM (Read Only Memory), a magnetic disk, or a flash memory. Further, the storage device 1200 may be a storage server via a network such as a PACS (Picture Archiving and Communication System).
- a storage medium such as a ROM (Read Only Memory), a magnetic disk, or a flash memory. Further, the storage device 1200 may be a storage server via a network such as a PACS (Picture Archiving and Communication System).
- PACS Picture Archiving and Communication System
- the image processing device 1300 is a device that processes information such as a photoacoustic image and incidental information of the photoacoustic image stored in the storage device 1200.
- a unit having an arithmetic function of the image processing apparatus 1300 can be configured by an arithmetic circuit such as a CPU, a processor such as a GPU (Graphics Processing Unit), or an FPGA (Field Programmable Gate Array) chip. These units may be configured not only from a single processor or arithmetic circuit, but also from a plurality of processors or arithmetic circuits.
- the unit having the storage function of the image processing apparatus 1300 can be configured by a non-temporary storage medium such as a ROM (Read Only Memory), a magnetic disk, or a flash memory. Further, the unit having the storage function may be a volatile medium such as a RAM (Random Access Memory). The storage medium on which the program is stored is a non-temporary storage medium. Note that the unit having the storage function is not limited to a single storage medium, and may be configured from a plurality of storage media.
- a unit having a control function of the image processing apparatus 1300 is configured by an arithmetic element such as a CPU.
- a unit having a control function controls the operation of each component of the system.
- the unit having the control function may control each component of the system in response to an instruction signal from various operations such as the start of measurement from the input unit. Further, the unit having the control function may read out the program code stored in the computer 150 and control the operation of each component of the system.
- the display device 1400 is a display such as a liquid crystal display or an organic EL (Electro Luminescence).
- the display device 1400 may display an image or a GUI for operating the device.
- an operation console that can be operated by a user and includes a mouse, a keyboard, and the like can be employed.
- the display device 1400 may be configured with a touch panel, and the display device 1400 may be used as the input device 1500.
- FIG. 2 shows a specific configuration example of the image processing apparatus 1300 according to the present embodiment.
- the image processing apparatus 1300 according to the present embodiment includes a CPU 1310, a GPU 1320, a RAM 1330, a ROM 1340, and an external storage device 1350.
- a liquid crystal display 1410 as a display device 1400, a mouse 1510 as an input device 1500, and a keyboard 1520 are connected to the image processing device 1300.
- the image processing apparatus 1300 is connected to an image server 1210 as a storage device 1200 such as a PACS (Picture Archiving and Communication System).
- the image data can be stored on the image server 1210 or the image data on the image server 1210 can be displayed on the liquid crystal display 1410.
- FIG. 3 is a schematic block diagram of devices included in the system according to the present embodiment.
- the photoacoustic apparatus 1100 includes a drive unit 130, a signal collection unit 140, a computer 150, a probe 180, and an introduction unit 190.
- the probe 180 has a light irradiation unit 110 and a reception unit 120.
- FIG. 4 is a schematic diagram of the probe 180 according to the present embodiment.
- the measurement target is the subject 100 into which the contrast agent has been introduced by the introduction unit 190.
- the drive unit 130 drives the light irradiation unit 110 and the reception unit 120 to perform mechanical scanning.
- the light irradiation unit 110 irradiates the subject 100 with light, and an acoustic wave is generated in the subject 100.
- An acoustic wave generated by the photoacoustic effect due to light is also called a photoacoustic wave.
- the receiving unit 120 outputs an electric signal (photoacoustic signal) as an analog signal by receiving the photoacoustic wave.
- the computer 150 generates a photoacoustic image by performing signal processing on the stored digital signal.
- the computer 150 outputs the photoacoustic image to the display unit 160 after performing image processing on the obtained photoacoustic image.
- the display unit 160 displays an image based on the photoacoustic image.
- the display image is stored in a memory in the computer 150 or a storage device 1200 such as a data management system connected to the modality via a network based on a storage instruction from the user or the computer 150.
- the computer 150 also performs drive control of components included in the photoacoustic device.
- the display unit 160 may display a GUI or the like in addition to the image generated by the computer 150.
- the input unit 170 is configured to allow a user to input information. The user can use the input unit 170 to perform operations such as start and end of measurement, and an instruction to save a created image.
- details of each configuration of the photoacoustic apparatus 1100 according to the present embodiment will be described.
- the light irradiation unit 110 includes a light source 111 that emits light, and an optical system 112 that guides light emitted from the light source 111 to the subject 100.
- the light includes pulse light such as a so-called rectangular wave and a triangular wave.
- the pulse width of the light emitted from the light source 111 is preferably 100 ns or less in consideration of the thermal confinement condition and the stress confinement condition. Further, the wavelength of the light may be in the range of about 400 nm to 1600 nm. When imaging a blood vessel with high resolution, a wavelength (400 nm or more and 700 nm or less) at which absorption in the blood vessel is large may be used. When imaging a deep part of a living body, light having a wavelength (700 nm or more and 1100 nm or less) that typically absorbs little in a background tissue (water or fat) of the living body may be used.
- a laser or a light emitting diode can be used.
- a light source whose wavelength can be changed may be used.
- a plurality of light sources are used, they are collectively expressed as a light source.
- Various lasers such as a solid-state laser, a gas laser, a dye laser, and a semiconductor laser can be used as the laser.
- a pulsed laser such as an Nd: YAG laser or an alexandrite laser may be used as a light source.
- a Ti: sa laser using Nd: YAG laser light as excitation light or an OPO (Optical Parametric Oscillators) laser may be used as a light source.
- a flash lamp or a light emitting diode may be used as the light source 111.
- a microwave source may be used as the light source 111.
- Optical elements such as lenses, mirrors, and optical fibers can be used for the optical system 112.
- the light emitting unit of the optical system may be configured with a diffusion plate or the like that diffuses light in order to irradiate the pulsed light with a wider beam diameter.
- the light emitting portion of the optical system 112 may be configured by a lens or the like, and the beam may be focused and irradiated.
- the light irradiating unit 110 may directly irradiate the subject 100 with light from the light source 111 without including the optical system 112.
- the receiving unit 120 includes a transducer 121 that outputs an electric signal by receiving an acoustic wave, and a support 122 that supports the transducer 121. Further, the transducer 121 may be a transmitting unit that transmits an acoustic wave.
- the transducer as the receiving means and the transducer as the transmitting means may be a single (common) transducer or may have different configurations.
- a piezoelectric ceramic material represented by PZT lead zirconate titanate
- a polymer piezoelectric film material represented by PVDF polyvinylidene fluoride
- an element other than the piezoelectric element may be used.
- a transducer using a capacitance type micro-machined Ultrasonic Transducers (CMUT) can be used. Note that any transducer may be employed as long as an electrical signal can be output by receiving an acoustic wave. The signal obtained by the transducer is a time-resolved signal.
- the amplitude of the signal obtained by the transducer indicates a value based on the sound pressure received by the transducer at each time (for example, a value proportional to the sound pressure).
- the frequency component constituting the photoacoustic wave is typically 100 KHz to 100 MHz, and a transducer that can detect these frequencies may be employed as the transducer 121.
- the support 122 may be made of a metal material having high mechanical strength. In order to cause a large amount of irradiation light to enter the subject, the surface of the support 122 on the subject 100 side may be subjected to mirror finishing or light scattering.
- the support 122 has a hemispherical shell shape, and is configured to be able to support the plurality of transducers 121 on the hemispherical shell. In this case, the directional axes of the transducers 121 disposed on the support body 122 gather near the center of curvature of the hemisphere. Then, when an image is formed using the signals output from the plurality of transducers 121, the image quality near the center of curvature becomes high.
- the support 122 may have any configuration as long as it can support the transducer 121.
- the support 122 may arrange a plurality of transducers in a plane or a curved surface such as a 1D array, a 1.5D array, a 1.75D array, and a 2D array.
- the plurality of transducers 121 correspond to a plurality of receiving units.
- the support 122 may function as a container for storing the acoustic matching material. That is, the support 122 may be a container for disposing the acoustic matching material between the transducer 121 and the subject 100.
- the receiving unit 120 may include an amplifier that amplifies a time-series analog signal output from the transducer 121. Further, the receiving unit 120 may include an A / D converter that converts a time-series analog signal output from the transducer 121 into a time-series digital signal. That is, the receiving unit 120 may include a signal collecting unit 140 described later.
- the space between the receiving unit 120 and the subject 100 is filled with a medium through which a photoacoustic wave can propagate.
- a medium a material that can transmit an acoustic wave, has matching acoustic characteristics at the interface with the subject 100 and the transducer 121, and has the highest possible transmittance of the photoacoustic wave is used.
- water, an ultrasonic gel, or the like can be used as the medium.
- FIG. 4 shows a side view of the probe 180.
- the probe 180 according to the present embodiment has a receiving unit 120 in which a plurality of transducers 121 are three-dimensionally arranged on a hemispherical support body 122 having an opening.
- a light emitting portion of the optical system 112 is disposed at the bottom of the support 122.
- the shape of the subject 100 is held by contacting the holding unit 200.
- the space between the receiving unit 120 and the holding unit 200 is filled with a medium through which a photoacoustic wave can propagate.
- a medium through which a photoacoustic wave can propagate.
- a material that can transmit a photoacoustic wave matches acoustic characteristics at the interface with the subject 100 and the transducer 121, and has a transmittance of the photoacoustic wave as high as possible is used.
- water, an ultrasonic gel, or the like can be used as the medium.
- the holding unit 200 as holding means is used to hold the shape of the subject 100 during measurement. By holding the subject 100 by the holding unit 200, the movement of the subject 100 can be suppressed and the position of the subject 100 can be kept in the holding unit 200.
- a resin material such as polycarbonate, polyethylene, or polyethylene terephthalate can be used for the material of the holding unit 200.
- the holding unit 200 is attached to the attachment unit 201.
- the attachment unit 201 may be configured so that a plurality of types of holding units 200 can be exchanged according to the size of the subject.
- the mounting portion 201 may be configured to be exchangeable with a different holding portion such as a radius of curvature or a center of curvature.
- the driving unit 130 is a unit that changes the relative position between the subject 100 and the receiving unit 120.
- the driving unit 130 includes a motor such as a stepping motor that generates a driving force, a driving mechanism that transmits the driving force, and a position sensor that detects position information of the receiving unit 120.
- a motor such as a stepping motor that generates a driving force
- a driving mechanism that transmits the driving force
- a position sensor that detects position information of the receiving unit 120.
- As the driving mechanism a lead screw mechanism, a link mechanism, a gear mechanism, a hydraulic mechanism, or the like can be used.
- As the position sensor a potentiometer using an encoder, a variable resistor, a linear scale, a magnetic sensor, an infrared sensor, an ultrasonic sensor, or the like can be used.
- the driving unit 130 is not limited to changing the relative position between the subject 100 and the receiving unit 120 in the XY directions (two-dimensional), and may change the relative position to one-dimensional or three-dimensional.
- the drive unit 130 may fix the receiving unit 120 and move the subject 100 as long as the relative position between the subject 100 and the receiving unit 120 can be changed.
- a configuration in which the subject 100 is moved by moving a holding unit that holds the subject 100 can be considered. Further, both the subject 100 and the receiving unit 120 may be moved.
- the drive unit 130 may move the relative position continuously, or may move the relative position by step and repeat.
- the drive unit 130 may be an electric stage that moves along a programmed trajectory, or may be a manual stage.
- the driving unit 130 scans by simultaneously driving the light irradiation unit 110 and the reception unit 120.
- the drive unit 130 drives only the light irradiation unit 110 or drives only the reception unit 120. You may.
- the photoacoustic device 1100 may not include the driving unit 130.
- the signal collection unit 140 includes an amplifier that amplifies an electric signal that is an analog signal output from the transducer 121, and an A / D converter that converts an analog signal output from the amplifier into a digital signal.
- the digital signal output from the signal collection unit 140 is stored in the computer 150.
- the signal collection unit 140 is also called a Data Acquisition System (DAS).
- DAS Data Acquisition System
- the electric signal is a concept including both an analog signal and a digital signal.
- a light detection sensor such as a photodiode may detect light emission from the light irradiation unit 110, and the signal collection unit 140 may start the above process in synchronization with the detection result in response to a trigger.
- the computer 150 as the information processing device is configured by the same hardware as the image processing device 1300. That is, the unit having the arithmetic function of the computer 150 can be configured by an arithmetic circuit such as a processor such as a CPU or a GPU (Graphics Processing Unit) or an FPGA (Field Programmable Gate Array) chip. These units may be configured not only from a single processor or arithmetic circuit, but also from a plurality of processors or arithmetic circuits.
- the unit that performs the storage function of the computer 150 may be a volatile medium such as a RAM (Random Access Memory).
- the storage medium on which the program is stored is a non-temporary storage medium. It should be noted that the unit having the storage function of the computer 150 may not only be constituted by one storage medium, but also constituted by a plurality of storage media.
- the unit that performs the control function of the computer 150 is composed of an arithmetic element such as a CPU.
- a unit having a control function of the computer 150 controls the operation of each component of the photoacoustic apparatus.
- a unit having a control function of the computer 150 may control each component of the photoacoustic apparatus by receiving an instruction signal from the input unit 170 through various operations such as a start of measurement. Further, the unit having the control function of the computer 150 reads out the program code stored in the unit having the storage function, and controls the operation of each component of the photoacoustic apparatus. That is, the computer 150 can function as a control device of the system according to the present embodiment.
- the computer 150 and the image processing device 1300 may be configured by the same hardware.
- One piece of hardware may perform the functions of both the computer 150 and the image processing device 1300. That is, the computer 150 may perform the function of the image processing apparatus 1300. Further, the image processing device 1300 may have the function of the computer 150 as the information processing device.
- the display unit 160 is a display such as a liquid crystal display and an organic EL (Electro Luminescence).
- the display unit 160 may display an image or a GUI for operating the apparatus. Note that the display unit 160 and the display device 1400 may be the same display. That is, one display may have the functions of both the display unit 160 and the display device 1400.
- Input unit 170 As the input unit 170, an operation console that can be operated by a user and includes a mouse and a keyboard can be employed. Further, the display unit 160 may be configured by a touch panel, and the display unit 160 may be used as the input unit 170. Note that the input unit 170 and the input device 1500 may be the same device. That is, one device may perform both functions of the input unit 170 and the input device 1500.
- the introduction unit 190 is configured to be able to introduce a contrast agent from outside the subject 100 into the inside of the subject 100.
- the introducer 190 can include a container for the contrast agent and a needle for piercing the subject.
- the present invention is not limited to this, and various types can be applied to the introduction unit 190 as long as the contrast agent can be introduced into the subject 100.
- the introduction unit 190 may be, for example, a known injection system, an injector, or the like.
- the contrast agent may be introduced into the subject 100 by controlling the operation of the introduction unit 190 by the computer 150 as a control device. Further, the contrast agent may be introduced into the subject 100 by operating the introduction unit 190 by the user.
- the subject 100 does not constitute a system, but will be described below.
- the system according to the present embodiment can be used for the purpose of diagnosing malignant tumors and vascular diseases of humans and animals, monitoring the progress of chemotherapy and the like. Therefore, the subject 100 is assumed to be a body to be diagnosed, specifically, a living body, specifically, a breast or each organ of a human body or an animal, a vascular network, a head, a neck, an abdomen, a limb including a finger or a toe. You.
- the human body is a measurement target
- oxyhemoglobin or deoxyhemoglobin a blood vessel containing many of them, a new blood vessel formed near a tumor, or the like may be the target of the light absorber.
- plaque of the carotid artery wall or the like may be a target of the light absorber.
- melanin, collagen, lipids, and the like contained in the skin and the like may be targeted for the light absorber.
- the contrast agent introduced into the subject 100 can be a light absorber.
- a dye such as indocyanine green (ICG) or methylene blue (MB), fine gold particles, or a substance obtained by accumulating or chemically modifying them and introduced from the outside may be used. Further, a phantom imitating a living body may be used as the subject 100.
- Each configuration of the photoacoustic device may be configured as a separate device, or may be configured as one integrated device. Further, at least a part of the configuration of the photoacoustic apparatus may be configured as one integrated apparatus.
- Each device constituting the system according to the present embodiment may be constituted by separate hardware, or all devices may be constituted by one piece of hardware. The function of the system according to the present embodiment may be configured by any hardware.
- the flowchart shown in FIG. 5 includes a step indicating the operation of the system according to the present embodiment and a step indicating the operation of a user such as a doctor.
- the computer 150 of the photoacoustic apparatus 1100 acquires information related to the inspection.
- the computer 150 obtains examination order information transmitted from an in-hospital information system such as a Hospital Information System (HIS) or a Radiology Information System (RIS).
- the examination order information includes information such as the type of the modality used for the examination and the contrast agent used for the examination.
- the inspection order information includes information on the irradiated light.
- the information about light can also include the pulse length, repetition frequency, intensity, etc. of the light.
- the lymph flow information acquired by the following flow may include various information on the lymph flow, such as the frequency, flow rate, and flow velocity of the lymph flow in the lymph vessels.
- the flow information may include a standard deviation of the luminance value in the image over time and a peak-to-peak (PP).
- PP peak-to-peak
- the method of expressing the flow information is arbitrary, and for example, an expression method using an image (including a moving image), a physical expression method, an expression method using words and the like can be adopted.
- the test order information needs to include information of each wavelength. is there.
- a plurality of wavelengths are used, when setting the wavelength, when generating an oxygen saturation image as a spectral image in accordance with Equation (1), an image corresponding to the actual oxygen saturation is obtained for a blood vessel region in the spectral image.
- the value is calculated, it is preferable to consider that the image value of the region of the contrast agent in the spectral image greatly changes depending on the wavelength used and the absorption coefficient spectrum of the contrast agent.
- the contrast of the arterial and venous oxygen saturations in the spectral image can be reduced by utilizing the fact that the percentage display generally falls within 60% to 100%.
- two wavelengths such that the value of equation (1) corresponding to the agent is less than 60% (eg a negative value) or greater than 100%.
- wavelengths of 700 nm or more and less than 820 nm and two wavelengths of 820 nm or more and 1020 nm or less are selected, and a spectral image is generated by Expression (1), thereby obtaining a region of the contrast agent. And a blood vessel region can be distinguished well.
- the use of wavelengths of 700 nm to 820 nm and 820 nm to 1020 nm is a preferable example of the present embodiment.
- the user may use the input unit 170 to instruct the type of the modality used for the inspection, information on light when the modality is photoacoustic imaging, the type of the contrast agent used for the inspection, and the concentration of the contrast agent.
- the computer 150 can acquire the inspection information via the input unit 170.
- the information on the contrast agent set by default may be acquired from the information on the plurality of contrast agents.
- ICG is set as the type of the contrast agent
- 1.0 mg / mL is set as the concentration of the contrast agent by default.
- the type and density of the contrast agent set by default are displayed in the item 2600 of the GUI, but the information on the contrast agent may not be set by default. In this case, the information about the contrast agent may not be displayed on the GUI item 2600 on the initial screen.
- the introduction unit 190 introduces a contrast agent into the subject.
- the user operates the input unit 170 to send a signal indicating that the contrast agent has been introduced from the input unit 170 to the control device. It may be transmitted to the computer 150. Further, the introduction unit 190 may transmit a signal indicating that the contrast agent has been introduced into the subject 100 to the computer 150.
- the contrast agent may be administered to the subject without using the introduction unit 190.
- the contrast medium may be administered by aspirating the sprayed contrast medium onto a living body as a subject.
- the subsequent processing may be executed after a certain period of time until the contrast agent reaches the contrast target in the subject 100.
- FIGS. 12 to 14 show spectral images obtained by photographing when ICG is introduced while changing the density.
- 0.1 mL of ICG was introduced subcutaneously or intradermally on the hand or foot at each location.
- the ICG introduced subcutaneously or intradermally is selectively taken up by the lymphatic vessels, so that the lumen of the lymphatic vessels is imaged.
- the images were taken within 5 to 60 minutes after the introduction of ICG.
- Each of the spectral images is a spectral image generated from a photoacoustic image obtained by irradiating a living body with light having a wavelength of 797 nm and light having a wavelength of 835 nm.
- FIG. 12A shows a spectral image on the right forearm extension side when ICG is not introduced.
- FIG. 12 (B) shows a spectral image on the right forearm extension side when ICG having a concentration of 2.5 mg / mL was introduced. Lymph vessels are depicted in the regions indicated by the broken lines and arrows in FIG.
- FIG. 13 (A) shows a spectral image of the left forearm extension when ICG having a concentration of 1.0 mg / mL is introduced.
- FIG. 13 (B) shows a spectral image on the left forearm extension side when ICG having a concentration of 5.0 mg / mL was introduced.
- Lymph vessels are depicted in the area indicated by the broken line and the arrow in FIG.
- FIG. 14A shows a spectral image of the inside of the right lower leg when ICG having a concentration of 0.5 mg / mL is introduced.
- FIG. 14B shows a spectral image of the inside of the left lower leg when ICG having a concentration of 5.0 mg / mL is introduced. Lymph vessels are depicted in the regions indicated by the broken lines and arrows in FIG.
- the concentration of ICG when the concentration of ICG is 2.5 mg / mL or more, lymphatic vessels can be favorably drawn. That is, when the concentration of ICG is 2.5 mg / mL or more, the lymph vessels on the line can be clearly recognized. Therefore, when ICG is used as a contrast agent, the concentration may be 2.5 mg / mL or more. In consideration of the dilution of ICG in a living body, the concentration of ICG may be higher than 5.0 mg / mL. However, in view of the solubility of Diagno Green, it is difficult to dissolve it in an aqueous solution at a concentration of 10.0 mg / mL or more.
- the concentration of ICG to be introduced into a living body is preferably from 2.5 mg / mL to 10.0 mg / mL, more preferably from 5.0 mg / mL to 10.0 mg / mL.
- the computer 150 is configured to selectively receive an instruction from the user indicating the concentration of ICG in the above numerical range when ICG is input as the type of the contrast agent in the item 2600 of the GUI shown in FIG. May be. That is, in this case, the computer 150 may be configured not to receive an instruction from the user indicating the ICG concentration outside the above numerical range. Therefore, when acquiring information indicating that the type of the contrast agent is ICG, the computer 150 issues an instruction from a user indicating a concentration of ICG smaller than 2.5 mg / mL or larger than 10.0 mg / mL. May not be accepted.
- the computer 150 when acquiring information indicating that the type of the contrast agent is ICG, the computer 150 receives an instruction from the user indicating a concentration of ICG smaller than 5.0 mg / mL or larger than 10.0 mg / mL. You may be comprised so that it may not accept.
- the computer 150 may configure the GUI so that the user cannot specify the ICG concentration outside the numerical range on the GUI. That is, the computer 150 may display the GUI so that the user cannot specify the ICG concentration outside the numerical range on the GUI. For example, the computer 150 may display a pull-down on the GUI that can selectively indicate the concentration of ICG in the above numerical range. The computer 150 may display the density of the ICG outside the numerical range in the pull-down in a grayed-out manner, and may configure the GUI so that the grayed-out density cannot be selected. In addition, the computer 150 may notify an alert when a user specifies an ICG concentration outside the above numerical range on the GUI.
- any method such as displaying an alert on the display unit 160 and lighting a sound or a lamp can be adopted.
- the computer 150 may cause the display unit 160 to display the above numerical range as the concentration of ICG to be introduced into the subject.
- the concentration of the contrast agent to be introduced into the subject is not limited to the numerical range shown here, and a suitable concentration according to the purpose can be adopted. Further, here, an example in which the type of the contrast agent is ICG has been described, but the above configuration can be similarly applied to other contrast agents.
- 7A to 7D show simulation results of image values (oxygen saturation values) corresponding to the contrast agent in the spectral image in each of the two wavelength combinations.
- 7A to 7D represent the first wavelength and the second wavelength, respectively.
- 7A to 7D show contour lines of image values corresponding to the contrast agent in the spectral images.
- 7A to 7D show image values corresponding to a contrast agent in a spectral image when the concentration of ICG is 5.04 ⁇ g / mL, 50.4 ⁇ g / mL, 0.5 mg / mL, and 1.0 mg / mL, respectively. Show.
- the image value corresponding to the contrast agent in the spectral image may be 60% to 100% depending on the combination of the selected wavelengths. As described above, if such a combination of wavelengths is selected, it becomes difficult to distinguish a blood vessel region and a contrast agent region in a spectral image. Therefore, in the wavelength combinations shown in FIGS. 7A to 7D, it is preferable to select a wavelength combination such that the image value corresponding to the contrast agent in the spectral image is smaller than 60% or larger than 100%. . Further, it is preferable to select a combination of wavelengths such that the image value corresponding to the contrast agent in the spectral image has a negative value in the combination of wavelengths shown in FIGS. 7A to 7D.
- FIG. 8 shows the relationship between the concentration of ICG and the image value (the value of equation (1)) corresponding to the contrast agent in the spectral image when 797 nm is selected as the first wavelength and 835 nm is selected as the second wavelength.
- FIG. 8 shows the relationship between the concentration of ICG and the image value (the value of equation (1)) corresponding to the contrast agent in the spectral image when 797 nm is selected as the first wavelength and 835 nm is selected as the second wavelength.
- the contrast in the spectral image is increased regardless of the concentration of 5.04 ⁇ g / mL to 1.0 mg / mL.
- the image value corresponding to the agent is a negative value. Therefore, according to the spectral image generated by such a combination of wavelengths, since the oxygen saturation value of the blood vessel does not take a negative value in principle, the blood vessel region and the contrast agent region are clearly distinguished. be able to.
- the wavelength is determined based on the information on the contrast agent.
- the absorption coefficient of hemoglobin may be considered in determining the wavelength.
- FIG. 9 shows the spectrum of the molar absorption coefficient of oxyhemoglobin (dashed line) and the molar absorption coefficient of deoxyhemoglobin (solid line).
- the magnitude relationship between the molar absorption coefficient of oxyhemoglobin and the molar absorption coefficient of deoxyhemoglobin is reversed at the boundary of 797 nm. That is, it can be said that it is easy to grasp the vein at a wavelength shorter than 797 nm, and it is easy to grasp the artery at a wavelength longer than 797 nm.
- lymphatic venule anastomosis for creating a bypass between lymphatic vessels and veins is used.
- photoacoustic imaging to image both the veins and the lymph vessels in which the contrast agent has accumulated.
- at least one of the plurality of wavelengths is set to a wavelength at which the molar absorption coefficient of deoxyhemoglobin is larger than the molar absorption coefficient of oxyhemoglobin.
- the vein is imaged by setting the wavelength at which the molar absorption coefficient of deoxyhemoglobin is larger than the molar absorption coefficient of oxyhemoglobin at any of the two wavelengths. This is advantageous. By selecting these wavelengths, in the preoperative examination of the lymphatic venule anastomosis, it is possible to accurately image both the lymphatic vessels and the veins into which the contrast agent has been introduced.
- any of the plurality of wavelengths is a wavelength at which the absorption coefficient of the contrast agent is larger than that of blood, the oxygen saturation accuracy of the blood decreases due to artifacts derived from the contrast agent. Therefore, in order to reduce artifacts derived from the contrast agent, at least one of the plurality of wavelengths may be a wavelength at which the absorption coefficient of the contrast agent is smaller than the absorption coefficient of blood.
- the light irradiation unit 110 sets the wavelength determined based on the information acquired in S100 in the light source 111.
- the light source 111 emits light having the determined wavelength.
- Light generated from the light source 111 is applied to the subject 100 as pulse light via the optical system 112. Then, the pulse light is absorbed inside the subject 100, and a photoacoustic wave is generated by the photoacoustic effect.
- the introduced contrast agent also absorbs the pulse light and generates a photoacoustic wave.
- the light irradiation unit 110 may transmit a synchronization signal to the signal collection unit 140 together with the transmission of the pulse light.
- the light irradiating unit 110 similarly irradiates each of a plurality of wavelengths with light.
- the user may specify the control parameters such as the irradiation condition (the repetition frequency and wavelength of irradiation light) of the light irradiation unit 110 and the position of the probe 180 by using the input unit 170.
- the computer 150 may set a control parameter determined based on a user's instruction. Further, the computer 150 may move the probe 180 to a specified position by controlling the driving unit 130 based on the specified control parameter.
- the drive unit 130 When imaging at a plurality of positions is designated, the drive unit 130 first moves the probe 180 to the first designated position. Note that the drive unit 130 may move the probe 180 to a position programmed in advance when a measurement start instruction is issued.
- signal collecting section 140 When receiving the synchronization signal transmitted from light irradiating section 110, signal collecting section 140 starts the signal collecting operation. That is, the signal collecting unit 140 generates an amplified digital electric signal by amplifying and AD converting the analog electric signal derived from the photoacoustic wave output from the receiving unit 120, and outputs the amplified digital electric signal to the computer 150. .
- the computer 150 stores the signal transmitted from the signal collecting unit 140. When imaging at a plurality of scanning positions is specified, the processes of S300 and S400 are repeatedly executed at the specified scanning positions, and irradiation of pulse light and generation of digital signals derived from acoustic waves are repeated. Note that the computer 150 may acquire and store the position information of the receiving unit 120 at the time of light emission based on the output from the position sensor of the drive unit 130 with the light emission as a trigger.
- each of a plurality of wavelengths of light is radiated in a time-division manner.
- the computer 150 as a photoacoustic image acquisition unit generates a photoacoustic image based on the stored signal data.
- the computer 150 outputs the generated photoacoustic image to the storage device 1200 and stores it.
- one three-dimensional photoacoustic image (volume data) is generated by image reconstruction using a photoacoustic signal obtained by a single light irradiation on the subject.
- time-series three-dimensional image data time-series volume data
- the three-dimensional image data obtained by reconstructing an image for each of the plurality of light irradiations is collectively referred to as three-dimensional image data corresponding to the plurality of light irradiations. Note that, since light irradiation is performed a plurality of times in a time series, three-dimensional image data corresponding to the light irradiations a plurality of times constitutes time-series three-dimensional image data.
- Reconstruction algorithms for converting signal data into a two-dimensional or three-dimensional spatial distribution include analytic reconstruction methods such as backprojection in the time domain and backprojection in the Fourier domain, and model-based methods (repetitive computations). Law) can be adopted.
- the backprojection method in the time domain includes Universal @ back-projection (UBP), Filtered @ back-projection (FBP), or phasing addition (Delay-and-Sum).
- the computer 150 generates initial sound pressure distribution information (sound pressures generated at a plurality of positions) as a photoacoustic image by performing a reconstruction process on the signal data. Further, the computer 150 calculates the optical fluence distribution of the light radiated on the subject 100 inside the subject 100, and divides the initial sound pressure distribution by the light fluence distribution to obtain the absorption coefficient distribution information by photoacoustic. It may be obtained as an image. A known method can be applied to the calculation method of the light fluence distribution. In addition, the computer 150 can generate a photoacoustic image corresponding to each of the light of a plurality of wavelengths.
- the computer 150 can generate a first photoacoustic image corresponding to the first wavelength by performing a reconstruction process on signal data obtained by irradiating light of the first wavelength. Further, the computer 150 can generate a second photoacoustic image corresponding to the second wavelength by performing a reconstruction process on the signal data obtained by irradiating the second wavelength light. As described above, the computer 150 can generate a plurality of photoacoustic images corresponding to lights of a plurality of wavelengths.
- the computer 150 acquires absorption coefficient distribution information corresponding to each of light of a plurality of wavelengths as a photoacoustic image.
- the absorption coefficient distribution information corresponding to the first wavelength is defined as a first photoacoustic image
- the absorption coefficient distribution information corresponding to the second wavelength is defined as a second photoacoustic image.
- the present invention is also applicable to a system that does not include the photoacoustic apparatus 1100.
- the present invention can be applied to any system as long as the image processing apparatus 1300 as a photoacoustic image acquisition unit can acquire a photoacoustic image.
- the present invention can be applied to a system that does not include the photoacoustic device 1100 but includes the storage device 1200 and the image processing device 1300.
- the image processing device 1300 as the photoacoustic image acquisition unit can acquire the photoacoustic image by reading out the specified photoacoustic image from the photoacoustic image group stored in the storage device 1200 in advance. it can.
- the computer 150 as a spectral image acquisition unit generates a spectral image based on a plurality of photoacoustic images corresponding to a plurality of wavelengths.
- the computer 150 outputs the spectral image to the storage device 1200 and causes the storage device 1200 to store the spectral image.
- the computer 150 may generate, as a spectral image, an image indicating information corresponding to the concentration of a substance constituting the subject, such as glucose concentration, collagen concentration, melanin concentration, and volume fraction of fat and water. Good.
- the computer 150 may generate, as a spectral image, an image representing a ratio between the first photoacoustic image corresponding to the first wavelength and the second photoacoustic image corresponding to the second wavelength.
- a spectral image an image representing a ratio between the first photoacoustic image corresponding to the first wavelength and the second photoacoustic image corresponding to the second wavelength.
- the computer 150 generates an oxygen saturation image as a spectral image according to Expression (1) using the first photoacoustic image and the second photoacoustic image.
- the image processing apparatus 1300 as the spectral image acquiring unit may acquire a spectral image by reading out a designated spectral image from a spectral image group stored in the storage device 1200 in advance.
- the image processing apparatus 1300 as a photoacoustic image acquisition unit includes at least one of a plurality of photoacoustic images used to generate the read spectral image from a group of photoacoustic images stored in the storage device 1200 in advance. May be read to obtain a photoacoustic image. A plurality of times of light irradiation, subsequent acoustic wave reception and image reconstruction are performed, thereby generating time-series three-dimensional image data corresponding to the plurality of times of light irradiation.
- Photoacoustic image data and spectral image data can be used as the three-dimensional image data.
- the photoacoustic image data refers to image data indicating a distribution of an absorption coefficient or the like
- the spectral image data is converted to photoacoustic image data corresponding to each wavelength when light of a plurality of wavelengths is irradiated on the subject.
- the image processing device 1300 reads the photoacoustic image or the spectral image from the storage device 1200, and acquires information on the flow of lymph based on the photoacoustic image or the spectral image.
- the processing in this step can be performed based on a photoacoustic image derived from at least one wavelength.
- a spectral image created from a photoacoustic image derived from each of a plurality of wavelengths can also be used.
- a method for performing the flow information acquisition process according to the present embodiment will be described with reference to the flowchart shown in FIG. This flow specifically describes the processing in step S700 in FIG.
- the image processing apparatus 1300 as the flow information acquisition unit performs the main information processing.
- the configuration of the flow information acquisition means is not limited to this, and any component having an information processing function included in the present invention may perform the processing in the following flow.
- the image processing device 1300 reads the photoacoustic image stored in the storage device 1200 in step S500 of FIG.
- the time range of the photoacoustic image to be read is arbitrary. Generally, the flow of lymph fluid is intermittent, and its cycle is several tens of seconds to several minutes. It is preferable that the photoacoustic images corresponding to the photoacoustic waves acquired in a relatively long time range are sequentially read out as the processing proceeds.
- the time range may be set, for example, from 40 seconds to 2 minutes.
- the image processing apparatus 1300 extracts a region where lymph is present from each of the read time-series photoacoustic images.
- the image processing apparatus 1300 detects a change in luminance value between time-series photoacoustic images. There is a method of determining a portion where the change in the luminance value is large as a lymph. It should be noted that the time range and the criterion for determining whether or not the region is a lymph region are merely examples, and are appropriately determined according to the condition of the lymphatic vessels in the subject and the conditions regarding the contrast agent and light irradiation.
- the image processing apparatus 1300 distinguishes a region corresponding to blood from a region corresponding to a contrast agent based on the value of oxygen saturation, for example. Alternatively, a lymph region may be extracted.
- the image processing apparatus 1300 calculates lymph flow information based on the extracted information on the lymph region.
- one three-dimensional photoacoustic image (one frame of volume data) is generated using a photoacoustic signal derived from a photoacoustic wave generated substantially simultaneously by one light irradiation on the subject. Is done. Therefore, the subject information at each position of the photoacoustic image of one frame is derived from one light irradiation. That is, in the photoacoustic image of one frame, lymph at approximately the same timing is depicted.
- the image generation method it is possible to improve the accuracy when the image processing apparatus 1300 acquires lymph flow information from time-series three-dimensional image data.
- the change of the image value at a plurality of positions in the time-series three-dimensional image data represents the time change of the image value at substantially the same timing at each of the plurality of positions. Therefore, according to the image generation method according to the present embodiment, the accuracy of acquiring flow information based on image values at a plurality of positions in time-series three-dimensional image data is improved.
- the image processing apparatus 1300 can calculate the frequency of a change in the luminance value per unit time.
- the image processing apparatus 1300 may calculate the number of peaks of the luminance value of the lymph region or the number of times the luminance value exceeds a predetermined threshold value within a unit time (for example, 10 minutes).
- the image processing device 1300 may calculate the moving speed of the lymph.
- the moving speed of the lymph can be obtained by calculating the moving distance of the lymph region between the photoacoustic images obtained at different timings.
- the image processing apparatus 1300 calculates the center of gravity and the particle density of the lymph region based on the extracted luminance value distribution of the lymph region, and performs weighting based on those values to thereby obtain the moving speed. The accuracy of the calculation may be improved.
- an optical flow estimation technique for extracting a motion of an object from a time-series image and vectorizing the extracted motion can be used.
- the image processing apparatus 1300 may calculate the volume and the flow rate of the lymph flowing through the lymph vessel. At this time, the image processing apparatus 1300 performs system-dependent correction on the width of the lymphatic vessel in the photoacoustic image to determine the diameter of the lymphatic vessel, and can calculate the volume and flow rate based on the value of the diameter. . Further, when measuring the flow velocity, the number of times of averaging of the reconstruction at the time of generating the photoacoustic image may be reduced to a number equal to or less than a certain number.
- the image processing apparatus 1300 may set a plurality of areas associated with each other in the image, and acquire the flow information based on a change in the luminance value of each of the plurality of areas.
- the plurality of regions referred to here is at least two or more small regions, and more preferably indicates a plurality of adjacent or adjacent small regions.
- a plurality of small regions may be set at adjacent or adjacent positions on the same lymphatic vessel (in other words, upstream and downstream of the same lymphatic vessel).
- FIG. 11A it is assumed that the two small regions are set so as to include the same lymphatic vessel.
- the image processing apparatus 1300 calculates the luminance value of each of the first small area 2310a and the second small area 2310b three times in time series, compares each luminance value with a predetermined threshold, and calculates Judge darkness. Then, when it is determined that the first small area is “bright ⁇ dark ⁇ dark” and the second small area is “dark ⁇ bright ⁇ dark”, the image processing apparatus 1300 starts from the first timing. It can be determined that the lymph has flowed in the direction from the first small area toward the second small area toward the second timing. The image processing apparatus 1300 can further calculate the lymph flow velocity based on the distance between the two small areas and the time relationship of the luminance change in each small area.
- any value can be used as long as it can reflect the density of the contrast agent, such as an average luminance value and a peak luminance value. If the number of times of calculation of the luminance value is at least two or more, the flow can be detected.
- the image processing apparatus 1300 may calculate the lymph flow velocity based on the temporal change degree of the luminance value obtained by calculating the luminance change of a specific area that is a specific lymph area in the image in time series. it can. That is, it can be said that the luminance value in a certain specific region reflects the volume of lymph present in the specific region. Therefore, the temporal change of the luminance value in the specific area reflects a change in the volume of the lymph from the inflow to the outflow of the lymph in the specific area. Therefore, if the change in the brightness value can be calculated at a sufficient frame rate, the time change of the brightness value is expressed as a function of time and the brightness value. Is increasing, and the function tends to decrease during the period in which lymph flows out.
- the image processing apparatus 1300 determines whether the brightness is a function of increasing period (broken line 3110) or a function of decreasing period (broken line 3120). Then, the flow velocity of the lymph may be calculated. Since lymph generally flows intermittently, it can be assumed that a luminance waveform as shown in FIG. 11B appears periodically. Therefore, lymph flow information may be obtained by measuring the appearance frequency of this waveform.
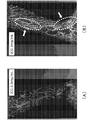
- the image processing device 1300 can also quantitatively acquire the lymph flow velocity by another calculation method based on information extracted from the time-series three-dimensional image data.
- the image of FIG. 11C shows one of the three-dimensional image data acquired in time series.
- an image in which lymph vessels have been emphasized may be used.
- the image processing apparatus 1300 selects a region 2320 corresponding to a lymph vessel.
- the image processing apparatus 1300 determines a target time range (for example, one minute) from the time-series three-dimensional image data.
- a representative value of the luminance value in the time direction is determined for each position in the length direction on the region 2320 in the determined time range.
- FIG. 11D is a graph in which the horizontal axis represents time, and the vertical axis represents each position in the length direction of the region 2320, and the maximum value 3200 obtained above is plotted. This graph shows that the position showing high brightness also moves in accordance with the movement of the lymph in the lymphatic vessel.
- the image processing apparatus 1300 obtains an approximate function 3210 by performing fitting based on the plurality of plotted local maxima 3200, and calculates the lymph flow velocity based on the slope of the approximate function 3210. Note that it is not always necessary to use the maximum value.
- a graph may be created by a color scale display according to the luminance value.
- the least squares method can be used as a fitting method when calculating the inclination, but the present invention is not limited to this.
- the time-series three-dimensional image data used for acquiring the flow information may include at least three-dimensional image data generated by respective light pulses of two wavelengths. In this case, the flow information may be calculated from the time change of the time-series three-dimensional image data corresponding to at least two wavelengths.
- the image processing apparatus 1300 stores the calculated flow information in the storage device 1200.
- step S730 Displaying the acquired flow information
- the processing from step S730 to step S750 may be executed as a series of processing, or may be executed independently.
- the image processing device 1300 as a display control unit generates image data using the flow information and causes the display device 1400 to display the image data.
- the display method is arbitrary, but a method that facilitates confirmation of flow information by a user is preferable.
- the image processing device 1300 can color the extracted lymph region with a predetermined color scale according to the frequency of the flow acquired in S720.
- a color scale may be used in which a lymph region with a higher flow frequency is displayed closer to red, and a lymph region with a lower frequency is displayed closer to blue. According to this method, it is possible to provide a criterion for determining whether or not the flow of a certain lymphatic vessel is active.
- the image processing device 1300 may display the luminance of a certain lymph region with a luminance value according to the maximum luminance value in a time-series photoacoustic image. The display using the color scale and the display using the maximum luminance value may be used together.
- the system accepts a position designation by the user via the input device 1500, and causes the image processing device 1300 to separately display the calculation result of the flow information at the designated position on the display device 1400. Is also good. Further, the system may present the flow information to the user in the form of text or voice instead of or together with the image information.
- the image processing apparatus 1300 may also display the direction of lymph flow with a marker or arrow so that the user can easily understand the direction.
- the image processing apparatus 1300 may also set a region of interest in the lymph region, and calculate and display the temporal variation of the lymph in the region of interest.
- a method for selecting an image for example, a method of comparing the luminance in the lymph region between temporally adjacent images and storing the luminance in the storage device 1200 when there is a luminance change equal to or more than a value that can be determined to have a lymph flow. is there.
- this method an image to be confirmed by the user can be promptly displayed on the display device 1400. Further, since it is not necessary to store data during a period during which the lymph flow cannot be confirmed, the data capacity can be reduced.
- the image processing apparatus 1300 uses the data compressed and stored in this way, the image processing apparatus 1300 generates a still image showing the lymph flow or a moving image in which the lymph flow is repeatedly displayed in a loop, and causes the display device 1400 to display the moving image. be able to.
- the oxygen saturation information of the spectral image can be used when selecting data having flow information in this step.
- data of an image that can be determined to have a lymph flow may be identifiable by a method such as adding metadata. According to this method, an image to be confirmed by the user can be promptly displayed on the display device 1400.
- the image processing apparatus 1300 calculates the diagnosis support information based on the information acquired in each of the above steps and displays the information on the display device 1400.
- the image processing apparatus 1300 quantitatively analyzes lymph flow information and calculates and presents information for diagnosing lymphedema or diabetes stage based on the result. Examples of the information to be presented include a stage suggestion and an estimated value.
- the image processing apparatus 1300 reads from the storage device 1400 a table indicating the relationship between the value of the flow frequency, the flow rate, the flow rate, and the like and the stage of lymphedema, and compares the table with the flow information calculated in the above step to provide the presentation information. Is calculated.
- the image processing apparatus 1300 compares the result of the actual diagnosis by the user with the estimated stage, and updates the estimation data based on the result of the correct / false determination, thereby improving the accuracy of the estimation. It is also preferable to provide such a learning function.
- the system according to the present embodiment can acquire the flow information in the lymph by executing the processing of each step in FIG.
- the flow information can be displayed to the user as needed, the flow information can be stored in a preferable format, and information for assisting the user can be generated and presented based on the flow information.
- the image processing apparatus 1300 as a display control unit causes the display device 1400 to display a spectral image so that an area corresponding to a contrast agent and an area other than the area can be identified.
- a rendering method any method such as a maximum intensity projection (MIP), a volume rendering, and a surface rendering can be adopted.
- MIP maximum intensity projection
- a volume rendering a volume rendering
- a surface rendering can be adopted.
- setting conditions such as a display area and a line-of-sight direction when rendering a three-dimensional image in two dimensions can be arbitrarily specified according to the observation target.
- a spectral image is generated according to Equation (1) using photoacoustic waves obtained by setting the wavelengths of irradiation light to 797 nm and 835 nm.
- the image value corresponding to the contrast agent in the spectral image generated according to Equation (1) is a negative value, regardless of the ICG concentration. .
- the image processing apparatus 1300 causes the GUI to display a color bar 2400 as a color scale indicating the relationship between the image value of the spectral image and the display color.
- the image processing apparatus 1300 determines a numerical range of image values to be assigned to the color scale based on information on the contrast agent (for example, information indicating that the type of the contrast agent is ICG) and information indicating the wavelength of irradiation light. You may decide.
- the image processing apparatus 1300 may determine a numerical range including a negative image value corresponding to the arterial oxygen saturation, the venous oxygen saturation, and the contrast agent.
- the image processing apparatus 1300 may determine a numerical range of -100% to 100% and set a color bar 2400 in which -100% to 100% is assigned to a color gradation that changes from blue to red. With such a display method, in addition to the identification of the artery and vein, it is also possible to identify the area corresponding to the negative contrast agent. In addition, the image processing apparatus 1300 may cause the indicator 2410 indicating the numerical value range of the image value corresponding to the contrast agent to be displayed based on the information regarding the contrast agent and the information indicating the wavelength of the irradiation light.
- a negative value area is indicated by an indicator 2410 as a numerical value range of an image value corresponding to ICG.
- the image processing apparatus 1300 as the region determining means may determine a region corresponding to the contrast agent in the spectral image based on the information on the contrast agent and the information indicating the wavelength of the irradiation light. For example, the image processing apparatus 1300 may determine a region having a negative image value in the spectral image as a region corresponding to the contrast agent. Then, the image processing device 1300 may display the spectral image on the display device 1400 so that the region corresponding to the contrast agent and the other region can be identified.
- the image processing apparatus 1300 displays an indicator (for example, a frame) indicating a region corresponding to the contrast agent, causing the display color of the region corresponding to the contrast agent to be different from that of the other region, blinking the region corresponding to the contrast agent, and the like.
- An identification display such as display may be employed.
- the display mode may be switched to a display mode for selectively displaying an image value corresponding to the ICG.
- the image processing apparatus 1300 selects a voxel having a negative image value from the spectral image and selectively renders the selected voxel,
- the ICG area may be selectively displayed.
- the user may select an item 2710 corresponding to an artery display or an item 2720 corresponding to a vein display.
- the image processing apparatus 1300 Based on a user's instruction, the image processing apparatus 1300 selectively selects an image value corresponding to an artery (for example, 90% or more and 100% or less) or an image value corresponding to a vein (for example, 60% or more and less than 90%).
- the display mode may be switched to the display mode.
- the numerical value range of the image value corresponding to the artery or the image value corresponding to the vein may be changeable based on a user's instruction.
- hue, lightness, and saturation is assigned to the image value of the spectral image
- an image in which the remaining parameters of hue, lightness, and saturation are assigned to the image value of the photoacoustic image is displayed as a spectral image.
- an image in which hue and saturation are assigned to image values of a spectral image and brightness is assigned to image values of a photoacoustic image may be displayed as a spectral image.
- the conversion table from the image value of the photoacoustic image to the brightness may be changed according to the image value of the spectral image. For example, when the image value of the spectral image is included in the numerical value range of the image value corresponding to the contrast agent, the brightness corresponding to the image value of the photoacoustic image may be smaller than that corresponding to the blood vessel.
- the conversion table is a table indicating the brightness corresponding to each of the plurality of image values.
- the image value of the spectral image is included in the numerical value range of the image value corresponding to the contrast agent, the brightness corresponding to the image value of the photoacoustic image may be larger than that corresponding to the blood vessel. That is, when the contrast agent region is compared with the blood vessel region, if the image value of the photoacoustic image is the same, the brightness of the contrast agent region may be greater than that of the blood vessel region.
- the numerical value range of the image value of the photoacoustic image that does not convert the image value of the photoacoustic image into the brightness may differ depending on the image value of the spectral image.
- the conversion table may be changed to a table suitable for the type and concentration of the contrast agent and the wavelength of the irradiation light. Therefore, the image processing apparatus 1300 may determine the conversion table from the image value of the photoacoustic image to the brightness based on the information regarding the contrast agent and the information indicating the wavelength of the irradiation light. If it is estimated that the image value of the photoacoustic image corresponding to the contrast agent is larger than that corresponding to the blood vessel, the image processing apparatus 1300 sets the brightness corresponding to the image value of the photoacoustic image corresponding to the contrast agent to the blood vessel. It may be smaller than the corresponding one.
- the image processing apparatus 1300 may determine the brightness corresponding to the image value of the photoacoustic image corresponding to the contrast agent. May be larger than that corresponding to a blood vessel.
- the GUI shown in FIG. 10 includes an absorption coefficient image (first photoacoustic image) 2100 corresponding to a wavelength of 797 nm, an absorption coefficient image (second photoacoustic image) 2200 corresponding to a wavelength of 835 nm, and an oxygen saturation image (spectral image) 2300. Is displayed.
- the GUI may display which wavelength is generated by each image. In the present embodiment, both the photoacoustic image and the spectral image are displayed, but only the spectral image may be displayed.
- the image processing device 1300 may switch between displaying a photoacoustic image and displaying a spectral image based on a user's instruction.
- the display unit 160 may be capable of displaying a moving image.
- the image processing apparatus 1300 generates at least one of the first photoacoustic image 2100, the second photoacoustic image 2200, and the spectral image 2300 in time series, and generates moving image data based on the generated time-series image. It may be configured to generate and output to the display unit 160.
- the moving image display it is possible to repeatedly display a state in which lymph flows.
- the speed of the moving image may be a predetermined speed specified in advance or a predetermined speed specified by the user.
- the present embodiment is a method of displaying an image obtained by repeatedly irradiating a light pulse and acquiring a three-dimensional image of the light absorber distribution of the subject in a specific region of the subject substantially continuously.
- the present invention can also be implemented as an image display method for repeatedly reproducing and displaying a series of continuously acquired images at a predetermined speed.
- the flow information of the substance in the specific area may be displayed on the same screen at least in luminance display, color display, graph display, and / or numerical display in association with the specific area. Also, at least one of the specific areas can be highlighted.
- fast-forward display may be enabled.
- the frame rate of the moving image be variable in the display unit 160 that can display the moving image.
- a window for the user to manually input the frame rate, a slide bar for changing the frame rate, and the like may be added to the GUI of FIG.
- the lymph fluid flows intermittently in the lymphatic vessels, only part of the acquired time-series volume data that can be used to confirm the lymph flow is used. Therefore, if real-time display is performed when checking the flow of lymph, efficiency may decrease. Therefore, by making the frame rate of the moving image displayed on the display unit 160 variable, the fast-moving display of the displayed moving image becomes possible, so that the user can confirm the state of the fluid in the lymphatic vessel in a short time. Become.
- the display unit 160 may be capable of repeatedly displaying a moving image within a predetermined time range. At this time, it is also preferable to add a GUI such as a window or a slide bar for enabling the user to specify a range in which repeated display is performed, to FIG. This makes it easier for the user to grasp, for example, how the fluid flows in the lymphatic vessels.
- a GUI such as a window or a slide bar
- the display method of the flow information in the specific area is not limited to the above.
- the image processing apparatus 1300 as the display control unit associates the flow information in the specific area with the specific area, and uses at least one of a brightness display, a color display, a graph display, and a numerical display to display the flow information of the display device 1400. They may be displayed on the same screen. Further, the image processing device 1300 as a display control unit may highlight at least one of the specific regions.
- At least one of the image processing apparatus 1300 and the computer 150 as the information processing apparatus includes a spectral image acquisition unit, a contrast agent information acquisition unit, an area determination unit, a photoacoustic image acquisition unit, and a display control unit. It functions as a device having at least one.
- each means may be comprised by mutually different hardware, and may be comprised by one hardware.
- a plurality of units may be configured by one piece of hardware.
- the blood vessel and the contrast agent can be identified.
- the image value corresponding to the contrast agent is a blood vessel and the contrast agent.
- the image processing described in this step can be applied to a case where the image value of the spectral image (oxygen saturation image) corresponding to the contrast agent becomes smaller than 60% or larger than 100%. .
- the image processing according to the present embodiment is applied to a photoacoustic image corresponding to one wavelength. May be. That is, the image processing apparatus 1300 determines a region corresponding to the contrast agent in the photoacoustic image based on the information regarding the contrast agent, and identifies the region corresponding to the contrast agent and the region other than the region. A photoacoustic image may be displayed. In addition, the image processing apparatus 1300 may display a spectral image or a photoacoustic image so that a region having a numerical value range of an image value corresponding to a preset contrast agent can be distinguished from other regions. .
- the wavelength may be determined by the wavelength determining method according to the present embodiment. That is, the computer 150 may determine the wavelength of the irradiation light based on the information regarding the contrast agent. In this case, the computer 150 preferably determines a wavelength at which the image value of the region of the contrast agent in the photoacoustic image can be distinguished from the image value of the region of the blood vessel.
- the light irradiating unit 110 may irradiate the subject 100 with light having a wavelength set in advance so that the image value of the contrast agent region in the photoacoustic image and the image value of the blood vessel region can be identified. Good. Further, the light irradiating unit 110 irradiates the subject 100 with light of a plurality of wavelengths set in advance so that the image value of the region of the contrast agent in the spectral image and the image value of the region of the blood vessel can be identified. Good.
- the present invention is also realized by executing the following processing. That is, software (program) that realizes the functions of the above-described embodiments is supplied to a system or apparatus via a network or various storage media, and a computer (or CPU, MPU, or the like) of the system or apparatus reads the program and reads the program. This is the process to be performed.
Landscapes
- Life Sciences & Earth Sciences (AREA)
- Health & Medical Sciences (AREA)
- Biomedical Technology (AREA)
- Biophysics (AREA)
- Nuclear Medicine, Radiotherapy & Molecular Imaging (AREA)
- Pathology (AREA)
- Radiology & Medical Imaging (AREA)
- Engineering & Computer Science (AREA)
- Physics & Mathematics (AREA)
- Heart & Thoracic Surgery (AREA)
- Medical Informatics (AREA)
- Molecular Biology (AREA)
- Surgery (AREA)
- Animal Behavior & Ethology (AREA)
- General Health & Medical Sciences (AREA)
- Public Health (AREA)
- Veterinary Medicine (AREA)
- Ultra Sonic Daignosis Equipment (AREA)
Applications Claiming Priority (2)
| Application Number | Priority Date | Filing Date | Title |
|---|---|---|---|
| JP2018-155034 | 2018-08-21 | ||
| JP2018155034A JP7320221B2 (ja) | 2018-08-21 | 2018-08-21 | 画像処理装置、画像処理方法、画像表示方法、および、プログラム |
Publications (1)
| Publication Number | Publication Date |
|---|---|
| WO2020039641A1 true WO2020039641A1 (ja) | 2020-02-27 |
Family
ID=69593073
Family Applications (1)
| Application Number | Title | Priority Date | Filing Date |
|---|---|---|---|
| PCT/JP2019/013968 Ceased WO2020039641A1 (ja) | 2018-08-21 | 2019-03-29 | 画像処理装置、画像処理方法、画像表示方法、および、プログラム |
Country Status (2)
| Country | Link |
|---|---|
| JP (2) | JP7320221B2 (https=) |
| WO (1) | WO2020039641A1 (https=) |
Families Citing this family (1)
| Publication number | Priority date | Publication date | Assignee | Title |
|---|---|---|---|---|
| JP7479935B2 (ja) * | 2020-05-26 | 2024-05-09 | キヤノンメディカルシステムズ株式会社 | 体液解析装置、体液解析装置の制御方法、およびプログラム |
Citations (3)
| Publication number | Priority date | Publication date | Assignee | Title |
|---|---|---|---|---|
| JP2003153900A (ja) * | 2001-11-22 | 2003-05-27 | Toshiba Corp | 超音波診断装置及び超音波診断装置制御方法 |
| JP2011189175A (ja) * | 2011-05-31 | 2011-09-29 | Toshiba Corp | 超音波診断装置 |
| JP2017108964A (ja) * | 2015-12-17 | 2017-06-22 | キヤノン株式会社 | 被検体情報取得装置 |
Family Cites Families (4)
| Publication number | Priority date | Publication date | Assignee | Title |
|---|---|---|---|---|
| JP2003210456A (ja) | 2002-01-21 | 2003-07-29 | Toshiba Corp | 時系列画像の処理装置 |
| JP5810050B2 (ja) * | 2011-08-31 | 2015-11-11 | 富士フイルム株式会社 | 音響画像生成装置および音響画像生成方法 |
| WO2017002337A1 (ja) * | 2015-06-30 | 2017-01-05 | 富士フイルム株式会社 | 光音響画像生成装置及び挿入物 |
| US10327646B2 (en) * | 2016-02-02 | 2019-06-25 | Illumisonics Inc. | Non-interferometric photoacoustic remote sensing (NI-PARS) |
-
2018
- 2018-08-21 JP JP2018155034A patent/JP7320221B2/ja active Active
-
2019
- 2019-03-29 WO PCT/JP2019/013968 patent/WO2020039641A1/ja not_active Ceased
-
2023
- 2023-07-10 JP JP2023112970A patent/JP7706722B2/ja active Active
Patent Citations (3)
| Publication number | Priority date | Publication date | Assignee | Title |
|---|---|---|---|---|
| JP2003153900A (ja) * | 2001-11-22 | 2003-05-27 | Toshiba Corp | 超音波診断装置及び超音波診断装置制御方法 |
| JP2011189175A (ja) * | 2011-05-31 | 2011-09-29 | Toshiba Corp | 超音波診断装置 |
| JP2017108964A (ja) * | 2015-12-17 | 2017-06-22 | キヤノン株式会社 | 被検体情報取得装置 |
Also Published As
| Publication number | Publication date |
|---|---|
| JP7706722B2 (ja) | 2025-07-14 |
| JP2023123874A (ja) | 2023-09-05 |
| JP7320221B2 (ja) | 2023-08-03 |
| JP2020028390A (ja) | 2020-02-27 |
Similar Documents
| Publication | Publication Date | Title |
|---|---|---|
| US20180228377A1 (en) | Object information acquiring apparatus and display method | |
| WO2018230409A1 (ja) | 情報処理装置、情報処理方法、及びプログラム | |
| JP2019024733A (ja) | 画像処理装置、画像処理方法、プログラム | |
| JP7706722B2 (ja) | 光音響イメージングシステム、光音響イメージングシステムの制御方法、および、プログラム | |
| US12114961B2 (en) | Image processing apparatus and image processing method and non-transitory computer-readable medium | |
| US20210169397A1 (en) | Image processing apparatus, image processing method, and non-transitory computer-readable medium | |
| JP2018126389A (ja) | 情報処理装置、情報処理方法、およびプログラム | |
| JP7205821B2 (ja) | システム | |
| JP7187336B2 (ja) | 情報処理装置、情報処理方法、およびプログラム | |
| JP7144805B2 (ja) | 画像処理装置、画像処理方法、プログラム | |
| JP2020028670A (ja) | 画像処理装置、システム、画像処理方法、プログラム | |
| JP7125709B2 (ja) | 画像処理装置、画像処理方法およびプログラム | |
| JP7118718B2 (ja) | 被検体情報取得装置、被検体情報処理方法、およびプログラム | |
| JP7142832B2 (ja) | 画像処理装置、画像処理方法、プログラム | |
| JP7226728B2 (ja) | 画像処理装置、画像処理方法、プログラム | |
| WO2020039640A1 (ja) | 情報処理装置、システム、情報処理方法、プログラム | |
| JP7314371B2 (ja) | 被検体情報取得装置、被検体情報処理方法、およびプログラム | |
| JP2020028668A (ja) | 画像処理装置、画像処理方法、プログラム | |
| JP2020162746A (ja) | 画像処理装置、画像処理方法及びプログラム |
Legal Events
| Date | Code | Title | Description |
|---|---|---|---|
| 121 | Ep: the epo has been informed by wipo that ep was designated in this application |
Ref document number: 19851396 Country of ref document: EP Kind code of ref document: A1 |
|
| NENP | Non-entry into the national phase |
Ref country code: DE |
|
| 122 | Ep: pct application non-entry in european phase |
Ref document number: 19851396 Country of ref document: EP Kind code of ref document: A1 |