WO2019065952A1 - 状態監視装置および状態監視システム - Google Patents
状態監視装置および状態監視システム Download PDFInfo
- Publication number
- WO2019065952A1 WO2019065952A1 PCT/JP2018/036218 JP2018036218W WO2019065952A1 WO 2019065952 A1 WO2019065952 A1 WO 2019065952A1 JP 2018036218 W JP2018036218 W JP 2018036218W WO 2019065952 A1 WO2019065952 A1 WO 2019065952A1
- Authority
- WO
- WIPO (PCT)
- Prior art keywords
- vibration data
- vibration
- acceleration sensors
- control unit
- diagnostic parameter
- Prior art date
- Legal status (The legal status is an assumption and is not a legal conclusion. Google has not performed a legal analysis and makes no representation as to the accuracy of the status listed.)
- Ceased
Links
Images







Classifications
-
- F—MECHANICAL ENGINEERING; LIGHTING; HEATING; WEAPONS; BLASTING
- F03—MACHINES OR ENGINES FOR LIQUIDS; WIND, SPRING, OR WEIGHT MOTORS; PRODUCING MECHANICAL POWER OR A REACTIVE PROPULSIVE THRUST, NOT OTHERWISE PROVIDED FOR
- F03D—WIND MOTORS
- F03D17/00—Monitoring or testing of wind motors, e.g. diagnostics
-
- G—PHYSICS
- G01—MEASURING; TESTING
- G01H—MEASUREMENT OF MECHANICAL VIBRATIONS OR ULTRASONIC, SONIC OR INFRASONIC WAVES
- G01H17/00—Measuring mechanical vibrations or ultrasonic, sonic or infrasonic waves, not provided for in the other groups of this subclass
-
- G—PHYSICS
- G01—MEASURING; TESTING
- G01M—TESTING STATIC OR DYNAMIC BALANCE OF MACHINES OR STRUCTURES; TESTING OF STRUCTURES OR APPARATUS, NOT OTHERWISE PROVIDED FOR
- G01M99/00—Subject matter not provided for in other groups of this subclass
Definitions
- the present invention relates to a state monitoring device and a state monitoring system including the state monitoring device.
- Patent Document 1 Japanese Patent Application Laid-Open No. 2013-185507 detects abnormal vibration of a wind turbine by comparing a diagnostic parameter calculated from data measured by various sensors with a threshold value.
- a monitoring system is disclosed.
- Patent Document 1 compares a frequency spectrum calculated from data measured by various sensors with a defect frequency calculated in advance. Estimate the part (vibration source) where the abnormal vibration is occurring.
- the defect frequency can be calculated for periodic abnormal vibration. Since it is difficult to calculate the defect frequency for non-periodic abnormal vibration, the condition monitoring system disclosed in Japanese Patent Laid-Open No. 2013-185507 (patent document 1) may be a non-periodic abnormal vibration. It is difficult to estimate the vibration source.
- the present invention has been made to solve the above-described problems, and an object thereof is to estimate a vibration source of abnormal vibration regardless of the periodicity of the abnormal vibration.
- a state monitoring device includes a storage unit and a control unit.
- the storage unit stores a plurality of vibration data respectively measured by a plurality of acceleration sensors installed in the monitoring target.
- the control unit specifies a reference time when any of the plurality of vibration data exceeds the threshold.
- a plurality of vibration data and information on a plurality of acceleration sensors are stored in association with each other.
- the control unit specifies a first acceleration sensor that measures first vibration data that has exceeded the threshold most quickly among the plurality of vibration data in a first reference time interval including a reference time.
- the vibration source of the abnormal vibration can be estimated to be near the position where the first acceleration sensor is installed.
- FIG. 1 is a diagram schematically showing a configuration of a wind turbine that is a monitoring target of a state monitoring system according to a first embodiment.
- FIG. 1 is a functional block diagram showing a functional configuration of a state monitoring system according to Embodiment 1. It is a flowchart which shows the outline
- FIG. 10 It is a time chart which expands and shows the part enclosed with the dotted line of FIG. It is a flowchart which shows concretely the flow of estimation processing of the vibration source of abnormal vibration of FIG. It is a figure which shows a mode that the result of the estimation process of the vibration source of the abnormal vibration shown by FIG. 8 was displayed on the display part of FIG. It is a flowchart which shows concretely the flow of estimation processing of the vibration source of abnormal vibration in FIG. 3 in Embodiment 2.
- FIG. It is a figure which shows a mode that the result of the estimation process of the vibration source of the abnormal vibration shown by FIG. 10 was displayed on the display part of FIG. It is a figure which shows arrangement
- FIG. 1 It is a figure which shows an example of a diagnostic parameter set, and an example of a diagnostic parameter group. It is a figure which shows the diagnostic parameter group created when the several specific location of a wind power generator was each vibrated by the user. It is a flowchart which shows the process performed by a control part, when creating a model diagnostic parameter group. It is a flowchart which shows concretely the flow of estimation processing of the vibration source of abnormal vibration in FIG. 3 in Embodiment 3. FIG. It is a figure which shows an example of the diagnostic parameter group created at the time of state monitoring.
- FIG. 1 is the figure which showed roughly the structure of the wind power generator 10 which is a monitoring object of the state monitoring system which concerns on Embodiment 1.
- the wind turbine 10 includes a main shaft 20, a hub 22, a blade 30, a speed increasing device 40, a generator 50, a main bearing 60, a plurality of acceleration sensors 70, and state monitoring. And an apparatus 80.
- the speed increasing gear 40, the generator 50, the main bearing 60, the plurality of acceleration sensors 70, and the state monitoring device 80 are stored in the nacelle 90.
- the nacelle 90 is supported by the tower 100.
- the main shaft 20 enters the nacelle 90 and is connected to the input shaft of the step-up gear 40.
- the main shaft 20 is rotatably supported by the main bearing 60.
- the main shaft 20 transmits the rotational torque generated by the blade 30 which receives the wind force to the input shaft of the step-up gear 40.
- the blade 30 is provided at the tip of the main shaft 20 via the hub 22 and converts wind power into rotational torque and transmits it to the main shaft 20.
- the main bearing 60 is fixed in the nacelle 90 and rotatably supports the main shaft 20.
- the main bearing 60 is constituted by a rolling bearing, and is constituted by, for example, a self-aligning roller bearing, a tapered roller bearing, a cylindrical roller bearing, a ball bearing or the like. These bearings may be in a single row or in multiple rows.
- the plurality of acceleration sensors 70 are fixed to each device inside the nacelle 90.
- an acceleration sensor 70 fixed on the upper surface of the main bearing 60 monitors the state of the main bearing 60.
- An acceleration sensor 70 fixed on the upper surface of the speed increasing gear 40 monitors the state of the speed increasing gear 40.
- An acceleration sensor 70 fixed on the upper surface of the generator 50 monitors the state of the generator 50.
- the speed increasing machine 40 is provided between the main shaft 20 and the generator 50, accelerates the rotational speed of the main shaft 20, and outputs the speed to the generator 50.
- the speed increasing gear 40 is configured by a gear speed increasing mechanism including a planetary gear, an intermediate shaft, a high speed shaft and the like.
- a plurality of bearings rotatably supporting a plurality of shafts are also provided in the speed increasing gear 40.
- the generator 50 is connected to the output shaft of the speed increaser 40, and generates electric power by the rotational torque received from the speed increaser 40.
- the generator 50 is configured of, for example, an induction generator. In the generator 50, bearings for rotatably supporting the rotor are also provided.
- the state monitoring device 80 is provided inside the nacelle 90, and receives vibration data of each device detected by the plurality of acceleration sensors 70. Although not shown, the plurality of acceleration sensors 70 and the state monitoring device 80 are connected by a wired cable. As vibration data of each device, data such as sound or AE (Acoustic emission) may be detected.
- AE Acoustic emission
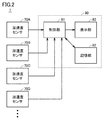
- FIG. 2 is a functional block diagram showing a functional configuration of the state monitoring system 1 according to the first embodiment.
- the condition monitoring system 1 includes a plurality of acceleration sensors 70 and a condition monitoring device 80.
- the state monitoring device 80 includes a control unit 81, a storage unit 82, and a display unit 83.
- the plurality of acceleration sensors 70 include acceleration sensors 70A to 70D.
- the plurality of acceleration sensors 70 measure vibration data of the wind turbine 10 and output the measured data to the control unit 81.
- the plurality of acceleration sensors 70 measure vibration data at substantially the same timing (synchronous sampling).
- the synchronous sampling makes it easy to compare vibration data because the measurement timing of each vibration data measured by the plurality of acceleration sensors 70 is aligned. It is desirable that the sampling frequency be high. It is desirable that the frequency band measurable by each acceleration sensor 70 be as wide as possible.
- the control unit 81 analyzes vibration data from the plurality of acceleration sensors 70 to detect abnormal vibration and estimate a vibration source of the abnormal vibration.
- the control unit 81 stores, for example, vibration data, diagnostic parameters (features) such as an effective value calculated from the vibration data, and envelope data in the storage unit 82.
- the control unit 81 displays information on the vibration source of the abnormal vibration on the display unit 83.
- the control unit 81 includes a computer such as a CPU (Central Processing Unit).
- each identifier of the plurality of acceleration sensors 70 and information on each arrangement location of the plurality of acceleration sensors 70 are associated in advance and stored.
- a threshold for detecting abnormal vibration and a time interval to be referred to in the estimation processing of the vibration source are stored in advance.
- FIG. 3 is a flowchart showing an outline of processing of state monitoring performed by the control unit 81 of FIG.
- the process shown in FIG. 3 is called by a main routine (not shown).
- the step is simply described as S.
- the control unit 81 detects abnormal vibration in S ⁇ b> 1 and advances the process to S ⁇ b> 2.
- the control unit 81 estimates the vibration source of the abnormal vibration in S2 and returns the process to the main routine.
- FIG. 4 is a flow chart specifically showing the process (S1) for detecting the abnormal vibration shown in FIG.
- the control unit 81 performs a filtering process on vibration data from a plurality of acceleration sensors to extract vibration data of a specific frequency band using a band pass filter, and the process proceeds to S12. Advance.
- control unit 81 calculates an envelope for vibration data of a specific frequency band, and advances the process to S13.
- the control unit 81 detects time t1 at which the envelope exceeds the threshold Th.
- the threshold value Th can be appropriately calculated by an actual machine experiment or simulation.
- the abnormal vibration caused by each device of the wind turbine generator 10 may have periodicity depending on the specifications (for example, size and weight) of the device. Based on the periodicity of abnormal vibration, it is possible to estimate that a device having specifications corresponding to the periodicity is a vibration source.
- the abnormal vibration does not necessarily have periodicity.
- stick-slip self-induced vibration caused by repetition of adhesion and sliding of microscopic friction surface caused between friction surfaces
- abnormal vibration occurs when it occurs suddenly or irregularly. In most cases, no periodicity is observed.
- the period of abnormal vibration becomes unstable due to the operating condition of monitoring target (for example, change of load condition) or when the operation of monitoring target changes rapidly due to abnormality (for example, The same applies to the case where the rotational speed changes significantly.
- the abnormal vibration has periodicity
- a device whose specification is unknown is included in the wind turbine generator 10 to be monitored, it is difficult to identify the device as a vibration source from the periodicity of abnormal vibration caused by the device.
- this may occur due to an abnormality in the device even if the specifications are clear. It is difficult to grasp the periodicity of all abnormal vibrations.
- a plurality of devices having similar specifications such as devices of the same part number or similar shapes, are included, even if the specifications of each device are clear, the vibration from the periodicity of abnormal vibration Identifying the source is difficult.
- the vibration source of the abnormal vibration is the acceleration sensor in which the abnormal vibration is detected most quickly. It is estimated that it is near. According to the state monitoring device 80 according to the first embodiment, the vibration source of the abnormal vibration can be estimated regardless of the periodicity of the abnormal vibration.
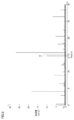
- FIG. 5 is a diagram showing together a time chart of vibration data obtained by performing filtering and envelope processing on each of the vibration data measured by the plurality of acceleration sensors 70.
- the envelopes E1 to E4 calculated from the vibration data measured by the acceleration sensors 70A to 70D are respectively shown. However, in the time scale of FIG. 5, the envelopes E1 to E4 almost overlap There is.
- the elapsed time from the state monitoring start time is set as the time. The same applies to FIGS. 6, 7, 9 and 11.
- the reference time t1 is a time when the envelope E1 of the vibration data measured by the acceleration sensor 70A exceeds the threshold Th.
- FIG. 6 is a time chart showing an enlarged portion VI surrounded by a dotted line in FIG.
- Control unit 81 calculates times t2 to t4 at which envelopes E2 to E4 exceed threshold value Th at time intervals ⁇ ti1 (first reference time intervals) from time t10 ( ⁇ t1) to t11 (> t1). .
- the time t10 is a time that is earlier than the reference time t1 by the time interval ⁇ ti2 (second reference time interval).
- Time t11 is a time when a time interval ⁇ ti2 has elapsed from the reference time t1.
- the time interval ⁇ ti2 can be appropriately calculated by a real machine experiment or simulation.
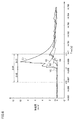
- FIG. 7 is a time chart showing an enlarged part VII surrounded by a dotted line in FIG.
- the threshold Th is 0.5.
- the earliest time is the time t1.
- the control unit 81 estimates that the vicinity of the location where the acceleration sensor 70A is disposed is a vibration source.
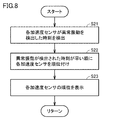
- FIG. 8 is a flow chart specifically showing the flow of the estimation process (S2) of the vibration source of the abnormal vibration of FIG.
- the control unit 81 detects times t1 to t4 at which the envelopes E1 to E4 respectively exceed the threshold value Th at times (t1- ⁇ ti2) to (t1 + ⁇ ti2) and detects abnormal vibration by the acceleration sensors 70A to 70D. The time is detected as the detected time, and the process proceeds to S22.
- control unit 81 ranks acceleration sensors 70A to 70D in the order of detection of abnormal vibration based on times t1 to t4, and advances the process to S23.
- control unit 81 displays the order of the acceleration sensors 70A to 70D on the display unit 83, and returns the process to the main routine.
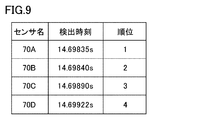
- FIG. 9 is a diagram showing the result of the process of estimating the vibration source of the abnormal vibration shown in FIG. 8 being displayed on the display unit 83 of FIG.
- the sensor names of the acceleration sensors 70A to 70D, the detection time of the abnormal vibration, and the order are displayed on the display unit 83.
- the time when the abnormal vibration is detected is earlier in the order of the acceleration sensors 70A, 70B, 70C, 70D. It is estimated that the vicinity where the acceleration sensor 70A is installed is a vibration source of abnormal vibration.
- the vibration source of the abnormal vibration can be estimated regardless of the periodicity of the abnormal vibration.
- FIG. 8 and FIG. 9 of the first embodiment are replaced with FIG. 10 and FIG. 11, respectively.
- the other configuration is the same, and therefore the description will not be repeated.
- FIG. 10 is a flow chart specifically showing the flow of the estimation process (S2) of the vibration source of the abnormal vibration of FIG. 3 in the second embodiment.
- the control unit 81 performs S21 and S22 as in the first embodiment, and advances the process to S231.
- the control unit 81 corrects the order of the acceleration sensors 70A to 70D in S231, and advances the process to S232. Specifically, when there are a plurality of acceleration sensors that have detected abnormal vibration by S 231 until the time interval ⁇ ti 3 (third reference time interval) elapses from the earliest detection time of abnormal vibration, the control unit 81 selects one of them. All acceleration sensors are ranked first. In addition, after the time interval ⁇ ti3 has elapsed since the earliest detection time of the abnormal vibration, the order of the acceleration sensor that has detected the abnormal vibration is corrected.
- the time interval ⁇ ti3 can be appropriately calculated by an actual machine experiment or simulation as a time interval at which it is considered that abnormal vibration is detected almost simultaneously. In the second embodiment, the time interval ⁇ ti3 is 5.0 ⁇ 10 ⁇ s.
- control unit 81 causes display unit 83 to display the correction order of acceleration sensors 70A to 70D, and returns the process to the main routine.
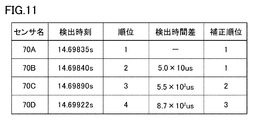
- FIG. 11 is a diagram showing the result of the process of estimating the vibration source of abnormal vibration shown in FIG. 10 being displayed on the display unit 83 of FIG.
- the sensor names of the acceleration sensors 70A to 70D, the detection time of abnormal vibration, the rank, the detection time difference, and the correction rank are displayed.
- the time when the abnormal vibration is detected is earlier in the order of the acceleration sensors 70A, 70B, 70C, 70D. Since the difference between the respective times at which the acceleration sensors 70A and 70B detect abnormal vibration is 5.0 ⁇ 10 ⁇ s, both of the acceleration sensors 70A and 70B are displayed as first place. Therefore, it is estimated that the vibration source of the abnormal vibration is approximately equidistant from the acceleration sensors 70A and 70B.
- the ranks of the acceleration sensors 70C and 70D are corrected from the third and fourth places to the second and third places, respectively.
- acceleration sensors 70A to 70D are arranged at positions as shown in FIG. In FIG. 12, position P0 indicates the actual position of the vibration source of abnormal vibration. Position P0 is approximately equidistant from acceleration sensors 70A and 70B.
- the acceleration sensor 70A is displayed as the first place, so that the vibration source of the abnormal vibration is estimated to be in the vicinity where the acceleration sensor 70A is disposed.
- the vibration source is estimated to be at position P1, for example.
- both acceleration sensors 70A and 70B are displayed as first place.
- the vibration source is assumed to be, for example, at position P2, because it is considered that the vibration source is approximately equidistant from the acceleration sensors 70A and 70B.
- the position P2 is closer to the actual position P0 of the vibration source than the position P1. According to the second embodiment, the accuracy of estimation of the vibration source can be improved as compared with the first embodiment.
- the vibration source of the abnormal vibration can be estimated regardless of the periodicity of the abnormal vibration. Furthermore, according to the state monitoring device according to the second embodiment, the accuracy of estimation of the vibration source can be improved more than that of the first embodiment.
- the vibration source of the abnormal vibration is estimated based on the position of the acceleration sensor at which the abnormal vibration is first detected.
- a plurality of vibration data and a detection order of the plurality of vibration data generated by vibration of a specific location to be monitored by the user performed prior to the status monitoring, and a plurality of thresholds exceeding the threshold during status monitoring.
- a plurality of specific points of the wind turbine 10 are vibrated by the user prior to the state monitoring, and a plurality of vibration data are measured.
- a diagnostic parameter set is calculated for each of the plurality of acceleration sensors using information on the plurality of acceleration sensors and a plurality of vibration data measured by the user's excitation of the specific part.
- a diagnostic parameter group (diagnosis PG (Parameter Group)) in which a diagnostic parameter set of each of the plurality of acceleration sensors is ordered is created in the order in which the plurality of vibration data is detected.
- the diagnostic parameter group is stored in the storage unit in association with the specific part.
- FIG. 8 of Embodiment 1 is replaced with FIG. 15 regarding the flowchart which shows concretely the flow of estimation processing of the vibration source of abnormal vibration. The configuration other than these is the same as that of the first embodiment, and therefore the description will not be repeated.
- FIG. 13 is a diagram illustrating an example of a diagnostic parameter set and an example of a diagnostic parameter group.
- the diagnostic parameter set includes, as diagnostic parameters, a sensor channel (sensor ch), a detection time difference, and an amplitude peak intensity ratio.
- the sensor channel is a number assigned to each vibration sensor, and is included in the information on the plurality of acceleration sensors.
- 1 to 4 are assigned to acceleration sensors 70A to 70D, respectively.
- the detection time difference is a time difference between the time when the acceleration sensor of each rank detects the vibration data generated by the excitation of the specific part by the user, and the detection time of the vibration data detected earliest.
- the amplitude peak intensity ratio is a ratio of the peak intensity of each vibration data to the peak intensity of the earliest detected vibration data among the plurality of vibration data.
- the diagnostic parameter set may include diagnostic parameters other than the sensor channel (sensor ch), detection time difference, and amplitude peak intensity ratio.
- the diagnostic parameter set of the first-order acceleration sensor is represented as (r 11 , r 12 , r 13 ).
- the diagnostic parameter set of the second-order acceleration sensor is expressed as (r 21 , r 22 , r 23 ).
- the diagnostic parameter set of the third-order acceleration sensor is expressed as (r 31 , r 32 , r 33 ).
- the diagnostic parameter set of the fourth-order acceleration sensor is represented as (r 41 , r 42 , r 43 ).
- the diagnostic parameter group is a group of diagnostic parameters in which the diagnostic parameter set of each rank is ordered based on the rank. That is, in the diagnostic parameter group, for example, (r 11 , r 12 , r 13 , r 21 , r 22 , r 23 , r 31 , r 32 , r 33 , r 41 , r 42 , r 43 )
- the diagnostic parameter sets are ordered in the order in which the vibration data generated by the user's excitation at a specific location is detected.
- Figure 14 is a diagram showing a diagnostic parameter groups created when a plurality of specific locations P 1, P 2 of the wind turbine generator 10 is vibrated respectively by the user.
- Figure 14 (a) is a diagram showing a diagnostic parameter group that was created when a particular point P 1 is vibrated by the user.
- FIG. 14 (b) is a diagram showing a diagnostic parameter group created when the specific place P 2 is vibrated by the user.
- a diagnostic parameter group stored in advance in the storage unit prior to status monitoring will be referred to as a model diagnostic parameter group.
- FIG. 15 is a flowchart showing processing performed by the control unit 81 when creating a model diagnostic parameter group.
- the process shown in FIG. 15 is called by a main routine (not shown) for creating a model diagnostic parameter group.
- the main routine is called, for example, by the user performing a predetermined operation on the status monitoring software. The user inputs a specific part to be excited in the predetermined operation into the state monitoring software.
- the process shown in FIG. 15 is called by the main routine, for example, when vibration data generated by vibration of a specific part of the user is detected by any of the acceleration sensors 70A to 70D.
- the control unit 81 creates a model diagnostic parameter group using the vibration data measured by the acceleration sensors 70A to 70D and each sensor channel of the acceleration sensors 70A to 70D, and processes the model diagnostic parameter group. Advance to S302.
- the control unit 81 associates the specific part with the model diagnosis parameter in S302, stores the same in the storage unit, and returns the process to the main routine.
- FIG. 16 is a flow chart specifically showing a flow of estimation processing of the vibration source of abnormal vibration in FIG. 3 in the third embodiment.
- the control unit 81 performs S21 and S22 as in the first embodiment, and advances the process to S331.
- the control unit 81 creates a diagnostic parameter group using the vibration data measured by the acceleration sensors 70A to 70D at the time of state monitoring and each sensor channel of the acceleration sensors 70A to 70D, and advances the process to S332.
- the control unit 81 calculates the degree of similarity between the diagnostic parameter group and each model diagnostic parameter group in S332, and advances the process to S333.
- the control unit 81 identifies a model diagnostic parameter group that maximizes the degree of similarity with the diagnostic parameter group in S333, and displays the specific location associated with the model diagnostic parameter group on the display unit 83 as a vibration source of abnormality diagnosis. , Returns the process to the main routine.
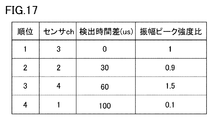
- the control unit 81 creates, for example, a diagnostic parameter group as shown in FIG. 17 in S331 of FIG. In S332, the control unit 81 first calculates the Euclidean distance ds between the diagnostic parameter group and the model diagnostic parameter group based on the following equation (1).
- the Euclidean distance ds (P k ) in Equation (1) represents the Euclidean distance between the diagnostic parameter group and the model diagnostic parameter group of the specific place P k .
- R ij (P k ) in Equation (1) represents the diagnostic parameter r ij in the model diagnostic parameter group of the specific place P k .
- r ij (Vs) represents the diagnostic parameter r ij of the diagnostic parameter group created at the time of state monitoring.
- r 12 (P 1 ) represents the first detection time difference of the model diagnostic parameter group of the specific place P 1 and is 0.
- r 33 (Vs) represents the amplitude peak intensity ratio at the third place, which is 1.5.
- ds (P 1 ) is approximately 54.91 from equation (1).
- ds (P 2 ) is approximately 67.14 from equation (1).
- the control unit 81 calculates the reciprocal of the Euclidean distance ds as the similarity sm as shown in the following Expression (2).
- sm (P k ) represents the similarity between the diagnostic parameter group and the model diagnostic parameter group of the specific place P k .
- the similarity sm is larger as the Euclidean distance ds is shorter.
- sm (P 1 ) is about 0.018.
- sm (P 2 ) is about 0.015.
- the control unit 81 calculates the maximum value sm (P max ) of the degree of similarity sm as in the following formula (3) in S333. .
- the control unit 81 estimates the specific place P max as a vibration source of the abnormal vibration and displays it on the display unit 83. Since the maximum value of sm (P 1 ) and sm (P 2 ) is sm (P 1 ), the control unit 81 displays the specific place P 1 on the display unit 83 as a vibration source of abnormal vibration.
- the similarity between the diagnostic parameter group and the model diagnostic parameter group is not limited to the reciprocal of the Euclidean distance.
- the similarity may be calculated using, for example, cosine similarity.
- weighting may be performed for each diagnostic parameter in accordance with the nature and importance of the diagnostic parameter.
- the vibration source of the abnormal vibration can be estimated regardless of the periodicity of the abnormal vibration.
- SYMBOLS 1 state monitoring system 10 wind power generator, 20 spindles, 22 hubs, 30 blades, 40 speed-up machines, 50 generators, 60 main bearings, 70, 70A to 70D acceleration sensors, 80 state monitoring devices, 81 controllers, 82 Storage unit, 83 display units, 90 nacelle, 100 towers.
Landscapes
- Engineering & Computer Science (AREA)
- Physics & Mathematics (AREA)
- General Physics & Mathematics (AREA)
- Life Sciences & Earth Sciences (AREA)
- Sustainable Development (AREA)
- Sustainable Energy (AREA)
- Chemical & Material Sciences (AREA)
- Combustion & Propulsion (AREA)
- Mechanical Engineering (AREA)
- General Engineering & Computer Science (AREA)
- Testing Of Devices, Machine Parts, Or Other Structures Thereof (AREA)
- Wind Motors (AREA)
Abstract
異常振動の周期性によらずに、異常振動の振動源を推定する。本発明に係る状態監視装置は、記憶部と、制御部とを備える。記憶部には、監視対象に設置された複数の加速度センサによってそれぞれ測定された複数の振動データが保存される。制御部は、複数の振動データのいずれかが閾値を超えた基準時刻(t1)を特定する。記憶部には、複数の振動データと、複数の加速度センサに関する情報とがそれぞれ関連付けられて保存される。制御部は、基準時刻(t1)を含む第1基準時間間隔(Δti1)において、複数の振動データのうち最も早く閾値を超えた第1振動データ(E1)を測定した第1加速度センサを特定する。
Description
この発明は、状態監視装置、および当該状態監視装置を備える状態監視システムに関する。
従来、監視対象の振動データを解析することにより、監視対象の異常振動を検出する状態監視装置が知られている。たとえば、特開2013-185507号公報(特許文献1)には、各種センサによって測定されたデータから算出される診断パラメータとしきい値とを比較することにより、風力発電装置の異常振動を検出する状態監視システムが開示されている。
特開2013-185507号公報(特許文献1)に開示されている状態監視システムは、各種センサによって測定されたデータから算出された周波数スペクトルと、予め算出された欠陥周波数とを比較することで、異常振動が発生している部位(振動源)を推定する。
欠陥周波数は、周期的な異常振動について算出可能である。非周期的な異常振動については欠陥周波数を算出することが困難であるため、特開2013-185507号公報(特許文献1)に開示されている状態監視システムによっては、非周期的な異常振動の振動源を推定することが困難である。
本発明は上記のような課題を解決するためになされたものであり、その目的は、異常振動の周期性によらずに、異常振動の振動源を推定することである。
本発明に係る状態監視装置は、記憶部と、制御部とを備える。記憶部には、監視対象に設置された複数の加速度センサによってそれぞれ測定された複数の振動データが保存される。制御部は、複数の振動データのいずれかが閾値を超えた基準時刻を特定する。記憶部には、複数の振動データと、複数の加速度センサに関する情報とがそれぞれ関連付けられて保存される。制御部は、基準時刻を含む第1基準時間間隔において、複数の振動データのうち最も早く閾値を超えた第1振動データを測定した第1加速度センサを特定する。
本発明に係る異常監視装置によれば、複数の振動データのうち最も早く閾値を超えた第1振動データを測定した第1加速度センサを特定することにより、異常振動の周期性によらずに、異常振動の振動源は第1加速度センサが設置されている位置付近であると推定することができる。
以下、本発明の実施の形態1について、図面を参照しながら詳細に説明する。なお、図中同一または相当部分には同一符号を付してその説明は繰り返さない。
[実施の形態1]
図1は、実施の形態1に係る状態監視システムの監視対象である風力発電装置10の構成を概略的に示した図である。図1を参照して、風力発電装置10は、主軸20と、ハブ22と、ブレード30と、増速機40と、発電機50と、主軸受60と、複数の加速度センサ70と、状態監視装置80とを備える。増速機40、発電機50、主軸受60、複数の加速度センサ70、および状態監視装置80は、ナセル90に格納される。ナセル90は、タワー100によって支持される。
図1は、実施の形態1に係る状態監視システムの監視対象である風力発電装置10の構成を概略的に示した図である。図1を参照して、風力発電装置10は、主軸20と、ハブ22と、ブレード30と、増速機40と、発電機50と、主軸受60と、複数の加速度センサ70と、状態監視装置80とを備える。増速機40、発電機50、主軸受60、複数の加速度センサ70、および状態監視装置80は、ナセル90に格納される。ナセル90は、タワー100によって支持される。
主軸20は、ナセル90内に進入して増速機40の入力軸に接続される。主軸20は、主軸受60によって回転自在に支持される。主軸20は、風力を受けたブレード30により発生する回転トルクを増速機40の入力軸へ伝達する。ブレード30は、ハブ22を介して、主軸20の先端に設けられ、風力を回転トルクに変換して主軸20に伝達する。
主軸受60は、ナセル90内において固設され、主軸20を回転自在に支持する。主軸受60は、転がり軸受によって構成され、たとえば、自動調芯ころ軸受や円すいころ軸受、円筒ころ軸受、玉軸受等によって構成される。なお、これらの軸受は、単列のものでも複列のものでもよい。
複数の加速度センサ70は、ナセル90の内部の各機器に固設される。たとえば、主軸受60の上面に固設された加速度センサ70は、主軸受60の状態を監視する。増速機40の上面に固設された加速度センサ70は、増速機40の状態を監視する。発電機50の上面に固設された加速度センサ70は、発電機50の状態を監視する。
増速機40は、主軸20と発電機50との間に設けられ、主軸20の回転速度を増速して発電機50へ出力する。一例として、増速機40は、遊星ギヤ、中間軸、および高速軸等を含む歯車増速機構によって構成される。なお、特に図示しないが、増速機40内にも、複数の軸を回転自在に支持する複数の軸受が設けられている。発電機50は、増速機40の出力軸に接続され、増速機40から受ける回転トルクによって発電する。発電機50は、たとえば、誘導発電機によって構成される。なお、この発電機50内にも、ロータを回転自在に支持する軸受が設けられている。
状態監視装置80は、ナセル90の内部に設けられ、複数の加速度センサ70が検出した各機器の振動データを受ける。図示はしていないが、複数の加速度センサ70と状態監視装置80とは、有線ケーブルで接続されている。各機器の振動データとして、音、あるいはAE(Acoustic emission)等のデータが検出されてもよい。
図2は、実施の形態1に係る状態監視システム1の機能構成を示す機能ブロック図である。図2に示されるように、状態監視システム1は、複数の加速度センサ70と、状態監視装置80とを備える。状態監視装置80は、制御部81と、記憶部82と、表示部83とを含む。複数の加速度センサ70は、加速度センサ70A~70Dを含む。
複数の加速度センサ70は、風力発電装置10の振動データを測定し、制御部81に出力する。複数の加速度センサ70は、ほぼ同じタイミングで振動データを測定する(同期サンプリング)。同期サンプリングとすることにより、複数の加速度センサ70によって測定された各振動データの測定タイミングがそろうため、振動データ間の比較が容易になる。サンプリング周波数は高い方が望ましい。各加速度センサ70によって測定可能な周波数帯は、できるだけ広い方が望ましい。
制御部81は、複数の加速度センサ70からの振動データを解析して、異常振動を検知するとともに、異常振動の振動源を推定する。制御部81は、たとえば、振動データ、振動データから算出された実効値等の診断パラメータ(特徴量)、および包絡線データを記憶部82に保存する。制御部81は、異常振動の振動源に関する情報を表示部83に表示する。制御部81は、CPU(Central Processing Unit)のようなコンピュータを含む。
記憶部82には、複数の加速度センサ70の各識別子と、複数の加速度センサ70の各配置箇所に関する情報が、予め関連付けられて保存されている。記憶部82には、異常振動を検知するための閾値、および振動源の推定処理において参照される時間間隔が予め保存されている。
図3は、図2の制御部81によって行なわれる状態監視の処理の概要を示すフローチャートである。図3に示される処理は、不図示のメインルーチンによって呼び出される。以下ではステップを単にSと記載する。
図3に示されるように、制御部81は、S1において異常振動を検知して処理をS2に進める。制御部81は、S2において異常振動の振動源を推定し、処理をメインルーチンに返す。
図4は、図3に示される異常振動を検知する処理(S1)を具体的に示すフローチャートである。図4に示されるように、制御部81は、複数の加速度センサからの振動データに対して、バンドパスフィルタを用いて特定の周波数帯の振動データを抽出するフィルタ処理を行ない、処理をS12に進める。制御部81は、S12において、特定の周波数帯の振動データに対して包絡線を算出し、処理をS13に進める。制御部81は、S13において、包絡線が閾値Thを超えた時刻t1を検出する。閾値Thは、実機実験あるいはシミュレーションによって適宜算出することができる。
風力発電装置10の各機器に起因する異常振動は、当該機器の諸元(たとえば寸法および重量)に依存する周期性を有する場合がある。異常振動の周期性に基づいて、当該周期性に対応する諸元を有する機器が振動源であると推定することが可能である。
しかし、異常振動には必ずしも周期性があるとは限らない。たとえば、スティックスリップ(摩擦面間に生ずる微視的な摩擦面の付着および滑りの繰り返しによって引き起こされる自励振動)のように、異常振動が突発的あるいは不規則に発生する場合には、異常振動に周期性が認められないことがほとんどである。監視対象の運転条件(たとえば荷重条件の変化)に起因して異常振動の周期が不安定となる場合、あるいは異常に起因して監視対象の運転が急激に変化するような場合(たとえば主軸20の回転数が著しく変化する場合)においても、同様である。
また、異常振動に周期性があっても、振動源を特定することが困難である場合がある。たとえば、諸元が不明である機器が監視対象である風力発電装置10に含まれる場合、当該機器に起因する異常振動の周期性から、当該機器が振動源であると特定することは困難である。また、増速機40のように、複数の軸受および歯車が組み込まれている複雑な構造を有する機器の場合、たとえ諸元が明らかであったとしても当該機器の異常に起因して発生し得る全ての異常振動の周期性を把握することは困難である。さらに、同じ品番の機器、あるいは形状が類似している等、類似の諸元を有する複数の機器が含まれる場合、各機器の諸元が明らかであったとしても、異常振動の周期性から振動源を特定することは困難である。
そこで、実施の形態1においては、複数の加速度センサ70に異常振動が到達する時刻に差があることに着目し、異常振動の振動源が、最も早く異常振動を検出した加速度センサが配置されている付近であると推定する。実施の形態1に係る状態監視装置80によれば、異常振動の周期性によらずに、異常振動の振動源を推定することができる。
図5は、複数の加速度センサ70によって測定された各振動データに対して、フィルタ処理および包絡線処理を行なった振動データのタイムチャートを併せて示す図である。図5においては、加速度センサ70A~70Dによって測定された振動データから算出された包絡線E1~E4がそれぞれ示されているが、図5のタイムスケールにおいては、包絡線E1~E4はほとんど重なっている。図5においては、状態監視の開始時刻(振動データの測定開始時刻)からの経過時間を時刻としている。図6,図7,図9,図11においても同様である。
図5に示されるように、包絡線E1~E4は、基準時刻t1付近において閾値Thを超えている。基準時刻t1は、加速度センサ70Aが測定した振動データの包絡線E1が閾値Thを超えた時刻である。
図6は、図5の点線で囲まれた部分VIを拡大して示すタイムチャートである。制御部81は、時刻t10(<t1)からt11(>t1)までの時間間隔Δti1(第1基準時間間隔)において、包絡線E2~E4が閾値Thを超えた時刻t2~t4をそれぞれ算出する。時刻t10は、基準時刻t1から時間間隔Δti2(第2基準時間間隔)だけ前の時刻である。時刻t11は、基準時刻t1から時間間隔Δti2だけ経過した時刻である。時間間隔Δti2は、実機実験あるいはシミュレーションによって適宜算出することができる。
図7は、図6の点線で囲まれた部分VIIを拡大して示すタイムチャートである。閾値Thは0.5である。図7に示されるように、時刻t1~t4(t1<t2<t3<t4)のうち、最も早い時刻は時刻t1である。最も早く閾値Thを超えた包絡線E1に対応する第1振動データを測定した加速度センサ(第1加速度センサ)は、加速度センサ70Aである。制御部81は、加速度センサ70Aの配置箇所付近が振動源であると推定する。
図8は、図3の異常振動の振動源の推定処理(S2)の流れを具体的に示すフローチャートである。制御部81は、S21において、時刻(t1-Δti2)~時刻(t1+Δti2)において、包絡線E1~E4が閾値Thをそれぞれ超えた時刻t1~t4を、加速度センサ70A~70Dによって異常振動がそれぞれ検出された時刻として検出し、処理をS22に進める。
制御部81は、S22において、時刻t1~t4に基づいて、異常振動を検出した順に加速度センサ70A~70Dを順位付けて、処理をS23に進める。
制御部81は、S23において、加速度センサ70A~70Dの順位を表示部83に表示し、処理をメインルーチンに返す。
図9は、図8に示される異常振動の振動源の推定処理の結果が、図2の表示部83に表示された様子を示す図である。図9に示されるように、表示部83には、加速度センサ70A~70Dのセンサ名、異常振動の検出時刻、および順位が表示されている。異常振動を検出した時刻は、加速度センサ70A,70B,70C,70Dの順に早い。加速度センサ70Aが設置されている付近が異常振動の振動源であると推定される。
複数の加速度センサ70が設置されている範囲が広いほど、異常振動の振動源を推定可能な範囲を広くすることができる。複数の加速度センサ70の各々の間隔が狭いほど、振動源の推定の精度を向上させることができる。
以上、実施の形態1に係る状態監視装置によれば、異常振動の周期性によらずに、異常振動の振動源を推定することができる。
[実施の形態2]
実施の形態1においては、異常振動を検出した時刻が早い順に複数の加速度センサを順位付ける場合について説明した。実施の形態2においては、異常振動を検出した時刻が異なる場合でも、ほとんど同時と見做すことができる程度の検出時間差である場合には、複数の加速度センサの順位を同順位とする場合について説明する。
実施の形態1においては、異常振動を検出した時刻が早い順に複数の加速度センサを順位付ける場合について説明した。実施の形態2においては、異常振動を検出した時刻が異なる場合でも、ほとんど同時と見做すことができる程度の検出時間差である場合には、複数の加速度センサの順位を同順位とする場合について説明する。
実施の形態2と実施の形態1との違いは、振動源の推定処理である。実施の形態2においては、実施の形態1の図8および図9が、それぞれ図10および図11にそれぞれ置き換えられる。それ以外の構成は同様であるため説明を繰り返さない。
図10は、実施の形態2における、図3の異常振動の振動源の推定処理(S2)の流れを具体的に示すフローチャートである。制御部81は、実施の形態1と同様にS21,S22を行なって、処理をS231に進める。
制御部81は、S231において加速度センサ70A~70Dの順位を補正し、処理をS232に進める。具体的には、制御部81は、S231において、最も早い異常振動の検出時刻から時間間隔Δti3(第3基準時間間隔)だけ経過するまでに異常振動を検出した加速度センサが複数ある場合、これらの加速度センサの順位を全て1位とする。また、最も早い異常振動の検出時刻から時間間隔Δti3経過した後に異常振動を検出した加速度センサの順位を補正する。時間間隔Δti3は、ほぼ同時に異常振動が検出されたと見做せる時間間隔として、実機実験あるいはシミュレーションによって適宜算出することができる。実施の形態2においては、時間間隔Δti3は5.0×10μsである。
制御部81は、S232において、加速度センサ70A~70Dの補正順位を表示部83に表示し、処理をメインルーチンに返す。
図11は、図10に示される異常振動の振動源の推定処理の結果が図2の表示部83に表示された様子を示す図である。図10に示されるように、表示部83には、加速度センサ70A~70Dのセンサ名、異常振動の検出時刻、順位、検出時間差、および補正順位が表示されている。異常振動を検出した時刻は、加速度センサ70A,70B,70C,70Dの順に早い。加速度センサ70Aおよび70Bが異常振動を検出した各時刻の差が5.0×10μsであるため、加速度センサ70Aおよび70Bは、いずれも1位と表示されている。そのため、異常振動の振動源は、加速度センサ70Aおよび70Bからほぼ等距離に位置すると推定される。加速度センサ70Cおよび70Dの順位は、3位および4位から、2位および3位にそれぞれ補正されている。
たとえば、加速度センサ70A~70Dが、図12に示されるような位置に配置さているとする。図12において、位置P0は、異常振動の振動源の実際の位置を示す。位置P0は、加速度センサ70Aおよび70Bからほぼ等距離にあるとする。
実施の形態1によれば、図8に示されるように加速度センサ70Aが1位と表示されるため、異常振動の振動源は、加速度センサ70Aが配置されている付近であると推定される。実施の形態1においては、異常振動の振動源が加速度センサ70Aおよび70Bからほぼ等距離にあることが考慮されないため、振動源は、たとえば位置P1にあると推定される。
一方、実施の形態2によれば、図11に示されるように加速度センサ70Aおよび70Bがともに1位と表示される。振動源は加速度センサ70Aおよび70Bからほぼ等距離にあることが考慮されるため、振動源は、たとえば位置P2にあると推定される。位置P2の方が、位置P1よりも実際の振動源の位置P0に近い。実施の形態2によれば、振動源の推定の精度を実施の形態1よりも向上させることができる。
以上、実施の形態2に係る状態監視装置によれば、異常振動の周期性によらずに、異常振動の振動源を推定することができる。さらに、実施の形態2に係る状態監視装置によれば、振動源の推定の精度を実施の形態1よりも向上させることができる。
[実施の形態3]
実施の形態1および2においては、異常振動を最初に検出した加速センサの位置に基づいて異常振動の振動源を推定する場合について説明した。実施の形態3においては、状態監視に先立って行なわれるユーザによる監視対象の特定箇所の加振によって生じる複数の振動データおよび当該複数の振動データの検出順序と、状態監視時に閾値を超えた複数の振動データおよび当該振動データの検出順序との類似性を算出し、当該類似性およびユーザが加振した特定箇所に基づいて振動源を推定する場合について説明する。
実施の形態1および2においては、異常振動を最初に検出した加速センサの位置に基づいて異常振動の振動源を推定する場合について説明した。実施の形態3においては、状態監視に先立って行なわれるユーザによる監視対象の特定箇所の加振によって生じる複数の振動データおよび当該複数の振動データの検出順序と、状態監視時に閾値を超えた複数の振動データおよび当該振動データの検出順序との類似性を算出し、当該類似性およびユーザが加振した特定箇所に基づいて振動源を推定する場合について説明する。
実施の形態3においては、状態監視に先立って、風力発電装置10の複数の特定箇所がユーザによって加振され、複数の振動データが測定される。複数の加速度センサに関する情報およびユーザによる特定箇所の加振によって測定された複数の振動データを用いて、複数の加速度センサの各々について診断パラメータセットが算出される。複数の振動データが検出された順に、複数の加速度センサの各々の診断パラメータセットが順序付けられた診断パラメータグループ(診断PG(Parameter Group))が作成される。当該診断パラメータグループは、特定箇所と関連付けられて記憶部に保存される。また、異常振動の振動源の推定処理の流れを具体的に示すフローチャートに関して、実施の形態1の図8が図15に置き換えられる。これら以外の構成は実施の形態1と同様であるため説明を繰り返さない。
図13は、診断パラメータセットの一例および診断パラメータグループの一例を示す図である。図13に示されるように、診断パラメータセットは、診断パラメータとして、センサチャネル(センサch)、検出時間差、および振幅ピーク強度比を含む。センサチャネルは、各振動センサに割り当てられた番号であり、複数の加速度センサに関する情報に含まれる。実施の形態3においては、加速度センサ70A~70Dに1~4がそれぞれ割り当てられている。検出時間差は、ユーザによる特定箇所の加振によって生じた振動データを各順位の加速度センサが検出した時刻と、最も早く検出された振動データの検出時刻との時間差である。振幅ピーク強度比は、複数の振動データのうち最も早く検出された振動データのピーク強度に対する各振動データのピーク強度の比である。診断パラメータセットは、センサチャネル(センサch)、検出時間差、および振幅ピーク強度比以外の診断パラメータを含んでいてもよい。
図13において、1位の加速度センサの診断パラメータセットは、(r11,r12,r13)と表されている。2位の加速度センサの診断パラメータセットは、(r21,r22,r23)と表されている。3位の加速度センサの診断パラメータセットは、(r31,r32,r33)と表されている。4位の加速度センサの診断パラメータセットは、(r41,r42,r43)と表されている。
診断パラメータグループは、各順位の診断パラメータセットが順位に基づいて順序付けられた診断パラメータのグループである。すなわち、診断パラメータグループにおいては、たとえば(r11,r12,r13,r21,r22,r23,r31,r32,r33,r41,r42,r43)のように、ユーザによる特定箇所の加振によって生じた振動データが検出された順に、診断パラメータセットが順序付けられている。
図14は、風力発電装置10の複数の特定箇所P1,P2がユーザによってそれぞれ加振された場合に作成された診断パラメータグループを示す図である。図14(a)は、特定箇所P1がユーザによって加振された場合に作成された診断パラメータグループを示す図である。図14(b)は、特定箇所P2がユーザによって加振された場合に作成された診断パラメータグループを示す図である。以下では、状態監視に先立って予め記憶部に保存されている診断パラメータグループをモデル診断パラメータグループと呼ぶ。
図15は、モデル診断パラメータグループを作成する場合に制御部81によって行なわれる処理を示すフローチャートである。図15に示される処理は、モデル診断パラメータグループ作成のための不図示のメインルーチンによって呼び出される。当該メインルーチンは、たとえばユーザが状態監視ソフトウェア上で所定のオペレーションを行なうことによって呼び出される。ユーザは、当該所定のオペレーションの中で加振する特定箇所を状態監視ソフトウェアに入力する。図15に示される処理は、たとえば、ユーザの特定箇所の加振によって生じた振動データが、加速度センサ70A~70Dのいずれかによって検出された場合にメインルーチンによって呼び出される。
図15に示されるように、制御部81は、S301において、加速度センサ70A~70Dによって測定された振動データおよび加速度センサ70A~70Dの各センサchを用いて、モデル診断パラメータグループを作成し、処理をS302に進める。制御部81は、S302において特定箇所とモデル診断パラ―メータとを関連付けて記憶部に保存し、処理をメインルーチンに戻す。
図16は、実施の形態3における、図3の異常振動の振動源の推定処理の流れを具体的に示すフローチャートである。制御部81は、実施の形態1と同様にS21,S22を行なって、処理をS331に進める。
制御部81は、S331において、状態監視時に加速度センサ70A~70Dによって測定された振動データおよび加速度センサ70A~70Dの各センサchを用いて診断パラメータグループを作成し、処理をS332に進める。制御部81は、S332において診断パラメータグループと各モデル診断パラメータグループとの類似度を算出し、処理をS333に進める。制御部81は、S333において診断パラメータグループとの類似度が最大となるモデル診断パラメータグループを特定し、当該モデル診断パラメータグループに関連付けられた特定箇所を異常診断の振動源として表示部83に表示し、処理をメインルーチンに戻す。
制御部81は、図16のS331において、たとえば図17に示されるような診断パラメータグループを作成する。制御部81は、S332において、まず以下の式(1)に基づいて診断パラメータグループとモデル診断パラメータグループとのユークリッド距離dsを算出する。

式(1)におけるユークリッド距離ds(Pk)は、診断パラメータグループと特定箇所Pkのモデル診断パラメータグループとのユークリッド距離を表す。式(1)におけるrij(Pk)は、特定箇所Pkのモデル診断パラメータグループにおける診断パラメータrijを表す。rij(Vs)は、状態監視時に作成された診断パラメータグループの診断パラメータrijを表す。たとえば、図13および図14(a)を参照して、r12(P1)は、特定箇所P1のモデル診断パラメータグループの1位の検出時間差を表し、0である。また、図13および図17を参照して、r33(Vs)は、3位の振幅ピーク強度比を表し、1.5である。
図14(a)および図17を参照して、式(1)よりds(P1)は、約54.91である。図14(b)および図17を参照して、式(1)よりds(P2)は、約67.14である。
制御部81は、S332においてユークリッド距離dsを算出した後、以下の式(2)のように、ユークリッド距離dsの逆数を類似度smとして算出する。式(2)においてsm(Pk)は、診断パラメータグループと特定箇所Pkのモデル診断パラメータグループとの類似度を表す。類似度smは、ユークリッド距離dsが短いほど大きい。sm(P1)は、約0.018である。sm(P2)は、約0.015である。

制御部81は、S332において複数の特定箇所に対応する各類似度smを算出した後、S333において、以下の式(3)のように、類似度smの最大値sm(Pmax)を算出する。制御部81は、特定箇所Pmaxを異常振動の振動源として推定し、表示部83に表示する。sm(P1),sm(P2)の最大値は、sm(P1)であるから、制御部81は、特定箇所P1を異常振動の振動源として表示部83に表示する。

診断パラメータグループとモデル診断パラメータグループとの類似度は、ユークリッド距離の逆数に限定されない。類似度は、たとえばコサイン類似度を用いて算出してもよい。また、類似度の算出にあたっては、診断パラメータの性質および重要度に応じて診断パラメータ毎に重みづけを行なってもよい。
以上、実施の形態3に係る状態監視装置によれば、異常振動の周期性によらずに、異常振動の振動源を推定することができる。
今回開示された各実施の形態は、矛盾しない範囲で適宜組み合わせて実施することも予定されている。今回開示された各実施の形態はすべての点で例示であって制限的なものではないと考えられるべきである。本発明の範囲は上記した説明ではなくて請求の範囲によって示され、請求の範囲と均等の意味および範囲内でのすべての変更が含まれることが意図される。
1 状態監視システム、10 風力発電装置、20 主軸、22 ハブ、30 ブレード、40 増速機、50 発電機、60 主軸受、70,70A~70D 加速度センサ、80 状態監視装置、81 制御部、82 記憶部、83 表示部、90 ナセル、100 タワー。
Claims (8)
- 監視対象に設置された複数の加速度センサによってそれぞれ測定された複数の振動データが保存される記憶部と、
前記複数の振動データのいずれかが閾値を超えた基準時刻を特定する制御部とを備え、
前記記憶部には、前記複数の振動データと、前記複数の加速度センサに関する情報とがそれぞれ関連付けられて保存され、
前記制御部は、前記基準時刻を含む第1基準時間間隔において、前記複数の振動データのうち最も早く前記閾値を超えた第1振動データを測定した第1加速度センサを特定する、状態監視装置。 - 前記制御部は、前記複数の振動データの各々についての包絡線が前記閾値を超えた時刻を、前記複数の振動データの各々が前記閾値を超えた時刻として検出する、請求項1に記載の状態監視装置。
- 前記第1基準時間間隔は、前記基準時刻から第2基準時間間隔前の時刻から、前記基準時刻から前記第2基準時間間隔経過後の時刻までの時間間隔である、請求項1または2に記載の状態監視装置。
- 表示部をさらに備え、
前記制御部は、前記第1基準時間間隔において、前記複数の振動データが前記閾値を超えた順に、前記複数の加速度センサの順位を前記表示部に表示する、請求項1~3のいずれかに記載の状態監視装置。 - 前記制御部は、前記第1振動データが前記閾値を超えた時刻から第3基準時間間隔経過後までに前記複数の振動データに含まれる第2振動データが前記閾値を超えた場合、前記第1加速度センサの順位および前記第2振動データを測定した第2加速度センサの順位をいずれも第1位として前記表示部に表示する、請求項4に記載の状態監視装置。
- 前記制御部は、前記複数の振動データおよび前記複数の加速度センサに関する情報を用いて、前記複数の加速度センサの各々について診断パラメータセットを算出し、前記複数の加速度センサの各々の診断パラメータセットが順序付けられた診断パラメータグループを作成し、
前記記憶部には、前記監視対象の複数の特定箇所の各々がユーザによって加振された場合に前記制御部によって作成された診断パラメータグループであるモデル診断パラメータグループが、前記監視対象の状態監視時に先立って予め保存され、
前記モデル診断パラメータグループにおいては、前記複数の加速度センサの各々が前記ユーザによる加振によって生じた振動データを検出した順に、前記複数の加速度センサの各々についての診断パラメータセットが順序付けられ、
前記制御部は、前記状態監視時の前記第1基準時間間隔において、前記複数の振動データが前記閾値を超えた順に前記複数の加速度センサの各々についての診断パラメータセットが順序付けられた診断パラメータグループを作成し、当該診断パラメータグループとの類似度が最も大きいモデル診断パラメータグループに対応する特定箇所を、異常振動の振動源として特定する、請求項1~3のいずれか1項に記載の状態監視装置。 - 前記制御部は、前記状態監視時において作成した診断パラメータグループと前記記憶部に保存されている複数のモデル診断パラメータグループの各々とのユークリッド距離の逆数を前記類似度として算出する、請求項6に記載の状態監視装置。
- 監視対象に設置された複数の加速度センサと、
前記複数の加速度センサがそれぞれ測定した複数の振動データを受ける請求項1~7のいずれか1項に記載の状態監視装置とを備える、状態監視システム。
Applications Claiming Priority (4)
| Application Number | Priority Date | Filing Date | Title |
|---|---|---|---|
| JP2017187622 | 2017-09-28 | ||
| JP2017-187622 | 2017-09-28 | ||
| JP2018-078362 | 2018-04-16 | ||
| JP2018078362A JP7169084B2 (ja) | 2017-09-28 | 2018-04-16 | 状態監視装置および状態監視システム |
Publications (1)
| Publication Number | Publication Date |
|---|---|
| WO2019065952A1 true WO2019065952A1 (ja) | 2019-04-04 |
Family
ID=65901480
Family Applications (1)
| Application Number | Title | Priority Date | Filing Date |
|---|---|---|---|
| PCT/JP2018/036218 Ceased WO2019065952A1 (ja) | 2017-09-28 | 2018-09-28 | 状態監視装置および状態監視システム |
Country Status (1)
| Country | Link |
|---|---|
| WO (1) | WO2019065952A1 (ja) |
Cited By (3)
| Publication number | Priority date | Publication date | Assignee | Title |
|---|---|---|---|---|
| CN110541795A (zh) * | 2019-08-26 | 2019-12-06 | 重庆科凯前卫风电设备有限责任公司 | 一种海上风电机组机舱振动加速度数据有效性的判定方法 |
| CN112924710A (zh) * | 2019-12-06 | 2021-06-08 | 新疆金风科技股份有限公司 | 转速相位分析仪及其控制方法、转速相位分析系统、介质 |
| CN119460932A (zh) * | 2024-10-29 | 2025-02-18 | 广州广日电梯工业有限公司 | 一种电梯振动诊断方法及系统 |
Citations (5)
| Publication number | Priority date | Publication date | Assignee | Title |
|---|---|---|---|---|
| JPS542170A (en) * | 1977-06-08 | 1979-01-09 | Tokyo Electric Power Co Inc:The | Vibration supervisory apparatus |
| JP2005121639A (ja) * | 2003-09-22 | 2005-05-12 | Omron Corp | 検査方法および検査装置ならびに設備診断装置 |
| JP2005315595A (ja) * | 2004-04-27 | 2005-11-10 | Nissan Motor Co Ltd | 異音発生源特定装置及び異音発生源特定方法 |
| US20080069693A1 (en) * | 2006-08-24 | 2008-03-20 | Olga Malakhova | Method and apparatus of monitoring a machine |
| WO2016133100A1 (ja) * | 2015-02-19 | 2016-08-25 | 日本精工株式会社 | 異常診断システム |
-
2018
- 2018-09-28 WO PCT/JP2018/036218 patent/WO2019065952A1/ja not_active Ceased
Patent Citations (5)
| Publication number | Priority date | Publication date | Assignee | Title |
|---|---|---|---|---|
| JPS542170A (en) * | 1977-06-08 | 1979-01-09 | Tokyo Electric Power Co Inc:The | Vibration supervisory apparatus |
| JP2005121639A (ja) * | 2003-09-22 | 2005-05-12 | Omron Corp | 検査方法および検査装置ならびに設備診断装置 |
| JP2005315595A (ja) * | 2004-04-27 | 2005-11-10 | Nissan Motor Co Ltd | 異音発生源特定装置及び異音発生源特定方法 |
| US20080069693A1 (en) * | 2006-08-24 | 2008-03-20 | Olga Malakhova | Method and apparatus of monitoring a machine |
| WO2016133100A1 (ja) * | 2015-02-19 | 2016-08-25 | 日本精工株式会社 | 異常診断システム |
Cited By (3)
| Publication number | Priority date | Publication date | Assignee | Title |
|---|---|---|---|---|
| CN110541795A (zh) * | 2019-08-26 | 2019-12-06 | 重庆科凯前卫风电设备有限责任公司 | 一种海上风电机组机舱振动加速度数据有效性的判定方法 |
| CN112924710A (zh) * | 2019-12-06 | 2021-06-08 | 新疆金风科技股份有限公司 | 转速相位分析仪及其控制方法、转速相位分析系统、介质 |
| CN119460932A (zh) * | 2024-10-29 | 2025-02-18 | 广州广日电梯工业有限公司 | 一种电梯振动诊断方法及系统 |
Similar Documents
| Publication | Publication Date | Title |
|---|---|---|
| JP6553970B2 (ja) | 異常診断装置およびセンサ外れ検知方法 | |
| JP2018179735A (ja) | 回転部品の異常診断方法及び異常診断装置 | |
| JP6665062B2 (ja) | 状態監視装置 | |
| DK2937560T3 (en) | WIND ENERGY INSTALLATION DIAGNOSIS FOR GENERATOR COMPONENTS | |
| JP5293300B2 (ja) | 回転機の振動監視装置および振動監視方法 | |
| WO2011081085A1 (ja) | 転がり軸受の異常診断装置、風力発電装置および異常診断システム | |
| JP2019074060A (ja) | 風力発電用風車の状態監視装置、状態監視方法、及び状態監視システム | |
| JP5749964B2 (ja) | ターボ機械列における軸ズレを検出するための軸振動モニタリング | |
| WO2019065952A1 (ja) | 状態監視装置および状態監視システム | |
| CN110056485A (zh) | 用于监测风力涡轮变桨轴承的系统及方法 | |
| EP3842780B1 (en) | Method and device for diagnosing abnormality in rolling bearing | |
| JP2008292288A (ja) | 減速機の軸受診断装置 | |
| JP2014516154A (ja) | 電気機械システムの状態を監視する方法及び装置 | |
| CN104111154B (zh) | 风力发电机组的振动趋势分析方法和振动趋势分析系统 | |
| JP2017525891A (ja) | 駆動システムの早期エラー検出方法、早期エラー検出システム、早期エラー検出システムを備える風力発電機、および早期エラー検出システムの使用 | |
| JP2017181500A (ja) | 状態監視システムおよび風力発電装置 | |
| WO2017145687A1 (ja) | 異常診断装置および異常診断方法 | |
| JP2016223788A (ja) | 冷却ファン用音響診断装置 | |
| JP2018511734A (ja) | 風力発電装置の余寿命を決定するための方法 | |
| JP2007010415A (ja) | 軸受異常診断システム、軸受異常診断装置及び軸受異常診断方法 | |
| JP2019066456A (ja) | 状態監視装置および状態監視システム | |
| JP4935165B2 (ja) | 異常診断装置及び異常診断方法 | |
| JP4929810B2 (ja) | 異常診断装置及び異常診断方法 | |
| JP7830899B2 (ja) | 機械装置の状態監視方法、状態監視システム、状態監視装置、風力発電装置およびプログラム | |
| JP2017181267A (ja) | 転がり軸受診断装置 |
Legal Events
| Date | Code | Title | Description |
|---|---|---|---|
| 121 | Ep: the epo has been informed by wipo that ep was designated in this application |
Ref document number: 18862134 Country of ref document: EP Kind code of ref document: A1 |
|
| NENP | Non-entry into the national phase |
Ref country code: DE |
|
| 122 | Ep: pct application non-entry in european phase |
Ref document number: 18862134 Country of ref document: EP Kind code of ref document: A1 |