WO2019021649A1 - 測定装置、および測定方法 - Google Patents
測定装置、および測定方法 Download PDFInfo
- Publication number
- WO2019021649A1 WO2019021649A1 PCT/JP2018/022026 JP2018022026W WO2019021649A1 WO 2019021649 A1 WO2019021649 A1 WO 2019021649A1 JP 2018022026 W JP2018022026 W JP 2018022026W WO 2019021649 A1 WO2019021649 A1 WO 2019021649A1
- Authority
- WO
- WIPO (PCT)
- Prior art keywords
- time
- signal
- series data
- pulse wave
- data
- Prior art date
- Legal status (The legal status is an assumption and is not a legal conclusion. Google has not performed a legal analysis and makes no representation as to the accuracy of the status listed.)
- Ceased
Links
Images


Classifications
-
- A—HUMAN NECESSITIES
- A61—MEDICAL OR VETERINARY SCIENCE; HYGIENE
- A61B—DIAGNOSIS; SURGERY; IDENTIFICATION
- A61B5/00—Measuring for diagnostic purposes; Identification of persons
- A61B5/02—Detecting, measuring or recording for evaluating the cardiovascular system, e.g. pulse, heart rate, blood pressure or blood flow
- A61B5/021—Measuring pressure in heart or blood vessels
- A61B5/02108—Measuring pressure in heart or blood vessels from analysis of pulse wave characteristics
- A61B5/02125—Measuring pressure in heart or blood vessels from analysis of pulse wave characteristics of pulse wave propagation time
-
- A—HUMAN NECESSITIES
- A61—MEDICAL OR VETERINARY SCIENCE; HYGIENE
- A61B—DIAGNOSIS; SURGERY; IDENTIFICATION
- A61B5/00—Measuring for diagnostic purposes; Identification of persons
- A61B5/02—Detecting, measuring or recording for evaluating the cardiovascular system, e.g. pulse, heart rate, blood pressure or blood flow
- A61B5/021—Measuring pressure in heart or blood vessels
- A61B5/022—Measuring pressure in heart or blood vessels by applying pressure to close blood vessels, e.g. against the skin; Ophthalmodynamometers
- A61B5/02225—Measuring pressure in heart or blood vessels by applying pressure to close blood vessels, e.g. against the skin; Ophthalmodynamometers using the oscillometric method
-
- A—HUMAN NECESSITIES
- A61—MEDICAL OR VETERINARY SCIENCE; HYGIENE
- A61B—DIAGNOSIS; SURGERY; IDENTIFICATION
- A61B5/00—Measuring for diagnostic purposes; Identification of persons
- A61B5/24—Detecting, measuring or recording bioelectric or biomagnetic signals of the body or parts thereof
- A61B5/316—Modalities, i.e. specific diagnostic methods
- A61B5/318—Heart-related electrical modalities, e.g. electrocardiography [ECG]
- A61B5/332—Portable devices specially adapted therefor
-
- A—HUMAN NECESSITIES
- A61—MEDICAL OR VETERINARY SCIENCE; HYGIENE
- A61B—DIAGNOSIS; SURGERY; IDENTIFICATION
- A61B5/00—Measuring for diagnostic purposes; Identification of persons
- A61B5/68—Arrangements of detecting, measuring or recording means, e.g. sensors, in relation to patient
- A61B5/6801—Arrangements of detecting, measuring or recording means, e.g. sensors, in relation to patient specially adapted to be attached to or worn on the body surface
- A61B5/6802—Sensor mounted on worn items
- A61B5/681—Wristwatch-type devices
-
- A—HUMAN NECESSITIES
- A61—MEDICAL OR VETERINARY SCIENCE; HYGIENE
- A61B—DIAGNOSIS; SURGERY; IDENTIFICATION
- A61B5/00—Measuring for diagnostic purposes; Identification of persons
- A61B5/02—Detecting, measuring or recording for evaluating the cardiovascular system, e.g. pulse, heart rate, blood pressure or blood flow
- A61B5/026—Measuring blood flow
- A61B5/0295—Measuring blood flow using plethysmography, i.e. measuring the variations in the volume of a body part as modified by the circulation of blood therethrough, e.g. impedance plethysmography
Definitions
- the present disclosure relates to a measurement device and a measurement method, and more particularly to a measurement device for measuring a pulse wave propagation time and a measurement method.
- WO 2014/132713 discloses a pulse wave transit time measuring device.
- the pulse wave transit time measuring device detects the peak of each of the electrocardiogram signal subjected to the signal processing including the filtering process and the photoplethysmogram signal subjected to the signal process including the filtering process, and the delay time of the electrocardiogram signal and Based on the delay time of the photoplethysmogram signal, the peak of the electrocardiogram signal and the peak of the photoplethysmogram signal are corrected, and the pulse wave propagation time is derived from the time difference between the peak of the corrected photoplethysmogram signal and the peak of the electrocardiogram signal.
- the pulse wave transit time measuring device analyzes the frequency components of the electrocardiogram signal and the photoplethysmogram signal, and determines the relationship between the frequency component and the delay time (the amount of deviation of the peak).
- the delay time of the electrocardiogram signal and the delay time of the photoplethysmogram signal are determined using a defined table, and the time difference between the peak of the photoplethysmogram signal corrected based on this delay time and the peak of the electrocardiogram signal Calculate pulse wave transit time.
- An object in one aspect of the present disclosure is to provide a measurement device and a measurement method that can measure pulse wave propagation time easily and accurately.
- the measurement apparatus includes a first sensor that detects a first signal that indicates a pulse wave of the subject, a second sensor that detects a second signal that indicates a pulse wave or an electrocardiogram of the subject, and the first sensor.
- a first signal processing unit configured to filter each of the detected first signal and the second signal detected by the second sensor with an analog filter having a predetermined transfer function to convert into digital data; For each of the first time series data of the first signal converted to digital data by the first signal processing unit and the second time series data of the second signal converted to digital data by the first signal processing unit, And a second signal processing unit that performs signal processing.
- the second signal processing unit generates third time-series data in which the first time-series data is arranged in time series in the reverse direction, and fourth time-series data is arranged in time series in the reverse direction.
- Time series data is generated, each of the third time series data and the fourth time series data is subjected to filter processing by a digital filter having a predetermined transfer function, and is subjected to filter processing by a digital filter Series time data is rearranged in time series order to generate fifth time series data, and fourth time series data in which filter processing is performed by a digital filter is rearranged in time series order to generate sixth time series data.
- the measurement apparatus further includes a time calculation unit that calculates a pulse wave propagation time based on the signal indicated by the fifth time series data and the signal indicated by the sixth time series data.
- the second signal is a signal indicating a pulse wave.
- the first sensor and the second sensor detect pulse waves of opposing portions of the arteries passing through the measurement site of the subject.
- the time calculation unit calculates, as the pulse wave propagation time, a time difference between the rise time of the signal indicated by the fifth time series data and the rise time of the signal indicated by the sixth time series data.
- the time difference between the peak time point of the signal indicated by the time series data and the peak time point of the signal indicated by the sixth time series data is calculated as the pulse wave propagation time.
- the second signal is a signal indicating an electrocardiogram.
- the time calculation unit calculates the pulse wave propagation time by comparing the rising time of the signal indicated by the fifth time series data with the peak time of the signal indicated by the sixth time series data.
- the measurement apparatus further includes a data storage unit for storing the first time series data and the second time series data.
- the second signal processing unit executes signal processing when the first time-series data and the second time-series data for a predetermined time are accumulated in the data storage unit.
- the measurement apparatus further includes a blood pressure calculation unit that calculates a blood pressure based on the pulse wave propagation time calculated by the time calculation unit.
- the measurement device further includes a display, and a display control unit that causes the display to display the blood pressure value calculated by the blood pressure calculation unit.
- a measurement method comprises the steps of: detecting a first signal indicative of a pulse wave of a subject; detecting a second signal indicative of a pulse wave or an electrocardiogram of the subject; and first and second signals. For each of the first and second time-series data of the first signal converted into digital data, and performing a filter process with an analog filter having a predetermined transfer function to convert the data into digital data; Generating third time-series data arranged in the direction; and generating fourth time-series data in which the second time-series data of the second signal converted into digital data are arranged in time series in the reverse direction Applying a digital filter having a predetermined transfer function to each of the third time-series data and the fourth time-series data; Generating fifth time-series data in which the third time-series data filtered by the filter is rearranged in time-series order, and fourth time-series data filtered by the digital filter are time-series Calculating the pulse wave propagation time based on the step of generating the sixth
- the sphygmomanometer will be described as a representative example of a "measuring device" for measuring the pulse wave propagation time.
- the measuring device may be a device including a sensor that detects a pulse wave signal (or an electrocardiogram signal) and a processing device that processes a signal detected by the sensor, and is not limited to the sphygmomanometer.
- FIG. 1 is an external perspective view of the sphygmomanometer 1.
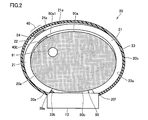
- FIG. 2 is a view schematically showing a cross section perpendicular to the longitudinal direction of the left wrist 90 in a state where the sphygmomanometer 1 is mounted on the left wrist 90 (hereinafter, also referred to as “mounted state”).
- the left wrist 90 is the measurement site.
- part” measured by the sphygmomanometer 1 should just be a site
- the measurement site may be, for example, an upper limb such as a wrist or an upper arm, or a lower limb such as an ankle or a thigh.
- the belt 20 is an elongated belt-like member that is mounted around the left wrist 90 along the circumferential direction.
- the dimension (width dimension) in the width direction Y of the belt 20 is, for example, about 30 mm.
- the belt 20 includes a strip 23 having an outer circumferential surface 20 b and a compression cuff 21.
- the compression cuff 21 is attached along the inner circumferential surface 23 a of the strip 23 and has an inner circumferential surface 20 a in contact with the left wrist 90.
- the compression cuff 21 is configured as a fluid bag by facing two stretchable polyurethane sheets in the thickness direction and welding their peripheral portions.
- the fluid bag may be a bag-like member capable of containing a fluid.
- Fluid includes both liquid and gas, and for example, water, air, etc. can be used.
- the main body 10 is provided integrally with one end 20 e of the belt 20.
- the belt 20 and the main body 10 may be separately formed, and the main body 10 may be integrally attached to the belt 20 via an engaging member (for example, a hinge).
- the portion where the main body 10 is disposed corresponds to the back side surface (surface on the back side of the hand) 90b of the left wrist 90 in the mounted state (see FIG. 2).
- FIG. 2 a radial artery 91 passing near the palmar side (palm side) 90 a in the left wrist 90 is shown.
- the main body 10 has a three-dimensional shape having a thickness in a direction perpendicular to the outer circumferential surface 20 b of the belt 20.
- the main body 10 is small and thin so as not to interfere with the daily activities of the subject (user).
- the main body 10 has a quadrangular frustum-shaped contour protruding outward from the belt 20.
- a display 50 is provided on the top surface (the surface farthest from the measurement site) 10 a of the main body 10.
- An operation unit 52 for inputting an instruction from the user is provided along the side surface 10f of the main body 10 (the left side front side surface in FIG. 1) 10f.
- An impedance measurement portion 40 is formed on the inner circumferential surface 20 a of the belt 20 (that is, on the inner circumferential surface 20 a of the compression cuff 21) at a portion between the one end 20 e and the other end 20 f of the belt 20. Is provided.
- An electrode group 40E is disposed on the inner circumferential surface 20a of the portion where the impedance measurement unit 40 is disposed.
- the electrode group 40E has six plate-like (or sheet-like) electrodes 41 to 46 which are disposed in a state of being separated from each other in the width direction Y of the belt 20.
- the part where the electrode group 40E is disposed corresponds to the radial artery 91 of the left wrist 90 in the mounted state.
- the solid 22 is disposed at a position corresponding to the electrode group 40E on the outer circumferential surface 21a opposite to the inner circumferential surface 20a.
- a pressure cuff 24 is disposed on the outer peripheral side of the solid 22.
- the pressing cuff 24 is an expanding member that locally suppresses a region corresponding to the electrode group 40E in the circumferential direction of the compression cuff 21.
- the pressing cuff 24 is disposed on the inner circumferential surface 23 a (a surface closer to the left wrist 90) of the belt-like body 23 constituting the belt 20 (see FIG. 2).
- the band 23 is made of a plastic material that is flexible in the thickness direction and inelastic in the circumferential direction (longitudinal direction).
- the pressure cuff 24 is a fluid bag that expands and contracts in the thickness direction of the belt 20. Specifically, the pressing cuff 24 is mounted around the left wrist 90, is pressurized by the supply of fluid, and is not pressurized by discharging the fluid.
- the pressing cuff 24 is configured as, for example, a fluid bag by facing two stretchable polyurethane sheets in the thickness direction and welding their peripheral portions.
- the solid 22 is disposed at a position corresponding to the electrode group 40E in the inner peripheral surface 24a of the pressing cuff 24 (the surface closer to the left wrist 90).
- the solid 22 is made of, for example, a plate-like resin (for example, polypropylene) having a thickness of about 1 to 2 mm.
- the belt 20, the pressing cuff 24, and the solid 22 are used as the pressing portion.
- the bottom surface 10b (the surface closest to the measurement site) 10b of the main body 10 and the end 20f of the belt 20 are also referred to as a three-fold buckle 15 (hereinafter simply referred to as "buckle 15"). Connected by).
- the buckle 15 includes a plate-like member 25 disposed on the outer circumferential side and a plate-like member 26 disposed on the inner circumferential side.
- One end 25 e of the plate member 25 is rotatably attached to the main body 10 via a connecting rod 27 extending along the width direction Y.
- the other end 25 f of the plate 25 is rotatably attached to one end 26 e of the plate 26 via a connecting rod 28 extending in the width direction Y.
- the other end 26 f of the plate member 26 is fixed by the fixing portion 29 in the vicinity of the end 20 f of the belt 20.
- the attachment position of the fixing portion 29 is variably set in advance in accordance with the circumferential length of the left wrist 90 of the user.
- the sphygmomanometer 1 (belt 20) is generally formed in a substantially annular shape, and the bottom surface 10b of the main body 10 and the end 20f of the belt 20 can be opened and closed in the arrow B direction in FIG. Configured
- the user When the user wears the sphygmomanometer 1 on the left wrist 90, the user passes the left hand through the belt 20 from the direction indicated by the arrow A in FIG. 1 with the buckle 15 opened and the diameter of the ring of the belt 20 increased.
- the user adjusts the angular position of the belt 20 around the left wrist 90 to position the impedance measurement unit 40 of the belt 20 on the radial artery 91 passing through the left wrist 90.
- the electrode group 40E of the impedance measurement unit 40 comes in contact with the portion 90a1 of the palm lateral surface 90a of the left wrist 90 that corresponds to the radial artery 91.
- the user closes and fixes the buckle 15.
- the user wears the sphygmomanometer 1 (belt 20) on the left wrist 90.
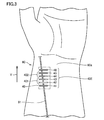
- FIG. 3 is a diagram showing a planar layout of the electrode group for impedance measurement in a state where the sphygmomanometer 1 is attached to the left wrist 90.
- electrode group 40E of impedance measuring unit 40 in the wearing state, is aligned along the longitudinal direction of the wrist corresponding to radial artery 91 of left wrist 90.
- the electrode group 40E includes current electrode pairs 41 and 46 for current conduction disposed on both sides in the width direction Y, and a detection electrode pair 42 and 43 and a detection electrode pair 44 disposed between the current electrode pairs 41 and 46. , 45 and so on.
- Pulse wave sensor 401 includes detection electrode pairs 42 and 43
- pulse wave sensor 402 includes detection electrode pairs 44 and 45.
- Detection electrode pairs 44 and 45 are arranged corresponding to the downstream side of the blood flow of the radial artery 91 with respect to the detection electrode pairs 42 and 43.
- a distance D (see FIG. 5A described later) between the center of the detection electrode pair 42, 43 and the center of the detection electrode pair 44, 45 is set to, for example, 20 mm.
- the distance D corresponds to the distance between the pulse wave sensor 401 and the pulse wave sensor 402.
- the distance between the detection electrode pair 42, 43 and the distance between the detection electrode pair 44, 45 are both set to, for example, 20 mm.
- the sphygmomanometer 1 can configure the belt 20 to be thin as a whole.
- the electrode group 40E can be configured flexibly, the electrode group 40E does not prevent the compression of the left wrist 90 by the compression cuff 21 and does not impair the accuracy of blood pressure measurement by the oscillometric method described later.
- FIG. 4 is a block diagram showing a hardware configuration of a control system of the sphygmomanometer 1.
- the main unit 10 includes a central processing unit (CPU) 100 functioning as a control unit, a display 50, a memory 51 functioning as a storage unit, an operation unit 52, a battery 53, and a communication unit And 59.
- the main body 10 includes a pressure sensor 31, a pump 32, a valve 33, a pressure sensor 34, and a switching valve 35.
- the switching valve 35 switches the connection destination of the pump 32 and the valve 33 to the compression cuff 21 or the pressing cuff 24.
- main body 10 includes an oscillation circuit 310 and an oscillation circuit 340 that convert outputs from pressure sensor 31 and pressure sensor 34 into frequencies, and a pump drive circuit 320 that drives pump 32.
- the impedance measurement unit 40 includes an electrode group 40E and a voltage detection circuit 49.
- the display 50 is, for example, an organic EL (Electro Luminescence) display, and displays information related to blood pressure measurement such as a blood pressure measurement result and other information according to a control signal from the CPU 100.
- the display 50 is not limited to the organic EL display, and may be configured of another type of display such as, for example, an LCD (Liquid Cristal Display).
- the operation unit 52 is, for example, a push-type switch, and inputs an operation signal to the CPU 100 in accordance with an instruction to start or stop blood pressure measurement by the user.
- the operation unit 52 is not limited to the push-type switch, and may be, for example, a pressure-sensitive (resistive) or proximity-type (electrostatic capacitive) touch panel switch.
- the main body 10 may include a microphone (not shown), and may receive an instruction to start blood pressure measurement by the user's voice.
- the memory 51 is data of a program for controlling the sphygmomanometer 1, data used to control the sphygmomanometer 1, setting data for setting various functions of the sphygmomanometer 1, data of measurement results of blood pressure values, etc. Is stored temporarily.
- the memory 51 is also used as a work memory or the like when a program is executed.
- the CPU 100 executes various functions as a control unit in accordance with a program for controlling the sphygmomanometer 1 stored in the memory 51. For example, when blood pressure measurement by the oscillometric method is performed, the CPU 100 drives the pump 32 (and the valve 33) based on a signal from the pressure sensor 31 in response to an instruction to start blood pressure measurement from the operation unit 52. Take control. The CPU 100 also performs control to calculate the blood pressure value based on the signal from the pressure sensor 31.
- the CPU 100 When performing the blood pressure measurement based on the pulse wave propagation time, the CPU 100 performs control to drive the valve 33 in order to discharge the air in the compression cuff 21 according to the instruction to start the blood pressure measurement from the operation unit 52. Further, the CPU 100 controls the switching valve 35 to switch the connection destination of the pump 32 (and the valve 33) to the pressure cuff 24. Further, the CPU 100 performs control to calculate the blood pressure value based on the signal from the pressure sensor 34.
- the communication unit 59 is controlled by the CPU 100 to transmit predetermined information to an external device via the network 900, receives information from an external device via the network 900, and delivers the information to the CPU 100.
- Communication via the network 900 may be wireless or wired.
- the network 900 is the Internet, but is not limited to this, and may be another type of network such as a LAN (Local Area Network), or one-to-one communication using a USB cable or the like. It may be.
- the communication unit 59 may include a micro USB connector.
- the pump 32 and the valve 33 are connected to the compression cuff 21 and the pressure cuff 24 via the switching valve 35 and the air pipes 39a and 39b.
- the pressure sensor 31 is connected to the compression cuff 21 and the pressure cuff 24 via the air pipe 38a and the pressure sensor 34 via the air pipe 38b.
- the pressure sensor 31 detects the pressure in the compression cuff 21 via the air pipe 38a.
- the switching valve 35 is driven based on a control signal supplied from the CPU 100 and switches the connection destination of the pump 32 and the valve 33 to the compression cuff 21 or the pressing cuff 24.
- the pump 32 is configured of, for example, a piezoelectric pump.
- the pump 32 passes the air pipe 39a to pressurize the pressure (cuff pressure) in the compression cuff 21.
- the compression cuff 21 is supplied with air as a fluid for pressurization.
- the pump 32 passes the air pipe 39 b to pressurize the pressure (cuff pressure) in the pressure cuff 24.
- the pressure cuff 24 is supplied with air as a fluid for pressurization.
- the valve 33 is mounted on the pump 32 and is configured to be controlled to open / close as the pump 32 is turned on / off. Specifically, when the connection destination of the pump 32 and the valve 33 is switched to the compression cuff 21 by the switching valve 35, the valve 33 is closed when the pump 32 is turned on, and the pressure cuff 21 is While the air is enclosed, it is opened when the pump 32 is turned off, and the air of the compression cuff 21 is exhausted to the atmosphere through the air pipe 39a.
- Pump drive circuit 320 drives pump 32 based on a control signal supplied from CPU 100.
- the pressure sensor 31 is, for example, a piezoresistive pressure sensor, and is connected to the pump 32, the valve 33, and the compression cuff 21 via an air pipe 38a.
- the pressure sensor 31 detects the pressure of the belt 20 (the compression cuff 21), for example, the pressure based on the atmospheric pressure (zero) via the air pipe 38a, and outputs it as a time-series signal.
- the oscillation circuit 310 outputs, to the CPU 100, a frequency signal having a frequency corresponding to an electrical signal value based on a change in electrical resistance due to the piezoresistive effect from the pressure sensor 31.
- the output of the pressure sensor 31 includes blood pressure values (systolic blood pressure; SBP) and diastolic blood pressure (DBP) by oscillometric method to control the pressure of the compression cuff 21. Is used to calculate.
- the pressure sensor 34 is, for example, a piezoresistive pressure sensor, and is connected to the pump 32, the valve 33, and the pressing cuff 24 via an air pipe 38b.
- the pressure sensor 34 detects the repulsive force of the pressure cuff 24, for example, the pressure with the atmospheric pressure as a reference (zero) through the air pipe 38b, and outputs it as a time-series signal.
- the oscillation circuit 340 oscillates according to the electrical signal value based on the change in electrical resistance due to the piezoresistive effect from the pressure sensor 34, and outputs a frequency signal having a frequency according to the electrical signal value of the pressure sensor 34 to the CPU 100.
- the output of the pressure sensor 34 is used to control the pressure of the pressure cuff 24 and to calculate the blood pressure based on the pulse wave propagation time.
- the CPU 100 controls the pump 32 and the valve 33 to increase and decrease the cuff pressure according to various conditions. Do.
- the battery 53 supplies power to various elements mounted on the main body 10.
- the battery 53 supplies power to the voltage detection circuit 49 of the impedance measurement unit 40 through the wiring 71.
- the wire 71 is placed between the main body 10 and the impedance measuring unit 40 along the circumferential direction of the belt 20 in a state of being sandwiched between the strip 23 of the belt 20 and the compression cuff 21 together with the wire 72 for signal. It is provided extending.
- the voltage detection circuit 49 of the impedance measurement unit 40 operates in accordance with an instruction of the CPU 100.
- the voltage detection circuit 49 includes an analog filter 403, an amplifier 404, and an A / D (Analog / Digital) converter 405.
- the voltage detection circuit 49 may further include a booster circuit that boosts the power supply voltage and a voltage adjustment circuit that regulates the boosted voltage to a predetermined voltage.
- FIG. 5 is a schematic view for explaining blood pressure measurement based on pulse wave propagation time.
- FIG. 5A is a schematic cross-sectional view along the longitudinal direction of the wrist when blood pressure measurement based on pulse wave propagation time is performed in a state where the sphygmomanometer 1 is attached to the left wrist 90.
- FIG. 5B is a diagram showing the waveforms of pulse wave signals PS1 and PS2.
- voltage detection circuit 49 applies a predetermined voltage between current electrode pairs 41 and 46 using a booster circuit, a voltage adjustment circuit, etc.
- a high frequency constant current i of 1 mA is applied.
- the voltage detection circuit 49 detects a voltage signal v1 between the detection electrode pair 42, 43 constituting the pulse wave sensor 401 and a voltage signal v2 between the detection electrode pair 44, 45 constituting the pulse wave sensor 402. Specifically, the voltage detection circuit 49 receives an input of the voltage signal v1 detected by the pulse wave sensor 401, and receives an input of the voltage signal v2 detected by the pulse wave sensor 402.
- Each of the voltage signals v1 and v2 is a signal indicating a pulse wave of the subject.
- the voltage signals v1 and v2 change the electrical impedance of the blood flow of the radial artery 91 due to the pulse wave of the portion of the palm side 90a of the left wrist 90 to which the pulse wave sensors 401 and 402 are opposed, respectively. Represent.
- the analog filter 403 of the voltage detection circuit 49 has a transfer function G and performs filtering on the amplified voltage signals v1 and v2. Specifically, the analog filter 403 removes noise other than the frequency that characterizes the voltage signals v1 and v2 (pulse wave signal), and performs filter processing to improve the S / N.
- the amplifier 404 is composed of, for example, an operational amplifier and amplifies the filtered voltage signals v1 and v2.
- the A / D converter 405 converts the amplified voltage signals v1 and v2 from analog data into digital data, and outputs the converted data to the CPU 100 through the wiring 72.
- the CPU 100 performs predetermined signal processing on the input voltage signals v1 and v2 (digital data) to generate pulse wave signals PS1 and PS2 having a mountain-like waveform as shown in FIG. 5 (B). Generate Details of the predetermined signal processing will be described later.
- the voltage signals v1 and v2 are, for example, about 1 mv. Moreover, each peak A1, A2 of pulse wave signal PS1, PS2 is about 1V, for example. Assuming that the pulse wave velocity (Pulse Wave Velocity; PWV) of the blood flow of the radial artery 91 is in the range of 1000 cm / s to 2000 cm / s, the distance D between the pulse wave sensor 401 and the pulse wave sensor 402 is 20 mm. Therefore, the time difference ⁇ t between the pulse wave signal PS1 and the pulse wave signal PS2 is in the range of 1.0 ms to 2.0 ms.
- PWV Pulse Wave Velocity
- the pressure cuff 24 is in a pressurized state, and the pressure cuff 21 is in a non-pressurized state by discharging the internal air.
- the pressure cuff 24 and the solid 22 are disposed across the pulse wave sensor 401, the pulse wave sensor 402, and the current electrode pair 41, 46 with respect to the arterial direction of the radial artery 91. Therefore, when the pressure cuff 24 is pressurized by the pump 32, it presses the pulse wave sensor 401, the pulse wave sensor 402, and the current electrode pair 41, 46 against the palm side 90a of the left wrist 90 via the solid 22. .
- the pressing force of each of the current electrode pairs 41 and 46, the pulse wave sensor 401, and the pulse wave sensor 402 on the palm side 90a of the left wrist 90 can be set to an appropriate value.
- the pressure cuff 24 of the fluid bag is used as the pressing portion, the pump 32 and the valve 33 can be used in common with the compression cuff 21, and the configuration can be simplified.
- the pulse wave sensor 401, the pulse wave sensor 402, and the current electrode pairs 41 and 46 can be pressed through the solid 22, the pressing force on the measurement site becomes uniform, and the blood pressure based on the pulse wave propagation time accurately. Measurement can be performed.
- FIG. 6 is a schematic cross-sectional view along the longitudinal direction of the wrist in a state where the sphygmomanometer 1 is attached to the left wrist 90 when blood pressure measurement is performed by the oscillometric method.
- the pressure cuff 24 is in a non-pressurized state by discharging the air therein, and the compression cuff 21 is in a pressurized state in which the air is supplied.
- the compression cuff 21 extends in the circumferential direction of the left wrist 90, and when pressed by the pump 32, uniformly compresses the circumferential direction of the left wrist 90. Since only the electrode group 40E exists between the inner circumferential surface of the compression cuff 21 and the left wrist 90, the compression by the compression cuff 21 is not blocked by other members, and the blood vessel is sufficiently closed. Can. Therefore, blood pressure measurement by the oscillometric method can be performed with high accuracy.
- the operation of the sphygmomanometer 1 when performing blood pressure measurement by the oscillometric method is generally as follows. Specifically, when the CPU 100 of the sphygmomanometer 1 receives a blood pressure measurement instruction via the operation unit 52, the CPU 32 turns off the pump 32 via the pump drive circuit 320, opens the valve 33, and Exhaust the air. The current output value of the pressure sensor 31 is set as a value corresponding to the atmospheric pressure.
- the CPU 100 closes the valve 33 and drives the pump 32 via the pump drive circuit 320 to send air to the compression cuff 21.
- the compression cuff 21 is inflated and the cuff pressure is gradually increased.
- the CPU 100 monitors the cuff pressure with the pressure sensor 31 and acquires the fluctuation component of the arterial volume generated in the radial artery 91 of the left wrist 90 as a pulse wave signal. .
- the CPU 100 Based on the acquired pulse wave signal, the CPU 100 tries to calculate a blood pressure value (systolic blood pressure and diastolic blood pressure) by applying a known algorithm by oscillometric method. If the CPU 100 can not calculate the blood pressure value because of insufficient data, the CPU 100 increases the cuff pressure and tries to calculate the blood pressure value again, as long as the cuff pressure has not reached the upper limit pressure (for example, 300 mmHg).
- the upper limit pressure for example, 300 mmHg
- the CPU 100 stops the pump 32 via the pump drive circuit 320, opens the valve 33, and discharges the air in the compression cuff 21.
- the CPU 100 displays the measurement result of the blood pressure value on the display 50 and records it on the memory 51.
- the calculation of the blood pressure value is not limited to the pressurization process, and may be performed in the depressurization process.
- FIG. 7 is a diagram for explaining the necessity of the analog filter. As shown in FIG. 7A, unnecessary frequency components (noise wave component Wn) other than the desired frequency component (desired wave component Wd) are superimposed on the voltage signal (analog data) detected by the detection electrode pair. Assume that
- the desired wave component Wd is amplified (see FIG. 7C) to increase the dynamic range of the desired wave component Wd. .
- the pulse wave signal can be acquired with high accuracy.
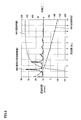
- FIG. 8 is a diagram for explaining the phase characteristic of the filter.
- the vertical axis on the right side indicates the amount of phase change
- the vertical axis on the left side indicates the delay time
- the horizontal axis indicates the frequency.
- the example of FIG. 8 shows an example using a low pass filter with a cutoff frequency of 10 Hz and a high pass filter with a cutoff frequency of 0.5 Hz as the analog filter.
- a graph 801 shows the frequency characteristic (phase characteristic) of the filter.
- a graph 803 shows delay time characteristics obtained by converting the phase characteristics shown by the graph 801 into time.
- a graph 805 shows the frequency characteristics of a voltage signal (eg, voltage signal v1) which is a pulse wave signal.
- a voltage signal eg, voltage signal v1
- v1 voltage signal
- FIG. 8 for example, at about 1.2 Hz, a peak of the voltage signal is present, and the amount of phase change at that time is about 10 °.
- the voltage signals v1 and v2 are both pulse wave signals, the frequency components of the waveforms of the voltage signals v1 and v2 do not completely match because the measurement positions and the like are different. Therefore, when the above-described filtering process is applied to the voltage signals v1 and v2, phase changes of different amounts occur in the voltage signal v1 and the voltage signal v2. Therefore, to accurately measure the pulse wave propagation time, it is necessary to reduce the difference in phase change between the voltage signal v1 and the voltage signal v2.
- the configuration and processing for reducing the difference in phase change will be specifically described below.
- FIG. 9 is a block diagram showing a functional configuration of the sphygmomanometer 1. Specifically, FIG. 9 shows the functional configuration of the sphygmomanometer 1 used to measure the pulse wave propagation time.
- the sphygmomanometer 1 has, as main functional components, a signal input unit 102, a data generation unit 106, a digital filter unit 108, a time calculation unit 110, a blood pressure calculation unit 112, and an output control unit And 114. These functions are realized, for example, by the CPU 100 of the sphygmomanometer 1 executing a program stored in the memory 51. Note that some or all of these functions may be configured to be realized by hardware.
- the sphygmomanometer 1 further includes a data storage unit 104 realized by the memory 51.
- the signal input unit 102 receives input of voltage signals v1 and v2 (digital data) output from the A / D converter 405 at predetermined sampling intervals.
- the signal input unit 102 sequentially stores the received voltage signals v1 and v2 in the data storage unit 104.
- the data storage unit 104 stores time series data of the voltage signal v1 and time series data of the voltage signal v2. Specifically, the data storage unit 104 stores time-series data of each of the voltage signals v1 and v2 from the present time to a predetermined cycle before. For example, the signal value (digital value of the voltage signal) of the voltage signal v1 at this point is v1 (m), the signal value one sampling period earlier is v1 (m-1), and the signal value two sampling periods earlier is v1 (m m-2) Likewise, let us say that the signal value n sampling cycles before is v 1 (m ⁇ n).
- Time series data including n + 1 signal values of v 1 (m ⁇ n) are stored in the data storage unit 104. That is, time series data K1 (signal values v1 (mn) to v1 (m)) of the voltage signal v1 are stored. Similarly, time-series data K 2 (signal values v 2 (m ⁇ n) to v 2 (m) of the voltage signal v 2 are stored in the data storage unit 104.
- the data generation unit 106 generates time-series data Kr1 (signal values v1 (m) to v1 (m-n)) in which time-series data K1 of the voltage signal v1 are arranged in time series in the reverse direction. Similarly, the data generation unit 106 generates time-series data Kr2 (signal values v2 (m) to v2 (mn)) in which the time-series data K2 of the voltage signal v2 are arranged in time series in the reverse direction.
- time series data K1 and the time series data K2 of a predetermined time for example, 5 seconds
- the data generation unit 106 performs the generation.
- Digital filter unit 108 performs a filtering process on each of time series data Kr1 and Kr2 with a digital filter having the same transfer function G as that of analog filter 403, and time series data Kd1 (signal value vd1 (m) ⁇ vd1 (mn) and time series data Kd2 (signal values vd2 (m) to vd2 (mn)) are generated.
- the time series data Kd1 and the time series data Kd2 are expressed using the following equations (1) and (2), respectively.
- Kd1 Kr1 ⁇ G (1)
- Kd2 Kr2 ⁇ G (2)
- the data generation unit 106 generates time series data Kf1 (signal values vd1 (mn) to vd1 (m)) in which the time series data Kd1 is rearranged in the forward direction in time series.
- the data generation unit 106 generates time-series data Kf2 (signal values vd2 (mn) to vd2 (m)) in which the time-series data Kd2 is rearranged in the forward direction in time series.
- time series data Kr1 and Kr2 in which time series data K1 and K2 are arranged in time series in reverse direction are generated, and 2) for each of time series data Kr1 and Kr2 Time-series data Kd1 and Kd2 are generated by digital filter processing using the transfer function G (the same transfer function as the analog filter 403), and 3) time-series data in which the time-series data Kd1 and Kd2 are rearranged again in time series Data Kf1 and Kf2 are generated.
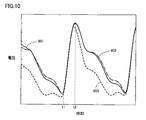
- FIG. 10 is a diagram for explaining the advantage of digital signal processing according to the present embodiment.
- the vertical axis of FIG. 10 indicates the voltage, and the horizontal axis indicates the time.
- a waveform 901 shows the waveform of a pulse wave signal (for example, voltage signal v1) before the filtering process by the analog filter.
- a waveform 902 shows a waveform of a pulse wave signal subjected to the digital signal processing of the above 1) to 3) after the filtering process by the analog filter.
- a waveform 903 shows a waveform of a pulse wave signal which has only been subjected to filter processing by an analog filter and has not been subjected to the digital signal processing of the above 1) to 3).
- the waveform 903 has a large amount of change from the waveform 901 due to the phase change due to the analog filter.
- the waveform 902 is very similar to the waveform 901, and it can be seen that the amount of phase change due to analog filter processing is reduced.
- rising points of the waveform 901 and the waveform 902 are both at time t1
- peak points of the waveform 901 and the waveform 902 are both at time t2.
- the rising time points and peak time points of the waveform 901 and the waveform 903 are different in timing.
- the rising point is, for example, a timing at which the instantaneous value (voltage value) of the signal increases with the passage of time.
- time calculation unit 110 generates pulse wave signal PS1 and a pulse wave based on pulse wave signal PS1 indicated by time series data Kf1 and pulse wave signal PS2 indicated by time series data Kf2.
- the time difference ⁇ t between the wave signal PS2 is calculated as the pulse wave propagation time.
- the time calculation unit 110 calculates a time difference ⁇ t between the time of peak A1 of pulse wave signal PS1 and the time of peak A2 of pulse wave signal PS2 as a pulse wave propagation time. Further, the time calculation unit 110 may calculate the time difference ⁇ t1 between the rising time of the pulse wave signal PS1 and the rising time of the pulse wave PS2 as the pulse wave propagation time. Alternatively, the time calculation unit 110 may calculate an average value of the time difference ⁇ t and the time difference ⁇ t1 as the pulse wave propagation time. This can further improve the accuracy of the pulse wave propagation time.
- the blood pressure calculation unit 112 calculates a blood pressure value based on the pulse wave propagation time calculated by the time calculation unit 110. Specifically, the blood pressure calculation unit 112 calculates (estimates) the blood pressure value based on the pulse wave propagation time using a predetermined correspondence equation between the pulse wave propagation time and the blood pressure value.
- the predetermined correspondence equation between the pulse wave propagation time and the blood pressure is expressed as, for example, the following equation (3) as a known fractional function (see, for example, JP-A-10-201724).
- DT is a pulse wave propagation time
- EBP is a blood pressure value
- ⁇ and ⁇ are known coefficients or constants.
- the output control unit 114 causes the display 50 to display the blood pressure value calculated by the blood pressure calculation unit 112. Further, the output control unit 114 may be configured to output the blood pressure value by voice via a speaker (not shown) mounted on the sphygmomanometer 1.
- FIG. 11 is a flow chart showing a measurement process procedure of a blood pressure value based on pulse wave propagation time.
- CPU 100 of sphygmomanometer 1 receives an instruction of blood pressure measurement based on pulse wave propagation time via operation unit 52 (step S10).
- the CPU 100 drives the switching valve 35 to switch the connection destination of the pump 32 and the valve 33 to the pressure cuff 24 (step S12).
- the CPU 100 expands the pressure cuff 24 and increases the cuff pressure Pc (step S14). Specifically, the CPU 100 closes the valve 33 and drives the pump 32 via the pump drive circuit 320 to send air to the pressure cuff 24 to increase the cuff pressure Pc. Subsequently, the CPU 100 stops the pump 32 when the cuff pressure Pc reaches a predetermined pressure (step S16). Thus, the cuff pressure Pc is set to a predetermined pressure. In this state, the CPU 100 starts acquiring the pulse wave propagation time as in the following steps.
- CPU 100 receives input of voltage signals v1 and v2 and stores time series data of each of voltage signals v1 and v2 in memory 51 (step S18). The CPU 100 determines whether time series data for a predetermined time has been accumulated (step S20). When the time series data for the predetermined time is not accumulated (NO in step S20), CPU 100 executes the process of step S18.
- CPU 100 executes digital signal processing (step S22). Specifically, CPU 100 generates time series data Kr1 in which time series data K1 of voltage signal v1 is arranged in the reverse direction, and time series data Kr2 in which time series data K2 of voltage signal v2 is arranged in the reverse direction. .
- the CPU 100 generates time series data Kd1 and Kd2 in which digital filter processing according to the transfer function G is performed on each of the time series data Kr1 and Kr2.
- the CPU 100 generates time series data Kf1 and Kf2 in which the time series data Kd1 and Kd2 are rearranged in time series order.
- the CPU 100 generates a pulse wave signal PS1 corresponding to the time series data Kf1 and a pulse wave signal PS2 corresponding to the time series data Kf2.
- the CPU 100 calculates a time difference ⁇ t between the pulse wave signal PS1 and the pulse wave signal PS2 as a pulse wave propagation time (step S24).
- the CPU 100 calculates a blood pressure value based on the pulse wave propagation time by using a corresponding equation (for example, equation (3)) between the pulse wave propagation time and the blood pressure value (step S26).
- the CPU 100 displays the calculated blood pressure value on the display 50 (step S28), and ends the process.
- ⁇ Advantage> it is possible to reduce the phase shift associated with the filtering process in each pulse wave signal. Therefore, the pulse wave propagation time calculated by comparing each pulse wave signal can be measured accurately. As a result, the accuracy of blood pressure measurement based on pulse wave propagation time is also improved.
- the entire waveform of each pulse wave signal can be obtained with high accuracy. Therefore, the pulse wave propagation time can be calculated by comparing the entire waveform of one pulse wave signal with the entire waveform of the other pulse wave signal (for example, comparing the rise time, peak time, etc.).
- the pulse wave sensor 401 and the pulse wave sensor 402 have been described as detecting the pulse wave of the artery (radial artery 91) passing through the measurement site (left wrist 90) as a change in impedance.
- the configuration is not limited to the above.
- each pulse wave sensor includes a light emitting element that emits light toward an artery passing through a corresponding portion of the measurement site, and a light receiving element that receives reflected light (or transmitted light) of the light.
- An arterial pulse wave may be detected as a change in volume (photoelectric method).
- each pulse wave sensor may include a piezoelectric sensor in contact with the measurement site to detect strain due to pressure of the artery passing through the corresponding portion of the measurement site as a change in electrical resistance (piezoelectric method).
- each pulse wave sensor includes a transmitting element for transmitting a radio wave (transmission wave) toward an artery passing through a corresponding portion of the measurement site, and a receiving element for receiving a reflected wave of the radio wave.
- a change in the distance between the artery and the sensor due to the pulse wave may be detected as a phase shift between the transmission wave and the reflected wave (radio wave irradiation system).
- the belt 20, the pressing cuff 24 and the solid 22 are mentioned as an example of the pressing portion, the present invention is not limited to this.
- it may be a pressing unit that mechanically expands the pulse wave sensor 401 and the pulse wave sensor 402 in the thickness direction from the outer peripheral surface of the compression cuff 21 in a non-pressure state.
- the pressure cuff 24 of the fluid bag was mentioned as an example of an expansion member, it is not restricted to this.
- the pulse wave sensor 401 and the pulse wave sensor 402 may be pressed via the solid body 22 by an expansion member that mechanically expands in the thickness direction.
- the configuration for calculating the pulse wave propagation time by comparing two pulse wave signals obtained by two pulse wave sensors has been described, but the present invention is not limited to this configuration.
- the pulse wave propagation time is calculated by comparing the pulse wave signal obtained by one pulse wave sensor (for example, pulse wave sensor 401 or 402) with the electrocardiogram signal obtained by the electrocardiogram sensor It may be In this case, the same analog signal processing and digital signal processing as described above are applied to the electrocardiogram signal.
- the electrocardiogram sensor has a pair of electrocardiogram electrodes, and detects an electrocardiogram signal by one electrocardiogram electrode and the other electrocardiogram electrode.
- Each of the electrocardiographic electrodes is attached, for example, in contact with the left and right hands, arms and the like of the human body.
- Each electrocardiographic electrode is connected to the voltage detection circuit 49 through a cable.
- the voltage detection circuit 49 detects an electrocardiogram signal through the cable, and outputs the electrocardiogram signal to the CPU 100 through the wiring 72.
- the analog filter for filtering the electrocardiogram signal may be the same as or different from the analog filter for filtering the pulse wave signal. When a dedicated analog filter for filtering an electrocardiogram signal is separately prepared, when the electrocardiogram signal is subjected to digital signal processing, a digital filter having the same transfer function as the transfer function of the dedicated analog filter is used. It is filtered.
- the CPU 100 calculates the time difference between the rise time of the pulse wave signal and the peak time of the electrocardiogram signal as the pulse wave propagation time.
- the CPU 100 calculates, as the pulse wave propagation time, the time difference between the peak time point of the pulse wave signal indicated by the time series data subjected to digital signal processing and the peak time point of the electrocardiogram signal indicated by time series data subjected to digital signal processing. You may
- the configuration in which the CPU 100 mounted on the sphygmomanometer 1 functions as a data generation unit, a digital filter unit, a time calculation unit, a blood pressure calculation unit, and an output control unit has been described.
- a computer device for example, a smartphone etc.
- configured to be communicable with the sphygmomanometer 1 sequentially receives voltage signals v1 and v2 (digital data) via the network 900, and generates a data generation unit, a digital filter unit,
- the pulse wave propagation time and the blood pressure value may be calculated and the blood pressure value may be displayed by functioning as a time calculation unit, a blood pressure calculation unit, and an output control unit.
- a program that causes a computer to function to execute the control as described in the above-described flowchart.
- a program is recorded on a non-temporary computer readable recording medium such as a flexible disk attached to a computer, a CD (Compact Disk Read Only Memory), a secondary storage device, a main storage device, and a memory card. It can also be provided as a program product.
- the program can be provided by being recorded in a recording medium such as a hard disk built in the computer.
- the program can be provided by downloading via a network.
- the program may call a required module among program modules provided as a part of an operating system (OS) of a computer in a predetermined arrangement at a predetermined timing to execute processing.
- OS operating system
- the program itself does not include the above module, and the processing is executed in cooperation with the OS.
- a program that does not include such a module may also be included in the program according to the present embodiment.
- the program according to the present embodiment may be provided by being incorporated into a part of another program. Also in this case, the program itself does not include a module included in the other program, and the process is executed in cooperation with the other program. Programs incorporated into such other programs may also be included in the program according to the present embodiment.
- the configuration exemplified as the above-described embodiment is an example of the configuration of the present invention, and can be combined with another known technique, and part of the configuration is omitted without departing from the scope of the present invention, etc. It is also possible to change and configure. Moreover, in the embodiment described above, the processing and configuration described in the other embodiments may be appropriately adopted and implemented.
- SYMBOLS 1 Sphygmomanometer, 41, 46 current electrode pair, 10 main body, 10 b bottom face, 15 buckles, 20 belts, 21 compression cuffs, 22 solid materials, 23 bands, 24 pressure cuffs, 25, 26 plate members, 27, 28 connection Bar, 29 fixed part, 31, 34 pressure sensor, 32 pump, 33 valve, 35 switching valve, 38a, 38b, 39a, 39b Air piping, 40 impedance measuring unit, 40E electrode group, 42, 43, 44, 45 detection electrode 49 voltage detection circuit 50 display 51 memory 52 operation unit 53 battery 59 communication unit 71, 72 wiring 90 left wrist 91 radial artery 100 CPU 102 signal input unit 104 data storage unit , 106 data generator, 108 digital filter, 110 time calculator, 112 Blood pressure calculation unit, 114 output control unit, 310 and 340 oscillator, 320 a pump driving circuit, 401 and 402 pulse wave sensor, 403 an analog filter, 404 an amplifier, 405 A / D converter, 900 network.
Landscapes
- Health & Medical Sciences (AREA)
- Life Sciences & Earth Sciences (AREA)
- Cardiology (AREA)
- Molecular Biology (AREA)
- Animal Behavior & Ethology (AREA)
- Pathology (AREA)
- Engineering & Computer Science (AREA)
- Biomedical Technology (AREA)
- Heart & Thoracic Surgery (AREA)
- Medical Informatics (AREA)
- Physics & Mathematics (AREA)
- Surgery (AREA)
- Biophysics (AREA)
- General Health & Medical Sciences (AREA)
- Public Health (AREA)
- Veterinary Medicine (AREA)
- Vascular Medicine (AREA)
- Physiology (AREA)
- Ophthalmology & Optometry (AREA)
- Measuring Pulse, Heart Rate, Blood Pressure Or Blood Flow (AREA)
- Measurement And Recording Of Electrical Phenomena And Electrical Characteristics Of The Living Body (AREA)
Priority Applications (3)
| Application Number | Priority Date | Filing Date | Title |
|---|---|---|---|
| DE112018003290.6T DE112018003290T5 (de) | 2017-07-26 | 2018-06-08 | Messvorrichtung und messverfahren |
| CN201880045153.4A CN110891480B (zh) | 2017-07-26 | 2018-06-08 | 测定装置和测定方法 |
| US16/748,888 US20200221962A1 (en) | 2017-07-26 | 2020-01-22 | Measurement device and measurement method |
Applications Claiming Priority (2)
| Application Number | Priority Date | Filing Date | Title |
|---|---|---|---|
| JP2017144381A JP6902420B2 (ja) | 2017-07-26 | 2017-07-26 | 測定装置、および測定方法 |
| JP2017-144381 | 2017-07-26 |
Related Child Applications (1)
| Application Number | Title | Priority Date | Filing Date |
|---|---|---|---|
| US16/748,888 Continuation US20200221962A1 (en) | 2017-07-26 | 2020-01-22 | Measurement device and measurement method |
Publications (1)
| Publication Number | Publication Date |
|---|---|
| WO2019021649A1 true WO2019021649A1 (ja) | 2019-01-31 |
Family
ID=65040601
Family Applications (1)
| Application Number | Title | Priority Date | Filing Date |
|---|---|---|---|
| PCT/JP2018/022026 Ceased WO2019021649A1 (ja) | 2017-07-26 | 2018-06-08 | 測定装置、および測定方法 |
Country Status (5)
| Country | Link |
|---|---|
| US (1) | US20200221962A1 (https=) |
| JP (1) | JP6902420B2 (https=) |
| CN (1) | CN110891480B (https=) |
| DE (1) | DE112018003290T5 (https=) |
| WO (1) | WO2019021649A1 (https=) |
Cited By (1)
| Publication number | Priority date | Publication date | Assignee | Title |
|---|---|---|---|---|
| WO2022270255A1 (ja) * | 2021-06-25 | 2022-12-29 | オムロンヘルスケア株式会社 | 生体情報測定システム、生体情報測定プログラム及び生体情報測定装置 |
Families Citing this family (1)
| Publication number | Priority date | Publication date | Assignee | Title |
|---|---|---|---|---|
| KR20220000469A (ko) | 2020-06-26 | 2022-01-04 | 삼성전자주식회사 | 생체 신호 측정을 위한 외부 광 보정 방법, 이를 위한 전자 장치 및 저장 매체 |
Citations (7)
| Publication number | Priority date | Publication date | Assignee | Title |
|---|---|---|---|---|
| JPH0614896A (ja) * | 1992-03-17 | 1994-01-25 | Hewlett Packard Co <Hp> | Ecg信号からベース・ラインの漂動を除去するための方法及び装置 |
| JPH07308295A (ja) * | 1994-05-19 | 1995-11-28 | Omron Corp | 血圧測定装置 |
| JP2004321438A (ja) * | 2003-04-24 | 2004-11-18 | Colin Medical Technology Corp | 動脈硬化度評価装置 |
| JP2006255022A (ja) * | 2005-03-15 | 2006-09-28 | Matsushita Electric Ind Co Ltd | 超音波ドプラ血流計 |
| WO2014132713A1 (ja) * | 2013-02-26 | 2014-09-04 | 株式会社村田製作所 | 脈波伝播時間計測装置 |
| JP2016214876A (ja) * | 2015-05-22 | 2016-12-22 | パナソニック株式会社 | 心拍測定装置、心拍測定方法、及び記録媒体 |
| US20170027456A1 (en) * | 2010-07-22 | 2017-02-02 | Masimo Corporation | Non-invasive blood pressure measurement system |
Family Cites Families (11)
| Publication number | Priority date | Publication date | Assignee | Title |
|---|---|---|---|---|
| JP3348660B2 (ja) * | 1998-10-09 | 2002-11-20 | 双葉電子工業株式会社 | シンボル同期装置および周波数ホッピング受信装置 |
| JP3988674B2 (ja) * | 2003-04-21 | 2007-10-10 | オムロンヘルスケア株式会社 | 脈波伝播速度情報測定装置 |
| JP4645331B2 (ja) * | 2005-07-07 | 2011-03-09 | ソニー株式会社 | 信号処理装置、信号処理方法 |
| CN100466968C (zh) * | 2006-09-29 | 2009-03-11 | 北京新兴阳升科技有限公司 | 柯氏音延时和脉搏波传导时间血压监测仪的检测方法及应用其的信号发生器 |
| US20100152600A1 (en) * | 2008-04-03 | 2010-06-17 | Kai Sensors, Inc. | Non-contact physiologic motion sensors and methods for use |
| US9339209B2 (en) * | 2010-04-19 | 2016-05-17 | Sotera Wireless, Inc. | Body-worn monitor for measuring respiratory rate |
| JP6003470B2 (ja) * | 2012-09-25 | 2016-10-05 | オムロンヘルスケア株式会社 | 血圧測定装置、脈波検出方法 |
| CN104825140A (zh) * | 2014-02-11 | 2015-08-12 | 瞿浩正 | 脉搏波提取的数字滤波方法与数字滤波器 |
| CN107106054B (zh) * | 2014-09-08 | 2021-11-02 | 苹果公司 | 使用多功能腕戴式设备进行血压监测 |
| JP6583427B2 (ja) * | 2015-11-17 | 2019-10-02 | 株式会社村田製作所 | 脈波伝播時間計測装置、及び、生体状態推定装置 |
| CN106108864B (zh) * | 2016-06-23 | 2018-10-19 | 成都理工大学 | 一种基于光反射法在小范围内测量脉搏波速的装置及方法 |
-
2017
- 2017-07-26 JP JP2017144381A patent/JP6902420B2/ja active Active
-
2018
- 2018-06-08 DE DE112018003290.6T patent/DE112018003290T5/de active Pending
- 2018-06-08 WO PCT/JP2018/022026 patent/WO2019021649A1/ja not_active Ceased
- 2018-06-08 CN CN201880045153.4A patent/CN110891480B/zh active Active
-
2020
- 2020-01-22 US US16/748,888 patent/US20200221962A1/en not_active Abandoned
Patent Citations (7)
| Publication number | Priority date | Publication date | Assignee | Title |
|---|---|---|---|---|
| JPH0614896A (ja) * | 1992-03-17 | 1994-01-25 | Hewlett Packard Co <Hp> | Ecg信号からベース・ラインの漂動を除去するための方法及び装置 |
| JPH07308295A (ja) * | 1994-05-19 | 1995-11-28 | Omron Corp | 血圧測定装置 |
| JP2004321438A (ja) * | 2003-04-24 | 2004-11-18 | Colin Medical Technology Corp | 動脈硬化度評価装置 |
| JP2006255022A (ja) * | 2005-03-15 | 2006-09-28 | Matsushita Electric Ind Co Ltd | 超音波ドプラ血流計 |
| US20170027456A1 (en) * | 2010-07-22 | 2017-02-02 | Masimo Corporation | Non-invasive blood pressure measurement system |
| WO2014132713A1 (ja) * | 2013-02-26 | 2014-09-04 | 株式会社村田製作所 | 脈波伝播時間計測装置 |
| JP2016214876A (ja) * | 2015-05-22 | 2016-12-22 | パナソニック株式会社 | 心拍測定装置、心拍測定方法、及び記録媒体 |
Cited By (3)
| Publication number | Priority date | Publication date | Assignee | Title |
|---|---|---|---|---|
| WO2022270255A1 (ja) * | 2021-06-25 | 2022-12-29 | オムロンヘルスケア株式会社 | 生体情報測定システム、生体情報測定プログラム及び生体情報測定装置 |
| JP2023004383A (ja) * | 2021-06-25 | 2023-01-17 | オムロンヘルスケア株式会社 | 生体情報測定システム、生体情報測定プログラム及び生体情報測定装置 |
| JP7615911B2 (ja) | 2021-06-25 | 2025-01-17 | オムロンヘルスケア株式会社 | 生体情報測定システム、生体情報測定プログラム及び生体情報測定装置 |
Also Published As
| Publication number | Publication date |
|---|---|
| JP2019024602A (ja) | 2019-02-21 |
| JP6902420B2 (ja) | 2021-07-14 |
| US20200221962A1 (en) | 2020-07-16 |
| CN110891480B (zh) | 2022-10-21 |
| DE112018003290T5 (de) | 2020-04-09 |
| CN110891480A (zh) | 2020-03-17 |
Similar Documents
| Publication | Publication Date | Title |
|---|---|---|
| US11622694B2 (en) | Pulse wave measurement device, pulse wave measurement method, and blood pressure measurement device | |
| JP6098101B2 (ja) | 血圧計測装置及び血圧計測方法 | |
| JP6761337B2 (ja) | 脈波測定装置および脈波測定方法、並びに血圧測定装置 | |
| JP6777535B2 (ja) | 血圧計および血圧測定方法並びに機器 | |
| CN112584758B (zh) | 脉搏波传播时间测定装置以及血压测定装置 | |
| WO2000049943A1 (en) | Blood pressure measuring device and pulse wave detecting device | |
| WO2019193974A1 (ja) | 血圧測定装置 | |
| JP7023752B2 (ja) | 脈波伝播時間測定装置及び血圧測定装置 | |
| CN111093489A (zh) | 血压推定装置 | |
| WO2019124025A1 (ja) | 測定装置およびプログラム | |
| US11317818B2 (en) | Blood pressure measurement device and blood pressure measurement method | |
| US20190290142A1 (en) | Pulse wave measurement device, pulse wave measurement method, and blood pressure measurement device | |
| US11457828B2 (en) | Pulse wave measurement electrode unit and pulse wave measurement device | |
| WO2019021649A1 (ja) | 測定装置、および測定方法 | |
| JP7023751B2 (ja) | 生体情報測定装置 | |
| US9848782B2 (en) | Blood pressure estimation device, blood pressure estimation method, blood pressure measurement device, and recording medium | |
| JP6970605B2 (ja) | 血圧推定装置 | |
| JP7102176B2 (ja) | 生体情報測定装置 |
Legal Events
| Date | Code | Title | Description |
|---|---|---|---|
| 121 | Ep: the epo has been informed by wipo that ep was designated in this application |
Ref document number: 18837413 Country of ref document: EP Kind code of ref document: A1 |
|
| 122 | Ep: pct application non-entry in european phase |
Ref document number: 18837413 Country of ref document: EP Kind code of ref document: A1 |