WO2018174262A1 - 監視システム、処理装置および監視装置 - Google Patents
監視システム、処理装置および監視装置 Download PDFInfo
- Publication number
- WO2018174262A1 WO2018174262A1 PCT/JP2018/011836 JP2018011836W WO2018174262A1 WO 2018174262 A1 WO2018174262 A1 WO 2018174262A1 JP 2018011836 W JP2018011836 W JP 2018011836W WO 2018174262 A1 WO2018174262 A1 WO 2018174262A1
- Authority
- WO
- WIPO (PCT)
- Prior art keywords
- data
- monitoring
- density
- low
- acquired
- Prior art date
- Legal status (The legal status is an assumption and is not a legal conclusion. Google has not performed a legal analysis and makes no representation as to the accuracy of the status listed.)
- Ceased
Links
Images


Classifications
-
- G—PHYSICS
- G01—MEASURING; TESTING
- G01M—TESTING STATIC OR DYNAMIC BALANCE OF MACHINES OR STRUCTURES; TESTING OF STRUCTURES OR APPARATUS, NOT OTHERWISE PROVIDED FOR
- G01M13/00—Testing of machine parts
-
- G—PHYSICS
- G01—MEASURING; TESTING
- G01M—TESTING STATIC OR DYNAMIC BALANCE OF MACHINES OR STRUCTURES; TESTING OF STRUCTURES OR APPARATUS, NOT OTHERWISE PROVIDED FOR
- G01M99/00—Subject matter not provided for in other groups of this subclass
- G01M99/005—Testing of complete machines, e.g. washing-machines or mobile phones
-
- H—ELECTRICITY
- H04—ELECTRIC COMMUNICATION TECHNIQUE
- H04L—TRANSMISSION OF DIGITAL INFORMATION, e.g. TELEGRAPHIC COMMUNICATION
- H04L43/00—Arrangements for monitoring or testing data switching networks
- H04L43/02—Capturing of monitoring data
- H04L43/022—Capturing of monitoring data by sampling
- H04L43/024—Capturing of monitoring data by sampling by adaptive sampling
-
- H—ELECTRICITY
- H04—ELECTRIC COMMUNICATION TECHNIQUE
- H04L—TRANSMISSION OF DIGITAL INFORMATION, e.g. TELEGRAPHIC COMMUNICATION
- H04L47/00—Traffic control in data switching networks
- H04L47/10—Flow control; Congestion control
- H04L47/12—Avoiding congestion; Recovering from congestion
Definitions
- the present invention relates to a monitoring system, a processing device, a monitoring device, a monitoring method, and a program.
- sensor data such as temperature and pressure is acquired as the operating status in order to monitor whether the equipment is operating normally. And monitor.
- the operation state of the monitoring target equipment at the site or site is detected by sensor data, and this data is collected, aggregated, and transferred to a data center (cloud) by communication (for example, Patent Document 1). reference). Then, after the data of a plurality of machine facilities and monitoring target facilities are aggregated, a monitoring / diagnosis action is executed.
- a monitoring system a processing device, a monitoring device, a monitoring method, and a program that can monitor a monitoring target facility in more detail while reducing the amount of data to be transmitted are provided.
- a monitoring system for monitoring by a monitoring device connected to the Internet through communication with the monitoring target equipment, wherein the monitoring target equipment is acquired from the equipment main body and the equipment main body.
- a data processing unit that processes the acquired data, and the data processing unit includes a low-density data acquisition unit that acquires low-density data among the acquired data, and a lower-density data than the low-density data among the acquired data.
- a high-density data acquisition unit that acquires high-density data with a large amount of data per time, a data conversion unit that converts the density of the high-density data into low-density feature amount data, the low-density data and the feature amount
- a transmission unit that transmits monitoring data including data, and the monitoring device transmits the monitoring transmitted from the transmission unit in the data processing unit of the monitoring target facility.
- the monitoring device requests detailed data to the monitoring target facility based on the monitoring data, and the transmission unit, when requested by the monitoring device, the high-density data, the low-density data, or the Detailed data including at least one of the feature amount data may be transmitted.
- the monitoring device may request the monitoring target equipment for the detailed data when the abnormality level of the equipment main body based on the low density data or the feature data is equal to or greater than a predetermined threshold.
- the high-density data is, for example, moving image data having a sampling period of 100 Hz to 1 MHz, or 1 million pixels 30 frame rate or more.
- the processing device included in the monitoring target facility in the monitoring system that performs monitoring by the monitoring device connected to the Internet through communication with the monitoring target facility, the acquisition device acquired from the facility body
- a data processing unit for processing data wherein the data processing unit is a low-density data acquisition unit that acquires low-density data in the acquired data; and the data-per-time than the low-density data in the acquired data
- a high-density data acquisition unit that acquires high-density data with a large amount of data
- a data conversion unit that converts the density of the high-density data into feature data with a reduced density
- a transmission unit that transmits monitoring data.
- the monitoring device in the monitoring system that performs monitoring by the monitoring device connected to the Internet through communication with the monitoring target facility, the low density of the acquired data acquired from the equipment body Monitoring data including data and feature data obtained by reducing the density of high-density data having a larger data amount per time than the low-density data among the acquired data, and based on the received monitoring data Monitoring device that performs monitoring.
- monitoring system processing device, and monitoring device, it is possible to monitor the monitoring target facility in more detail while reducing the amount of data to be transmitted.
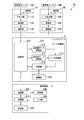
- FIG. 1 is a schematic diagram of a monitoring system S1 according to an embodiment of the present invention.
- the monitoring system S1 is a system that monitors the operating state of each plant 100, which is a monitoring target facility installed in each of a plurality of factories, with a monitoring device 3 installed in a remote monitoring center located remotely from the factory.
- the plant 100 includes an equipment main body and an edge device 2 that processes acquired data acquired from the equipment main body.
- Each edge device 2 is connected to the monitoring device 3 via a public communication network such as the Internet.
- the equipment main body for example, when the plant 100 is a thermal power plant, a plurality of facilities that are involved in thermal power generation, such as a gas turbine, a compressor, a fuel gas supply facility, and an exhaust gas treatment facility, are installed in the plant. Is included.
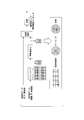
- FIG. 2 is a schematic block diagram showing the functional configuration of the monitoring system S1.
- the monitoring system S1 includes a low density sensor 10A, a low density sensor node 1A, a high density sensor 10B, a high density sensor node 1B, an edge device 2 (processing device), and a monitoring device 3. .
- the low density sensor 10A and the high density sensor 10B are not distinguished, they are referred to as sensors 10.
- the low-density sensor node 1A and the high-density sensor node 1B are not distinguished from each other, they are referred to as sensor nodes 1.
- a plurality of combinations of the low density sensor 10A and the low density sensor node 1A and a combination of the high density sensor 10B and the high density sensor node 1B may be provided in each plant 100.
- the sensor 10, the sensor node 1, and the edge device 2 are installed in the plant 100.
- the sensor 10 and the sensor node 1 are connected by an I / O (input / output unit).
- Each sensor node 1 communicates with the edge device 2 via a LAN (Local Area Network) or the like.
- the input of each sensor node 1 may be input as an electrical signal by directly connecting to the I / O (input / output unit) of the edge device.
- the monitoring device 3 and the edge device 2 communicate via a public communication network such as the Internet.
- the sensor 10 detects and acquires the state quantity of the plant 100 and outputs sensor data (acquisition data) indicating the acquired state quantity to the sensor node 1.
- the low density sensor 10A acquires a state quantity in which the acquired data becomes low density data.
- the low-density sensor 10A has a long sampling period for detecting the state quantity (for example, 0.1 second to 1 second).
- the low density sensor 10 ⁇ / b> A is a sensor that detects pressure, temperature, flow rate, rotation speed, or gas / oil analysis data of the plant 100.
- the high-density sensor 10B acquires a state quantity in which the acquired data becomes high-density data having a larger data amount per hour than the low-density data.
- the high-density sensor 10 ⁇ / b> B is a sensor that detects a state quantity of a short sampling cycle (for example, 100 Hz to 1 MHz), detects vibrations of a compressor, AE (Acoustic Emission), and the like.
- damage to a compressor or the like can be diagnosed by using a vibration sensor that detects vibration.
- data about 10 times the rotation speed of the compressor or the like for example, 6000 RPM (Revolution Per Minute) is required.
- the sampling period of the vibration sensor is 102 to 105 Hz, and the data size is 200 B (bytes) to 200 kB.
- the sampling period of the AE sensor that detects AE is 103 to 106 Hz, and the data size is 2 kB to 2 MB.
- the high-density sensor 10B may be a sensor that detects an image, sound, or the like with a large amount of data per sampling.
- Sensor node 1 transmits the sensor data acquired by sensor 10 to edge device 2.
- the sensor node 1 includes an input / output unit 110, a processing unit 120, and a communication unit 130.
- the input / output unit 110 inputs / outputs data to / from the sensor 10.
- the processing unit 120 transmits the sensor data input from the sensor 10 to the input / output unit 110 from the communication unit 130 to the edge device 2.
- the communication unit 130 communicates with the edge device 2.
- the low density sensor node 1A acquires low density data from the low density sensor 10A and transmits it to the edge device 2.
- the high-density sensor node 1B acquires high-density data from the high-density sensor 10B and transmits it to the edge device 2.
- the edge device 2 is a computer placed on the network of the plant 100, and may have a router or Internet gateway function.
- the edge device 2 includes a data processing unit 210, a communication unit 220, and a storage unit 230.
- the data processing unit 210 is configured by combining a CPU (Central Processing Unit) and a memory, and controls the edge device 2 in an integrated manner.
- the data processing unit 210 includes a low-density data acquisition unit 211, a high-density data acquisition unit 212, a data conversion unit 213, and a transmission unit 214, and processes acquisition data acquired from the equipment body.
- the low density data acquisition unit 211 receives and acquires low density data from the low density sensor node 1A via the communication unit 220, and outputs the acquired low density data to the data conversion unit 213.
- the high density data acquisition unit 212 receives and acquires high density data from the high density sensor node 1B via the communication unit 220, and outputs the acquired high density data to the data conversion unit 213.
- the data conversion unit 213 converts the density of the high-density data acquired by the high-density data acquisition unit 212 into feature amount data with a reduced density. Densification is a process for reducing the amount of data per hour. In the present embodiment, the density is reduced to the same level as the low-density data. For example, the processing is performed so that the sampling interval matches the low-density data. Further, the data conversion unit 213 diagnoses an abnormality of the plant 100 based on the low density data acquired by the low density data acquisition unit 211 and the converted feature amount data, and abnormality diagnosis result data indicating a diagnosis result, The low density data and the feature amount data are output to the transmission unit 214. Details of processing in the data conversion unit 213 will be described later.
- the transmission unit 214 transmits monitoring data including abnormality diagnosis result data, low density data, and feature amount data to the monitoring device 3 via the communication unit 220. In addition, when there is a request from the monitoring device 3, the transmission unit 214 transmits detailed data including at least one of high-density data, low-density data, or feature amount data to the monitoring device 3.
- the communication unit 220 communicates with the sensor node 1 or the monitoring device 3.
- the storage unit 230 stores various information.
- the storage unit 230 functions as a time series / raw waveform database that stores raw waveform data of low density data and high density data.
- the storage unit 230 functions as a time series / feature quantity database that stores time series feature quantity data.
- the storage unit 230 stores abnormality diagnosis result data.
- the storage unit 230 functions as a short-term history database that stores a short-term history, and data (low-density data, high-density data, feature amount data, and abnormality diagnosis result data) for a short period (for example, the latest one month).
- the storage unit 230 stores sensor data when each sensor 10 is normal (hereinafter referred to as normal data) used when diagnosing an abnormality.
- the monitoring device 3 is a computer installed in a remote monitoring center, and includes a processing unit 310, a communication unit 320, a storage unit 330, a display unit 340, and an input unit 350.
- the processing unit 310 is configured by combining a CPU and a memory, and controls the monitoring device 3 as a whole. For example, the processing unit 310 displays monitoring data received from the edge device 2 via the communication unit 320 on the display unit 340 for monitoring. The processing unit 310 requests detailed data from the edge device 2 based on the monitoring data.
- the communication unit 320 communicates with the edge device 2.
- the storage unit 330 stores various information.
- the storage unit 330 stores monitoring data received from the edge device 2.
- the storage unit 330 functions as a long-term history database that stores a long-term history, and stores monitoring data for a long period (for example, for the most recent years).
- the display unit 340 is a liquid crystal display (LCD, Liquid Crystal Display), an organic EL (Electro-Luminescence) display, or the like, and displays various information.
- the input unit 350 is a mouse, a keyboard, a touch panel, or the like, and accepts input.
- the edge device 2 transmits monitoring data based on the sensor data acquired from the sensor node 1 to the monitoring device 3.
- the monitoring device 3 monitors the plant 100 by displaying the monitoring data received from the edge device 2.
- FIG. 3 is a diagram for explaining processing executed by the edge device 2.
- the low density data acquisition unit 211 acquires low density data from the low density sensor node 1 ⁇ / b> A via the communication unit 220, and writes the acquired low density data in the storage unit 230 and stores it.
- the high density data acquisition unit 212 acquires high density data from the high density sensor node 1B via the communication unit 220.
- the data conversion unit 213 cleanses the high-density data. Specifically, for example, when the data is missing and there is a portion that is “N / A (Not Available)” data, the data conversion unit 213 sets the missing portion as an average value of the preceding and following data. Further, the data conversion unit 213 adopts the first data when a plurality of data is input in duplicate at the same time. Further, when the data conversion unit 213 has an abnormal value (maximum value or minimum value (0 (zero) value)) due to the noise of the sensor 10, the data conversion unit 213 converts the abnormal value data to the average value of the preceding and following data. To. Then, the data conversion unit 213 writes the high-density data after cleansing into the storage unit 230 and stores it. Note that the data conversion unit 213 may perform a cleansing process on low-density data.
- the data conversion unit 213 extracts feature amounts from the high-density data after cleansing, and converts the sampling interval of the high-density data into feature amount data that matches the sampling interval of the low-density data.
- the diagnosis frequency of the high density data and the low density data can be matched.
- the data conversion unit 213 reads continuous data, performs frequency analysis by FFT (Fast Fourier Transform), and executes frequency analysis to extract the amplitude for each frequency range.
- FFT Fast Fourier Transform
- the data conversion unit 213 performs a rotational speed component analysis that extracts the gain and phase of the frequency component that is 1 time, 2 times,..., Or 0.5 times the rotational speed. Execute.
- the data conversion unit 213 performs an axial center position analysis that calculates the center position of the shaft from the average value of the displacements of the two vibration sensors installed at 90 degrees. Then, the data conversion unit 213 extracts a peak value for each band obtained from the analysis result (frequency analysis data, Nyquist diagram, Bode diagram, etc.) as a feature value, and stores it in the storage unit 230 as feature value data. Write and store.
- the data conversion unit 213 diagnoses an abnormality based on the low density data and the feature amount data. Specifically, first, the data conversion unit 213 analyzes data by a time-series data analysis method. For example, the data conversion unit 213 sets a threshold value for each sensor 10, sets an abnormality when the threshold value is exceeded, and calculates the degree of abnormality by threshold management that increases the degree of abnormality according to the amount exceeding the threshold value.
- the data conversion unit 213 determines the coordinates of the reference point in the multidimensional space based on the normal time data, calculates the coordinates and the coordinates of each data as the Mahalanobis distance, and the larger the distance, the more abnormal
- the degree of abnormality is calculated by the MT (Mahalanobis Taguchi) method assuming that the degree is large.
- the data conversion unit 213 calculates the degree of abnormality by a K-neighbor method that determines that a point is an abnormal value when the distance from one data to another nearest data (nearest point) exceeds a certain threshold value. .
- the data conversion unit 213 may write and store the analyzed data in the storage unit 230 as feature amount data.
- the data conversion unit 213 determines that there is no abnormality when the calculated abnormality degree is equal to or less than a predetermined threshold value ⁇ set in advance. Further, when the degree of abnormality is larger than the threshold value ⁇ , the data conversion unit 213 determines that there is an abnormality and analyzes the cause of the abnormality. For example, the data conversion unit 213 represents various experience values represented by an expert system in the form of “If Then”, and analyzes the cause of the abnormality by a rule base for diagnosing the cause of the abnormality.
- the data conversion unit 213 assigns the data to the orthogonal table, calculates the SN ratio (unit: dB (decibel)) of the desired characteristic, and selects an item having a high SN ratio as an item related to the cause of the abnormality Analyze the cause of the abnormality by law.
- the data conversion unit 213 compares the sensor data extracted as the cause of failure with the failure mode of FMEA (Failure Mode and Effect Analysis) created for the target machine in advance, and causes the failure by FMEA that extracts the cause of failure. Analyze.
- FMEA Failure Mode and Effect Analysis
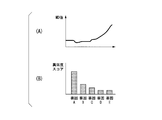
- FIG. 4 is a diagram illustrating an example of abnormality diagnosis result data generated by the edge device 2.
- FIG. 4A is a graph showing an MD (Mahalanobis distance) value that is a calculation result by the MT method. The horizontal axis of the graph shown in this figure is time, and the vertical axis is MD value.
- FIG. 4B shows the abnormality score and abnormality factor ranking of each factor (cause of abnormality).
- the abnormality factor ranking is a ranking of factors having a high abnormality degree score. In the illustrated example, the abnormality score is higher in the order of factor A, factor B, factor C, factor D, and factor E, and the abnormality factor ranking is in that order.
- the transmission unit 214 transmits monitoring data including abnormality diagnosis result data, low-density data, and feature amount data to the monitoring device 3 via the communication unit 220.
- the monitoring device 3 monitors the plant 100 by displaying received monitoring data (for example, a graph indicating an MD value, an abnormality degree score, an abnormality factor ranking, or the like).
- the monitoring device 3 when the abnormality score is high (greater than a predetermined threshold ⁇ set in advance), the monitoring device 3 outputs an alarm (alarm) and requests more detailed data from the edge device 2.
- the threshold value ⁇ that the monitoring device 3 compares with the abnormality score may be different from the threshold value ⁇ that is compared with the edge device 2.
- the processing unit 310 transmits a detailed data request for requesting detailed data to the edge device 2 via the communication unit 320.
- the detailed data includes at least one of low density data, high density data, and feature amount data.
- the detailed data request includes the type of data (type of state quantity detected by the sensor 10), the acquisition period, the data format (raw waveform data (low density data or high density data), feature quantity data, etc.), and the like. Is included.
- the edge device 2 When the edge device 2 receives the detailed data request from the monitoring device 3, the edge device 2 returns detailed data that matches the received detailed data request to the monitoring device 3. Specifically, when the transmission unit 214 receives a detailed data request from the monitoring device 3 via the communication unit 220, the transmission unit 214 matches the type, period, and data format of the data included in the received detailed data. Data is retrieved from the storage unit 230. Then, the transmission unit 214 transmits the detailed data that is the search result to the monitoring device 3 via the communication unit 220.
- the processing unit 310 of the monitoring device 3 When the processing unit 310 of the monitoring device 3 receives the detailed data from the edge device 2, the processing unit 310 displays the received detailed data on the display unit 340. Thereby, the detailed operating condition of the plant 100 with a high degree of abnormality can be confirmed in the monitoring device 3. Further, the processing unit 310 may diagnose an abnormality based on the received detailed data. The method for diagnosing abnormality in the processing unit 310 may be different from the method for diagnosing abnormality in the edge device 2.
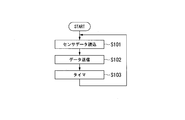
- FIG. 5 is a flowchart illustrating an example of a processing procedure in which the sensor node 1 acquires sensor data.
- the processing unit 120 reads sensor data from the sensor 10 (step S101). Thereafter, the processing unit 120 transmits the read sensor data from the communication unit 130 to the edge device 2 (step S102). Thereafter, the processing unit 120 waits for the time of a sampling period timer for reading sensor data (step S103), and then returns to the processing of S101.
- FIG. 6 is a flowchart illustrating an example of a processing procedure in which the edge device 2 transmits monitoring data.
- the high density data acquisition unit 212 receives high density data from the high density sensor node 1B via the communication unit 220 (step S201).
- the low density data acquisition unit 211 receives the low density data from the low density sensor node 1A via the communication unit 220 (step S202).
- the data conversion unit 213 cleanses the high density data (step S203). Thereafter, the data conversion unit 213 extracts feature amounts of the cleansed high-density data to generate feature amount data (step S204).
- the data conversion unit 213 analyzes the feature amount data and the low density data (step S205). Subsequently, the data conversion unit 213 calculates the degree of abnormality (step S206). Then, the data conversion unit 213 determines whether or not the calculated abnormality degree is greater than the threshold value ⁇ (step S207).
- step S207 If the data conversion unit 213 determines that the degree of abnormality is greater than the threshold value ⁇ (step S207: Yes), the cause of the abnormality is analyzed (step S208).
- step S207 when it is determined that the degree of abnormality is equal to or less than the threshold value ⁇ (step S207: No), or following step S208, the transmission unit 214 transmits abnormality diagnosis result data by the data conversion unit 213 via the communication unit 220. Is sent to the monitoring device 3 (step S209), and the process returns to step S201.
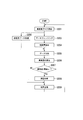
- FIG. 7 is a flowchart illustrating an example of a processing procedure monitored by the monitoring device 3.
- the processing unit 310 receives monitoring data including abnormality diagnosis result data from the edge device 2 via the communication unit 320 (step S301). Subsequently, the processing unit 310 displays the received abnormality diagnosis result data on the display unit 340 (step S302).
- the processing unit 310 determines whether or not the degree of abnormality included in the received abnormality diagnosis result data is greater than the threshold value ⁇ (step S303).
- the processing unit 310 determines that the degree of abnormality is equal to or less than the threshold value ⁇ (step S303: No)
- the processing unit 310 returns to the process of step S301.
- step S303: Yes when the processing unit 310 determines that the degree of abnormality is greater than the threshold ⁇ (step S303: Yes), the processing unit 310 transmits a detailed data request to the edge device 2 via the communication unit 320 (step S304). Thereafter, the processing unit 310 receives the detailed data via the communication unit 320 (step S305). Thereafter, the processing unit 310 displays the received detailed data on the display unit 340 (step S306), and returns to the processing of step S301.
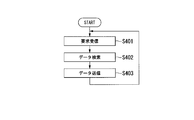
- FIG. 8 is a flowchart illustrating an example of a processing procedure in which the edge device 2 transmits detailed data.
- the transmission unit 214 receives a detailed data request from the monitoring device 3 via the communication unit 220 (step S401). Subsequently, the transmission unit 214 searches the storage unit 230 for data that matches the detailed data request (step S402). Subsequently, the transmission unit 214 transmits the retrieved detailed data to the monitoring device 3 via the communication unit 220 (step S403), and returns to the process of step S401.
- the monitoring system S1 monitors the plant 100 by the monitoring device 3 connected to the plant 100 via the Internet.
- the plant 100 includes an equipment main body and a data processing unit 210 that processes acquired data acquired from the equipment main body.
- the data processing unit 210 includes a low-density data acquisition unit 211 that acquires low-density data among the acquired data, and a high-density data that acquires high-density data having a larger data amount per time than the low-density data among the acquired data.
- the data acquisition part 212, the data conversion part 213 which converts the density of high density data into the feature-value data which reduced the density, and the transmission part 214 which transmits the monitoring data containing low-density data and feature-value data are provided.
- the monitoring device 3 performs monitoring based on the monitoring data transmitted from the transmission unit 214 in the data processing unit 210.
- the amount of data transmitted to the monitoring device 3 can be reduced. Therefore, data transfer time can be shortened, communication costs can be reduced, and network bandwidth pressure can be reduced. In addition, the security threat of data being stolen increases with the amount of data transferred, but by reducing the amount of data, the confidentiality of the data is increased, and the theft risk can be reduced. In addition, when data corruption or delay occurs due to data transfer, data correction or recovery must be performed. However, data corruption or delay can be reduced by reducing the amount of data. Also, when the plant 100 and the monitoring device 3 are in different countries and transfer data over long distances across borders, there is a compliance risk such as import / export regulations, but the data volume is reduced and different. The risk can be reduced by converting it into a state quantity.
- the abnormality of the plant 100 can be diagnosed using the feature amount data obtained by reducing the high-density data, the detailed diagnosis can be performed. Therefore, the plant can be monitored in more detail while reducing the amount of data transmitted to the monitoring device 3.
- the monitoring device 3 requests detailed data when the degree of abnormality of the plant 100 based on the low-density data or the feature amount data is equal to or greater than a predetermined threshold, and the transmission unit 214 is requested by the monitoring device 3. In such a case, detailed data including at least one of high density data, low density data, and feature amount data is transmitted. Thereby, when the degree of abnormality is high, more detailed information can be acquired, so that the monitoring apparatus 3 can confirm a more detailed operation state of the plant 100 when the abnormality occurs.
- the high density data is, for example, one having a sampling period of 100 Hz to 1 MHz. Therefore, since diagnosis can be performed using data with a short sampling period and a large amount of data per time, a more detailed diagnosis can be performed.
- the data processing unit 210 of the edge device 2 or the processing unit 310 of the monitoring device 3 in the above-described embodiment are recorded on a computer-readable recording medium as a program for realizing these functions. Then, the program recorded on the recording medium may be read by the computer system and executed.
- the “computer system” includes an OS and hardware such as peripheral devices.
- the “computer system” includes a homepage providing environment (or display environment) if a WWW system is used.
- the “computer-readable recording medium” refers to a portable medium such as a flexible disk, a magneto-optical disk, a ROM, and a CD-ROM, and a storage unit such as a hard disk built in the computer system.
- the “computer-readable recording medium” dynamically holds a program for a short time like a communication line when transmitting a program via a network such as the Internet or a communication line such as a telephone line.
- a volatile memory inside a computer system serving as a server or a client in that case may be included and a program that holds a program for a certain period of time.
- the program may be a program for realizing a part of the functions described above, and may be a program capable of realizing the functions described above in combination with a program already recorded in a computer system.
- the edge device 2 diagnoses the abnormality of the plant 100.
- the present invention is not limited to this, and the edge device 2 transmits only low density data and feature amount data, and the monitoring device 3 has low density.
- An abnormality of the plant 100 may be diagnosed based on the data and the feature amount data.
- the feature amount data transmitted by the edge device 2 at this time may be data after the data analysis in step S205 described above, or data after the feature amount extraction in step S204 described above.
- the edge device 2 is a router
- the present invention is not limited thereto, and the function of the data processing unit 210 of the edge device 2 is provided in an apparatus connected to the LAN of the plant 100.
- the function may be installed in the main body of the plant 100, or a computer in the factory may have the function.
- the monitoring device 3 automatically requests detailed data from the edge device 2 when the abnormality score is high.
- the present invention is not limited to this, and outputs a warning (alarm). It may be only.
- the user of the monitoring device 3 inputs an operation for manually requesting detailed data to the input unit 350 in response to the alarm.
- the processing unit 310 of the monitoring device 3 transmits a detailed data request to the edge device 2 via the communication unit 320 when the input unit 350 receives an input of an operation requesting detailed data.
- the user may be allowed to specify the type of data included in the detailed data request, the period of acquisition, the data format, and the like.
- the monitoring apparatus 3 was provided with a long-term history database
- the data server etc. which exist in devices different from the monitoring apparatus 3, for example, a data center (cloud) etc. May have a long-term history database.
- the data center collects monitoring data of each plant 100 from each edge device 2 and accumulates it in the long-term history database.
- the monitoring apparatus 3 acquires monitoring data from a data sensor.
- the edge device 2 collectively transmits the low density data and the feature amount data as monitoring data.
- the present invention is not limited to this, and the low density data and the feature amount data are separately transmitted. May be.
- the low-density data may be transmitted sequentially as the data constituting the monitoring data each time the high-density data is generated as the feature data.
- the method of cleansing data and the method of extracting feature values are not limited to those of the above-described embodiment, and other methods may be used as long as the density of high-density data can be reduced.
- the method for diagnosing an abnormality is not limited to the above-described embodiment, and other methods may be used as long as the abnormality of the plant 100 can be diagnosed.
- embodiment mentioned above demonstrated the plant 100 comprised by several machine equipment etc. as a monitoring object installation, it does not restrict to this.
- general equipment such as a single machine installed in a factory or a building itself can be applied as a monitoring target.
- the acquired data of the plant 100 acquired by the sensor 10 is, for example, data related to vibration of the plant 100, data related to sound, data related to images, and the like. Based on these acquired data, low density data and feature data are generated. Based on the generated low density data and feature amount data, the edge device 2 or the monitoring device 3 calculates the degree of abnormality and performs cause analysis. Even when the size of the acquired data is large, such as data related to vibration, the degree of abnormality can be appropriately calculated not only by the edge device 2 but also by the monitoring device 3 by reducing the density. Become.
- the feature amount data may be a frequency analysis result, an average value, a variance value, a maximum value, a minimum value, or the like of acquired data (data relating to vibration, data relating to sound, data relating to an image) in a predetermined period.
- a higher cycle within the predetermined period Measurement may be performed to generate high-density data, and the maximum value, variance value, minimum value, and the like in the high-density data may be used as the feature amount.
- a higher degree of abnormality calculation and cause analysis can be performed by the edge device 2 or the like.
- the edge device 2 may calculate the degree of abnormality and analyze the cause, and notify the monitoring device 3 of the result of the abnormality diagnosis.
- the edge device 2 since it is not necessary to transmit low-density data, feature amount data, or the like from the edge device 2 to the monitoring device 3, it is difficult to be affected by the communication environment between the edge device 2 and the monitoring device 3, and a rapid abnormality diagnosis is performed. It is possible to notify the result of.
- an abnormality can be detected early on the monitoring device 3 side and appropriate measures can be taken.
- a monitoring system a processing device, a monitoring device, a monitoring method, and a program capable of monitoring a monitoring target facility in more detail while reducing the amount of data to be transmitted.
Landscapes
- Physics & Mathematics (AREA)
- General Physics & Mathematics (AREA)
- Engineering & Computer Science (AREA)
- Computer Networks & Wireless Communication (AREA)
- Signal Processing (AREA)
- Testing And Monitoring For Control Systems (AREA)
- Selective Calling Equipment (AREA)
Priority Applications (1)
| Application Number | Priority Date | Filing Date | Title |
|---|---|---|---|
| US16/495,291 US11178026B2 (en) | 2017-03-24 | 2018-03-23 | Monitoring system, processing device, and monitoring device |
Applications Claiming Priority (2)
| Application Number | Priority Date | Filing Date | Title |
|---|---|---|---|
| JP2017-059450 | 2017-03-24 | ||
| JP2017059450A JP6906993B2 (ja) | 2017-03-24 | 2017-03-24 | 監視システム、処理装置、監視装置、監視方法およびプログラム |
Publications (1)
| Publication Number | Publication Date |
|---|---|
| WO2018174262A1 true WO2018174262A1 (ja) | 2018-09-27 |
Family
ID=63584546
Family Applications (1)
| Application Number | Title | Priority Date | Filing Date |
|---|---|---|---|
| PCT/JP2018/011836 Ceased WO2018174262A1 (ja) | 2017-03-24 | 2018-03-23 | 監視システム、処理装置および監視装置 |
Country Status (3)
| Country | Link |
|---|---|
| US (1) | US11178026B2 (cg-RX-API-DMAC7.html) |
| JP (1) | JP6906993B2 (cg-RX-API-DMAC7.html) |
| WO (1) | WO2018174262A1 (cg-RX-API-DMAC7.html) |
Cited By (2)
| Publication number | Priority date | Publication date | Assignee | Title |
|---|---|---|---|---|
| TWI769722B (zh) * | 2020-03-31 | 2022-07-01 | 日商Sumco股份有限公司 | 狀態判斷裝置、狀態判斷方法以及狀態判斷程式 |
| EP4096232A4 (en) * | 2020-01-20 | 2023-05-17 | Panasonic Intellectual Property Corporation of America | ATTACK DETECTION METHOD, SYSTEM AND PROGRAM AND PROGRAM |
Families Citing this family (10)
| Publication number | Priority date | Publication date | Assignee | Title |
|---|---|---|---|---|
| JP7219117B2 (ja) * | 2019-02-28 | 2023-02-07 | コマツ産機株式会社 | 産業機械の予知保全装置、方法、及びシステム |
| JP7294905B2 (ja) * | 2019-06-17 | 2023-06-20 | 矢崎エナジーシステム株式会社 | 無線通信システム |
| JP7466314B2 (ja) * | 2020-01-10 | 2024-04-12 | 三菱電機株式会社 | 遠隔監視装置、ローカル監視装置、遠隔監視システム、遠隔監視方法及びプログラム |
| EP4160342A4 (en) * | 2020-05-29 | 2024-07-17 | Daicel Corporation | Abnormal modulation cause identification device, abnormal modulation cause identification method, and abnormal modulation cause identification program |
| JP7489615B2 (ja) * | 2020-09-29 | 2024-05-24 | パナソニックIpマネジメント株式会社 | 診断システム、診断方法及びプログラム |
| JP2022139155A (ja) * | 2021-03-11 | 2022-09-26 | オムロン株式会社 | 情報処理装置、方法およびプログラム |
| JP7550093B2 (ja) * | 2021-03-29 | 2024-09-12 | 株式会社日立産機システム | 監視装置及び方法 |
| JP7577038B2 (ja) * | 2021-09-08 | 2024-11-01 | 横河電機株式会社 | 波形測定器、波形情報処理システム、波形情報処理装置、波形情報処理プログラム、及び波形情報処理方法 |
| JP7590300B2 (ja) * | 2021-09-22 | 2024-11-26 | 株式会社日立ハイテク | 情報処理装置、および自動分析システム |
| US20230254179A1 (en) * | 2022-02-04 | 2023-08-10 | Haier Us Appliance Solutions, Inc. | System and method for storing appliance diagnostics data |
Citations (5)
| Publication number | Priority date | Publication date | Assignee | Title |
|---|---|---|---|---|
| JPH0437277A (ja) * | 1990-05-31 | 1992-02-07 | Fujitsu General Ltd | 監視カメラシステム |
| JPH08205130A (ja) * | 1995-01-24 | 1996-08-09 | Matsushita Joho Syst Kk | 画像データ送受信装置 |
| JP2001292439A (ja) * | 2000-04-06 | 2001-10-19 | Mitsubishi Heavy Ind Ltd | 監視システム |
| JP2002509268A (ja) * | 1997-12-17 | 2002-03-26 | トムソン マルチメディア | ディジタル画像の認証装置 |
| JP2016208475A (ja) * | 2015-04-28 | 2016-12-08 | 河村電器産業株式会社 | 監視カメラシステム |
Family Cites Families (21)
| Publication number | Priority date | Publication date | Assignee | Title |
|---|---|---|---|---|
| JP2001175326A (ja) * | 1999-12-20 | 2001-06-29 | Toshiba Corp | 多変量データ監視装置 |
| US6957172B2 (en) | 2000-03-09 | 2005-10-18 | Smartsignal Corporation | Complex signal decomposition and modeling |
| US6556956B1 (en) | 2000-06-30 | 2003-04-29 | General Electric Company | Data acquisition unit for remote monitoring system and method for remote monitoring |
| JP2003167623A (ja) | 2001-11-30 | 2003-06-13 | Toshiba Corp | 振動監視装置と方法、およびそのためのプログラム |
| US6937941B2 (en) | 2003-11-20 | 2005-08-30 | Bently Nevada, Llc | Impulse monitoring system: apparatus and method |
| JP4718860B2 (ja) * | 2005-02-17 | 2011-07-06 | 株式会社クリプトン | 遠方監視システムおよび遠方監視方法 |
| US7738320B2 (en) * | 2007-12-03 | 2010-06-15 | General Electric Co. | Method and system for enhanced display of temporal data on portable devices |
| JP2009169888A (ja) * | 2008-01-21 | 2009-07-30 | Hitachi-Ge Nuclear Energy Ltd | センサノード、センサネットワークシステム及び測定データの通信方法 |
| JP2010019641A (ja) | 2008-07-09 | 2010-01-28 | Fujifilm Corp | 情報提供装置、方法およびプログラムならびにアルバム作成装置、方法およびプログラム |
| JP5075762B2 (ja) * | 2008-08-25 | 2012-11-21 | 日立Geニュークリア・エナジー株式会社 | センサノード及びセンサネットワークシステム |
| JP5207378B2 (ja) * | 2008-12-22 | 2013-06-12 | 日立Geニュークリア・エナジー株式会社 | センサネットワークシステム及びセンサノードの管理方法 |
| JP5610695B2 (ja) | 2009-02-17 | 2014-10-22 | 三菱重工業株式会社 | プラント監視用の方法、プログラム及び装置 |
| WO2010116599A1 (ja) * | 2009-04-10 | 2010-10-14 | オムロン株式会社 | 稼働情報出力装置、稼働情報出力装置の制御方法、監視装置、監視装置の制御方法、および制御プログラム |
| JP2011034320A (ja) * | 2009-07-31 | 2011-02-17 | Toshiba Corp | 劣化診断システム及び遠隔保守システム |
| US20140335505A1 (en) * | 2011-09-25 | 2014-11-13 | Theranos, Inc. | Systems and methods for collecting and transmitting assay results |
| US10282676B2 (en) | 2014-10-06 | 2019-05-07 | Fisher-Rosemount Systems, Inc. | Automatic signal processing-based learning in a process plant |
| US9075415B2 (en) * | 2013-03-11 | 2015-07-07 | Airphrame, Inc. | Unmanned aerial vehicle and methods for controlling same |
| US10495674B2 (en) * | 2014-01-29 | 2019-12-03 | Nec Corporation | Monitoring device, monitoring system, monitoring method, correction information generation device, correction information generation method, and non-transitory storage medium |
| JP6339951B2 (ja) | 2015-03-04 | 2018-06-06 | 株式会社日立製作所 | データ収集システム、データ収集方法、サーバ及びゲートウェイ |
| JP6718681B2 (ja) * | 2016-01-05 | 2020-07-08 | ローム株式会社 | センサ装置、センサネットワークシステム、およびデータ圧縮方法 |
| JP6374466B2 (ja) * | 2016-11-11 | 2018-08-15 | ファナック株式会社 | センサインタフェース装置、測定情報通信システム、測定情報通信方法、及び測定情報通信プログラム |
-
2017
- 2017-03-24 JP JP2017059450A patent/JP6906993B2/ja active Active
-
2018
- 2018-03-23 WO PCT/JP2018/011836 patent/WO2018174262A1/ja not_active Ceased
- 2018-03-23 US US16/495,291 patent/US11178026B2/en active Active
Patent Citations (5)
| Publication number | Priority date | Publication date | Assignee | Title |
|---|---|---|---|---|
| JPH0437277A (ja) * | 1990-05-31 | 1992-02-07 | Fujitsu General Ltd | 監視カメラシステム |
| JPH08205130A (ja) * | 1995-01-24 | 1996-08-09 | Matsushita Joho Syst Kk | 画像データ送受信装置 |
| JP2002509268A (ja) * | 1997-12-17 | 2002-03-26 | トムソン マルチメディア | ディジタル画像の認証装置 |
| JP2001292439A (ja) * | 2000-04-06 | 2001-10-19 | Mitsubishi Heavy Ind Ltd | 監視システム |
| JP2016208475A (ja) * | 2015-04-28 | 2016-12-08 | 河村電器産業株式会社 | 監視カメラシステム |
Cited By (2)
| Publication number | Priority date | Publication date | Assignee | Title |
|---|---|---|---|---|
| EP4096232A4 (en) * | 2020-01-20 | 2023-05-17 | Panasonic Intellectual Property Corporation of America | ATTACK DETECTION METHOD, SYSTEM AND PROGRAM AND PROGRAM |
| TWI769722B (zh) * | 2020-03-31 | 2022-07-01 | 日商Sumco股份有限公司 | 狀態判斷裝置、狀態判斷方法以及狀態判斷程式 |
Also Published As
| Publication number | Publication date |
|---|---|
| JP6906993B2 (ja) | 2021-07-21 |
| US20200099598A1 (en) | 2020-03-26 |
| US11178026B2 (en) | 2021-11-16 |
| JP2018164159A (ja) | 2018-10-18 |
Similar Documents
| Publication | Publication Date | Title |
|---|---|---|
| JP6906993B2 (ja) | 監視システム、処理装置、監視装置、監視方法およびプログラム | |
| US12332111B2 (en) | Autonomous discrimination of operation vibration signals | |
| RU2601148C1 (ru) | Система и способ выявления аномалий при подключении устройств | |
| JP2002152862A (ja) | 遠隔監視システム用のデータ収集ユニット及び遠隔監視方法 | |
| CN119146016A (zh) | 基于物联网的风力发电机状态远程监测系统 | |
| CN108933798B (zh) | 数据存储方法、存储服务器及系统 | |
| US20130030765A1 (en) | System and method for use in monitoring machines | |
| US10496775B2 (en) | Method and system for use in dynamically configuring data acquisition systems | |
| US20140121559A1 (en) | Detecting cognitive impairment indicators | |
| JP2014225080A (ja) | 監視システムおよびその診断装置・監視端末 | |
| US20190155235A1 (en) | Data collection system for wind turbine data | |
| JP2019096227A (ja) | 操業改善効果算出装置、操業改善効果算出方法、操業改善効果算出プログラム、および記録媒体 | |
| KR20230137281A (ko) | 블록체인을 이용한 전자 문서 발급 시스템 및 방법과 이를 위한 컴퓨터 프로그램 | |
| JP6665503B2 (ja) | データ収集システム、データ収集装置及びデータ収集方法 | |
| WO2022264650A1 (ja) | サイバーセキュリティ管理装置、サイバーセキュリティ管理方法及びサイバーセキュリティ管理システム | |
| CN109213657B (zh) | 一种电网运行数据云储存装置 | |
| JP7274438B2 (ja) | 資産情報管理システム、及び資産情報管理方法 | |
| JP2020080014A (ja) | エッジ装置、接続確立システム、接続確立方法及びプログラム | |
| WO2020008247A1 (en) | System and method for health diagnosis and maintenance of industrial units | |
| Mukherjee et al. | Tremors: Privacy-breaching inference of computing tasks using vibration-based condition monitors | |
| CN117851195A (zh) | 一种基于数据分析的电脑主机运行风险监测管控系统 | |
| WO2024120018A1 (zh) | 检测方法、训练方法、电器、监控系统、存储介质和设备 | |
| JP6940132B2 (ja) | ネットワーク装置、センシングシステム、データ転送方法、管理方法、センシング方法、及びプログラム | |
| CN205581632U (zh) | 一种用于热电厂内部信息的控制管理系统 | |
| CN107025162A (zh) | 调整数据收集频率的系统及方法 |
Legal Events
| Date | Code | Title | Description |
|---|---|---|---|
| 121 | Ep: the epo has been informed by wipo that ep was designated in this application |
Ref document number: 18772680 Country of ref document: EP Kind code of ref document: A1 |
|
| NENP | Non-entry into the national phase |
Ref country code: DE |
|
| 122 | Ep: pct application non-entry in european phase |
Ref document number: 18772680 Country of ref document: EP Kind code of ref document: A1 |