WO2018174262A1 - Monitoring system, processing device, and monitoring device - Google Patents
Monitoring system, processing device, and monitoring device Download PDFInfo
- Publication number
- WO2018174262A1 WO2018174262A1 PCT/JP2018/011836 JP2018011836W WO2018174262A1 WO 2018174262 A1 WO2018174262 A1 WO 2018174262A1 JP 2018011836 W JP2018011836 W JP 2018011836W WO 2018174262 A1 WO2018174262 A1 WO 2018174262A1
- Authority
- WO
- WIPO (PCT)
- Prior art keywords
- data
- monitoring
- density
- low
- acquired
- Prior art date
Links
Images


Classifications
-
- G—PHYSICS
- G01—MEASURING; TESTING
- G01M—TESTING STATIC OR DYNAMIC BALANCE OF MACHINES OR STRUCTURES; TESTING OF STRUCTURES OR APPARATUS, NOT OTHERWISE PROVIDED FOR
- G01M13/00—Testing of machine parts
-
- H—ELECTRICITY
- H04—ELECTRIC COMMUNICATION TECHNIQUE
- H04L—TRANSMISSION OF DIGITAL INFORMATION, e.g. TELEGRAPHIC COMMUNICATION
- H04L43/00—Arrangements for monitoring or testing data switching networks
- H04L43/02—Capturing of monitoring data
- H04L43/022—Capturing of monitoring data by sampling
- H04L43/024—Capturing of monitoring data by sampling by adaptive sampling
-
- G—PHYSICS
- G01—MEASURING; TESTING
- G01M—TESTING STATIC OR DYNAMIC BALANCE OF MACHINES OR STRUCTURES; TESTING OF STRUCTURES OR APPARATUS, NOT OTHERWISE PROVIDED FOR
- G01M99/00—Subject matter not provided for in other groups of this subclass
- G01M99/005—Testing of complete machines, e.g. washing-machines or mobile phones
-
- H—ELECTRICITY
- H04—ELECTRIC COMMUNICATION TECHNIQUE
- H04L—TRANSMISSION OF DIGITAL INFORMATION, e.g. TELEGRAPHIC COMMUNICATION
- H04L47/00—Traffic control in data switching networks
- H04L47/10—Flow control; Congestion control
- H04L47/12—Avoiding congestion; Recovering from congestion
Definitions
- the present invention relates to a monitoring system, a processing device, a monitoring device, a monitoring method, and a program.
- sensor data such as temperature and pressure is acquired as the operating status in order to monitor whether the equipment is operating normally. And monitor.
- the operation state of the monitoring target equipment at the site or site is detected by sensor data, and this data is collected, aggregated, and transferred to a data center (cloud) by communication (for example, Patent Document 1). reference). Then, after the data of a plurality of machine facilities and monitoring target facilities are aggregated, a monitoring / diagnosis action is executed.
- a monitoring system a processing device, a monitoring device, a monitoring method, and a program that can monitor a monitoring target facility in more detail while reducing the amount of data to be transmitted are provided.
- a monitoring system for monitoring by a monitoring device connected to the Internet through communication with the monitoring target equipment, wherein the monitoring target equipment is acquired from the equipment main body and the equipment main body.
- a data processing unit that processes the acquired data, and the data processing unit includes a low-density data acquisition unit that acquires low-density data among the acquired data, and a lower-density data than the low-density data among the acquired data.
- a high-density data acquisition unit that acquires high-density data with a large amount of data per time, a data conversion unit that converts the density of the high-density data into low-density feature amount data, the low-density data and the feature amount
- a transmission unit that transmits monitoring data including data, and the monitoring device transmits the monitoring transmitted from the transmission unit in the data processing unit of the monitoring target facility.
- the monitoring device requests detailed data to the monitoring target facility based on the monitoring data, and the transmission unit, when requested by the monitoring device, the high-density data, the low-density data, or the Detailed data including at least one of the feature amount data may be transmitted.
- the monitoring device may request the monitoring target equipment for the detailed data when the abnormality level of the equipment main body based on the low density data or the feature data is equal to or greater than a predetermined threshold.
- the high-density data is, for example, moving image data having a sampling period of 100 Hz to 1 MHz, or 1 million pixels 30 frame rate or more.
- the processing device included in the monitoring target facility in the monitoring system that performs monitoring by the monitoring device connected to the Internet through communication with the monitoring target facility, the acquisition device acquired from the facility body
- a data processing unit for processing data wherein the data processing unit is a low-density data acquisition unit that acquires low-density data in the acquired data; and the data-per-time than the low-density data in the acquired data
- a high-density data acquisition unit that acquires high-density data with a large amount of data
- a data conversion unit that converts the density of the high-density data into feature data with a reduced density
- a transmission unit that transmits monitoring data.
- the monitoring device in the monitoring system that performs monitoring by the monitoring device connected to the Internet through communication with the monitoring target facility, the low density of the acquired data acquired from the equipment body Monitoring data including data and feature data obtained by reducing the density of high-density data having a larger data amount per time than the low-density data among the acquired data, and based on the received monitoring data Monitoring device that performs monitoring.
- monitoring system processing device, and monitoring device, it is possible to monitor the monitoring target facility in more detail while reducing the amount of data to be transmitted.
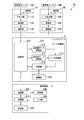
- FIG. 1 is a schematic diagram of a monitoring system S1 according to an embodiment of the present invention.
- the monitoring system S1 is a system that monitors the operating state of each plant 100, which is a monitoring target facility installed in each of a plurality of factories, with a monitoring device 3 installed in a remote monitoring center located remotely from the factory.
- the plant 100 includes an equipment main body and an edge device 2 that processes acquired data acquired from the equipment main body.
- Each edge device 2 is connected to the monitoring device 3 via a public communication network such as the Internet.
- the equipment main body for example, when the plant 100 is a thermal power plant, a plurality of facilities that are involved in thermal power generation, such as a gas turbine, a compressor, a fuel gas supply facility, and an exhaust gas treatment facility, are installed in the plant. Is included.
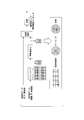
- FIG. 2 is a schematic block diagram showing the functional configuration of the monitoring system S1.
- the monitoring system S1 includes a low density sensor 10A, a low density sensor node 1A, a high density sensor 10B, a high density sensor node 1B, an edge device 2 (processing device), and a monitoring device 3. .
- the low density sensor 10A and the high density sensor 10B are not distinguished, they are referred to as sensors 10.
- the low-density sensor node 1A and the high-density sensor node 1B are not distinguished from each other, they are referred to as sensor nodes 1.
- a plurality of combinations of the low density sensor 10A and the low density sensor node 1A and a combination of the high density sensor 10B and the high density sensor node 1B may be provided in each plant 100.
- the sensor 10, the sensor node 1, and the edge device 2 are installed in the plant 100.
- the sensor 10 and the sensor node 1 are connected by an I / O (input / output unit).
- Each sensor node 1 communicates with the edge device 2 via a LAN (Local Area Network) or the like.
- the input of each sensor node 1 may be input as an electrical signal by directly connecting to the I / O (input / output unit) of the edge device.
- the monitoring device 3 and the edge device 2 communicate via a public communication network such as the Internet.
- the sensor 10 detects and acquires the state quantity of the plant 100 and outputs sensor data (acquisition data) indicating the acquired state quantity to the sensor node 1.
- the low density sensor 10A acquires a state quantity in which the acquired data becomes low density data.
- the low-density sensor 10A has a long sampling period for detecting the state quantity (for example, 0.1 second to 1 second).
- the low density sensor 10 ⁇ / b> A is a sensor that detects pressure, temperature, flow rate, rotation speed, or gas / oil analysis data of the plant 100.
- the high-density sensor 10B acquires a state quantity in which the acquired data becomes high-density data having a larger data amount per hour than the low-density data.
- the high-density sensor 10 ⁇ / b> B is a sensor that detects a state quantity of a short sampling cycle (for example, 100 Hz to 1 MHz), detects vibrations of a compressor, AE (Acoustic Emission), and the like.
- damage to a compressor or the like can be diagnosed by using a vibration sensor that detects vibration.
- data about 10 times the rotation speed of the compressor or the like for example, 6000 RPM (Revolution Per Minute) is required.
- the sampling period of the vibration sensor is 102 to 105 Hz, and the data size is 200 B (bytes) to 200 kB.
- the sampling period of the AE sensor that detects AE is 103 to 106 Hz, and the data size is 2 kB to 2 MB.
- the high-density sensor 10B may be a sensor that detects an image, sound, or the like with a large amount of data per sampling.
- Sensor node 1 transmits the sensor data acquired by sensor 10 to edge device 2.
- the sensor node 1 includes an input / output unit 110, a processing unit 120, and a communication unit 130.
- the input / output unit 110 inputs / outputs data to / from the sensor 10.
- the processing unit 120 transmits the sensor data input from the sensor 10 to the input / output unit 110 from the communication unit 130 to the edge device 2.
- the communication unit 130 communicates with the edge device 2.
- the low density sensor node 1A acquires low density data from the low density sensor 10A and transmits it to the edge device 2.
- the high-density sensor node 1B acquires high-density data from the high-density sensor 10B and transmits it to the edge device 2.
- the edge device 2 is a computer placed on the network of the plant 100, and may have a router or Internet gateway function.
- the edge device 2 includes a data processing unit 210, a communication unit 220, and a storage unit 230.
- the data processing unit 210 is configured by combining a CPU (Central Processing Unit) and a memory, and controls the edge device 2 in an integrated manner.
- the data processing unit 210 includes a low-density data acquisition unit 211, a high-density data acquisition unit 212, a data conversion unit 213, and a transmission unit 214, and processes acquisition data acquired from the equipment body.
- the low density data acquisition unit 211 receives and acquires low density data from the low density sensor node 1A via the communication unit 220, and outputs the acquired low density data to the data conversion unit 213.
- the high density data acquisition unit 212 receives and acquires high density data from the high density sensor node 1B via the communication unit 220, and outputs the acquired high density data to the data conversion unit 213.
- the data conversion unit 213 converts the density of the high-density data acquired by the high-density data acquisition unit 212 into feature amount data with a reduced density. Densification is a process for reducing the amount of data per hour. In the present embodiment, the density is reduced to the same level as the low-density data. For example, the processing is performed so that the sampling interval matches the low-density data. Further, the data conversion unit 213 diagnoses an abnormality of the plant 100 based on the low density data acquired by the low density data acquisition unit 211 and the converted feature amount data, and abnormality diagnosis result data indicating a diagnosis result, The low density data and the feature amount data are output to the transmission unit 214. Details of processing in the data conversion unit 213 will be described later.
- the transmission unit 214 transmits monitoring data including abnormality diagnosis result data, low density data, and feature amount data to the monitoring device 3 via the communication unit 220. In addition, when there is a request from the monitoring device 3, the transmission unit 214 transmits detailed data including at least one of high-density data, low-density data, or feature amount data to the monitoring device 3.
- the communication unit 220 communicates with the sensor node 1 or the monitoring device 3.
- the storage unit 230 stores various information.
- the storage unit 230 functions as a time series / raw waveform database that stores raw waveform data of low density data and high density data.
- the storage unit 230 functions as a time series / feature quantity database that stores time series feature quantity data.
- the storage unit 230 stores abnormality diagnosis result data.
- the storage unit 230 functions as a short-term history database that stores a short-term history, and data (low-density data, high-density data, feature amount data, and abnormality diagnosis result data) for a short period (for example, the latest one month).
- the storage unit 230 stores sensor data when each sensor 10 is normal (hereinafter referred to as normal data) used when diagnosing an abnormality.
- the monitoring device 3 is a computer installed in a remote monitoring center, and includes a processing unit 310, a communication unit 320, a storage unit 330, a display unit 340, and an input unit 350.
- the processing unit 310 is configured by combining a CPU and a memory, and controls the monitoring device 3 as a whole. For example, the processing unit 310 displays monitoring data received from the edge device 2 via the communication unit 320 on the display unit 340 for monitoring. The processing unit 310 requests detailed data from the edge device 2 based on the monitoring data.
- the communication unit 320 communicates with the edge device 2.
- the storage unit 330 stores various information.
- the storage unit 330 stores monitoring data received from the edge device 2.
- the storage unit 330 functions as a long-term history database that stores a long-term history, and stores monitoring data for a long period (for example, for the most recent years).
- the display unit 340 is a liquid crystal display (LCD, Liquid Crystal Display), an organic EL (Electro-Luminescence) display, or the like, and displays various information.
- the input unit 350 is a mouse, a keyboard, a touch panel, or the like, and accepts input.
- the edge device 2 transmits monitoring data based on the sensor data acquired from the sensor node 1 to the monitoring device 3.
- the monitoring device 3 monitors the plant 100 by displaying the monitoring data received from the edge device 2.
- FIG. 3 is a diagram for explaining processing executed by the edge device 2.
- the low density data acquisition unit 211 acquires low density data from the low density sensor node 1 ⁇ / b> A via the communication unit 220, and writes the acquired low density data in the storage unit 230 and stores it.
- the high density data acquisition unit 212 acquires high density data from the high density sensor node 1B via the communication unit 220.
- the data conversion unit 213 cleanses the high-density data. Specifically, for example, when the data is missing and there is a portion that is “N / A (Not Available)” data, the data conversion unit 213 sets the missing portion as an average value of the preceding and following data. Further, the data conversion unit 213 adopts the first data when a plurality of data is input in duplicate at the same time. Further, when the data conversion unit 213 has an abnormal value (maximum value or minimum value (0 (zero) value)) due to the noise of the sensor 10, the data conversion unit 213 converts the abnormal value data to the average value of the preceding and following data. To. Then, the data conversion unit 213 writes the high-density data after cleansing into the storage unit 230 and stores it. Note that the data conversion unit 213 may perform a cleansing process on low-density data.
- the data conversion unit 213 extracts feature amounts from the high-density data after cleansing, and converts the sampling interval of the high-density data into feature amount data that matches the sampling interval of the low-density data.
- the diagnosis frequency of the high density data and the low density data can be matched.
- the data conversion unit 213 reads continuous data, performs frequency analysis by FFT (Fast Fourier Transform), and executes frequency analysis to extract the amplitude for each frequency range.
- FFT Fast Fourier Transform
- the data conversion unit 213 performs a rotational speed component analysis that extracts the gain and phase of the frequency component that is 1 time, 2 times,..., Or 0.5 times the rotational speed. Execute.
- the data conversion unit 213 performs an axial center position analysis that calculates the center position of the shaft from the average value of the displacements of the two vibration sensors installed at 90 degrees. Then, the data conversion unit 213 extracts a peak value for each band obtained from the analysis result (frequency analysis data, Nyquist diagram, Bode diagram, etc.) as a feature value, and stores it in the storage unit 230 as feature value data. Write and store.
- the data conversion unit 213 diagnoses an abnormality based on the low density data and the feature amount data. Specifically, first, the data conversion unit 213 analyzes data by a time-series data analysis method. For example, the data conversion unit 213 sets a threshold value for each sensor 10, sets an abnormality when the threshold value is exceeded, and calculates the degree of abnormality by threshold management that increases the degree of abnormality according to the amount exceeding the threshold value.
- the data conversion unit 213 determines the coordinates of the reference point in the multidimensional space based on the normal time data, calculates the coordinates and the coordinates of each data as the Mahalanobis distance, and the larger the distance, the more abnormal
- the degree of abnormality is calculated by the MT (Mahalanobis Taguchi) method assuming that the degree is large.
- the data conversion unit 213 calculates the degree of abnormality by a K-neighbor method that determines that a point is an abnormal value when the distance from one data to another nearest data (nearest point) exceeds a certain threshold value. .
- the data conversion unit 213 may write and store the analyzed data in the storage unit 230 as feature amount data.
- the data conversion unit 213 determines that there is no abnormality when the calculated abnormality degree is equal to or less than a predetermined threshold value ⁇ set in advance. Further, when the degree of abnormality is larger than the threshold value ⁇ , the data conversion unit 213 determines that there is an abnormality and analyzes the cause of the abnormality. For example, the data conversion unit 213 represents various experience values represented by an expert system in the form of “If Then”, and analyzes the cause of the abnormality by a rule base for diagnosing the cause of the abnormality.
- the data conversion unit 213 assigns the data to the orthogonal table, calculates the SN ratio (unit: dB (decibel)) of the desired characteristic, and selects an item having a high SN ratio as an item related to the cause of the abnormality Analyze the cause of the abnormality by law.
- the data conversion unit 213 compares the sensor data extracted as the cause of failure with the failure mode of FMEA (Failure Mode and Effect Analysis) created for the target machine in advance, and causes the failure by FMEA that extracts the cause of failure. Analyze.
- FMEA Failure Mode and Effect Analysis
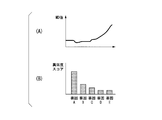
- FIG. 4 is a diagram illustrating an example of abnormality diagnosis result data generated by the edge device 2.
- FIG. 4A is a graph showing an MD (Mahalanobis distance) value that is a calculation result by the MT method. The horizontal axis of the graph shown in this figure is time, and the vertical axis is MD value.
- FIG. 4B shows the abnormality score and abnormality factor ranking of each factor (cause of abnormality).
- the abnormality factor ranking is a ranking of factors having a high abnormality degree score. In the illustrated example, the abnormality score is higher in the order of factor A, factor B, factor C, factor D, and factor E, and the abnormality factor ranking is in that order.
- the transmission unit 214 transmits monitoring data including abnormality diagnosis result data, low-density data, and feature amount data to the monitoring device 3 via the communication unit 220.
- the monitoring device 3 monitors the plant 100 by displaying received monitoring data (for example, a graph indicating an MD value, an abnormality degree score, an abnormality factor ranking, or the like).
- the monitoring device 3 when the abnormality score is high (greater than a predetermined threshold ⁇ set in advance), the monitoring device 3 outputs an alarm (alarm) and requests more detailed data from the edge device 2.
- the threshold value ⁇ that the monitoring device 3 compares with the abnormality score may be different from the threshold value ⁇ that is compared with the edge device 2.
- the processing unit 310 transmits a detailed data request for requesting detailed data to the edge device 2 via the communication unit 320.
- the detailed data includes at least one of low density data, high density data, and feature amount data.
- the detailed data request includes the type of data (type of state quantity detected by the sensor 10), the acquisition period, the data format (raw waveform data (low density data or high density data), feature quantity data, etc.), and the like. Is included.
- the edge device 2 When the edge device 2 receives the detailed data request from the monitoring device 3, the edge device 2 returns detailed data that matches the received detailed data request to the monitoring device 3. Specifically, when the transmission unit 214 receives a detailed data request from the monitoring device 3 via the communication unit 220, the transmission unit 214 matches the type, period, and data format of the data included in the received detailed data. Data is retrieved from the storage unit 230. Then, the transmission unit 214 transmits the detailed data that is the search result to the monitoring device 3 via the communication unit 220.
- the processing unit 310 of the monitoring device 3 When the processing unit 310 of the monitoring device 3 receives the detailed data from the edge device 2, the processing unit 310 displays the received detailed data on the display unit 340. Thereby, the detailed operating condition of the plant 100 with a high degree of abnormality can be confirmed in the monitoring device 3. Further, the processing unit 310 may diagnose an abnormality based on the received detailed data. The method for diagnosing abnormality in the processing unit 310 may be different from the method for diagnosing abnormality in the edge device 2.
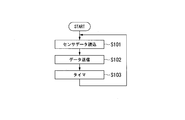
- FIG. 5 is a flowchart illustrating an example of a processing procedure in which the sensor node 1 acquires sensor data.
- the processing unit 120 reads sensor data from the sensor 10 (step S101). Thereafter, the processing unit 120 transmits the read sensor data from the communication unit 130 to the edge device 2 (step S102). Thereafter, the processing unit 120 waits for the time of a sampling period timer for reading sensor data (step S103), and then returns to the processing of S101.
- FIG. 6 is a flowchart illustrating an example of a processing procedure in which the edge device 2 transmits monitoring data.
- the high density data acquisition unit 212 receives high density data from the high density sensor node 1B via the communication unit 220 (step S201).
- the low density data acquisition unit 211 receives the low density data from the low density sensor node 1A via the communication unit 220 (step S202).
- the data conversion unit 213 cleanses the high density data (step S203). Thereafter, the data conversion unit 213 extracts feature amounts of the cleansed high-density data to generate feature amount data (step S204).
- the data conversion unit 213 analyzes the feature amount data and the low density data (step S205). Subsequently, the data conversion unit 213 calculates the degree of abnormality (step S206). Then, the data conversion unit 213 determines whether or not the calculated abnormality degree is greater than the threshold value ⁇ (step S207).
- step S207 If the data conversion unit 213 determines that the degree of abnormality is greater than the threshold value ⁇ (step S207: Yes), the cause of the abnormality is analyzed (step S208).
- step S207 when it is determined that the degree of abnormality is equal to or less than the threshold value ⁇ (step S207: No), or following step S208, the transmission unit 214 transmits abnormality diagnosis result data by the data conversion unit 213 via the communication unit 220. Is sent to the monitoring device 3 (step S209), and the process returns to step S201.
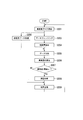
- FIG. 7 is a flowchart illustrating an example of a processing procedure monitored by the monitoring device 3.
- the processing unit 310 receives monitoring data including abnormality diagnosis result data from the edge device 2 via the communication unit 320 (step S301). Subsequently, the processing unit 310 displays the received abnormality diagnosis result data on the display unit 340 (step S302).
- the processing unit 310 determines whether or not the degree of abnormality included in the received abnormality diagnosis result data is greater than the threshold value ⁇ (step S303).
- the processing unit 310 determines that the degree of abnormality is equal to or less than the threshold value ⁇ (step S303: No)
- the processing unit 310 returns to the process of step S301.
- step S303: Yes when the processing unit 310 determines that the degree of abnormality is greater than the threshold ⁇ (step S303: Yes), the processing unit 310 transmits a detailed data request to the edge device 2 via the communication unit 320 (step S304). Thereafter, the processing unit 310 receives the detailed data via the communication unit 320 (step S305). Thereafter, the processing unit 310 displays the received detailed data on the display unit 340 (step S306), and returns to the processing of step S301.
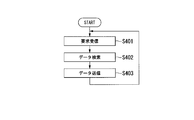
- FIG. 8 is a flowchart illustrating an example of a processing procedure in which the edge device 2 transmits detailed data.
- the transmission unit 214 receives a detailed data request from the monitoring device 3 via the communication unit 220 (step S401). Subsequently, the transmission unit 214 searches the storage unit 230 for data that matches the detailed data request (step S402). Subsequently, the transmission unit 214 transmits the retrieved detailed data to the monitoring device 3 via the communication unit 220 (step S403), and returns to the process of step S401.
- the monitoring system S1 monitors the plant 100 by the monitoring device 3 connected to the plant 100 via the Internet.
- the plant 100 includes an equipment main body and a data processing unit 210 that processes acquired data acquired from the equipment main body.
- the data processing unit 210 includes a low-density data acquisition unit 211 that acquires low-density data among the acquired data, and a high-density data that acquires high-density data having a larger data amount per time than the low-density data among the acquired data.
- the data acquisition part 212, the data conversion part 213 which converts the density of high density data into the feature-value data which reduced the density, and the transmission part 214 which transmits the monitoring data containing low-density data and feature-value data are provided.
- the monitoring device 3 performs monitoring based on the monitoring data transmitted from the transmission unit 214 in the data processing unit 210.
- the amount of data transmitted to the monitoring device 3 can be reduced. Therefore, data transfer time can be shortened, communication costs can be reduced, and network bandwidth pressure can be reduced. In addition, the security threat of data being stolen increases with the amount of data transferred, but by reducing the amount of data, the confidentiality of the data is increased, and the theft risk can be reduced. In addition, when data corruption or delay occurs due to data transfer, data correction or recovery must be performed. However, data corruption or delay can be reduced by reducing the amount of data. Also, when the plant 100 and the monitoring device 3 are in different countries and transfer data over long distances across borders, there is a compliance risk such as import / export regulations, but the data volume is reduced and different. The risk can be reduced by converting it into a state quantity.
- the abnormality of the plant 100 can be diagnosed using the feature amount data obtained by reducing the high-density data, the detailed diagnosis can be performed. Therefore, the plant can be monitored in more detail while reducing the amount of data transmitted to the monitoring device 3.
- the monitoring device 3 requests detailed data when the degree of abnormality of the plant 100 based on the low-density data or the feature amount data is equal to or greater than a predetermined threshold, and the transmission unit 214 is requested by the monitoring device 3. In such a case, detailed data including at least one of high density data, low density data, and feature amount data is transmitted. Thereby, when the degree of abnormality is high, more detailed information can be acquired, so that the monitoring apparatus 3 can confirm a more detailed operation state of the plant 100 when the abnormality occurs.
- the high density data is, for example, one having a sampling period of 100 Hz to 1 MHz. Therefore, since diagnosis can be performed using data with a short sampling period and a large amount of data per time, a more detailed diagnosis can be performed.
- the data processing unit 210 of the edge device 2 or the processing unit 310 of the monitoring device 3 in the above-described embodiment are recorded on a computer-readable recording medium as a program for realizing these functions. Then, the program recorded on the recording medium may be read by the computer system and executed.
- the “computer system” includes an OS and hardware such as peripheral devices.
- the “computer system” includes a homepage providing environment (or display environment) if a WWW system is used.
- the “computer-readable recording medium” refers to a portable medium such as a flexible disk, a magneto-optical disk, a ROM, and a CD-ROM, and a storage unit such as a hard disk built in the computer system.
- the “computer-readable recording medium” dynamically holds a program for a short time like a communication line when transmitting a program via a network such as the Internet or a communication line such as a telephone line.
- a volatile memory inside a computer system serving as a server or a client in that case may be included and a program that holds a program for a certain period of time.
- the program may be a program for realizing a part of the functions described above, and may be a program capable of realizing the functions described above in combination with a program already recorded in a computer system.
- the edge device 2 diagnoses the abnormality of the plant 100.
- the present invention is not limited to this, and the edge device 2 transmits only low density data and feature amount data, and the monitoring device 3 has low density.
- An abnormality of the plant 100 may be diagnosed based on the data and the feature amount data.
- the feature amount data transmitted by the edge device 2 at this time may be data after the data analysis in step S205 described above, or data after the feature amount extraction in step S204 described above.
- the edge device 2 is a router
- the present invention is not limited thereto, and the function of the data processing unit 210 of the edge device 2 is provided in an apparatus connected to the LAN of the plant 100.
- the function may be installed in the main body of the plant 100, or a computer in the factory may have the function.
- the monitoring device 3 automatically requests detailed data from the edge device 2 when the abnormality score is high.
- the present invention is not limited to this, and outputs a warning (alarm). It may be only.
- the user of the monitoring device 3 inputs an operation for manually requesting detailed data to the input unit 350 in response to the alarm.
- the processing unit 310 of the monitoring device 3 transmits a detailed data request to the edge device 2 via the communication unit 320 when the input unit 350 receives an input of an operation requesting detailed data.
- the user may be allowed to specify the type of data included in the detailed data request, the period of acquisition, the data format, and the like.
- the monitoring apparatus 3 was provided with a long-term history database
- the data server etc. which exist in devices different from the monitoring apparatus 3, for example, a data center (cloud) etc. May have a long-term history database.
- the data center collects monitoring data of each plant 100 from each edge device 2 and accumulates it in the long-term history database.
- the monitoring apparatus 3 acquires monitoring data from a data sensor.
- the edge device 2 collectively transmits the low density data and the feature amount data as monitoring data.
- the present invention is not limited to this, and the low density data and the feature amount data are separately transmitted. May be.
- the low-density data may be transmitted sequentially as the data constituting the monitoring data each time the high-density data is generated as the feature data.
- the method of cleansing data and the method of extracting feature values are not limited to those of the above-described embodiment, and other methods may be used as long as the density of high-density data can be reduced.
- the method for diagnosing an abnormality is not limited to the above-described embodiment, and other methods may be used as long as the abnormality of the plant 100 can be diagnosed.
- embodiment mentioned above demonstrated the plant 100 comprised by several machine equipment etc. as a monitoring object installation, it does not restrict to this.
- general equipment such as a single machine installed in a factory or a building itself can be applied as a monitoring target.
- the acquired data of the plant 100 acquired by the sensor 10 is, for example, data related to vibration of the plant 100, data related to sound, data related to images, and the like. Based on these acquired data, low density data and feature data are generated. Based on the generated low density data and feature amount data, the edge device 2 or the monitoring device 3 calculates the degree of abnormality and performs cause analysis. Even when the size of the acquired data is large, such as data related to vibration, the degree of abnormality can be appropriately calculated not only by the edge device 2 but also by the monitoring device 3 by reducing the density. Become.
- the feature amount data may be a frequency analysis result, an average value, a variance value, a maximum value, a minimum value, or the like of acquired data (data relating to vibration, data relating to sound, data relating to an image) in a predetermined period.
- a higher cycle within the predetermined period Measurement may be performed to generate high-density data, and the maximum value, variance value, minimum value, and the like in the high-density data may be used as the feature amount.
- a higher degree of abnormality calculation and cause analysis can be performed by the edge device 2 or the like.
- the edge device 2 may calculate the degree of abnormality and analyze the cause, and notify the monitoring device 3 of the result of the abnormality diagnosis.
- the edge device 2 since it is not necessary to transmit low-density data, feature amount data, or the like from the edge device 2 to the monitoring device 3, it is difficult to be affected by the communication environment between the edge device 2 and the monitoring device 3, and a rapid abnormality diagnosis is performed. It is possible to notify the result of.
- an abnormality can be detected early on the monitoring device 3 side and appropriate measures can be taken.
- a monitoring system a processing device, a monitoring device, a monitoring method, and a program capable of monitoring a monitoring target facility in more detail while reducing the amount of data to be transmitted.
Abstract
A monitoring system for monitoring a facility to be monitored via communications using a monitoring device connected with the internet. The facility to be monitored is provided with a facility body and a data processing unit which processes acquired data acquired from the facility body. The data processing unit is provided with: a low-density data acquisition unit which acquires low-density data from among the acquired data; a high-density data acquisition unit which acquires from among the acquired data high-density data having a greater per-time data amount than the low-density data; a data conversion unit which converts the high-density data into feature quantity data by reducing the density of the high-density data; and a transmission unit which transmits monitoring data including the low-density data and the feature quantity data. The monitoring device performs monitoring on the basis of the monitoring data transmitted from the transmission unit of the data processing unit of the facility to be monitored.
Description
本発明は、監視システム、処理装置、監視装置、監視方法およびプログラムに関する。
本願は、2017年3月24日に日本に出願された特願2017-059450号について優先権を主張し、その内容をここに援用する。 The present invention relates to a monitoring system, a processing device, a monitoring device, a monitoring method, and a program.
This application claims priority on Japanese Patent Application No. 2017-059450 filed in Japan on March 24, 2017, the contents of which are incorporated herein by reference.
従来技術では、発電プラントや化学プラントといった各種のプラントや機械設備などの各種設備では、設備が正常に運転されているか否かを監視するため、温度や、圧力といったセンサデータをその運転状態として取得し、監視する。遠隔監視・診断システムでは、現地、現場にある監視対象設備の運転状態をセンサデータで検知し、このデータが収集、集約されてデータセンタ(クラウド)に通信で転送される(例えば、特許文献1参照)。そして、複数の機械設備、監視対象設備のデータが集約された後に、監視・診断のアクションを実行する。
In the conventional technology, in various types of plants such as power plants and chemical plants, and in various types of equipment such as mechanical equipment, sensor data such as temperature and pressure is acquired as the operating status in order to monitor whether the equipment is operating normally. And monitor. In the remote monitoring / diagnostic system, the operation state of the monitoring target equipment at the site or site is detected by sensor data, and this data is collected, aggregated, and transferred to a data center (cloud) by communication (for example, Patent Document 1). reference). Then, after the data of a plurality of machine facilities and monitoring target facilities are aggregated, a monitoring / diagnosis action is executed.
より詳細な診断をするためには、診断に用いるセンサデータのデータ量(センサ数、データサンプリングレートの高速化、振動・画像・音声などの大容量のデータ等)を増やす必要がある。しかしながら、特許文献1に記載の技術では、全てのデータをデータセンタに転送しており、データ量を増やすと、データの転送に時間がかかるとともに、通信コストがかかるという問題がある。さらに、大量のデータを転送するとネットワーク帯域を圧迫する。
In order to make a more detailed diagnosis, it is necessary to increase the amount of sensor data used for diagnosis (number of sensors, faster data sampling rate, large-capacity data such as vibration / image / sound). However, in the technique described in Patent Document 1, all data is transferred to the data center. If the amount of data is increased, there is a problem that it takes time to transfer data and communication cost. In addition, transferring a large amount of data puts pressure on the network bandwidth.
上述の各実施形態によれば、送信するデータ量を低減しつつ、より詳細に監視対象設備を監視することができる監視システム、処理装置、監視装置、監視方法およびプログラムを提供する。
According to each of the above-described embodiments, a monitoring system, a processing device, a monitoring device, a monitoring method, and a program that can monitor a monitoring target facility in more detail while reducing the amount of data to be transmitted are provided.
本発明の第1の態様によれば、監視対象設備と通信でインターネットに接続された監視装置によって監視を行う監視システムであって、前記監視対象設備は、設備本体と、前記設備本体から取得された取得データを処理するデータ処理部とを備え、前記データ処理部は、前記取得データのうち、低密度データを取得する低密度データ取得部と、前記取得データのうち、前記低密度データよりも時間当たりのデータ量が大きい高密度データを取得する高密度データ取得部と、前記高密度データの密度を低密度化した特徴量データに変換するデータ変換部と、前記低密度データ及び前記特徴量データを含む監視データを送信する送信部とを備え、前記監視装置は、前記監視対象設備の前記データ処理部における前記送信部から送信された前記監視データに基づいて監視を行う監視システムである。
According to the first aspect of the present invention, there is provided a monitoring system for monitoring by a monitoring device connected to the Internet through communication with the monitoring target equipment, wherein the monitoring target equipment is acquired from the equipment main body and the equipment main body. A data processing unit that processes the acquired data, and the data processing unit includes a low-density data acquisition unit that acquires low-density data among the acquired data, and a lower-density data than the low-density data among the acquired data. A high-density data acquisition unit that acquires high-density data with a large amount of data per time, a data conversion unit that converts the density of the high-density data into low-density feature amount data, the low-density data and the feature amount A transmission unit that transmits monitoring data including data, and the monitoring device transmits the monitoring transmitted from the transmission unit in the data processing unit of the monitoring target facility. A monitoring system for monitoring based on the data.
前記監視装置は、前記監視データに基づいて詳細データを前記監視対象設備に要求し、前記送信部は、前記監視装置から要求があった場合には、前記高密度データ、前記低密度データまたは前記特徴量データのうち少なくとも1つを含む詳細データを送信するようにしてもよい。
The monitoring device requests detailed data to the monitoring target facility based on the monitoring data, and the transmission unit, when requested by the monitoring device, the high-density data, the low-density data, or the Detailed data including at least one of the feature amount data may be transmitted.
前記監視装置は、前記低密度データまたは前記特徴量データに基づく前記設備本体の異常度が所定の閾値以上である場合に、前記詳細データを前記監視対象設備に要求するようにしてもよい。
The monitoring device may request the monitoring target equipment for the detailed data when the abnormality level of the equipment main body based on the low density data or the feature data is equal to or greater than a predetermined threshold.
前記高密度データは、例えば、サンプリング周期が100Hzから1MHzのもの、または100万画素30フレームレート以上の動画像データである。
The high-density data is, for example, moving image data having a sampling period of 100 Hz to 1 MHz, or 1 million pixels 30 frame rate or more.
本発明の第2の態様によれば、監視対象設備と通信でインターネットに接続された監視装置によって監視を行う監視システムにおける前記監視対象設備が備える処理装置であって、設備本体から取得された取得データを処理するデータ処理部を備え、前記データ処理部は、前記取得データのうち、低密度データを取得する低密度データ取得部と、前記取得データのうち、前記低密度データよりも時間当たりのデータ量が大きい高密度データを取得する高密度データ取得部と、前記高密度データの密度を低密度化した特徴量データに変換するデータ変換部と、前記低密度データ及び前記特徴量データを含む監視データを送信する送信部と、を備える処理装置である。
According to the second aspect of the present invention, the processing device included in the monitoring target facility in the monitoring system that performs monitoring by the monitoring device connected to the Internet through communication with the monitoring target facility, the acquisition device acquired from the facility body A data processing unit for processing data, wherein the data processing unit is a low-density data acquisition unit that acquires low-density data in the acquired data; and the data-per-time than the low-density data in the acquired data A high-density data acquisition unit that acquires high-density data with a large amount of data, a data conversion unit that converts the density of the high-density data into feature data with a reduced density, and the low-density data and the feature data And a transmission unit that transmits monitoring data.
本発明の第3の態様によれば、監視対象設備と通信でインターネットに接続された監視装置によって監視を行う監視システムにおける前記監視装置であって、設備本体から取得された取得データのうち低密度データと、前記取得データのうち前記低密度データよりも時間当たりのデータ量が大きい高密度データの密度を低密度化した特徴量データとを含む監視データを受信し、受信した前記監視データに基づいて監視を行う監視装置である。
According to the third aspect of the present invention, the monitoring device in the monitoring system that performs monitoring by the monitoring device connected to the Internet through communication with the monitoring target facility, the low density of the acquired data acquired from the equipment body Monitoring data including data and feature data obtained by reducing the density of high-density data having a larger data amount per time than the low-density data among the acquired data, and based on the received monitoring data Monitoring device that performs monitoring.
上記した監視システム、処理装置および監視装置によれば、送信するデータ量を低減しつつ、より詳細に監視対象設備を監視することができる。
According to the above-described monitoring system, processing device, and monitoring device, it is possible to monitor the monitoring target facility in more detail while reducing the amount of data to be transmitted.
以下、本発明の実施形態を説明するが、以下の実施形態は特許請求の範囲にかかる発明を限定するものではない。また、実施形態の中で説明されている特徴の組み合わせの全てが発明の解決手段に必須であるとは限らない。
Hereinafter, embodiments of the present invention will be described. However, the following embodiments do not limit the invention according to the claims. In addition, not all the combinations of features described in the embodiments are essential for the solving means of the invention.
図1は、本発明の一実施形態における監視システムS1の概略図である。監視システムS1は、複数の工場それぞれに設置された監視対象設備である各プラント100の運転中の状態を、工場から遠隔地にある遠隔監視センタに設置された監視装置3で監視するシステムである。プラント100は、設備本体と、設備本体から取得された取得データを処理するエッジデバイス2とを備える。各エッジデバイス2は、インターネット等の公衆通信網で監視装置3と接続される。設備本体としては、例えばプラント100が火力発電プラントであった場合には、ガスタービン、圧縮機、燃料ガス供給設備、排ガス処理設備等、火力発電に係わり当該プラント内に設置される複数の設備類が含まれる。
FIG. 1 is a schematic diagram of a monitoring system S1 according to an embodiment of the present invention. The monitoring system S1 is a system that monitors the operating state of each plant 100, which is a monitoring target facility installed in each of a plurality of factories, with a monitoring device 3 installed in a remote monitoring center located remotely from the factory. . The plant 100 includes an equipment main body and an edge device 2 that processes acquired data acquired from the equipment main body. Each edge device 2 is connected to the monitoring device 3 via a public communication network such as the Internet. As the equipment main body, for example, when the plant 100 is a thermal power plant, a plurality of facilities that are involved in thermal power generation, such as a gas turbine, a compressor, a fuel gas supply facility, and an exhaust gas treatment facility, are installed in the plant. Is included.
図2は、監視システムS1の機能構成を示す概略ブロック図である。同図において、監視システムS1は、低密度センサ10Aと、低密度センサノード1Aと、高密度センサ10Bと、高密度センサノード1Bと、エッジデバイス2(処理装置)と、監視装置3とを備える。以下、低密度センサ10Aと高密度センサ10Bとを区別しない場合には、センサ10と称する。また、低密度センサノード1Aと高密度センサノード1Bとを区別しない場合には、センサノード1と称する。
FIG. 2 is a schematic block diagram showing the functional configuration of the monitoring system S1. In the figure, the monitoring system S1 includes a low density sensor 10A, a low density sensor node 1A, a high density sensor 10B, a high density sensor node 1B, an edge device 2 (processing device), and a monitoring device 3. . Hereinafter, when the low density sensor 10A and the high density sensor 10B are not distinguished, they are referred to as sensors 10. When the low-density sensor node 1A and the high-density sensor node 1B are not distinguished from each other, they are referred to as sensor nodes 1.
なお、低密度センサ10Aと低密度センサノード1Aとの組み合わせ、及び、高密度センサ10Bと高密度センサノード1Bとの組み合わせは、各プラント100に複数組あってもよい。
Note that a plurality of combinations of the low density sensor 10A and the low density sensor node 1A and a combination of the high density sensor 10B and the high density sensor node 1B may be provided in each plant 100.
センサ10、センサノード1およびエッジデバイス2は、プラント100に設置される。センサ10とセンサノード1とは、I/O(入出力部)により接続する。各センサノード1とエッジデバイス2とは、LAN(Local Area Network)等により通信する。または、各センサーノード1の入力を電気信号としてエッジデバイスのI/O(入出力部)に直接接続して入力してもよい。また、監視装置3とエッジデバイス2とは、インターネット等の公衆通信網を介して通信する。
The sensor 10, the sensor node 1, and the edge device 2 are installed in the plant 100. The sensor 10 and the sensor node 1 are connected by an I / O (input / output unit). Each sensor node 1 communicates with the edge device 2 via a LAN (Local Area Network) or the like. Alternatively, the input of each sensor node 1 may be input as an electrical signal by directly connecting to the I / O (input / output unit) of the edge device. The monitoring device 3 and the edge device 2 communicate via a public communication network such as the Internet.
センサ10は、プラント100の状態量を検出して取得し、取得した状態量を示すセンサデータ(取得データ)をセンサノード1に出力する。低密度センサ10Aは、取得データが低密度データになる状態量を取得する。低密度センサ10Aは、例えば、状態量を検出するサンプリング周期が長い(例えば、0.1秒から1秒)ものである。例えば、低密度センサ10Aは、プラント100の圧力、温度、流量、回転数、又は、ガス/油の分析データを検出するセンサである。
The sensor 10 detects and acquires the state quantity of the plant 100 and outputs sensor data (acquisition data) indicating the acquired state quantity to the sensor node 1. The low density sensor 10A acquires a state quantity in which the acquired data becomes low density data. For example, the low-density sensor 10A has a long sampling period for detecting the state quantity (for example, 0.1 second to 1 second). For example, the low density sensor 10 </ b> A is a sensor that detects pressure, temperature, flow rate, rotation speed, or gas / oil analysis data of the plant 100.
高密度センサ10Bは、取得データが低密度データよりも時間当たりのデータ量が大きい高密度データになる状態量を取得する。例えば、高密度センサ10Bは、状態量を検出するサンプリング周期が短い(例えば、100Hzから1MHz)、コンプレッサ等の振動やAE(Acoustic Emission)等を検出するセンサである。例えば、振動を検出する振動センサを用いることにより、コンプレッサ等の破損を診断することができる。しかし、そのためには、コンプレッサ等の回転数(例えば、6000RPM(Revolution Per Minute))の約10倍のデータが必要になる。そのため、振動センサのサンプリング周期は102~105Hzであり、データサイズは200B(バイト)~200kBである。また、AEを検出するAEセンサのサンプリング周期は103~106Hzであり、データサイズは2kB~2MBである。或いは、高密度センサ10Bは、1サンプリング当たりのデータ量が大きい画像や音声等を検出するセンサであってもよい。画像を撮像する画像センサが生成する画像データのサイズは、例えば、800×600×24bit=1.4MBである。
The high-density sensor 10B acquires a state quantity in which the acquired data becomes high-density data having a larger data amount per hour than the low-density data. For example, the high-density sensor 10 </ b> B is a sensor that detects a state quantity of a short sampling cycle (for example, 100 Hz to 1 MHz), detects vibrations of a compressor, AE (Acoustic Emission), and the like. For example, damage to a compressor or the like can be diagnosed by using a vibration sensor that detects vibration. However, for that purpose, data about 10 times the rotation speed of the compressor or the like (for example, 6000 RPM (Revolution Per Minute)) is required. Therefore, the sampling period of the vibration sensor is 102 to 105 Hz, and the data size is 200 B (bytes) to 200 kB. The sampling period of the AE sensor that detects AE is 103 to 106 Hz, and the data size is 2 kB to 2 MB. Alternatively, the high-density sensor 10B may be a sensor that detects an image, sound, or the like with a large amount of data per sampling. The size of the image data generated by the image sensor that captures an image is, for example, 800 × 600 × 24 bits = 1.4 MB.
センサノード1は、センサ10が取得したセンサデータをエッジデバイス2に送信する。センサノード1は、入出力部110と、処理部120と、通信部130とを備える。入出力部110は、センサ10との間でデータを入出力する。処理部120は、センサ10から入出力部110に入力されたセンサデータを通信部130からエッジデバイス2に送信する。通信部130は、エッジデバイス2と通信する。
Sensor node 1 transmits the sensor data acquired by sensor 10 to edge device 2. The sensor node 1 includes an input / output unit 110, a processing unit 120, and a communication unit 130. The input / output unit 110 inputs / outputs data to / from the sensor 10. The processing unit 120 transmits the sensor data input from the sensor 10 to the input / output unit 110 from the communication unit 130 to the edge device 2. The communication unit 130 communicates with the edge device 2.
低密度センサノード1Aは、低密度センサ10Aから低密度データを取得し、エッジデバイス2に送信する。高密度センサノード1Bは、高密度センサ10Bから高密度データを取得し、エッジデバイス2に送信する。
The low density sensor node 1A acquires low density data from the low density sensor 10A and transmits it to the edge device 2. The high-density sensor node 1B acquires high-density data from the high-density sensor 10B and transmits it to the edge device 2.
エッジデバイス2は、プラント100のネットワーク上に置かれた計算機であり、ルータ、あるいはインターネットゲートウェイの機能を持っていてもよい。前記エッジデバイス2は、データ処理部210と、通信部220と、記憶部230とを備える。データ処理部210は、CPU(Central Processing Unit)とメモリとを組み合わせて構成され、エッジデバイス2を統括して制御する。データ処理部210は、低密度データ取得部211と、高密度データ取得部212と、データ変換部213と、送信部214とを備え、設備本体から取得された取得データを処理する。
The edge device 2 is a computer placed on the network of the plant 100, and may have a router or Internet gateway function. The edge device 2 includes a data processing unit 210, a communication unit 220, and a storage unit 230. The data processing unit 210 is configured by combining a CPU (Central Processing Unit) and a memory, and controls the edge device 2 in an integrated manner. The data processing unit 210 includes a low-density data acquisition unit 211, a high-density data acquisition unit 212, a data conversion unit 213, and a transmission unit 214, and processes acquisition data acquired from the equipment body.
低密度データ取得部211は、通信部220を介して、低密度センサノード1Aから低密度データを受信して取得し、取得した低密度データをデータ変換部213に出力する。高密度データ取得部212は、通信部220を介して、高密度センサノード1Bから高密度データを受信して取得し、取得した高密度データをデータ変換部213に出力する。
The low density data acquisition unit 211 receives and acquires low density data from the low density sensor node 1A via the communication unit 220, and outputs the acquired low density data to the data conversion unit 213. The high density data acquisition unit 212 receives and acquires high density data from the high density sensor node 1B via the communication unit 220, and outputs the acquired high density data to the data conversion unit 213.
データ変換部213は、高密度データ取得部212が取得した高密度データの密度を低密度化した特徴量データに変換する。低密度化とは、時間当たりのデータ量を小さくする処理である。本実施形態では、低密度データと同程度まで低密度化しており、例えば、サンプリング間隔を低密度データに合わせるように処理を行っている。また、データ変換部213は、低密度データ取得部211が取得した低密度データと、変換した特徴量データとに基づいて、プラント100の異常を診断し、診断結果を示す異常診断結果データと、低密度データと、特徴量データとを送信部214に出力する。データ変換部213における処理の詳細は後述する。
The data conversion unit 213 converts the density of the high-density data acquired by the high-density data acquisition unit 212 into feature amount data with a reduced density. Densification is a process for reducing the amount of data per hour. In the present embodiment, the density is reduced to the same level as the low-density data. For example, the processing is performed so that the sampling interval matches the low-density data. Further, the data conversion unit 213 diagnoses an abnormality of the plant 100 based on the low density data acquired by the low density data acquisition unit 211 and the converted feature amount data, and abnormality diagnosis result data indicating a diagnosis result, The low density data and the feature amount data are output to the transmission unit 214. Details of processing in the data conversion unit 213 will be described later.
送信部214は、通信部220を介して、異常診断結果データと低密度データと特徴量データとを含む監視データを監視装置3に送信する。また、送信部214は、監視装置3から要求があった場合には、高密度データ、低密度データ又は特徴量データのうち少なくとも1つを含む詳細データを監視装置3に送信する。
The transmission unit 214 transmits monitoring data including abnormality diagnosis result data, low density data, and feature amount data to the monitoring device 3 via the communication unit 220. In addition, when there is a request from the monitoring device 3, the transmission unit 214 transmits detailed data including at least one of high-density data, low-density data, or feature amount data to the monitoring device 3.
通信部220は、センサノード1または監視装置3と通信する。記憶部230は、種々の情報を記憶する。例えば、記憶部230は、低密度データ及び高密度データの生波形データを記憶する時系列・生波形データベースとして機能する。また、記憶部230は、時系列の特徴量データを記憶する時系列・特徴量データベースとして機能する。また、記憶部230は、異常診断結果データを記憶する。記憶部230は、短期間における履歴を記憶する短期履歴データベースとして機能し、短期間(例えば、直近1カ月分)のデータ(低密度データ、高密度データ、特徴量データ、及び異常診断結果データ)を記憶する。また、記憶部230は、異常を診断する際に使用する、各センサ10の正常時のセンサデータ(以下、正常時データとする)を記憶する。
The communication unit 220 communicates with the sensor node 1 or the monitoring device 3. The storage unit 230 stores various information. For example, the storage unit 230 functions as a time series / raw waveform database that stores raw waveform data of low density data and high density data. The storage unit 230 functions as a time series / feature quantity database that stores time series feature quantity data. The storage unit 230 stores abnormality diagnosis result data. The storage unit 230 functions as a short-term history database that stores a short-term history, and data (low-density data, high-density data, feature amount data, and abnormality diagnosis result data) for a short period (for example, the latest one month). Remember. The storage unit 230 stores sensor data when each sensor 10 is normal (hereinafter referred to as normal data) used when diagnosing an abnormality.
監視装置3は、遠隔監視センタに設置されたコンピュータであり、処理部310と、通信部320と、記憶部330と、表示部340と、入力部350とを備える。処理部310は、CPUとメモリとを組み合わせて構成され、監視装置3全体を統括して制御する。例えば、処理部310は、通信部320を介してエッジデバイス2から受信した監視データを表示部340に表示して監視する。また、処理部310は、監視データに基づいて詳細データをエッジデバイス2に要求する。
The monitoring device 3 is a computer installed in a remote monitoring center, and includes a processing unit 310, a communication unit 320, a storage unit 330, a display unit 340, and an input unit 350. The processing unit 310 is configured by combining a CPU and a memory, and controls the monitoring device 3 as a whole. For example, the processing unit 310 displays monitoring data received from the edge device 2 via the communication unit 320 on the display unit 340 for monitoring. The processing unit 310 requests detailed data from the edge device 2 based on the monitoring data.
通信部320は、エッジデバイス2と通信する。記憶部330は、種々の情報を記憶する。例えば、記憶部330は、エッジデバイス2から受信した監視データを記憶する。記憶部330は、長期間の履歴を記憶する長期履歴データベースとして機能し、長期間(例えば、直近数年分)の監視データを記憶する。表示部340は、液晶ディスプレイ(LCD、Liquid Crystal Display)や有機EL(Electro-Luminescence)ディスプレイ等であり、様々な情報を表示する。入力部350は、マウスやキーボードやタッチパネル等であり、入力を受け付ける。
The communication unit 320 communicates with the edge device 2. The storage unit 330 stores various information. For example, the storage unit 330 stores monitoring data received from the edge device 2. The storage unit 330 functions as a long-term history database that stores a long-term history, and stores monitoring data for a long period (for example, for the most recent years). The display unit 340 is a liquid crystal display (LCD, Liquid Crystal Display), an organic EL (Electro-Luminescence) display, or the like, and displays various information. The input unit 350 is a mouse, a keyboard, a touch panel, or the like, and accepts input.
次に、本実施形態による監視システムS1における動作を説明する。監視システムS1では、エッジデバイス2がセンサノード1から取得したセンサデータに基づく監視データを監視装置3に送信する。監視装置3は、エッジデバイス2から受信した監視データを表示する等してプラント100を監視する。
Next, the operation of the monitoring system S1 according to this embodiment will be described. In the monitoring system S <b> 1, the edge device 2 transmits monitoring data based on the sensor data acquired from the sensor node 1 to the monitoring device 3. The monitoring device 3 monitors the plant 100 by displaying the monitoring data received from the edge device 2.
図3は、エッジデバイス2が実行する処理を説明するための図である。まず、低密度データ取得部211が、通信部220を介して、低密度センサノード1Aから低密度データを取得し、取得した低密度データを記憶部230に書き込んで記憶する。また、高密度データ取得部212が、通信部220を介して、高密度センサノード1Bから高密度データを取得する。
FIG. 3 is a diagram for explaining processing executed by the edge device 2. First, the low density data acquisition unit 211 acquires low density data from the low density sensor node 1 </ b> A via the communication unit 220, and writes the acquired low density data in the storage unit 230 and stores it. Further, the high density data acquisition unit 212 acquires high density data from the high density sensor node 1B via the communication unit 220.
続いて、データ変換部213が、高密度データをクレンジングする。具体的には、例えば、データ変換部213は、データが欠落し、”N/A(Not Available)”データになっている部分がある場合には、欠落部分を前後データの平均値にする。また、データ変換部213は、同じ時間にデータが重複して複数入力された場合には、最初のデータを採用する。また、データ変換部213は、センサ10のノイズで異常値(最大値や最小値(0(ゼロ)値))になっている場合には、異常値になっているデータを前後データの平均値にする。そして、データ変換部213は、クレンジング後の高密度データを記憶部230に書き込んで記憶する。なお、データ変換部213は、低密度データに対してもクレンジングする処理を実行してもよい。
Subsequently, the data conversion unit 213 cleanses the high-density data. Specifically, for example, when the data is missing and there is a portion that is “N / A (Not Available)” data, the data conversion unit 213 sets the missing portion as an average value of the preceding and following data. Further, the data conversion unit 213 adopts the first data when a plurality of data is input in duplicate at the same time. Further, when the data conversion unit 213 has an abnormal value (maximum value or minimum value (0 (zero) value)) due to the noise of the sensor 10, the data conversion unit 213 converts the abnormal value data to the average value of the preceding and following data. To. Then, the data conversion unit 213 writes the high-density data after cleansing into the storage unit 230 and stores it. Note that the data conversion unit 213 may perform a cleansing process on low-density data.
続いて、データ変換部213は、クレンジング後の高密度データから特徴量を抽出して、高密度データのサンプリング間隔を低密度データのサンプリング間隔に合わせた特徴量データに変換する。高密度データのサンプリング間隔を低密度データのサンプリング間隔に合わせることにより、高密度データと低密度データとの診断頻度を合わせることができる。例えば、データ変換部213は、連続するデータを読み込み、FFT(Fast Fourier Transform)で周波数分析を行い、周波数レンジ毎の振幅を抽出する周波数解析を実行する。また、データ変換部213は、センサデータが回転数である場合には、回転数の1倍、2倍、…、または0.5倍の周波数成分のゲインや位相を抽出する回転数成分解析を実行する。また、データ変換部213は、センサデータが振動である場合には、90度に設置した2台の振動センサの変位の平均値から軸の中心位置を算出する軸芯位置解析を実行する。そして、データ変換部213は、解析結果(周波数解析のデータや、ナイキスト線図や、ボード線図等)から得られるバンド毎のピーク値を特徴量として抽出し、特徴量データとして記憶部230に書き込んで記憶する。
Subsequently, the data conversion unit 213 extracts feature amounts from the high-density data after cleansing, and converts the sampling interval of the high-density data into feature amount data that matches the sampling interval of the low-density data. By matching the sampling interval of the high density data with the sampling interval of the low density data, the diagnosis frequency of the high density data and the low density data can be matched. For example, the data conversion unit 213 reads continuous data, performs frequency analysis by FFT (Fast Fourier Transform), and executes frequency analysis to extract the amplitude for each frequency range. In addition, when the sensor data is the rotational speed, the data conversion unit 213 performs a rotational speed component analysis that extracts the gain and phase of the frequency component that is 1 time, 2 times,..., Or 0.5 times the rotational speed. Execute. In addition, when the sensor data is vibration, the data conversion unit 213 performs an axial center position analysis that calculates the center position of the shaft from the average value of the displacements of the two vibration sensors installed at 90 degrees. Then, the data conversion unit 213 extracts a peak value for each band obtained from the analysis result (frequency analysis data, Nyquist diagram, Bode diagram, etc.) as a feature value, and stores it in the storage unit 230 as feature value data. Write and store.
続いて、データ変換部213は、低密度データ及び特徴量データに基づいて、異常を診断する。具体的には、まず、データ変換部213は、時系列のデータ分析手法によりデータを分析する。例えば、データ変換部213は、各センサ10に閾値を設定し、閾値を超えたら異常とし、閾値を超えた量に応じて異常度を大きくする閾値管理により異常度を算出する。或いは、データ変換部213は、正常時データに基づいて多次元空間の中に基準となる点の座標を決め、その座標と各データの座標をマハラノビス距離とで算出し、この距離が大きくなるほど異常度が大きいとするMT(マハラノビス・タグチ)法により異常度を算出する。或いは、データ変換部213は、あるデータから別の最も近くにあるデータ(最近傍点)までの距離がある閾値を超えたらその点は異常値であると判定するK近傍法により異常度を算出する。なお、データ変換部213は、分析後のデータを特徴量データとして記憶部230に書き込んで記憶してもよい。
Subsequently, the data conversion unit 213 diagnoses an abnormality based on the low density data and the feature amount data. Specifically, first, the data conversion unit 213 analyzes data by a time-series data analysis method. For example, the data conversion unit 213 sets a threshold value for each sensor 10, sets an abnormality when the threshold value is exceeded, and calculates the degree of abnormality by threshold management that increases the degree of abnormality according to the amount exceeding the threshold value. Alternatively, the data conversion unit 213 determines the coordinates of the reference point in the multidimensional space based on the normal time data, calculates the coordinates and the coordinates of each data as the Mahalanobis distance, and the larger the distance, the more abnormal The degree of abnormality is calculated by the MT (Mahalanobis Taguchi) method assuming that the degree is large. Alternatively, the data conversion unit 213 calculates the degree of abnormality by a K-neighbor method that determines that a point is an abnormal value when the distance from one data to another nearest data (nearest point) exceeds a certain threshold value. . Note that the data conversion unit 213 may write and store the analyzed data in the storage unit 230 as feature amount data.
そして、データ変換部213は、算出した異常度が予め設定された所定の閾値α以下である場合には、異常が無いと判定する。また、データ変換部213は、異常度が閾値αより大きい場合には、異常が有ると判定し、異常の原因を分析する。例えば、データ変換部213は、エキスパートシステムに代表される、いろいろな経験値を「If Then」の形式で表現し、異常原因を診断するルールベースにより異常の原因を分析する。或いは、データ変換部213は、データを直交表に割り当てて、望大特性のSN比(単位はdB(デシベル))を算出し、SN比が高いものを異常原因に関連する項目として選択するMT法により異常の原因を分析する。或いは、データ変換部213は、故障原因として抽出されたセンサデータを予め対象機械用に作成したFMEA(Failure Mode and Effect Analysis)の故障モードに照らし合わせて、故障原因を抽出するFMEAにより異常の原因を分析する。
The data conversion unit 213 determines that there is no abnormality when the calculated abnormality degree is equal to or less than a predetermined threshold value α set in advance. Further, when the degree of abnormality is larger than the threshold value α, the data conversion unit 213 determines that there is an abnormality and analyzes the cause of the abnormality. For example, the data conversion unit 213 represents various experience values represented by an expert system in the form of “If Then”, and analyzes the cause of the abnormality by a rule base for diagnosing the cause of the abnormality. Alternatively, the data conversion unit 213 assigns the data to the orthogonal table, calculates the SN ratio (unit: dB (decibel)) of the desired characteristic, and selects an item having a high SN ratio as an item related to the cause of the abnormality Analyze the cause of the abnormality by law. Alternatively, the data conversion unit 213 compares the sensor data extracted as the cause of failure with the failure mode of FMEA (Failure Mode and Effect Analysis) created for the target machine in advance, and causes the failure by FMEA that extracts the cause of failure. Analyze.
そして、データ変換部213は、異常診断結果データを生成する。図4は、エッジデバイス2が生成する異常診断結果データの一例を示す図である。図4(A)は、MT法による算出結果であるMD(マハラノビス距離)値を示すグラフである。本図に示すグラフの横軸は時間であり、縦軸はMD値である。また、図4(B)は、各要因(異常の原因)の異常度スコア及び異常要因ランキングを示す。異常要因ランキングは、異常度スコアの高い要因のランキングである。図示する例では、要因A、要因B、要因C、要因D、要因Eの順に異常度スコアが高く、異常要因ランキングはその順である。
Then, the data conversion unit 213 generates abnormality diagnosis result data. FIG. 4 is a diagram illustrating an example of abnormality diagnosis result data generated by the edge device 2. FIG. 4A is a graph showing an MD (Mahalanobis distance) value that is a calculation result by the MT method. The horizontal axis of the graph shown in this figure is time, and the vertical axis is MD value. FIG. 4B shows the abnormality score and abnormality factor ranking of each factor (cause of abnormality). The abnormality factor ranking is a ranking of factors having a high abnormality degree score. In the illustrated example, the abnormality score is higher in the order of factor A, factor B, factor C, factor D, and factor E, and the abnormality factor ranking is in that order.
その後、送信部214が、通信部220を介して、異常診断結果データと低密度データと特徴量データとを含む監視データを監視装置3に送信する。監視装置3は、受信した監視データ(例えば、MD値を示すグラフや、異常度スコアや、異常要因ランキング等)を表示する等して、プラント100を監視する。
Thereafter, the transmission unit 214 transmits monitoring data including abnormality diagnosis result data, low-density data, and feature amount data to the monitoring device 3 via the communication unit 220. The monitoring device 3 monitors the plant 100 by displaying received monitoring data (for example, a graph indicating an MD value, an abnormality degree score, an abnormality factor ranking, or the like).
また、監視装置3は、異常度スコアが高い(予め設定された所定の閾値βより大きい)場合には、警報(アラーム)を出力し、より詳細なデータをエッジデバイス2に要求する。ここで、監視装置3が異常度スコアと比較する閾値βは、エッジデバイス2で比較する閾値αと異なる値であってもよい。具体的には、処理部310は、通信部320を介して、詳細データを要求する詳細データ要求をエッジデバイス2に送信する。詳細データは、低密度データ、高密度データ、特徴量データのうち少なくとも1つを含む。詳細データ要求には、データの種類(センサ10が検出する状態量の種類)と、取得する期間と、データの形式(生波形データ(低密度データ又は高密度データ)や特徴量データ等)とが含まれる。
In addition, when the abnormality score is high (greater than a predetermined threshold β set in advance), the monitoring device 3 outputs an alarm (alarm) and requests more detailed data from the edge device 2. Here, the threshold value β that the monitoring device 3 compares with the abnormality score may be different from the threshold value α that is compared with the edge device 2. Specifically, the processing unit 310 transmits a detailed data request for requesting detailed data to the edge device 2 via the communication unit 320. The detailed data includes at least one of low density data, high density data, and feature amount data. The detailed data request includes the type of data (type of state quantity detected by the sensor 10), the acquisition period, the data format (raw waveform data (low density data or high density data), feature quantity data, etc.), and the like. Is included.
エッジデバイス2は、監視装置3から詳細データ要求を受信すると、受信した詳細データ要求に合致する詳細データを監視装置3に返信する。具体的には、送信部214は、通信部220を介して、詳細データ要求を監視装置3から受信すると、受信した詳細データに含まれるデータの種類と、期間と、データの形式とに合致するデータを記憶部230から検索する。そして、送信部214は、通信部220を介して、検索した結果である詳細データを監視装置3に送信する。
When the edge device 2 receives the detailed data request from the monitoring device 3, the edge device 2 returns detailed data that matches the received detailed data request to the monitoring device 3. Specifically, when the transmission unit 214 receives a detailed data request from the monitoring device 3 via the communication unit 220, the transmission unit 214 matches the type, period, and data format of the data included in the received detailed data. Data is retrieved from the storage unit 230. Then, the transmission unit 214 transmits the detailed data that is the search result to the monitoring device 3 via the communication unit 220.
監視装置3の処理部310は、エッジデバイス2から詳細データを受信すると、受信した詳細データを表示部340に表示する。これにより、異常度の高いプラント100の詳細な運転状況を監視装置3において確認することができる。また、処理部310は、受信した詳細データに基づいて、異常を診断してもよい。なお、処理部310における異常を診断する方法は、エッジデバイス2における異常を診断する方法と異なるものであってもよい。
When the processing unit 310 of the monitoring device 3 receives the detailed data from the edge device 2, the processing unit 310 displays the received detailed data on the display unit 340. Thereby, the detailed operating condition of the plant 100 with a high degree of abnormality can be confirmed in the monitoring device 3. Further, the processing unit 310 may diagnose an abnormality based on the received detailed data. The method for diagnosing abnormality in the processing unit 310 may be different from the method for diagnosing abnormality in the edge device 2.
図5は、センサノード1がセンサデータを取得する処理手順の例を示すフローチャートである。
まず、処理部120は、センサ10からセンサデータを読み込む(ステップS101)。その後、処理部120は、読み込んだセンサデータを通信部130からエッジデバイス2に送信する(ステップS102)。その後、処理部120は、センサデータを読み込むサンプリング周期のタイマの時間待機(ステップS103)した後、S101の処理に戻る。 FIG. 5 is a flowchart illustrating an example of a processing procedure in which the sensor node 1 acquires sensor data.
First, theprocessing unit 120 reads sensor data from the sensor 10 (step S101). Thereafter, the processing unit 120 transmits the read sensor data from the communication unit 130 to the edge device 2 (step S102). Thereafter, the processing unit 120 waits for the time of a sampling period timer for reading sensor data (step S103), and then returns to the processing of S101.
まず、処理部120は、センサ10からセンサデータを読み込む(ステップS101)。その後、処理部120は、読み込んだセンサデータを通信部130からエッジデバイス2に送信する(ステップS102)。その後、処理部120は、センサデータを読み込むサンプリング周期のタイマの時間待機(ステップS103)した後、S101の処理に戻る。 FIG. 5 is a flowchart illustrating an example of a processing procedure in which the sensor node 1 acquires sensor data.
First, the
図6は、エッジデバイス2が監視データを送信する処理手順の例を示すフローチャートである。
まず、高密度データ取得部212が、通信部220を介して、高密度センサノード1Bから高密度データを受信する(ステップS201)。また、低密度データ取得部211が、通信部220を介して、低密度センサノード1Aから低密度データを受信する(ステップS202)。 FIG. 6 is a flowchart illustrating an example of a processing procedure in which theedge device 2 transmits monitoring data.
First, the high densitydata acquisition unit 212 receives high density data from the high density sensor node 1B via the communication unit 220 (step S201). Further, the low density data acquisition unit 211 receives the low density data from the low density sensor node 1A via the communication unit 220 (step S202).
まず、高密度データ取得部212が、通信部220を介して、高密度センサノード1Bから高密度データを受信する(ステップS201)。また、低密度データ取得部211が、通信部220を介して、低密度センサノード1Aから低密度データを受信する(ステップS202)。 FIG. 6 is a flowchart illustrating an example of a processing procedure in which the
First, the high density
続いて、データ変換部213が、高密度データをクレンジングする(ステップS203)。その後、データ変換部213は、クレンジングした高密度データの特徴量を抽出して特徴量データを生成する(ステップS204)。
Subsequently, the data conversion unit 213 cleanses the high density data (step S203). Thereafter, the data conversion unit 213 extracts feature amounts of the cleansed high-density data to generate feature amount data (step S204).
続いて、データ変換部213が、特徴量データ及び低密度データを分析する(ステップS205)。続いて、データ変換部213は、異常度を算出する(ステップS206)。そして、データ変換部213は、算出した異常度が閾値αより大きいか否かを判定する(ステップS207)。
Subsequently, the data conversion unit 213 analyzes the feature amount data and the low density data (step S205). Subsequently, the data conversion unit 213 calculates the degree of abnormality (step S206). Then, the data conversion unit 213 determines whether or not the calculated abnormality degree is greater than the threshold value α (step S207).
データ変換部213は、異常度が閾値αより大きいと判定した場合(ステップS207:Yes)には、異常の原因を分析する(ステップS208)。
If the data conversion unit 213 determines that the degree of abnormality is greater than the threshold value α (step S207: Yes), the cause of the abnormality is analyzed (step S208).
一方、異常度が閾値α以下であると判定した場合(ステップS207:No)、或いは、ステップS208に続いて、送信部214は、通信部220を介して、データ変換部213による異常診断結果データを含む監視データを監視装置3に送信し(ステップS209)、ステップS201の処理に戻る。
On the other hand, when it is determined that the degree of abnormality is equal to or less than the threshold value α (step S207: No), or following step S208, the transmission unit 214 transmits abnormality diagnosis result data by the data conversion unit 213 via the communication unit 220. Is sent to the monitoring device 3 (step S209), and the process returns to step S201.
図7は、監視装置3が監視する処理手順の例を示すフローチャートである。
まず、処理部310は、通信部320を介して、エッジデバイス2から異常診断結果データを含む監視データを受信する(ステップS301)。続いて、処理部310は、受信した異常診断結果データを表示部340に表示する(ステップS302)。 FIG. 7 is a flowchart illustrating an example of a processing procedure monitored by themonitoring device 3.
First, theprocessing unit 310 receives monitoring data including abnormality diagnosis result data from the edge device 2 via the communication unit 320 (step S301). Subsequently, the processing unit 310 displays the received abnormality diagnosis result data on the display unit 340 (step S302).
まず、処理部310は、通信部320を介して、エッジデバイス2から異常診断結果データを含む監視データを受信する(ステップS301)。続いて、処理部310は、受信した異常診断結果データを表示部340に表示する(ステップS302)。 FIG. 7 is a flowchart illustrating an example of a processing procedure monitored by the
First, the
続いて、処理部310は、受信した異常診断結果データに含まれる異常度が閾値βより大きいか否かを判定する(ステップS303)。処理部310は、異常度が閾値β以下であると判定した場合(ステップS303:No)には、ステップS301の処理に戻る。
Subsequently, the processing unit 310 determines whether or not the degree of abnormality included in the received abnormality diagnosis result data is greater than the threshold value β (step S303). When the processing unit 310 determines that the degree of abnormality is equal to or less than the threshold value β (step S303: No), the processing unit 310 returns to the process of step S301.
一方、処理部310は、異常度が閾値βより大きいと判定した場合(ステップS303:Yes)には、通信部320を介して、詳細データ要求をエッジデバイス2に送信する(ステップS304)。その後、処理部310は、通信部320を介して、詳細データを受信する(ステップS305)。その後、処理部310は、受信した詳細データを表示部340に表示し(ステップS306)、ステップS301の処理に戻る。
On the other hand, when the processing unit 310 determines that the degree of abnormality is greater than the threshold β (step S303: Yes), the processing unit 310 transmits a detailed data request to the edge device 2 via the communication unit 320 (step S304). Thereafter, the processing unit 310 receives the detailed data via the communication unit 320 (step S305). Thereafter, the processing unit 310 displays the received detailed data on the display unit 340 (step S306), and returns to the processing of step S301.
図8は、エッジデバイス2が詳細データを送信する処理手順の例を示すフローチャートである。
まず、送信部214は、通信部220を介して、詳細データ要求を監視装置3から受信する(ステップS401)。続いて、送信部214は、詳細データ要求に合致するデータを記憶部230から検索する(ステップS402)。続いて、送信部214は、通信部220を介して、検索した詳細データを監視装置3に送信し(ステップS403)、ステップS401の処理に戻る。 FIG. 8 is a flowchart illustrating an example of a processing procedure in which theedge device 2 transmits detailed data.
First, thetransmission unit 214 receives a detailed data request from the monitoring device 3 via the communication unit 220 (step S401). Subsequently, the transmission unit 214 searches the storage unit 230 for data that matches the detailed data request (step S402). Subsequently, the transmission unit 214 transmits the retrieved detailed data to the monitoring device 3 via the communication unit 220 (step S403), and returns to the process of step S401.
まず、送信部214は、通信部220を介して、詳細データ要求を監視装置3から受信する(ステップS401)。続いて、送信部214は、詳細データ要求に合致するデータを記憶部230から検索する(ステップS402)。続いて、送信部214は、通信部220を介して、検索した詳細データを監視装置3に送信し(ステップS403)、ステップS401の処理に戻る。 FIG. 8 is a flowchart illustrating an example of a processing procedure in which the
First, the
以上のように、監視システムS1は、プラント100とインターネットで接続された監視装置3によってプラント100の監視を行う。プラント100は、設備本体と、設備本体から取得された取得データを処理するデータ処理部210とを備える。データ処理部210は、取得データのうち、低密度データを取得する低密度データ取得部211と、取得データのうち、低密度データよりも時間当たりのデータ量が大きい高密度データを取得する高密度データ取得部212と、高密度データの密度を低密度化した特徴量データに変換するデータ変換部213と、低密度データ及び特徴量データを含む監視データを送信する送信部214とを備える。監視装置3は、データ処理部210における送信部214から送信された監視データに基づいて監視を行う。
As described above, the monitoring system S1 monitors the plant 100 by the monitoring device 3 connected to the plant 100 via the Internet. The plant 100 includes an equipment main body and a data processing unit 210 that processes acquired data acquired from the equipment main body. The data processing unit 210 includes a low-density data acquisition unit 211 that acquires low-density data among the acquired data, and a high-density data that acquires high-density data having a larger data amount per time than the low-density data among the acquired data. The data acquisition part 212, the data conversion part 213 which converts the density of high density data into the feature-value data which reduced the density, and the transmission part 214 which transmits the monitoring data containing low-density data and feature-value data are provided. The monitoring device 3 performs monitoring based on the monitoring data transmitted from the transmission unit 214 in the data processing unit 210.
このように、高密度データを低密度化した特徴量データを監視装置3に送信しているため、監視装置3に送信するデータ量を削減することができる。よって、データの転送時間を短縮し、通信コストを低減することができ、ネットワーク帯域の圧迫を低減することができる。また、データの転送量に伴い、データが盗まれるセキュリティの脅威が大きくなるが、データ量を削減することによりデータの秘匿性が高まり、盗難リスクを低減することができる。また、データ転送に伴いデータの破損や遅延が起きた場合にはデータ修正や復旧をしなければならないが、データ量を削減することによりデータの破損や遅延を低減することができる。また、プラント100と監視装置3とが別の国にあり、国境をまたぐ長距離のデータ転送をする場合には、輸出入規制などのコンプライアンスリスクを伴うが、データ量を削減し、また、異なる状態量に変換することにより、そのリスクを低減することができる。
Thus, since the feature amount data obtained by reducing the density of the high-density data is transmitted to the monitoring device 3, the amount of data transmitted to the monitoring device 3 can be reduced. Therefore, data transfer time can be shortened, communication costs can be reduced, and network bandwidth pressure can be reduced. In addition, the security threat of data being stolen increases with the amount of data transferred, but by reducing the amount of data, the confidentiality of the data is increased, and the theft risk can be reduced. In addition, when data corruption or delay occurs due to data transfer, data correction or recovery must be performed. However, data corruption or delay can be reduced by reducing the amount of data. Also, when the plant 100 and the monitoring device 3 are in different countries and transfer data over long distances across borders, there is a compliance risk such as import / export regulations, but the data volume is reduced and different. The risk can be reduced by converting it into a state quantity.
また、高密度データを低密度化した特徴量データを用いてプラント100の異常を診断することができるため、詳細な診断をすることが可能となる。よって、監視装置3に送信するデータ量を低減しつつ、より詳細にプラントを監視することができる。
Further, since the abnormality of the plant 100 can be diagnosed using the feature amount data obtained by reducing the high-density data, the detailed diagnosis can be performed. Therefore, the plant can be monitored in more detail while reducing the amount of data transmitted to the monitoring device 3.
また、監視装置3は、低密度データまたは特徴量データに基づくプラント100の異常度が所定の閾値以上である場合に、詳細データを要求し、送信部214は、監視装置3から要求があった場合には、高密度データ、低密度データまたは特徴量データのうち少なくとも1つを含む詳細データを送信する。これにより、異常度が高い場合にはより詳細な情報を取得することができるため、異常が発生した際のプラント100のより詳細な運転状況を監視装置3で確認することができる。
The monitoring device 3 requests detailed data when the degree of abnormality of the plant 100 based on the low-density data or the feature amount data is equal to or greater than a predetermined threshold, and the transmission unit 214 is requested by the monitoring device 3. In such a case, detailed data including at least one of high density data, low density data, and feature amount data is transmitted. Thereby, when the degree of abnormality is high, more detailed information can be acquired, so that the monitoring apparatus 3 can confirm a more detailed operation state of the plant 100 when the abnormality occurs.
また、高密度データは、例えば、サンプリング周期が100Hzから1MHzのものである。よって、サンプリング周期が短く、時間当たりのデータ量が大きいデータを用いて診断することができるため、より詳細な診断をすることができる。
Further, the high density data is, for example, one having a sampling period of 100 Hz to 1 MHz. Therefore, since diagnosis can be performed using data with a short sampling period and a large amount of data per time, a more detailed diagnosis can be performed.
なお、上述した実施形態におけるエッジデバイス2のデータ処理部210または監視装置3の処理部310の機能全体あるいはその一部は、これらの機能を実現するためのプログラムをコンピュータ読み取り可能な記録媒体に記録して、この記録媒体に記録されたプログラムをコンピュータシステムに読み込ませ、実行することによって実現しても良い。なお、ここでいう「コンピュータシステム」とは、OSや周辺機器等のハードウェアを含むものとする。
Note that all or part of the functions of the data processing unit 210 of the edge device 2 or the processing unit 310 of the monitoring device 3 in the above-described embodiment are recorded on a computer-readable recording medium as a program for realizing these functions. Then, the program recorded on the recording medium may be read by the computer system and executed. Here, the “computer system” includes an OS and hardware such as peripheral devices.
また、「コンピュータシステム」は、WWWシステムを利用している場合であれば、ホームページ提供環境(あるいは表示環境)も含むものとする。また、「コンピュータ読み取り可能な記録媒体」とは、フレキシブルディスク、光磁気ディスク、ROM、CD-ROM等の可搬媒体、コンピュータシステムに内蔵されるハードディスク等の記憶部のことをいう。さらに「コンピュータ読み取り可能な記録媒体」とは、インターネット等のネットワークや電話回線等の通信回線を介してプログラムを送信する場合の通信線のように、短時間の間、動的にプログラムを保持するもの、その場合のサーバやクライアントとなるコンピュータシステム内部の揮発性メモリのように、一定時間プログラムを保持しているものも含んでも良い。また上記プログラムは、前述した機能の一部を実現するためのものであっても良く、さらに前述した機能をコンピュータシステムにすでに記録されているプログラムとの組み合わせで実現できるものであっても良い。
In addition, the “computer system” includes a homepage providing environment (or display environment) if a WWW system is used. The “computer-readable recording medium” refers to a portable medium such as a flexible disk, a magneto-optical disk, a ROM, and a CD-ROM, and a storage unit such as a hard disk built in the computer system. Furthermore, the “computer-readable recording medium” dynamically holds a program for a short time like a communication line when transmitting a program via a network such as the Internet or a communication line such as a telephone line. In this case, a volatile memory inside a computer system serving as a server or a client in that case may be included and a program that holds a program for a certain period of time. The program may be a program for realizing a part of the functions described above, and may be a program capable of realizing the functions described above in combination with a program already recorded in a computer system.
以上、本発明の実施形態について図面を参照して詳述してきたが、具体的な構成はこの実施形態に限られるものではなく、この発明の要旨を逸脱しない範囲の設計変更等も含まれる。
As described above, the embodiment of the present invention has been described in detail with reference to the drawings. However, the specific configuration is not limited to this embodiment, and includes design changes and the like without departing from the gist of the present invention.
例えば、上述した実施形態では、エッジデバイス2がプラント100の異常を診断しているが、これに限らず、エッジデバイス2は低密度データ及び特徴量データのみを送信し、監視装置3が低密度データ及び特徴量データに基づいてプラント100の異常を診断してもよい。このときエッジデバイス2が送信する特徴量データは、上述したステップS205におけるデータ分析後のデータであってもよいし、上述したステップS204における特徴量抽出後のデータであってもよい。
For example, in the above-described embodiment, the edge device 2 diagnoses the abnormality of the plant 100. However, the present invention is not limited to this, and the edge device 2 transmits only low density data and feature amount data, and the monitoring device 3 has low density. An abnormality of the plant 100 may be diagnosed based on the data and the feature amount data. The feature amount data transmitted by the edge device 2 at this time may be data after the data analysis in step S205 described above, or data after the feature amount extraction in step S204 described above.
また、上述した実施形態では、エッジデバイス2がルータである場合を例に説明したが、これに限らず、エッジデバイス2のデータ処理部210の機能はプラント100のLANに接続された装置が備えていればよく、例えば、プラント100本体にその機能が設置されていてもよいし、工場内にあるコンピュータがその機能を備えていてもよい。
In the above-described embodiment, the case where the edge device 2 is a router has been described as an example. However, the present invention is not limited thereto, and the function of the data processing unit 210 of the edge device 2 is provided in an apparatus connected to the LAN of the plant 100. For example, the function may be installed in the main body of the plant 100, or a computer in the factory may have the function.
また、上述した実施形態では、監視装置3は、異常度スコアが高い場合には、自動的に詳細データをエッジデバイス2に要求しているが、これに限らず、警報(アラーム)を出力するのみでもよい。この場合には、監視装置3のユーザが警報に応じて、手動で詳細データを要求する操作を入力部350に入力する。監視装置3の処理部310は、入力部350が詳細データを要求する操作の入力を受け付けた場合に、通信部320を介して、詳細データ要求をエッジデバイス2に送信する。その際、詳細データ要求に含まれるデータの種類、取得する期間、及びデータの形式等をユーザが指定できるようにしてもよい。
In the above-described embodiment, the monitoring device 3 automatically requests detailed data from the edge device 2 when the abnormality score is high. However, the present invention is not limited to this, and outputs a warning (alarm). It may be only. In this case, the user of the monitoring device 3 inputs an operation for manually requesting detailed data to the input unit 350 in response to the alarm. The processing unit 310 of the monitoring device 3 transmits a detailed data request to the edge device 2 via the communication unit 320 when the input unit 350 receives an input of an operation requesting detailed data. At that time, the user may be allowed to specify the type of data included in the detailed data request, the period of acquisition, the data format, and the like.
また、上述した実施形態では、監視装置3が長期履歴データベースを備える場合について説明したが、これに限らず、監視装置3とは別の装置、例えば、データセンタ(クラウド)等にあるデータサーバ等が長期履歴データベースを備えていてもよい。この場合には、データセンタが各プラント100の監視データを各エッジデバイス2から収集し、長期履歴データベースに蓄積する。そして、監視装置3は、データセンサから監視データを取得する。
Moreover, although embodiment mentioned above demonstrated the case where the monitoring apparatus 3 was provided with a long-term history database, it is not restricted to this, For example, the data server etc. which exist in devices different from the monitoring apparatus 3, for example, a data center (cloud) etc. May have a long-term history database. In this case, the data center collects monitoring data of each plant 100 from each edge device 2 and accumulates it in the long-term history database. And the monitoring apparatus 3 acquires monitoring data from a data sensor.
また、上述した実施形態では、エッジデバイス2は、低密度データ及び特徴量データをまとめて監視データとして送信しているが、これに限らず、低密度データと特徴量データとを別々に送信してもよい。例えば、低密度データは順次、高密度データは特徴量データとして生成される毎に、それぞれ監視データを構成する各データとして送信してもよい。
In the above-described embodiment, the edge device 2 collectively transmits the low density data and the feature amount data as monitoring data. However, the present invention is not limited to this, and the low density data and the feature amount data are separately transmitted. May be. For example, the low-density data may be transmitted sequentially as the data constituting the monitoring data each time the high-density data is generated as the feature data.
また、データをクレンジングする方法や特徴量を抽出する方法は、上述した実施形態のものに限られず、高密度データの密度を低密度化できるものであれば他の方法であってもよい。
Further, the method of cleansing data and the method of extracting feature values are not limited to those of the above-described embodiment, and other methods may be used as long as the density of high-density data can be reduced.
また、異常を診断する方法は、上述した実施形態のものに限られず、プラント100の異常を診断できるものであれば他の方法であってもよい。さらに、上述した実施形態では、監視対象設備として、複数の機械設備等で構成されるプラント100について説明したがこれに限るものではない。例えば、工場内に設置された機械設備単体や、建物自体など設備全般を監視対象として適用することができる。
Further, the method for diagnosing an abnormality is not limited to the above-described embodiment, and other methods may be used as long as the abnormality of the plant 100 can be diagnosed. Furthermore, although embodiment mentioned above demonstrated the plant 100 comprised by several machine equipment etc. as a monitoring object installation, it does not restrict to this. For example, general equipment such as a single machine installed in a factory or a building itself can be applied as a monitoring target.
センサ10が取得するプラント100の取得データとは、例えば、プラント100の振動に関するデータ、音に関するデータ、及び画像に関するデータ等である。これらの取得データを基に、低密度データ及び特徴量データが生成される。生成された低密度データ及び特徴量データを基に、エッジデバイス2又は監視装置3が異常度を算出し、原因分析を行う。
振動に関するデータ等のように、取得データのサイズが大きい場合であっても低密度化することにより、エッジデバイス2のみならず、監視装置3でも適切に異常度の算出等をすることが可能となる。
ここで、特徴量データは、所定の期間における取得データ(振動に関するデータ、音に関するデータ、画像に関するデータ)の周波数分析結果、平均値、分散値、最大値、及び最小値等でもよい。 The acquired data of theplant 100 acquired by the sensor 10 is, for example, data related to vibration of the plant 100, data related to sound, data related to images, and the like. Based on these acquired data, low density data and feature data are generated. Based on the generated low density data and feature amount data, the edge device 2 or the monitoring device 3 calculates the degree of abnormality and performs cause analysis.
Even when the size of the acquired data is large, such as data related to vibration, the degree of abnormality can be appropriately calculated not only by theedge device 2 but also by the monitoring device 3 by reducing the density. Become.
Here, the feature amount data may be a frequency analysis result, an average value, a variance value, a maximum value, a minimum value, or the like of acquired data (data relating to vibration, data relating to sound, data relating to an image) in a predetermined period.
振動に関するデータ等のように、取得データのサイズが大きい場合であっても低密度化することにより、エッジデバイス2のみならず、監視装置3でも適切に異常度の算出等をすることが可能となる。
ここで、特徴量データは、所定の期間における取得データ(振動に関するデータ、音に関するデータ、画像に関するデータ)の周波数分析結果、平均値、分散値、最大値、及び最小値等でもよい。 The acquired data of the
Even when the size of the acquired data is large, such as data related to vibration, the degree of abnormality can be appropriately calculated not only by the
Here, the feature amount data may be a frequency analysis result, an average value, a variance value, a maximum value, a minimum value, or the like of acquired data (data relating to vibration, data relating to sound, data relating to an image) in a predetermined period.
所定の期間における任意のタイミングで温度、圧力、及び流量等の測定を行い、測定結果の平均値、又は瞬時値等を低密度データとすることに加えて、当該所定の期間内でより高周期に測定を行い、高密度データを生成し、かかる高密度データにおける最大値、分散値、及び最小値等を特徴量としてもよい。これにより、エッジデバイス2等でより高度な異常度の算出、及び原因分析を行うことができる。
In addition to measuring the temperature, pressure, flow rate, etc. at an arbitrary timing in a predetermined period and making the average value or instantaneous value of the measurement result low-density data, a higher cycle within the predetermined period Measurement may be performed to generate high-density data, and the maximum value, variance value, minimum value, and the like in the high-density data may be used as the feature amount. As a result, a higher degree of abnormality calculation and cause analysis can be performed by the edge device 2 or the like.
エッジデバイス2で、異常度の算出及び原因分析等を行い、監視装置3に異常診断の結果を通知してもよい。この場合、エッジデバイス2から監視装置3に低密度データ及び特徴量データ等の送信が不要であるため、エッジデバイス2と監視装置3との間の通信環境の影響を受け難く、迅速に異常診断の結果を通知することが可能となる。このような構成にすることで、監視装置3側で早期に異常を検知し、適切な対策を講じることができる。
The edge device 2 may calculate the degree of abnormality and analyze the cause, and notify the monitoring device 3 of the result of the abnormality diagnosis. In this case, since it is not necessary to transmit low-density data, feature amount data, or the like from the edge device 2 to the monitoring device 3, it is difficult to be affected by the communication environment between the edge device 2 and the monitoring device 3, and a rapid abnormality diagnosis is performed. It is possible to notify the result of. By adopting such a configuration, an abnormality can be detected early on the monitoring device 3 side and appropriate measures can be taken.
送信するデータ量を低減しつつ、より詳細に監視対象設備を監視することができる監視システム、処理装置、監視装置、監視方法およびプログラムを提供する。
Provided are a monitoring system, a processing device, a monitoring device, a monitoring method, and a program capable of monitoring a monitoring target facility in more detail while reducing the amount of data to be transmitted.
S1 監視システム
1 センサノード
2 エッジデバイス
3 監視装置
10 センサ
100 プラント(監視対象設備)
110 入出力部
120 処理部
130 通信部
210 データ処理部
211 低密度データ取得部
212 高密度データ取得部
213 データ変換部
214 送信部
220 通信部
230 記憶部
310 処理部
320 通信部
330 記憶部
340 表示部
350 入力部 S1 monitoring system 1sensor node 2 edge device 3 monitoring device 10 sensor 100 plant (facility to be monitored)
110 Input /output unit 120 Processing unit 130 Communication unit 210 Data processing unit 211 Low-density data acquisition unit 212 High-density data acquisition unit 213 Data conversion unit 214 Transmission unit 220 Communication unit 230 Storage unit 310 Processing unit 320 Communication unit 330 Storage unit 340 Display Part 350 input part
1 センサノード
2 エッジデバイス
3 監視装置
10 センサ
100 プラント(監視対象設備)
110 入出力部
120 処理部
130 通信部
210 データ処理部
211 低密度データ取得部
212 高密度データ取得部
213 データ変換部
214 送信部
220 通信部
230 記憶部
310 処理部
320 通信部
330 記憶部
340 表示部
350 入力部 S1 monitoring system 1
110 Input /
Claims (6)
- 監視対象設備と通信でインターネットに接続された監視装置によって監視を行う監視システムであって、
前記監視対象設備は、
設備本体と、
前記設備本体から取得された取得データを処理するデータ処理部とを備え、
前記データ処理部は、
前記取得データのうち、低密度データを取得する低密度データ取得部と、
前記取得データのうち、前記低密度データよりも時間当たりのデータ量が大きい高密度データを取得する高密度データ取得部と、
前記高密度データの密度を低密度化した特徴量データに変換するデータ変換部と、
前記低密度データ及び前記特徴量データを含む監視データを送信する送信部とを備え、 前記監視装置は、
前記監視対象設備の前記データ処理部における前記送信部から送信された前記監視データに基づいて監視を行う監視システム。 A monitoring system that performs monitoring by a monitoring device connected to the Internet through communication with a monitoring target facility,
The equipment to be monitored is
The equipment body,
A data processing unit for processing the acquired data acquired from the equipment body,
The data processing unit
Among the acquired data, a low density data acquisition unit that acquires low density data;
Among the acquired data, a high-density data acquisition unit that acquires high-density data having a larger data amount per time than the low-density data;
A data conversion unit that converts the density of the high-density data into feature data with a reduced density;
A transmission unit that transmits monitoring data including the low-density data and the feature amount data, and the monitoring device includes:
The monitoring system which monitors based on the said monitoring data transmitted from the said transmission part in the said data processing part of the said monitoring object installation. - 前記監視装置は、前記監視データに基づいて詳細データを前記監視対象設備に要求し、 前記送信部は、前記監視装置から要求があった場合には、前記高密度データ、前記低密度データまたは前記特徴量データのうち少なくとも1つを含む詳細データを送信する
請求項1に記載の監視システム。 The monitoring device requests detailed data to the monitoring target facility based on the monitoring data, and the transmission unit, when requested by the monitoring device, the high-density data, the low-density data, or the The monitoring system according to claim 1, wherein detailed data including at least one of the feature amount data is transmitted. - 前記監視装置は、前記低密度データまたは前記特徴量データに基づく前記設備本体の異常度が所定の閾値以上である場合に、前記詳細データを前記監視対象設備に要求する
請求項2に記載の監視システム。 The monitoring according to claim 2, wherein the monitoring device requests the detailed data from the monitoring target equipment when an abnormality degree of the equipment main body based on the low density data or the feature amount data is equal to or greater than a predetermined threshold. system. - 前記高密度データは、サンプリング周期が100Hzから1MHzのものである
請求項1から3のいずれか一項に記載の監視システム。 The monitoring system according to any one of claims 1 to 3, wherein the high-density data has a sampling period of 100 Hz to 1 MHz. - 監視対象設備とインターネットで接続された監視装置によって監視を行う監視システムにおける前記監視対象設備が備える処理装置であって、
設備本体から取得された取得データを処理するデータ処理部を備え、
前記データ処理部は、
前記取得データのうち、低密度データを取得する低密度データ取得部と、
前記取得データのうち、前記低密度データよりも時間当たりのデータ量が大きい高密度データを取得する高密度データ取得部と、
前記高密度データの密度を低密度化した特徴量データに変換するデータ変換部と、
前記低密度データ及び前記特徴量データを含む監視データを送信する送信部と、
を備える処理装置。 A processing device provided in the monitoring target facility in a monitoring system that performs monitoring by a monitoring device connected to the monitoring target facility via the Internet,
It has a data processing unit that processes the acquired data acquired from the equipment body,
The data processing unit
Among the acquired data, a low density data acquisition unit that acquires low density data;
Among the acquired data, a high-density data acquisition unit that acquires high-density data having a larger data amount per time than the low-density data;
A data conversion unit that converts the density of the high-density data into feature data with a reduced density;
A transmission unit for transmitting monitoring data including the low density data and the feature amount data;
A processing apparatus comprising: - 監視対象設備とインターネットで接続された監視装置によって監視を行う監視システムにおける前記監視装置であって、
設備本体から取得された取得データのうち低密度データと、前記取得データのうち前記低密度データよりも時間当たりのデータ量が大きい高密度データの密度を低密度化した特徴量データとを含む監視データを受信し、受信した前記監視データに基づいて監視を行う監視装置。 The monitoring device in a monitoring system that performs monitoring by a monitoring device connected to a monitoring target facility via the Internet,
Monitoring including low-density data among the acquired data acquired from the equipment main body and feature data obtained by reducing the density of the high-density data having a larger data amount per time than the low-density data among the acquired data A monitoring device that receives data and performs monitoring based on the received monitoring data.
Priority Applications (1)
| Application Number | Priority Date | Filing Date | Title |
|---|---|---|---|
| US16/495,291 US11178026B2 (en) | 2017-03-24 | 2018-03-23 | Monitoring system, processing device, and monitoring device |
Applications Claiming Priority (2)
| Application Number | Priority Date | Filing Date | Title |
|---|---|---|---|
| JP2017-059450 | 2017-03-24 | ||
| JP2017059450A JP6906993B2 (en) | 2017-03-24 | 2017-03-24 | Monitoring systems, processing equipment, monitoring equipment, monitoring methods and programs |
Publications (1)
| Publication Number | Publication Date |
|---|---|
| WO2018174262A1 true WO2018174262A1 (en) | 2018-09-27 |
Family
ID=63584546
Family Applications (1)
| Application Number | Title | Priority Date | Filing Date |
|---|---|---|---|
| PCT/JP2018/011836 WO2018174262A1 (en) | 2017-03-24 | 2018-03-23 | Monitoring system, processing device, and monitoring device |
Country Status (3)
| Country | Link |
|---|---|
| US (1) | US11178026B2 (en) |
| JP (1) | JP6906993B2 (en) |
| WO (1) | WO2018174262A1 (en) |
Cited By (2)
| Publication number | Priority date | Publication date | Assignee | Title |
|---|---|---|---|---|
| TWI769722B (en) * | 2020-03-31 | 2022-07-01 | 日商Sumco股份有限公司 | State determination device, state determination method and state determination program |
| EP4096232A4 (en) * | 2020-01-20 | 2023-05-17 | Panasonic Intellectual Property Corporation of America | Attack detection method, attack detection system and program |
Families Citing this family (6)
| Publication number | Priority date | Publication date | Assignee | Title |
|---|---|---|---|---|
| JP7219117B2 (en) * | 2019-02-28 | 2023-02-07 | コマツ産機株式会社 | Industrial machine predictive maintenance device, method, and system |
| JP7294905B2 (en) | 2019-06-17 | 2023-06-20 | 矢崎エナジーシステム株式会社 | wireless communication system |
| JP7466314B2 (en) | 2020-01-10 | 2024-04-12 | 三菱電機株式会社 | Remote monitoring device, local monitoring device, remote monitoring system, remote monitoring method and program |
| JP2022139155A (en) * | 2021-03-11 | 2022-09-26 | オムロン株式会社 | Information processing device, method, and program |
| JP2022152555A (en) * | 2021-03-29 | 2022-10-12 | 株式会社日立産機システム | Monitoring system and method |
| US20230254179A1 (en) * | 2022-02-04 | 2023-08-10 | Haier Us Appliance Solutions, Inc. | System and method for storing appliance diagnostics data |
Citations (5)
| Publication number | Priority date | Publication date | Assignee | Title |
|---|---|---|---|---|
| JPH0437277A (en) * | 1990-05-31 | 1992-02-07 | Fujitsu General Ltd | Monitor camera system |
| JPH08205130A (en) * | 1995-01-24 | 1996-08-09 | Matsushita Joho Syst Kk | Image data transmission and reception device |
| JP2001292439A (en) * | 2000-04-06 | 2001-10-19 | Mitsubishi Heavy Ind Ltd | Supervisory system |
| JP2002509268A (en) * | 1997-12-17 | 2002-03-26 | トムソン マルチメディア | Digital image authentication device |
| JP2016208475A (en) * | 2015-04-28 | 2016-12-08 | 河村電器産業株式会社 | Monitor camera system |
Family Cites Families (21)
| Publication number | Priority date | Publication date | Assignee | Title |
|---|---|---|---|---|
| JP2001175326A (en) * | 1999-12-20 | 2001-06-29 | Toshiba Corp | Multi-variable data monitoring device |
| US6957172B2 (en) | 2000-03-09 | 2005-10-18 | Smartsignal Corporation | Complex signal decomposition and modeling |
| US6556956B1 (en) | 2000-06-30 | 2003-04-29 | General Electric Company | Data acquisition unit for remote monitoring system and method for remote monitoring |
| JP2003167623A (en) | 2001-11-30 | 2003-06-13 | Toshiba Corp | Vibration monitoring device, and method, and its program |
| US6937941B2 (en) | 2003-11-20 | 2005-08-30 | Bently Nevada, Llc | Impulse monitoring system: apparatus and method |
| JP4718860B2 (en) * | 2005-02-17 | 2011-07-06 | 株式会社クリプトン | Remote monitoring system and remote monitoring method |
| US7738320B2 (en) * | 2007-12-03 | 2010-06-15 | General Electric Co. | Method and system for enhanced display of temporal data on portable devices |
| JP2009169888A (en) * | 2008-01-21 | 2009-07-30 | Hitachi-Ge Nuclear Energy Ltd | Sensor node, sensor network system and measurement data communicating method |
| JP2010019641A (en) | 2008-07-09 | 2010-01-28 | Fujifilm Corp | Information providing device, method and program, and album producing device, method and program |
| JP5075762B2 (en) * | 2008-08-25 | 2012-11-21 | 日立Geニュークリア・エナジー株式会社 | Sensor node and sensor network system |
| JP5207378B2 (en) * | 2008-12-22 | 2013-06-12 | 日立Geニュークリア・エナジー株式会社 | Sensor network system and sensor node management method |
| JP5610695B2 (en) | 2009-02-17 | 2014-10-22 | 三菱重工業株式会社 | Method, program and apparatus for plant monitoring |
| CN102369491B (en) * | 2009-04-10 | 2014-08-13 | 欧姆龙株式会社 | Operation information output device, method for controlling operation information output device, monitoring device, method for controlling monitoring device, and control program |
| JP2011034320A (en) * | 2009-07-31 | 2011-02-17 | Toshiba Corp | Deterioration diagnostic system and remote maintenance system |
| US20140335505A1 (en) * | 2011-09-25 | 2014-11-13 | Theranos, Inc. | Systems and methods for collecting and transmitting assay results |
| US10282676B2 (en) | 2014-10-06 | 2019-05-07 | Fisher-Rosemount Systems, Inc. | Automatic signal processing-based learning in a process plant |
| US9075415B2 (en) * | 2013-03-11 | 2015-07-07 | Airphrame, Inc. | Unmanned aerial vehicle and methods for controlling same |
| JP6547631B2 (en) * | 2014-01-29 | 2019-07-24 | 日本電気株式会社 | Monitoring device, monitoring system, monitoring method, correction information creating device, correction information creating method, and program |
| JP6339951B2 (en) * | 2015-03-04 | 2018-06-06 | 株式会社日立製作所 | Data collection system, data collection method, server, and gateway |
| JP6718681B2 (en) * | 2016-01-05 | 2020-07-08 | ローム株式会社 | Sensor device, sensor network system, and data compression method |
| JP6374466B2 (en) | 2016-11-11 | 2018-08-15 | ファナック株式会社 | Sensor interface device, measurement information communication system, measurement information communication method, and measurement information communication program |
-
2017
- 2017-03-24 JP JP2017059450A patent/JP6906993B2/en active Active
-
2018
- 2018-03-23 US US16/495,291 patent/US11178026B2/en active Active
- 2018-03-23 WO PCT/JP2018/011836 patent/WO2018174262A1/en active Application Filing
Patent Citations (5)
| Publication number | Priority date | Publication date | Assignee | Title |
|---|---|---|---|---|
| JPH0437277A (en) * | 1990-05-31 | 1992-02-07 | Fujitsu General Ltd | Monitor camera system |
| JPH08205130A (en) * | 1995-01-24 | 1996-08-09 | Matsushita Joho Syst Kk | Image data transmission and reception device |
| JP2002509268A (en) * | 1997-12-17 | 2002-03-26 | トムソン マルチメディア | Digital image authentication device |
| JP2001292439A (en) * | 2000-04-06 | 2001-10-19 | Mitsubishi Heavy Ind Ltd | Supervisory system |
| JP2016208475A (en) * | 2015-04-28 | 2016-12-08 | 河村電器産業株式会社 | Monitor camera system |
Cited By (2)
| Publication number | Priority date | Publication date | Assignee | Title |
|---|---|---|---|---|
| EP4096232A4 (en) * | 2020-01-20 | 2023-05-17 | Panasonic Intellectual Property Corporation of America | Attack detection method, attack detection system and program |
| TWI769722B (en) * | 2020-03-31 | 2022-07-01 | 日商Sumco股份有限公司 | State determination device, state determination method and state determination program |
Also Published As
| Publication number | Publication date |
|---|---|
| JP6906993B2 (en) | 2021-07-21 |
| JP2018164159A (en) | 2018-10-18 |
| US20200099598A1 (en) | 2020-03-26 |
| US11178026B2 (en) | 2021-11-16 |
Similar Documents
| Publication | Publication Date | Title |
|---|---|---|
| WO2018174262A1 (en) | Monitoring system, processing device, and monitoring device | |
| US10268755B2 (en) | Systems and methods for providing dynamic indexer discovery | |
| RU2601148C1 (en) | System and method for detecting anomalies when connecting devices | |
| WO2018207973A1 (en) | System and method for automatic diagnosis of power generation facility | |
| US20180013831A1 (en) | Alerting one or more service providers based on analysis of sensor data | |
| JP2002152862A (en) | Data collection unit for remote supervisory system, and remote supervisory method | |
| CN102902873A (en) | System and method for use in monitoring machines | |
| US10496775B2 (en) | Method and system for use in dynamically configuring data acquisition systems | |
| US10181976B2 (en) | System and method of adjusting data collection frequency | |
| US11009842B2 (en) | Data collection system for wind turbine data | |
| US20140121559A1 (en) | Detecting cognitive impairment indicators | |
| JP2014225080A (en) | Monitoring system, diagnostic apparatus and monitoring terminal thereof | |
| Song et al. | A simulation model based fault diagnosis method for bearings | |
| US20190171644A1 (en) | Efficient event searching | |
| US20230366724A1 (en) | Autonomous discrimination of operation vibration signals | |
| JP6665503B2 (en) | Data collection system, data collection device and data collection method | |
| JP7274438B2 (en) | ASSET INFORMATION MANAGEMENT SYSTEM AND ASSET INFORMATION MANAGEMENT METHOD | |
| CN109213657B (en) | Power grid operation data cloud storage device | |
| CN106416178A (en) | Transport accelerator implementing extended transmission control functionality | |
| KR101997951B1 (en) | IoT Service System and Method for Semantic Information Analysis | |
| JP2011179706A (en) | Data collecting device, air conditioning device, data collecting system, data collecting method and program | |
| CN205581632U (en) | A control management system for internal information of steam power plant | |
| WO2020008247A1 (en) | System and method for health diagnosis and maintenance of industrial units | |
| US20180293510A1 (en) | Flexible and self-adaptive classification of received audio measurements in a network environment | |
| JP6940132B2 (en) | Network devices, sensing systems, data transfer methods, management methods, sensing methods, and programs |
Legal Events
| Date | Code | Title | Description |
|---|---|---|---|
| 121 | Ep: the epo has been informed by wipo that ep was designated in this application |
Ref document number: 18772680 Country of ref document: EP Kind code of ref document: A1 |
|
| NENP | Non-entry into the national phase |
Ref country code: DE |
|
| 122 | Ep: pct application non-entry in european phase |
Ref document number: 18772680 Country of ref document: EP Kind code of ref document: A1 |