WO2018105341A1 - 予測システム及び予測方法 - Google Patents
予測システム及び予測方法 Download PDFInfo
- Publication number
- WO2018105341A1 WO2018105341A1 PCT/JP2017/041168 JP2017041168W WO2018105341A1 WO 2018105341 A1 WO2018105341 A1 WO 2018105341A1 JP 2017041168 W JP2017041168 W JP 2017041168W WO 2018105341 A1 WO2018105341 A1 WO 2018105341A1
- Authority
- WO
- WIPO (PCT)
- Prior art keywords
- data
- curve
- prediction
- module
- value
- Prior art date
- Legal status (The legal status is an assumption and is not a legal conclusion. Google has not performed a legal analysis and makes no representation as to the accuracy of the status listed.)
- Ceased
Links
Images


Classifications
-
- G—PHYSICS
- G06—COMPUTING OR CALCULATING; COUNTING
- G06Q—INFORMATION AND COMMUNICATION TECHNOLOGY [ICT] SPECIALLY ADAPTED FOR ADMINISTRATIVE, COMMERCIAL, FINANCIAL, MANAGERIAL OR SUPERVISORY PURPOSES; SYSTEMS OR METHODS SPECIALLY ADAPTED FOR ADMINISTRATIVE, COMMERCIAL, FINANCIAL, MANAGERIAL OR SUPERVISORY PURPOSES, NOT OTHERWISE PROVIDED FOR
- G06Q30/00—Commerce
- G06Q30/02—Marketing; Price estimation or determination; Fundraising
- G06Q30/0201—Market modelling; Market analysis; Collecting market data
- G06Q30/0202—Market predictions or forecasting for commercial activities
-
- G—PHYSICS
- G06—COMPUTING OR CALCULATING; COUNTING
- G06Q—INFORMATION AND COMMUNICATION TECHNOLOGY [ICT] SPECIALLY ADAPTED FOR ADMINISTRATIVE, COMMERCIAL, FINANCIAL, MANAGERIAL OR SUPERVISORY PURPOSES; SYSTEMS OR METHODS SPECIALLY ADAPTED FOR ADMINISTRATIVE, COMMERCIAL, FINANCIAL, MANAGERIAL OR SUPERVISORY PURPOSES, NOT OTHERWISE PROVIDED FOR
- G06Q10/00—Administration; Management
- G06Q10/04—Forecasting or optimisation specially adapted for administrative or management purposes, e.g. linear programming or "cutting stock problem"
-
- G—PHYSICS
- G06—COMPUTING OR CALCULATING; COUNTING
- G06Q—INFORMATION AND COMMUNICATION TECHNOLOGY [ICT] SPECIALLY ADAPTED FOR ADMINISTRATIVE, COMMERCIAL, FINANCIAL, MANAGERIAL OR SUPERVISORY PURPOSES; SYSTEMS OR METHODS SPECIALLY ADAPTED FOR ADMINISTRATIVE, COMMERCIAL, FINANCIAL, MANAGERIAL OR SUPERVISORY PURPOSES, NOT OTHERWISE PROVIDED FOR
- G06Q10/00—Administration; Management
- G06Q10/06—Resources, workflows, human or project management; Enterprise or organisation planning; Enterprise or organisation modelling
-
- G—PHYSICS
- G06—COMPUTING OR CALCULATING; COUNTING
- G06Q—INFORMATION AND COMMUNICATION TECHNOLOGY [ICT] SPECIALLY ADAPTED FOR ADMINISTRATIVE, COMMERCIAL, FINANCIAL, MANAGERIAL OR SUPERVISORY PURPOSES; SYSTEMS OR METHODS SPECIALLY ADAPTED FOR ADMINISTRATIVE, COMMERCIAL, FINANCIAL, MANAGERIAL OR SUPERVISORY PURPOSES, NOT OTHERWISE PROVIDED FOR
- G06Q50/00—Information and communication technology [ICT] specially adapted for implementation of business processes of specific business sectors, e.g. utilities or tourism
- G06Q50/06—Energy or water supply
-
- H—ELECTRICITY
- H02—GENERATION; CONVERSION OR DISTRIBUTION OF ELECTRIC POWER
- H02J—ELECTRIC POWER NETWORKS; CIRCUIT ARRANGEMENTS OR SYSTEMS FOR SUPPLYING OR DISTRIBUTING ELECTRIC POWER; SYSTEMS FOR STORING ELECTRIC ENERGY
- H02J3/00—Circuit arrangements for AC mains or AC distribution networks
-
- H—ELECTRICITY
- H02—GENERATION; CONVERSION OR DISTRIBUTION OF ELECTRIC POWER
- H02J—ELECTRIC POWER NETWORKS; CIRCUIT ARRANGEMENTS OR SYSTEMS FOR SUPPLYING OR DISTRIBUTING ELECTRIC POWER; SYSTEMS FOR STORING ELECTRIC ENERGY
- H02J3/00—Circuit arrangements for AC mains or AC distribution networks
- H02J3/003—Load forecast, e.g. methods or systems for forecasting future load demand
Definitions
- the present invention relates to a system and method for predicting a predetermined target such as the future supply and demand of power, for example, a prediction that predicts a future power demand and uses this for management of power supply and demand.
- the present invention relates to a system and a method thereof.
- an electric utility must supply electricity to a user based on an electricity supply contract.
- An electric power company can create a necessary amount of electricity by power generation by itself, but if the amount of electricity is likely to be insufficient, it procures electricity from other electric power companies in advance and supplies it to the user.
- the amount of electricity procured exceeds the amount of electricity sold, it will be a burden to the electricity supplier, and the electricity supplier will make sure that the amount of electricity procured and the amount of electricity sold match each other as much as possible at the settlement time.
- the amount of procurement is adjusted. Therefore, it is important to accurately predict the total power demand of the entire user.
- Patent Document 1 selects a power demand pattern according to the environmental conditions of the day on which power demand should be predicted, and obtains the maximum and minimum values of the power demand at the predicted temperature on the forecast date from the power demand data by temperature And the demand prediction model which calculates the electric power demand amount in each unit time of a prediction day using these is disclosed.
- Patent Document 1 Even if the power demand is predicted, an error occurs with respect to the actual power demand.
- Patent Document 1 a power demand pattern corresponding to the environmental condition of the day on which the power demand is to be predicted is selected. In this way, the error was reduced.
- Patent Document 1 is insufficient to eliminate the error in the predicted value of power demand.
- an object of the present invention is to provide a prediction system and a method thereof that can reduce the error of the predicted value as much as possible compared to the conventional one.
- a prediction system that calculates a prediction value related to a prediction target for a prediction target that adapts prediction in an arbitrary period, and is used to calculate a prediction value.
- the control device calculates a prediction value related to the prediction target, and the control device calculates a prediction value.
- a plurality of data used for the storage is read from the storage device, a predetermined calculation model is applied to the plurality of data, a predicted value is calculated, and the calculation model is changed based on time attribute information of each of the plurality of data. I made it.
- FIG. 1 shows a hardware block diagram of the supply / demand management system.
- the supply and demand management system 1 accurately predicts values such as the amount of power demand in the future for a predetermined period based on the past amount of power demand, thereby creating and adjusting the operation plan of the generator, etc. This makes it possible to manage the supply and demand of electric power, such as the formulation and adjustment of electric power procurement transaction plans from electric utilities.
- the supply and demand management system 1 includes a system operator system module 7, a transaction market operator system module 8, a public information provider system module 9, and a customer system module 10, each of which is mainly a terminal device such as a computer, Are connected to each other so that they can communicate with each other.
- the electric power company system module 2 includes a supply and demand manager system module 3, a sales manager system module 4, a transaction manager system module 5, and a facility manager system module 6.
- the demand-and-supply manager system module 3 predicts a demand amount in a predetermined period in the future for every calculation time unit of, for example, 30 minutes based on a sales plan held by the demand-supply manager or a future sales plan.
- the sales manager system module 4 is used by a department or a person in charge who develops a long-term or short-term electricity sales plan, concludes a new electric supply contract with a customer, and manages an existing electric supply contract.
- the system includes a sales management device 40 that manages information on consumers who have concluded a planned sales plan and an electricity supply contract.
- the transaction manager system module 5 is a system used by a department or a person in charge who plans and executes a transaction for procurement of electricity through a direct contract with another electric power company or through an exchange. Yes, it includes a transaction management device 50 for managing information on electricity procurement transaction plans and contracted electricity procurement contracts and exchanging telegrams relating to transactions with other electric utilities and exchanges.
- the facility manager system module 6 is a system used by a department or a person in charge for planning and executing an operation plan for a power generation facility owned by the company or a power generation facility not owned by the company that can be incorporated into the company's own electricity procurement plan.
- a control device 61 for receiving a control signal from the equipment management device 60 and the equipment management device 60 and actually executing control of the power generation equipment.
- the facility management device 60 performs management of power generation facility information, planning of an operation plan of the power generation facility, and transmission of control signals for execution of the operation plan.
- the grid operator system module 7 is a system used by a business operator that manages transmission / distribution system facilities across a wide area and stores measured values obtained by measuring the actual demand of each local customer.
- the system information management apparatus 70 for delivering a demand actual value of a consumer is provided.
- the transaction market operator system module 8 is a system used by a business operator that comprehensively manages information and procedures necessary for conducting a power transaction with respect to a plurality of power business operators. And a market operation management device 80 for performing the process of adding orders received from each electric power company.
- the public information provider system module 9 is a system used by a provider that provides past observation information and future forecast information related to weather such as temperature, humidity, and solar radiation, and distributes weather observation information and forecast information.
- a public information distribution device 90 is provided.
- the customer system module 10 is a system used by individuals or corporations having load facilities and power generation facilities.
- the customer system module 10 includes, in the electric utility system module 2 or the grid operator system module 7, owned equipment, owned facilities, business type, presence, etc. It includes an information input / output terminal 101 for transmitting information that may affect demands such as the number of people, location, etc. and power generation trends, and a measuring device 100 for measuring the actual amount of demand and power generation.
- the supply and demand management system 1 is equipped with a prediction function for predicting the power demand.
- FIG. 2 shows a prediction system 12 according to the present embodiment that constitutes a part of the supply and demand management system 1.
- the prediction system 12 of the present embodiment is a system that predicts power demand, is equipped with a prediction function, and includes a prediction calculation device 30 and a sales management device 40.
- the prediction computation device 30 increases or decreases the demand value over time in an arbitrary future period set in advance based on the attribute performance information 311 and the attribute prediction information 312 and the demand performance information 406 held by the sales management device 40.
- the data indicating the characteristics of the change (hereinafter referred to as a curve indicating a time transition) is calculated, the predicted value is calculated by correcting the calculated curve, and the predicted value is held in the prediction result information 313.
- the prediction result information 313 includes at least information on the predicted value calculated by correcting the curve indicating the time transition of the demand value in the calculated future period and the curve. Then, the prediction calculation device 30 transmits the prediction result information 313 calculated in this way to the facility management device 60 and the transaction management device 50.
- the sales management device 40 holds demand record information 406 and sales contract forecast information 407.
- the demand record information 406 is information composed of the past demand record information 406 of the contracted consumer and the contract target consumer acquired from the measuring device 100 and the grid information management device 70, for example, The actual value of the power demand every 30 minutes in the past several years of each customer system module 10 is included.
- the sales contract forecast information 407 is information created by the sales management device 40 or the sales manager system module 4.
- the sales contract forecast information 407 includes information on existing contracts in units of days, weeks, months, or years over an arbitrary period in the past and future. It includes information on supply start, supply end date and contract power capacity of each customer system module 10 or each customer system module 10 scheduled to be contracted.
- the predictive arithmetic device 30 is composed of an information processing device such as a personal computer, a server computer, or a handheld computer, for example, and a CPU (Central Processing Unit) 301 that is a control device that comprehensively controls the operation of the predictive arithmetic device 30, an input device 302, an output device 303, a communication device 304, and a storage device 305.
- a CPU Central Processing Unit
- the input device 302 is composed of a keyboard, a mouse, or a combination thereof
- the output device 303 is composed of a display, a printer, or a combination thereof.
- the communication device 304 includes a NIC (Network Interface Card) for connecting to a wireless LAN or a wired LAN.
- the storage device 305 includes a RAM (Random Access Memory) and a ROM (Read Only Memory) storage medium.
- the storage device 305 stores various computer programs such as a timeliness index value setting module 306, a reliability index value setting module 307, a representative curve calculation module 308, a correction value calculation module 309, and a representative curve correction module 310.
- the reliability index value setting module 307 evaluates the reliability of various estimation data calculated in the middle of the process in the prediction arithmetic unit 30 such as the fluctuation range of the estimation result, and the reliability corresponding to each of the various estimation data. It is a program having a function of calculating an index value indicating sex.
- the representative curve calculation module 308 calculates a curve indicating the time transition of the prediction target in the future period to be set as the prediction target by using the attribute result information 311, the demand record information 406, the sales contract prediction information 407, or a combination thereof. It is a program having a function to perform.
- the correction value calculation module 309 is calculated by the representative curve calculation module 308 based on the sample data used for prediction of the attribute performance information 311 and the demand performance information 406 and the index value indicating the timeliness calculated by the timelinessiness index value setting module 306. This is a program having a function of calculating a correction value (hereinafter referred to as correction data) for changing the amplitude or frequency of the curve.
- the representative curve correction module 310 uses the correction data calculated by the correction value calculation module 309 and the representative curve calculation module 308 based on the index values indicating the reliability of the correction data calculated by the reliability index value setting module 307. It is a program having a function of changing the amplitude or frequency of the calculated curve.
- the storage device 305 stores a database of attribute result information 311, attribute forecast information 312, and prediction result information 313.
- the attribute result information 311 is a database in which past measurement data of attribute information that can explain the shape of the curve indicating the time transition of the power demand to be predicted and the increase / decrease in the demand scale is stored.
- the attribute result information 311 includes calendar date information, weather information, information indicating the occurrence of a typhoon and a sudden occurrence of an event, or information on industrial dynamics information indicating the actual conditions of various industries that may affect power demand.
- the history information is day type information indicating year, month, day of the week, weekday, holiday, or a combination thereof
- the weather information is temperature, humidity, amount of solar radiation, sunshine duration, atmospheric pressure, wind speed, or a combination thereof.
- the attribute forecast information 312 is a database that stores forecast data in a preset future period for each of the various attribute information stored in the attribute performance information 311.
- the prediction result information 313 is a database in which the final prediction result calculated by the prediction calculation device 30 or intermediate data in the calculation process is stored, and the prediction result data of the prediction target in the preset future period, the prediction target during the same period Curve data representing the time transition of the curve, correction data for correcting the curve, or information of an operation model (hereinafter referred to as a model) which is an operation expression used for calculating these data.
- a model an operation model
- the sales management device 40 is configured by an information processing device such as a personal computer, a server computer, or a handheld computer, for example, and a CPU 401, an input device 402, an output device 403, and a communication device that collectively control the operation of the sales management device 40. 404 and a storage device 405.
- an information processing device such as a personal computer, a server computer, or a handheld computer, for example, and a CPU 401, an input device 402, an output device 403, and a communication device that collectively control the operation of the sales management device 40. 404 and a storage device 405.
- the input device 402 is composed of a keyboard, a mouse, or a combination thereof, and the output device 403 is composed of a display or a printer.
- the communication device 404 includes a NIC for connecting to a wireless LAN or a wired LAN.
- the storage device 405 is composed of RAM and ROM storage media, and stores a database of demand record information 406 and sales contract forecast information 407.
- the demand result information 406 is a database in which information received and acquired from the measuring device 100 and the system information management device 70 is stored, and the past demand of the customer system module 10 that has already been contracted or the customer system module 10 that is scheduled to be contracted. Various information including the result information is stored.
- the granularity of the performance information is, for example, a unit of 30 minutes, and the period is several days to several years.
- the sales contract forecast information 407 is a database that stores information on the schedule and results of the sales plan of electricity created by the sales manager system module 4, and includes days, weeks, months, or years over an arbitrary period in the past and future. It includes information such as the supply start date, supply end date and time, and contract power capacity of each customer system module 10 already contracted or each customer system module 10 scheduled to be contracted.
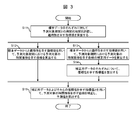
- FIG. 3 shows a processing procedure of prediction processing in the prediction system 12. This process is a process that starts when the prediction arithmetic device 30 accepts an input operation from the supply and demand manager system module 3 and a preset time interval or time, and is executed by the prediction arithmetic device 30 from step S11. The process of step S15 is executed.
- processing is executed based on various computer programs stored in the CPU 301 and the storage device 305 of the prediction arithmetic device 30.
- the processing main body will be described as various computer programs included in the prediction calculation device 30.
- the timeliness index value setting module 306 extracts a sample data set used for prediction from the demand record information 406 and the attribute record information 311. For each sample data in the sample data set, timeliness, which is a measure of the degree of temporal correlation with the prediction target period, is evaluated, and an index value indicating timeliness is calculated (S11).
- the evaluation of temporal correlation between each sample data in the sample data set and the prediction target period is, for example, evaluation of the sample data closer in time to the prediction target period as a strong correlation.
- the index value indicating the timeliness calculated based on this evaluation is calculated as a function of time, for example, as the reciprocal of the number of days from the prediction target period or the elapsed interval. In this case, the larger the index value, the stronger the correlation with the prediction target period.
- the evaluation of the temporal correlation between each sample data in the sample data set and the prediction target period may be an evaluation based on the temporal periodic fluctuation tendency of the prediction target. For example, if the forecast target has a seasonal periodic fluctuation trend, the previous year sample data of the same season as the forecast period is evaluated as a strong correlation, and the index value indicating timeliness is obtained using a trigonometric function on the time axis. Calculated.
- the sample data of the same day as the prediction target period is evaluated as a strong correlation, and the index value indicating the timeliness is the sample data of the same day of the prediction target period as “ Sample data for other days of the week is set to “0”.
- the representative curve calculation module 308 calculates a curve indicating the time transition of the prediction target value using the demand record information 406, the attribute record information 311 and the attribute forecast information 312 (S12).
- the index value indicating the timeliness calculated by the timelinessiness index value setting module 306 is used. Specifically, each sample data is multiplied by an index value indicating timeliness as a weighting factor, and then a curve is calculated. As a result, a curve that gives more importance to sample data having a strong temporal correlation with the prediction target period can be calculated, and a curve closer to the shape of the curve predicted to be observed in the prediction target period can be calculated.
- the correction value calculation module 309 calculates correction data for correcting the curve calculated by the representative curve calculation module 308 using the demand record information 406, the attribute record information 311, and the attribute forecast information 312 ( S13).
- the curve correction specifically means a change in amplitude that is a scale correction on the quantity axis of the curve or a change in frequency that is a scale correction on the time axis of the curve. Therefore, the correction data is a predicted value of a prediction target at an arbitrary time within the prediction target period, a predicted value of a maximum value or a minimum value, or a predicted value of an integrated value in an arbitrary period within the prediction target period.
- an index value indicating the timeliness calculated by the timelinessiness index value setting module 306 is used. Specifically, each sample data is multiplied by an index value indicating timeliness as a weighting factor, and then the prediction value of the prediction target at any time within the prediction target period as the correction data, the prediction target period The predicted value of the maximum value or the minimum value or the predicted value of the integrated value in any given period is calculated.
- the reliability index value setting module 307 calculates the correction data, the predicted value of the prediction target at an arbitrary time within the prediction target period, and the predicted value of the maximum value or the minimum value of the arbitrary period within the prediction target period.
- an index value indicating the reliability is calculated (S14).
- the index value indicating the reliability is, for example, a confidence interval or a prediction interval of each correction data.
- the representative curve correction module 310 uses the curve indicating the time transition of the prediction target in the prediction target period calculated by the representative curve calculation module 308 and the correction data of the curve calculated by the correction value calculation module 309 to use the curve amplitude. The frequency or both are changed, and the correction result is stored in the prediction result information 313 as a prediction value (S15).
- an index value indicating the reliability for each correction data calculated by the reliability index value setting module 307 is used. Specifically, the correction value of the curve is controlled by using an index value indicating reliability as a weighting coefficient at the time of correction.
- FIG. 4 shows a first embodiment of the representative curve calculation module 308 in the prediction system 12.
- the representative curve calculation module 308 includes a time unit clustering module 308A1 and a time unit profiling processing module 308A2.
- the representative curve calculation module 308 in the present embodiment uses the demand record information 406, the attribute record information 311 and the attribute forecast information 312 as input value samples, which are demand value data, as a prediction target in a future period set as a preset prediction target.
- a curve 308B indicating the time transition of is calculated.
- the time unit clustering module 308A1 classifies the sample data extracted from the demand record information 406 based on the feature quantity indicating the periodic variation of the prediction target.
- the time unit clustering module 308A1 divides the sample data extracted from the demand performance information 406 at a preset time granularity, and sets a new second sample value (hereinafter referred to as second sample data) (first sample data). 2 sample data sets).
- a feature amount indicating a periodic feature is calculated by using frequency analysis of Fourier transform or wavelet transform for each of the divided sample data. Then, clustering processing is performed on the calculated feature amount, and for example, sample data having similar waveform shapes in units of 24 hours are classified as clusters (hereinafter referred to as time clusters).
- a known method may be applied to the algorithm used for the clustering process using such a cluster.
- Known techniques include k-means, EM algorithm, and spectral clustering, which are unsupervised clustering algorithms for neighborhood optimization.
- unsupervised SVM Small Vector Vector
- VQ algorithm VQ algorithm
- SOM Self-Organizing Map
- each sample data is normalized such that the average is 0 and the standard deviation is 1, for example.
- the standard deviation is 1, for example.
- Time unit profiling module 308A2 specifies a common attribute and calculates a value range for each time cluster calculated by the time unit clustering module 308A1. By doing so, a discriminator for identifying each time cluster is identified.
- a supervised learning algorithm using a sample data set in which each of the attribute information stored in the teacher label and the attribute performance information 311 is a predictor is used as a number and a name identifier for identifying each time cluster. Identify the discriminator that is most compatible with the sample data set.
- the indices for measuring the adaptability are index values indicating the degree of identification of the sample data set such as entropy and Gini coefficient, and test errors at the time of cross-validation performed in the process of classifier identification.
- the discriminator is one of the elements constituting the calculation model for calculating the curve indicating the temporal transition of the prediction target.
- an index value indicating the timeliness for each sample data calculated by the timelinessiness index value setting module 306 is used as a weighting coefficient.
- a discriminator reflecting a change (hereinafter referred to as a secular change) every time a year to be predicted is reflected can be calculated.
- the structure of the discriminator which is a model for calculating a curve indicating the temporal transition of the prediction target, can be changed according to the index value indicating timeliness.
- the time cluster predicted to belong to the curve indicating the time transition of the prediction target in the prediction target period is identified.
- a method of calculating a curve indicating a temporal transition of a prediction target from an identified time cluster is a method of calculating as an arithmetic average of sample data groups belonging to the identified time cluster, for example.
- the weighted average is calculated using the all-time cluster affiliation probability calculated from the classifier as a weighting coefficient. Note that the processing part in which the curve indicating the time transition of the prediction target is calculated from the identified time cluster is one of the other elements constituting the calculation model for calculating the curve indicating the time transition of the prediction target.
- a known method may be applied to the classifier calculation algorithm.
- Known techniques include CART, ID3, random forest decision tree learning algorithm and SVM (Support Vector Vector Machine) discrimination plane learning algorithm.
- Timeliness index value setting module 306 is a measure of the degree of temporal correlation between each sample data in the sample data set and the prediction target period for each sample data in the sample data set. Is evaluated, and an index value indicating timeliness is calculated.
- a sample data set used for prediction is extracted from the demand record information 406 and the attribute record information 311.
- timeliness which is a measure of the degree of temporal correlation with the prediction target period, is evaluated, and an index value indicating timeliness is calculated.
- the index value indicating timeliness calculated based on this evaluation is calculated as a function of time, and may be calculated as, for example, the number of days from the prediction target period or the reciprocal of the elapsed interval. In this case, the larger the index value, the stronger the correlation with the prediction target period.
- the evaluation of the temporal correlation with the prediction target period may be an evaluation based on the temporal periodic fluctuation tendency of the prediction target. For example, if the forecast target has a seasonal periodic fluctuation trend, the sample data of the previous year in the same period as the forecast period is evaluated as a strong correlation, and the index value indicating timeliness is obtained using a trigonometric function on the time axis. Calculated.
- the sample data of the same day as the forecast target period is evaluated as a strong correlation, and the index value indicating the timeliness is that the sample data of the same day of the forecast target period is “ Sample data for other days of the week are set to “0”.
- the index value indicating the timeliness calculated by the timelinessiness index value setting module 306 is used as a weighting factor in the discriminator calculation process in the time unit profiling processing module 308A2, as described above. In addition to this, it is also used in the calculation in the correction value calculation module 309. In both cases, the effect obtained is the same, and it is possible to perform learning processing with emphasis on sample data that has a strong temporal correlation with the prediction target period, so the calculated data shows the secular change of the prediction target. More accurate data reflected.
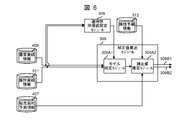
- FIG. 6 shows a first embodiment of the correction value calculation module 309 in the prediction system 12.
- the correction value calculation module 309 includes a model identification module 309A1 and a correction value estimation module 309A2.
- the correction value calculation module 309 in the present embodiment calculates correction data for correcting the curve calculated by the representative curve calculation module 308, using the demand record information 406, the attribute record information 311, and the attribute forecast information 312. .
- the curve correction specifically means a change in amplitude that is a scale correction on the quantity axis of the curve or a change in frequency that is a scale correction on the time axis of the curve. Therefore, the correction data is a predicted value of a prediction target at an arbitrary time within the prediction target period, a predicted value of a maximum value or a minimum value, or a predicted value of an integrated value in an arbitrary period within the prediction target period. These predicted values are used as correction reference points.
- model identification module 309A1 uses the demand record information 406 and the attribute record information 311, and the prediction value of the prediction target at an arbitrary time within the prediction target period, which is correction data, A model to be used for calculation of calculation of a predicted value of a maximum value or a minimum value or a predicted value of an integrated value in an arbitrary period within a prediction target period is identified.
- the prediction value of the prediction target at an arbitrary time within the prediction target period which is the correction data, the maximum or minimum predicted value or the predicted value of the integrated value at an arbitrary period within the prediction target period,
- the explanatory variable is x, it is assumed that the following relationship holds between y and x.
- x1 and x2 are, for example, the average temperature and the actual value of y on the previous day, and specific numerical values are stored in the attribute actual information 311.
- the model identification module identifies the operation model by estimating the coefficients a, b, c, and d described in the equation (1) so that the compatibility between x and y is the highest.
- the coefficient is estimated by, for example, the least square method.
- the index for measuring the adaptability is the residual sum of squares of the identified model and sample data. The highest adaptability means that the residual sum of squares is the smallest.
- an index value indicating the timeliness for each sample data calculated by the timelinessiness index value setting module 306 is used.
- coefficients a, b, c, and d are estimated by a weighted least square method using an index value indicating timeliness as a weight coefficient, and calculated as a model identification result used for calculation of correction data. Is done. Thereby, more accurate correction data reflecting the secular change of y can be calculated.
- the correction value estimation module 309A2 is an explanatory variable x stored in the attribute forecast information 312 in a model used for calculation of correction data calculated by the model identification module 309A1. Is input as the correction data, the correction value of the curve indicating the time transition in the prediction target period is calculated.
- the correction data includes at least two types of information: information on the correction value itself (correction data 309B1) and information on the time range of each correction value (correction data 309B2).
- the information regarding the time range of each correction value is a time range in which each value appears when, for example, the maximum value or the minimum value in an arbitrary period within the prediction target period is used as the correction data.
- the correction value estimation module 309A2 calculates the sample error data at the time of calculation of the least square method as a part of the correction data.
- This data is data used when the reliability index value setting module 307 calculates an index value indicating reliability. Further, this data is the result of the least squares calculation performed to identify the model used for calculation of correction data calculated by the model identification module 309A1 or the model used by the model identification module 309A1 for calculation of correction data. It is data of.
- the correction data 309B1 calculated by the correction value estimation module 309A2 is once divided by the current total contract power capacity to calculate the basic unit correction value per contract power capacity.
- the basic unit correction value is multiplied by the total contract power capacity in the prediction target period, and correction data 309B1 is newly calculated. Thereby, even when the number of contract customers increases or decreases, more accurate curve correction data can be calculated.
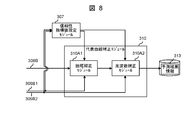
- FIG. 8 shows a first embodiment of the representative curve correction module 310 in the prediction system 12.
- the representative curve correction module 310 includes an amplitude correction module 310A1 and a frequency correction module 310A2.
- the representative curve correction module 310 in the present embodiment changes the amplitude or frequency of the curve calculated by the representative curve calculation module 308 using the correction data calculated by the correction value calculation module 309. At this time, an index value indicating the reliability of each correction data calculated by the reliability index value setting module 307 is used, whereby a more accurate predicted value is calculated.
- the amplitude correction module 310A1 uses the correction data 309B1 calculated by the correction value calculation module 309 to calculate the prediction target time in the prediction target period calculated by the representative curve calculation module 308.
- the amplitude of the curve 308B indicating the transition is changed.
- the corrected curve f ⁇ (t) is given by the following equation.
- f (t) is a curve indicating the time transition of the prediction target in the prediction target period, and is a function of time t.
- ⁇ and ⁇ are change coefficients of the curve f (t).
- the amplitude correction module 310A1 predicts the prediction value of the prediction target at any time within the prediction target period, which is the correction data 309B1, the prediction value of the maximum value or the minimum value or the integrated value at any time within the prediction target period. Processing for estimating the change coefficients ⁇ and ⁇ is performed so that the residual sum of squares of each value and the corrected curve f ⁇ (t) is minimized.
- an index value indicating the reliability for each correction data calculated by the reliability index value setting module 307 is used. Specifically, the index value indicating the quantitative reliability for each correction data is multiplied as a weighting coefficient for each correction data value and the residual of the curve f ⁇ (t), and then changed. The coefficients ⁇ and ⁇ are estimated.
- a curve is given with priority given to reducing the residual between the correction data calculated by the reliability index value setting module 307 and the correction data value having higher reliability than the correction data having low reliability.
- f (t) is corrected, which improves the final prediction accuracy.
- the frequency correction module 310A2 uses the correction data 309B2 calculated by the correction value calculation module 309, and the time transition of the prediction target in the prediction target period calculated by the representative curve calculation module 308 The frequency of the curve 308B showing is changed.
- the correction data is a predicted value of the maximum value or the minimum value in an arbitrary period within the prediction target period
- the average value or mode value of each appearance time range stored in the correction data 309B2 and
- the frequency of the curve f (t) is changed so that the time of the corrected curve f ⁇ (t) coincides with the time or the residual sum of squares is minimized.
- the corrected curve f ⁇ (t) is calculated as the prediction value of the prediction target in the prediction target period and stored in the prediction result information 313.
- an index value indicating the reliability for each correction data calculated by the reliability index value setting module 307 is used. Specifically, an index value indicating temporal reliability for each correction data is multiplied as a weighting factor for the residual between each correction data value and the curve f ⁇ (t), and then corrected. Processing is performed. Accordingly, a curve is given with priority given to reducing the residual between the correction data calculated by the reliability index value setting module 307 and the correction data value having higher reliability than the correction data having low reliability. f (t) is corrected, and the final prediction accuracy is improved at this point.
- the reliability index value setting module 307 is a prediction value of the prediction target at an arbitrary time within the prediction target period, which is the calculated correction data, and an arbitrary value within the prediction target period. For each of the predicted value of the maximum value, the minimum value, or the predicted value of the integrated value in this period, two types of reliability, quantitative and temporal, are evaluated, and an index value indicating the reliability is calculated.
- each correction is performed from the model error data included in the correction data 309B1 calculated by the correction value estimation module 309A2 or the sample error data calculated in the process of model identification.
- the confidence interval and prediction interval of the estimated value of the data for use, the variance of the sample error, and the standard deviation are calculated and calculated as an index value indicating quantitative reliability.
- the confidence interval or the prediction interval on the time axis of each correction data or The variance and standard deviation of the information in the time range are calculated and calculated as an index value indicating temporal reliability.
- the representative curve correction module 310 uses the index values indicating the reliability, the prediction accuracy of the finally calculated prediction value can be improved.
- the operation plan of the power generation facility that can be operated by the facility management device 60 is calculated and transmitted to the control device 61.
- the control device 61 that has received the operation plan calculates a specific control value of the power generation facility and executes actual control.
- the transaction management device 50 creates a transaction plan related to the buying and selling of electric power with other electric power companies and the transaction market, and transmits a trade order or an order cancellation message to the market operation management device 80.
- the timeliness index value setting module 306 calculates the calculation result of the curve indicating the time transition of the prediction target in the prediction target period output from the representative curve calculation module 308. It differs depending on whether or not an index value indicating the timeliness of each sample data to be used is used.
- the graph 501 in FIG. 11 shows the transition of the average temperature for each day in a certain year.
- the two time clusters shown in the graph 502 and the graph 503 in FIG. 11 are candidate time clusters to be identified.
- the curve indicating the time transition of the prediction target has changed from the curve shown in the graph 502 to the curve shown in the graph 503 after one year.
- the index value indicating the timeliness of each sample data is not used in the above-described classifier calculation process.
- the time clusters in the graph 502 and the graph 503 in FIG. 11 are identified with almost the same probability. Therefore, the curve indicating the time transition of the prediction target in the prediction target period is calculated as an average curve of both time clusters as shown in the graph 504 in FIG. 11, and the secular change of the curve cannot be captured.
- the index value indicating the timeliness of each sample data is also used in the correction value calculation module 309, and the effect and principle are the same as those described above.
- FIG. 12 also shows a correction that is a final prediction result calculated by the representative curve correction module 310 when an index value indicating the reliability of the curve correction data calculated by the reliability index value setting module 307 is used. The effect on the later curve is shown.
- the index value indicating the reliability of the curve correction data calculated by the reliability index value setting module 307 includes an index value indicating at least two types of reliability, that is, quantitative reliability and temporal reliability. To do.
- the graph 601 in FIG. 12 conceptually shows quantitative reliability.
- the minimum value in the early morning, the maximum value after noon, and the maximum value around the evening are used as the correction data for the curve.
- the index values indicating the respective reliability are defined as variances on the probability density functions shown in the graphs 602, 603, and 604 of FIG.
- the index value is expressed by binary values of high and low.
- the reliability of the minimum value in the early morning and the maximum value around the evening is high, and the reliability of the maximum value after noon is low. Therefore, the change in the amplitude of the curve, as shown in the graph 609 of FIG. 12, allows the residual on the quantity axis of the curve and the maximum value after noon to expand, and then increases the minimum value of the curve and the early morning. Correction is performed so as to minimize the residual on the quantity axis and the residual on the quantity axis of the curve and the maximum value before and after evening.
- the graph 605 in FIG. 12 conceptually shows temporal reliability.
- the minimum value in the early morning, the maximum value after noon, and the maximum value in the evening are used as the correction data for the curve.
- the index values indicating the respective reliability are defined as ranges of past observed values shown in the graph 606, the graph 607, and the graph 608 of FIG.
- the index value is expressed by binary values of high and low.
- the reliability of the minimum value in the early morning and the maximum value after noon is high, and the reliability of the maximum value in the evening is low. Therefore, the change in the amplitude of the curve allows the residual of the curve and the maximum value before and after evening to expand on the time axis as shown in the graph 610 of FIG. Correction is performed so as to minimize the residual on the time axis and the residual on the time axis of the curve and the maximum value after noon.
- the corrected curve that is the final predicted value can be made more likely.
- the prediction target data stored in the demand record information 406 is one data measured by one measuring instrument or a plurality of measuring instruments.
- the present invention is not limited to this.
- prediction target data is installed for each power consumer. Further, more accurate prediction may be realized as each measurement data of the measuring device.
- the representative curve calculation module 308 further includes a metric unit clustering module 308A3.
- the weighing unit clustering module 308A3 extracts the data for each measuring instrument stored in the demand record information 406 as, for example, the same period for the past 365 days, and uses the meter data for each consumer as input sample data.
- measuring instrument clusters For example, sample data having similar waveform shapes in units of 365 days (8760 hours) are classified as clusters (hereinafter referred to as measuring instrument clusters).
- the time clustering process and the time unit profiling process similar to those of the first embodiment of the representative curve calculation module 308 described above are performed on the representative waveform of each measuring instrument cluster.
- the calculation method of the representative waveform of each measuring instrument cluster is, for example, the arithmetic average of each measuring instrument cluster.
- the sample variance in the sample data can be reduced, and the prediction target calculated by the subsequent processing
- the accuracy of the curve indicating the time transition of the prediction target in the period can be improved.
- a curve indicating the temporal transition of the prediction target in the prediction target period is represented by the prediction target period. Curve so that the predicted value of the prediction target at any time in the range, the maximum value, the minimum value, or the predicted value of the integrated value in any period within the prediction target period is the same or the sum of the respective residuals is minimized.
- the present invention is not limited to this.
- the change coefficients ⁇ and ⁇ shown in equation (2) are handled as correction data, and the change coefficients are directly used as correction data. You may make it handle.
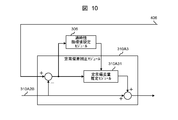
- the correction value calculation module 309 further includes a correction coefficient calculation module 309A3 as shown in FIG. 7, and directly predicts the correction coefficient of the curve.
- the correction coefficient calculation module 309A3 calculates sample data of the change coefficients ⁇ and ⁇ using the sample data extracted from the demand record information 406.
- the model identification module 309A1 identifies a model used for calculation of the change coefficients ⁇ and ⁇ , and the explanatory variable value extracted from the attribute forecast information 312 to the identified model.
- the correction value estimation module 309A2 input by the correction value estimation module 309A2, and the change coefficients ⁇ and ⁇ of the curve indicating the time transition of the prediction target in the prediction target period are calculated.
- the index value indicating the timeliness calculated by the timelinessiness index value setting module 306 is used as described with reference to FIG. .
- the present invention is not limited to this, and, for example, arbitrary calculation forms and explanatory variables to be used are used.
- the explanatory variable may be, for example, a square value of the average temperature, and may be used as a planning matrix including these variables.
- a non-linear relationship existing between the prediction target and the attribute can be expressed as a model.
- the third sample value is calculated from the second sample value in the same manner as the second sample value is calculated from the sample value.
- the case where the attribute used as the explanatory variable is set uniquely in advance has been described.
- a method in which explanatory variables are automatically selected such as an elastic net, may be employed.
- a method of calculating a new component from explanatory variables of principal component regression or partial least squares may be employed, or a method of using a nonlinear model of a neural network may be employed.
- the index value indicating the timeliness calculated by the timelinessiness index value setting module 306 may be used at the time of model identification, and thereby the same effect as described with reference to FIG. As well as an explanatory variable corresponding to timeliness can be automatically selected. In other words, this can change the model used for the calculation of the correction data.
- the prediction value of the prediction target at any time within the prediction target period which is correction data, the maximum value in any period within the prediction target period
- the present invention is not limited to this, for example, reliability index value setting It may be automatically set based on an index value indicating the reliability calculated by the module 307.
- the reliability index values for the respective correction data may be compared, and the correction data up to a preset order in descending order of reliability may be used in the subsequent representative curve correction module 310.
- standardize the index value indicating the reliability of each correction data so that the index value indicating the highest reliability is “1” and the index value indicating the lowest reliability is “0”. These correction data may be used in the representative curve correction module 310 thereafter.
- the correction data whose index value is “0” is not used for the curve correction as a result, and therefore automatic selection of the correction data is achieved. Further, correction may be made based on an extreme difference between the index values indicating the reliability with the power of the index value of each correction data as a new index value. In this case, since the smallest index value is relatively equal to “0” with respect to the largest index value, as in the case where the above-described index value is “0”, as a result, the smallest index value is used for curve correction. The value is not practically used, so automatic selection of correction data is achieved.
- the corrected curve calculated through the amplitude correction module 310A1 and the frequency correction module 310A2 is output as the final predicted value.
- the correction module 310A3 corrects the above-described steady deviation by using the corrected curve and the demand record information 406 observed later, and stores it in the prediction result information 313 as a final predicted value.
- the representative curve correction module 310 corrects errors that occur constantly in advance.
- the representative curve correction module 310 further includes a steady deviation correction module 310A3.
- the steady deviation correction module 310A3 calculates a deviation which is a difference between the corrected curve 310A2B and the demand record information 406 observed afterwards.
- the steady deviation amount estimation module 310A31 identifies a model that explains the residual, and calculates an estimated value of the residual that can occur in the prediction target period by the identified model.
- the final estimated value is calculated by adding the estimated value of the calculated residual to the corrected curve 310A2B.
- the algorithm used in the steady deviation estimation module 310A31 may be, for example, the algorithm of the representative curve calculation module 308 described with reference to FIG. That is, the input actual demand information 406 is replaced with a deviation which is a difference between the corrected curve 310A2B and the actual demand information 406 observed afterwards.
- This algorithm calculates a residual curve that may occur in the prediction target period through the same processing as the time unit clustering processing module 308A1 and the time unit profiling processing module 308A2.
- the output residual curve becomes the estimated residual itself including quantity information.
- a residual curve that may occur in the prediction target period may be calculated using a time series analysis technique represented by an AR model or an ARIMA model.
- the steady-state deviation correction module 310A3 can correct minute fluctuations in the prediction target that cannot be explained in the prediction system.
- an index value indicating the timeliness calculated by the timelinessiness index value setting module 306 may be used when the model is identified by the steady deviation amount estimation module 310A31.
- the input to the timeliness index value setting module 306 here is the above residual.
- the index values indicating timeliness and reliability are calculated by the timeliness index value setting module 306 and the reliability index value setting module 307, respectively.
- the present invention is not limited to this, and for example, preset values may be directly used for each of the index values of timeliness and reliability.
- the time-series data observed with time transition includes, for example, the amount of power generated by solar power generation and wind power generation, the contract price of electric power products sold and sold at the power exchange, and the volume.
Landscapes
- Business, Economics & Management (AREA)
- Engineering & Computer Science (AREA)
- Strategic Management (AREA)
- Economics (AREA)
- Human Resources & Organizations (AREA)
- Development Economics (AREA)
- General Physics & Mathematics (AREA)
- General Business, Economics & Management (AREA)
- Marketing (AREA)
- Entrepreneurship & Innovation (AREA)
- Theoretical Computer Science (AREA)
- Physics & Mathematics (AREA)
- Tourism & Hospitality (AREA)
- Game Theory and Decision Science (AREA)
- Health & Medical Sciences (AREA)
- Finance (AREA)
- Accounting & Taxation (AREA)
- Operations Research (AREA)
- Quality & Reliability (AREA)
- General Health & Medical Sciences (AREA)
- Primary Health Care (AREA)
- Public Health (AREA)
- Water Supply & Treatment (AREA)
- Power Engineering (AREA)
- Data Mining & Analysis (AREA)
- Educational Administration (AREA)
- Management, Administration, Business Operations System, And Electronic Commerce (AREA)
- Supply And Distribution Of Alternating Current (AREA)
Priority Applications (2)
| Application Number | Priority Date | Filing Date | Title |
|---|---|---|---|
| EP17877683.7A EP3550499A4 (en) | 2016-12-05 | 2017-11-15 | PREDICTION SYSTEM AND PREDICTION PROCEDURE |
| US16/332,054 US11107094B2 (en) | 2016-12-05 | 2017-11-15 | Prediction system and prediction method |
Applications Claiming Priority (2)
| Application Number | Priority Date | Filing Date | Title |
|---|---|---|---|
| JP2016-236189 | 2016-12-05 | ||
| JP2016236189A JP6735219B2 (ja) | 2016-12-05 | 2016-12-05 | 予測システム及び予測方法 |
Publications (1)
| Publication Number | Publication Date |
|---|---|
| WO2018105341A1 true WO2018105341A1 (ja) | 2018-06-14 |
Family
ID=62490894
Family Applications (1)
| Application Number | Title | Priority Date | Filing Date |
|---|---|---|---|
| PCT/JP2017/041168 Ceased WO2018105341A1 (ja) | 2016-12-05 | 2017-11-15 | 予測システム及び予測方法 |
Country Status (4)
| Country | Link |
|---|---|
| US (1) | US11107094B2 (https=) |
| EP (1) | EP3550499A4 (https=) |
| JP (1) | JP6735219B2 (https=) |
| WO (1) | WO2018105341A1 (https=) |
Families Citing this family (14)
| Publication number | Priority date | Publication date | Assignee | Title |
|---|---|---|---|---|
| JP6735219B2 (ja) | 2016-12-05 | 2020-08-05 | 株式会社日立製作所 | 予測システム及び予測方法 |
| US11137926B1 (en) * | 2018-03-30 | 2021-10-05 | Veritas Technologies Llc | Systems and methods for automatic storage tiering |
| US11080726B2 (en) * | 2018-08-30 | 2021-08-03 | Oracle International Corporation | Optimization of demand forecast parameters |
| US11727335B2 (en) * | 2019-01-11 | 2023-08-15 | Johnson Controls Tyco IP Holdings LLP | Systems and methods for managing energy usage intensity of buildings |
| JP7157683B2 (ja) * | 2019-03-12 | 2022-10-20 | 株式会社東芝 | 情報処理装置、情報処理方法及びコンピュータプログラム |
| CN111179111B (zh) * | 2019-12-06 | 2023-11-14 | 国网辽宁省电力有限公司经济技术研究院 | 基于基尼系数公平性的火电机组年度电量计划制定方法 |
| JP7474623B2 (ja) * | 2020-03-27 | 2024-04-25 | 本田技研工業株式会社 | 電力算出装置 |
| CN112381669B (zh) * | 2020-11-20 | 2023-01-24 | 广东电网有限责任公司电力科学研究院 | 一种台风下配网系统的安全预警方法及装置 |
| JP7595476B2 (ja) * | 2021-02-04 | 2024-12-06 | 三菱重工業株式会社 | 電力需要予測装置、及び電力需要予測方法 |
| CN114066079B (zh) * | 2021-11-22 | 2022-11-25 | 北京白龙马云行科技有限公司 | 一种基于多租户的网约车供需差预测方法及装置 |
| CN114757722B (zh) * | 2022-06-09 | 2023-11-14 | 荣耀终端有限公司 | 一种电子设备的销量预测方法和装置 |
| CN117371339B (zh) * | 2023-12-08 | 2024-03-26 | 西电济南变压器股份有限公司 | 基于物联网的变压器运行监测系统 |
| CN118432092B (zh) * | 2024-07-05 | 2024-10-25 | 山东和信新能源技术有限公司 | 新能源电网储能设备能量响应时效性指数预测方法及系统 |
| CN120049401B (zh) * | 2024-12-19 | 2026-02-06 | 国兴能(杭州)能源科技有限公司 | 一种储能系统负荷预测方法 |
Citations (4)
| Publication number | Priority date | Publication date | Assignee | Title |
|---|---|---|---|---|
| JP2007199862A (ja) * | 2006-01-24 | 2007-08-09 | Nippon Telegr & Teleph Corp <Ntt> | エネルギー需要予測方法、予測装置、プログラム、および記録媒体 |
| JP2014180187A (ja) * | 2013-03-15 | 2014-09-25 | Toshiba Corp | 電力需要予測装置、方法及びプログラム並びに需要抑制計画策定装置 |
| JP2015090691A (ja) * | 2013-11-07 | 2015-05-11 | 株式会社エヌ・ティ・ティ・データ | 予測装置、予測方法、及びプログラム |
| WO2016088370A1 (ja) * | 2014-12-05 | 2016-06-09 | 日本電気株式会社 | 情報処理装置、モデル構築方法及びプログラム記録媒体 |
Family Cites Families (19)
| Publication number | Priority date | Publication date | Assignee | Title |
|---|---|---|---|---|
| EP0731397B1 (en) * | 1994-09-26 | 2001-05-16 | Kabushiki Kaisha Toshiba | Method and system for optimizing plant utility |
| US6032123A (en) * | 1997-05-12 | 2000-02-29 | Jameson; Joel | Method and apparatus for allocating, costing, and pricing organizational resources |
| US7343311B2 (en) * | 2002-03-01 | 2008-03-11 | I2 Technologies Us, Inc. | Generating an optimized supplier allocation plan |
| US7072723B2 (en) * | 2002-10-23 | 2006-07-04 | Clearsight Systems Inc. | Method and system for optimization of general problems |
| JP5029822B2 (ja) * | 2007-07-31 | 2012-09-19 | 東芝ライテック株式会社 | 光源および照明装置 |
| US9137815B2 (en) * | 2009-06-17 | 2015-09-15 | Qualcomm Incorporated | Multi-user multiple input multiple output wireless communications |
| JP5618501B2 (ja) * | 2009-07-14 | 2014-11-05 | 株式会社東芝 | 需要予測装置、プログラムおよび記録媒体 |
| US8880202B2 (en) * | 2010-07-09 | 2014-11-04 | Emerson Process Management Power & Water Solutions, Inc. | Optimization system using an iteratively coupled expert engine |
| US8370283B2 (en) * | 2010-12-15 | 2013-02-05 | Scienergy, Inc. | Predicting energy consumption |
| WO2013095624A1 (en) * | 2011-12-23 | 2013-06-27 | Hewlett-Packard Development Company, L.P. | Generating a capacity schedule for a facility |
| US20170017215A1 (en) * | 2013-12-10 | 2017-01-19 | Panasonic Intellectual Property Management Co., Ltd. | Demand prediction system and program |
| JP6334177B2 (ja) * | 2014-01-16 | 2018-05-30 | 株式会社東芝 | 運転計画作成装置、制御装置、運転計画作成方法、およびプログラム |
| US20170300819A1 (en) * | 2014-10-21 | 2017-10-19 | Hitachi, Ltd. | Time-Series Prediction Apparatus and Time-Series Prediction Method |
| CN104573879B (zh) * | 2015-01-30 | 2017-07-25 | 河海大学 | 基于最优相似日集的光伏电站出力预测方法 |
| JP6408451B2 (ja) | 2015-05-21 | 2018-10-17 | 株式会社日立製作所 | エネルギー需要予測システム及びエネルギー需要予測方法 |
| JP6720562B2 (ja) * | 2016-02-10 | 2020-07-08 | 富士電機株式会社 | 制御装置、制御システム、制御プログラム、及び制御方法 |
| JP7319757B2 (ja) | 2016-12-05 | 2023-08-02 | 株式会社日立製作所 | データ処理システム及びデータ処理方法 |
| JP6735219B2 (ja) | 2016-12-05 | 2020-08-05 | 株式会社日立製作所 | 予測システム及び予測方法 |
| JP6831280B2 (ja) | 2017-03-24 | 2021-02-17 | 株式会社日立製作所 | 予測システム、及び、予測方法 |
-
2016
- 2016-12-05 JP JP2016236189A patent/JP6735219B2/ja active Active
-
2017
- 2017-11-15 US US16/332,054 patent/US11107094B2/en active Active
- 2017-11-15 EP EP17877683.7A patent/EP3550499A4/en not_active Withdrawn
- 2017-11-15 WO PCT/JP2017/041168 patent/WO2018105341A1/ja not_active Ceased
Patent Citations (4)
| Publication number | Priority date | Publication date | Assignee | Title |
|---|---|---|---|---|
| JP2007199862A (ja) * | 2006-01-24 | 2007-08-09 | Nippon Telegr & Teleph Corp <Ntt> | エネルギー需要予測方法、予測装置、プログラム、および記録媒体 |
| JP2014180187A (ja) * | 2013-03-15 | 2014-09-25 | Toshiba Corp | 電力需要予測装置、方法及びプログラム並びに需要抑制計画策定装置 |
| JP2015090691A (ja) * | 2013-11-07 | 2015-05-11 | 株式会社エヌ・ティ・ティ・データ | 予測装置、予測方法、及びプログラム |
| WO2016088370A1 (ja) * | 2014-12-05 | 2016-06-09 | 日本電気株式会社 | 情報処理装置、モデル構築方法及びプログラム記録媒体 |
Non-Patent Citations (1)
| Title |
|---|
| See also references of EP3550499A4 * |
Also Published As
| Publication number | Publication date |
|---|---|
| JP6735219B2 (ja) | 2020-08-05 |
| US11107094B2 (en) | 2021-08-31 |
| EP3550499A4 (en) | 2020-05-27 |
| JP2018092445A (ja) | 2018-06-14 |
| US20190370832A1 (en) | 2019-12-05 |
| EP3550499A1 (en) | 2019-10-09 |
Similar Documents
| Publication | Publication Date | Title |
|---|---|---|
| JP6735219B2 (ja) | 予測システム及び予測方法 | |
| JP6837949B2 (ja) | 予測システム及び方法 | |
| JP7319757B2 (ja) | データ処理システム及びデータ処理方法 | |
| JP6895416B2 (ja) | エネルギー需要予測システム及びエネルギー需要予測方法 | |
| US11593690B2 (en) | Data prediction system and data prediction method | |
| JP2018092439A5 (https=) | ||
| Mirakyan et al. | Composite forecasting approach, application for next-day electricity price forecasting | |
| US20190228329A1 (en) | Prediction system and prediction method | |
| US8374903B2 (en) | Information criterion-based systems and methods for constructing combining weights for multimodel forecasting and prediction | |
| Aytac et al. | Characterization of demand for short life-cycle technology products | |
| Park et al. | A framework for baseline load estimation in demand response: Data mining approach | |
| Feng et al. | Toward scalable stochastic unit commitment. Part 1: load scenario generation | |
| CN119624513B (zh) | 一种基于机器学习的大数据预测系统 | |
| KR102266494B1 (ko) | 수요반응을 위한 딥러닝 기반 고객 분류 장치 및 방법 | |
| Matsuo et al. | Forecasting daily electric load by applying artificial neural network with fourier transformation and principal component analysis technique | |
| Oliveira et al. | Long-term energy consumption forecast for a commercial virtual power plant using a hybrid k-means and linear regression algorithm | |
| WO2016185919A1 (ja) | エネルギー需要予測システム及びエネルギー需要予測方法 | |
| Upadhaya et al. | A robust approach to extend deterministic models for the quantification of uncertainty and comprehensive evaluation of the probabilistic forecasting | |
| CN113902195A (zh) | 电力销售金额预测方法和系统 | |
| Shwetha et al. | Comprehensive Review of Techniques for Forecasting Electricity Consumption | |
| Md Rezwan-Ul | A Clustered Small Community Based Novel Electricity Trade Model for Consumers | |
| WO2024014035A1 (ja) | データ予測支援方法およびデータ予測システム | |
| Konda | Peak Load Forecast using Long Short Term Memory Networks. | |
| Dineep et al. | Household Energy Bill Prediction Using Various Machine Learning Techniques | |
| Klimberg et al. | Development of a Method to Improve Statistical Forecasts Using Interpolation and Cluster Analysis |
Legal Events
| Date | Code | Title | Description |
|---|---|---|---|
| 121 | Ep: the epo has been informed by wipo that ep was designated in this application |
Ref document number: 17877683 Country of ref document: EP Kind code of ref document: A1 |
|
| NENP | Non-entry into the national phase |
Ref country code: DE |
|
| WWE | Wipo information: entry into national phase |
Ref document number: 2017877683 Country of ref document: EP |