WO2018066570A1 - 放射線撮影装置、放射線撮影システム、放射線撮影方法、及びプログラム - Google Patents
放射線撮影装置、放射線撮影システム、放射線撮影方法、及びプログラム Download PDFInfo
- Publication number
- WO2018066570A1 WO2018066570A1 PCT/JP2017/036019 JP2017036019W WO2018066570A1 WO 2018066570 A1 WO2018066570 A1 WO 2018066570A1 JP 2017036019 W JP2017036019 W JP 2017036019W WO 2018066570 A1 WO2018066570 A1 WO 2018066570A1
- Authority
- WO
- WIPO (PCT)
- Prior art keywords
- energy
- radiation
- feature amount
- average
- value
- Prior art date
- Legal status (The legal status is an assumption and is not a legal conclusion. Google has not performed a legal analysis and makes no representation as to the accuracy of the status listed.)
- Ceased
Links
Images




Classifications
-
- A—HUMAN NECESSITIES
- A61—MEDICAL OR VETERINARY SCIENCE; HYGIENE
- A61B—DIAGNOSIS; SURGERY; IDENTIFICATION
- A61B6/00—Apparatus or devices for radiation diagnosis; Apparatus or devices for radiation diagnosis combined with radiation therapy equipment
Definitions
- the present invention relates to a radiation imaging apparatus, a radiation imaging system, a radiation imaging method, and a program.
- FPD flat panel detectors
- Such a radiographic apparatus is used, for example, as a digital imaging apparatus for moving image shooting such as still image shooting such as general shooting or fluoroscopic shooting in medical image diagnosis. Since FPD can process radiographic imaging information as a digital image, various applications have been put to practical use.
- the attenuation coefficient representing the degree to which radiation is attenuated when passing through the substance varies depending on the substance.
- the attenuation coefficient depends on the energy of radiation. Therefore, it is possible to generate an image in which two substances having different attenuation coefficients are separated by taking two images of radiation with two types of energy, obtaining two images, calculating an appropriate coefficient after logarithmic conversion, and performing a difference. it can.
- the pixel value of FPD is proportional to the product of the energy of incident radiation and the number of photons.
- the number of incident photons decreases for radiation with high energy, so photon noise (Poisson noise).
- Poisson noise has the property of increasing.
- Patent Document 1 describes a method of estimating average energy from the distribution of photon noise of radiation. However, when actually measuring the energy of incident radiation, it may not match the estimated value.
- the radiation imaging apparatus of the present invention is a calculation means for calculating an energy feature amount of radiation from a dispersion value and an average value of pixel values of a radiographic image, and correcting fluctuations of the energy feature amount based on the average value. Correction means for calculating an average energy of the radiation.
- FIG. 1 is a diagram illustrating a functional configuration example of the first embodiment.
- the radiation imaging system 100 of the present invention includes a radiation tube 101, a radiation generation device 102, an FPD (radiation detection unit) 104, an FPD control unit 105, a monitor 106, an operation unit 107, an image storage unit 108, and an image processing unit 109. .
- the radiation tube 101 irradiates the subject 103 with radiation.
- the radiation generator 102 applies a high voltage pulse to the radiation tube 101 by pressing the exposure switch to generate radiation.
- the FPD 104 detects radiation and outputs image data of a radiation image.
- the FPD 104 is controlled by the FPD control unit 105 to convert the radiation that has passed through the subject 103 into visible light using a fluorescent material, and detects it with a photodiode.
- the detected electrical signal is AD-converted and transmitted to the FPD control unit 105 as a digital image (radiation image).
- the FPD control unit 105 includes an image storage unit 108 and an image processing unit 109 and is built in one or a plurality of computers.
- the computer includes, for example, main control means such as a CPU and storage means such as ROM (Read Only Memory) and RAM (Random Access Memory). Further, the computer may be provided with graphic control means such as GPU (Graphics Processing Unit), communication means such as a network card, input / output means such as a keyboard, display or touch panel.
- main control means such as a CPU and storage means such as ROM (Read Only Memory) and RAM (Random Access Memory).
- graphic control means such as GPU (Graphics Processing Unit)
- communication means such as a network card
- input / output means such as a keyboard, display or touch panel.
- these constituent units are connected by a bus or the like, and are controlled by the main control unit executing a program stored in the storage unit.
- the monitor 106 displays the digital image received by the FPD control unit 105 and the digital image processed by the image processing unit 109, and provides the digital image for confirmation of radiography by the radiographer and diagnosis by the doctor.
- the operation unit 107 can input an instruction to the FPD 104 or the image processing unit 109, and may include a user interface.
- the image storage unit 108 stores the digital image output from the FPD control unit 105 and the digital image processed by the image processing unit 109.
- the image processing unit 109 generates an average energy image from the radiation digital image captured by the FPD 104.
- the image processing unit 109 includes a variance calculation unit (dispersion calculation unit) 110, an average value calculation unit (average value calculation unit) 111, an energy feature amount calculation unit (calculation unit) 112, a calibration table holding unit 113, and An average energy calculation unit (correction unit) 114 is provided.
- a plurality of radiographic images captured by the FPD 104 are stored in the image storage unit 108 and transferred to the image processing unit 109 by the FPD control unit 105 (step S201).
- step S201 the average value calculation unit 111 generates an average value image A (x, y) from the plurality of input radiation images M (x, y, t) according to the equation (1).
- x and y are the coordinates of the pixels of the radiation image.
- t is an integer and represents the frame number of the radiographic image taken in time series. Brackets ⁇ > t represent time averages. In this way, the average value calculation unit 111 calculates the average value of the pixel values of the radiation image.
- step S ⁇ b> 202 the variance calculation unit 110 calculates the variance image V (x, y) from the plurality of input radiation images M (x, y, t) and the average value image A (x, y) according to Equation (2). Is generated. In this way, the variance calculation unit 110 calculates the variance of the pixel values of the radiation image.
- step S203 the energy feature amount calculation unit 112 generates an energy feature amount image E s (x, y) according to Equation (3).
- the energy feature amount calculation unit (calculation unit) 112 calculates the radiation energy feature amount from the variance value V (x, y) and the average value A (x, y) of the pixel values of the radiation image.
- E s (x, y) is calculated.
- the energy feature amount calculation unit 112 calculates the energy feature amount from the variance and the average value.
- Equation (3) represents the average energy of radiation that has reached the FPD 104. That is, since the output is proportional to the product of the number of photons of radiation that has reached the FPD 104 and the energy of each photon, Equation (3) becomes Equation (4).
- the fluctuation of the number of photons of radiation reaching the FPD 104 follows the Poisson distribution, and the Poisson distribution has the property that the variance is equal to the expected value. Therefore, the following relationship holds for the number N of photons of radiation that reaches the FPD 104.
- Equation (3) is found to be an amount corresponding to the average energy E. Since the unit is different from the energy feature value E s and the energy E, by multiplying a predetermined coefficient to the energy characteristic quantity E s, the energy feature value E s may be matched with the average energy E.
- the energy feature value E s was found to vary according to the average value of the pixel values of the radiographic image.
- the energy feature value E s is should be constant regardless of the average value of the pixel values of the radiographic image, actual energy feature value E s It turned out that it changes according to the average value of the pixel value of a radiographic image.
- Energy feature value E s in accordance with equation (7) is corrected by the average value A of the pixel values, the mean energy E is corrected.
- the average energy calculation unit 114 uses the calibration table LUT2D to calculate the average energy E from the average value image based on the average value A (x, y) and the feature amount image based on the energy feature amount E s (x, y). An average energy image by (x, y) is generated.
- the average energy calculation unit (correction unit) 114 corrects the energy feature value E s based on the calibration table LUT2D.
- the mean energy calculation unit (correction unit) 114 by correcting on the basis of the variation of the energy feature value E s to the average value A, and calculates an average energy E of the radiation.
- the average energy E from the energy feature value E s is not estimated uniquely, even if the energy feature value E s is changed according to the average value A of the pixel values of the radiographic image the energy feature value E s can be appropriately corrected.
- the average energy E can be specified with high accuracy, and a high-precision average energy image can be provided.
- average the energy E is calculated, as shown in FIG. 3, such as the approximate function relation between the average value A of the energy feature value E s and the pixel value
- the average energy E may be calculated by using a function. (Create calibration table)
- the calibration table LUT2D is generated based on radiographic images acquired by photographing phantoms having different thicknesses.
- FIG. 4 is a radiation energy spectrum showing the relationship between the radiation energy and the normalized photon number when the acrylic plate as a phantom is radiographed for each thickness of the acrylic plate.
- the peak of the radiation spectrum shifts to the higher energy side as the material through which the radiation passes becomes thicker (as the material penetration distance of the radiation becomes longer) .
- the peak P2 is shifted to the higher energy side than the peak P1. This is called beam hardening.
- the thicker the material through which radiation is transmitted the higher the average energy of radiation by shifting the peak of the radiation spectrum to the higher energy side by beam hardening.
- the average energy is measured by beam hardening by changing the thickness of the acrylic plate.
- the average energy is measured by simply changing the radiation tube voltage and changing the radiation energy. May be performed.
- the calibration table LUT2D is generated based on the radiation image acquired by changing the tube voltage.
- the average energy is changed by changing the acrylic thickness. ing. This is because measuring the change in the average energy by changing the thickness of the substance is closer to the change in the average energy of the radiation actually transmitted through the subject.
- the energy feature value E s is changed according to the average value A, needs to be corrected in an amount corresponding to the energy feature value E s to the actual average energy E There is.
- the average energy calculation unit (correction unit) 114 based on a first function representing the relationship between the energy feature value E s and the average value A, to correct for variations in energy feature value E s.
- the first function is a higher-order function of the average value A.
- Equation (8) a function of energy feature value E s is expressed by Equation (8).
- Coefficients C 1 , C 2 , C 3 , and C 4 are calculated for each average energy E (43.7 keV, 48.7 keV, 51.7 keV, 53.9 keV).
- the coefficients C 1 , C 2 , C 3 , and C 4 of the predetermined average energy E may be calculated, and the coefficients C 1 , C 2 , and C 3 may be commonly used for the other average energy E. In this case, it can be applied to various average energy E by changing C 4 according to the average energy E. Further, a coefficient commonly used for other average energy E may be calculated from coefficients C 1 , C 2 , and C 3 of a plurality of predetermined average energy E.
- Equation (9) The relationship between the energy feature amount E s , the average value A, and the average energy E is expressed.
- FIG. 5 shows the result of approximation with a cubic function using equation (9).
- FIG. 6 is a graph showing the relationship between the average energy E and D (E). As shown in FIG. 6, it can be seen that D (E) changes linearly according to the average energy E. In this case, D (E) can be expressed by a linear function of average energy E as shown in Expression (10).
- the coefficient C 4 of the zero-order term of the average value A in the cubic function (first function) of the equation (8) is a linear function (second Function).
- Expression (11) is derived from Expression (9) and Expression (10).
- the cubic function (first function) in equation (8) or the linear function (second function) in equation (10) is derived from the measured energy value of the radiation measured while changing the phantom or tube voltage. It is burned. As described above, the cubic function (first function) of the equation (8) or the linear function (second function) of the equation (10) is based on the energy measurement value of the radiation, and the energy feature amount E s. , The average value A, and the average energy E.
- the average energy calculation unit (correction unit) 114 uses the coefficient C 1 of the cubic function (first function) of Expression (8) and the linear function (second function) of Expression (10). , C 2 , C 3 , L 1 , and L 2 , refer to the calibration table LUT2D. Thereby, the fluctuation
- the average energy calculation unit (correction unit) 114 corrects the fluctuation of the energy feature amount E s by referring to a calibration table that holds the relationship between the energy feature amount E s , the average value A, and the average energy E.
- the average energy calculation unit (correction unit) 114 has coefficients C 1 , C 2 , and C 3 of the cubic function (first function) in Expression (8) and the linear function (second function) in Expression (10). , by common L 1, L 2, on the basis of the coefficients, calculates the average energy E from the energy feature value E s and the average value a.
- the average energy calculation unit (correction unit) 114 generates an average energy image based on the corrected energy feature value E s.
- the average energy calculation unit 114 uses the calibration table LUT2D to calculate the average energy E (x, y) from the average value image based on the average value A (x, y) and the feature amount image based on the energy feature amount E s (x, y). ) To generate an average energy image.
- the average energy E can be specified with high accuracy, and a high-precision average energy image can be provided.
- an average energy image based on average energy E (x, y) is generated from an average value image based on average value A (x, y) and a feature amount image based on energy feature amount E s (x, y). Is done.
- the average energy calculation unit (correction unit) 114 corrects the in-plane distribution of the energy feature value E s in the radiation image.
- the in-plane distribution correction of the frame is performed on the energy feature amount E s (x, y), and the corrected energy feature amount E gs (x, y) is calculated.
- the average energy calculation unit 114 calculates the average energy based on the average energy E (x, y) from the average value image based on the average value A (x, y) and the feature amount image based on the corrected energy feature amount E gs (x, y). Generate an image.
- FIG. 7 is a diagram illustrating a functional configuration example of the second embodiment.
- FIG. 8 is a flowchart showing the processing of the second embodiment. Note that a description of the same configuration, function, and operation as in the first embodiment will be omitted, and differences from the present embodiment will be mainly described.
- the image processing unit 109 includes an in-plane distribution correction unit 115.
- step S204 prior to applying the calibration table LUT2D in step S205, the in-plane distribution of the energy feature value E s is corrected.
- the in-plane distribution correction unit 115 performs the in-plane distribution (spatial distribution) of the energy feature quantity E s according to the equation (12) based on the reference energy feature quantity E s0 calculated from the radiographic image taken without the subject. ) And a corrected energy feature amount E gs is calculated.
- the energy feature amount calculation unit 112 generates an energy feature amount E s0 (x, y) from the radiographic image captured in the absence of the subject according to the equation (3).
- the overline of E s0 is the in-plane average value (spatial average value) of the reference energy feature quantity E s0 (x, y).
- the energy feature amount calculation unit (calculation unit) 112 calculates a reference energy feature amount E s0 (x, y) of radiation from a dispersion value and an average value of pixel values of a radiographic image captured in the absence of a subject.
- the in-plane distribution correction unit (correction unit) 115 corrects the in-plane distribution of the energy feature amount E s based on the in-plane average value in the radiographic image of the reference energy feature amount E s0 (x, y). Accordingly, the average energy E can be calculated by applying the same calibration table LUT2D regardless of the pixel position (x, y).
- step S205 the average energy calculation unit 114 uses the calibration table LUT2D to calculate the average energy from the average value image based on the average value A (x, y) and the feature amount image based on the corrected energy feature amount E gs (x, y). An average energy image with E (x, y) is generated.
- the energy feature amount E gs is corrected by the average value A of the pixel values according to the equation (13) instead of the equation (7), and the average energy E is calculated.
- the present invention can take an embodiment as a system, apparatus, method, program, storage medium, or the like. Specifically, the present invention may be applied to a system composed of a plurality of devices, or may be applied to an apparatus composed of one device.
- the present invention supplies software (programs) for realizing the functions of the above-described embodiments to a system or apparatus via a network or various storage media, and a computer (CPU, MPU, etc.) of the system or apparatus reads the program. May be executed.
- the present invention can also be realized by a process in which one or more processors in a computer of a system or apparatus read and execute a program, and can also be realized by a circuit (for example, an ASIC) that realizes one or more functions.
Landscapes
- Health & Medical Sciences (AREA)
- Life Sciences & Earth Sciences (AREA)
- Medical Informatics (AREA)
- Engineering & Computer Science (AREA)
- Radiology & Medical Imaging (AREA)
- Biomedical Technology (AREA)
- Biophysics (AREA)
- Nuclear Medicine, Radiotherapy & Molecular Imaging (AREA)
- Optics & Photonics (AREA)
- Pathology (AREA)
- Physics & Mathematics (AREA)
- High Energy & Nuclear Physics (AREA)
- Heart & Thoracic Surgery (AREA)
- Molecular Biology (AREA)
- Surgery (AREA)
- Animal Behavior & Ethology (AREA)
- General Health & Medical Sciences (AREA)
- Public Health (AREA)
- Veterinary Medicine (AREA)
- Apparatus For Radiation Diagnosis (AREA)
Abstract
放射線画像の画素値の分散値と平均値から算出されたエネルギー特徴量を補正することで、精度の高い平均エネルギー画像を取得することが可能となる。本発明の放射線撮影装置は、放射線画像の画素値の分散値と平均値から放射線のエネルギー特徴量を算出する算出手段と、前記エネルギー特徴量の変動を前記平均値に基づいて補正することにより、前記放射線の平均エネルギーを算出する補正手段と、を備える。
Description
本発明は、放射線撮影装置、放射線撮影システム、放射線撮影方法、及びプログラムに関するものである。
現在、医療画像診断や非破壊検査に用いる放射線撮影装置として、半導体材料によって形成された平面検出器(Flat Panel Detector:以下「FPD」と略す)が普及している。このような放射線撮影装置は、例えば医療画像診断においては、一般撮影のような静止画撮影や透視撮影のような動画撮影のデジタル撮影装置として用いられている。FPDは、放射線による撮影情報をデジタル画像として処理可能なため、様々なアプリケーションが実用化されている。
そのうちの1つの技術として、エネルギーサブトラクションがある。一般的に、放射線が物質中を透過するときに減衰する程度を表す減弱係数は、物質によって異なる。そして、減弱係数は、放射線のエネルギーに依存する。したがって、2種類のエネルギーの放射線で撮影し2つの画像を取得し、対数変換した後に適切な係数を演算して差分することで、減弱係数の異なる2つの物質を分離した画像を生成することができる。
一方で、FPDの画素値は、入射放射線のエネルギーとフォトン数の積に比例するが、同じ画素値でも、エネルギーが高い放射線の場合は、入射フォトン数が少なくなるため、フォトンノイズ(ポアソンノイズ)が増大する性質がある。これを利用することで、放射線フォトン数や平均エネルギーを推定する方法が提案されている(特許文献1参照)。
特許文献1には、放射線のフォトンノイズの分散から平均エネルギーを推定する方法が記載されている。しかしながら、実際に入射放射線のエネルギーの測定を行ってみると、推定値と一致しない場合がある。
この結果、特許文献1に記載された発明により特定の撮影条件で推定された平均エネルギーを用いて較正を行っても、正確な平均エネルギー画像を取得することができない。
本発明の放射線撮影装置は、放射線画像の画素値の分散値と平均値から放射線のエネルギー特徴量を算出する算出手段と、前記エネルギー特徴量の変動を前記平均値に基づいて補正することにより、前記放射線の平均エネルギーを算出する補正手段と、を備える。
(第1の実施形態)
以下、本発明の第1の実施形態について図面を参照して説明する。図1は、第1の実施形態の機能構成例を示す図である。
以下、本発明の第1の実施形態について図面を参照して説明する。図1は、第1の実施形態の機能構成例を示す図である。
本発明の放射線撮影システム100は、放射線管101、放射線発生装置102、FPD(放射線検出部)104、FPD制御部105、モニタ106、操作部107、画像保存部108、及び画像処理部109を備える。
放射線管101は、被写体103に放射線を照射する。放射線発生装置102は、曝射スイッチの押下により、放射線管101に高電圧パルスを与え、放射線を発生させる。FPD104は、放射線を検出し、放射線画像の画像データを出力する。FPD104は、FPD制御部105に制御されて、被写体103を通過した放射線を蛍光体により可視光に変換し、フォトダイオードで検出する。検出された電気信号は、AD変換されてデジタル画像(放射線画像)として、FPD制御部105に送信される。
FPD制御部105は、画像保存部108及び画像処理部109を備え、1つ又は複数のコンピュータに内蔵される。コンピュータには、例えば、CPUなどの主制御手段、ROM(Read Only Memory)、RAM(Random Access Memory)などの記憶手段が具備される。また、コンピュータには、GPU(Graphics Processing Unit)などのグラフィック制御手段、ネットワークカード等の通信手段、キーボード、ディスプレイ又はタッチパネルなどの入出力手段などが具備されていてもよい。
なお、これら各構成手段は、バスなどにより接続され、記憶手段に記憶されたプログラムを主制御手段が実行することで制御される。
モニタ106は、FPD制御部105で受信されたデジタル画像や画像処理部109で画像処理されたデジタル画像を表示し、放射線撮影技師の撮影確認や医師の診断用にデジタル画像を供する。
操作部107は、FPD104や画像処理部109に指示を入力することができ、ユーザーインターフェイスを具備してもよい。画像保存部108は、FPD制御部105から出力されたデジタル画像や画像処理部109で画像処理されたデジタル画像を保存する。
画像処理部109は、FPD104で撮影された放射線デジタル画像から平均エネルギー画像を生成する。その構成として、画像処理部109は、分散計算部(分散算出部)110、平均値計算部(平均値算出部)111、エネルギー特徴量計算部(算出部)112、較正テーブル保持部113、及び平均エネルギー計算部(補正部)114を具備する。
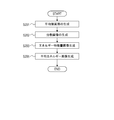
次に、本実施形態の処理について、図2に示すフローチャートを用いて詳細に説明する。
<平均エネルギーEの推定>
FPD制御部105によって、FPD104で撮影された複数の放射線画像は画像保存部108に保存されるとともに画像処理部109に転送される(ステップS201)。
FPD制御部105によって、FPD104で撮影された複数の放射線画像は画像保存部108に保存されるとともに画像処理部109に転送される(ステップS201)。
ステップS201では、平均値計算部111は、入力された複数の放射線画像M(x,y,t)から、式(1)に従い、平均値画像A(x,y)を生成する。ここで、xとyは放射線画像の画素の座標である。tは、整数であり、時系列に撮影された放射線画像のフレーム番号を表す。ブラケット<>tは、時間平均を表す。このように、平均値計算部111は、放射線画像の画素値の平均値を算出する。

ステップS202では、分散計算部110は、入力された複数の放射線画像M(x,y,t)と平均値画像A(x,y)から式(2)に従い、分散画像V(x,y)を生成する。このように、分散計算部110は、放射線画像の画素値の分散を算出する。

ステップS203では、エネルギー特徴量計算部112は、式(3)に従い、エネルギー特徴量画像Es(x,y)を生成する。式(3)に示すように、エネルギー特徴量計算部(算出部)112は、放射線画像の画素値の分散値V(x,y)と平均値A(x,y)から放射線のエネルギー特徴量Es(x,y)を算出する。このように、エネルギー特徴量計算部112は、分散と平均値からエネルギー特徴量を算出する。

特許文献1にも開示されているように、式(3)は、FPD104に到達した放射線の平均エネルギーを表す。つまり、FPD104に到達した放射線のフォトン数と各フォトンが持っているエネルギーの積に比例した出力をするため、式(3)は式(4)となる。

また、FPD104に到達する放射線のフォトン数のゆらぎは、ポアソン分布に従い、ポアソン分布は、期待値と分散が等しい性質がある。したがって、FPD104に到達した放射線のフォトン数Nには、以下の関係が成り立つ。

ここで、式(4)の分母を式(5)で置き換えると、式(6)となり、式(3)のエネルギー特徴量Esは、平均エネルギーEに相当する量であることがわかる。なお、エネルギー特徴量EsとエネルギーEとは単位が異なるため、エネルギー特徴量Esに所定の係数を乗算することにより、エネルギー特徴量Esを平均エネルギーEに一致させてもよい。

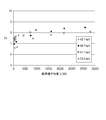
しかしながら、実際にFPD104がエネルギー特徴量Esを計算すると、図3に示すように、エネルギー特徴量Esは、放射線画像の画素値の平均値に応じて変化することがわかった。
<エネルギー特徴量Esの補正>
図3は、放射線画像の画素値の平均値LSBとエネルギー特徴量Esとの関係を、実際の放射線の平均エネルギーE(43.7keV,48.7keV,51.7keV,53.9keV)ごとにプロットしたグラフである。それぞれの平均エネルギーEは、エネルギースペクトロメーターを用いて測定した値である。
図3は、放射線画像の画素値の平均値LSBとエネルギー特徴量Esとの関係を、実際の放射線の平均エネルギーE(43.7keV,48.7keV,51.7keV,53.9keV)ごとにプロットしたグラフである。それぞれの平均エネルギーEは、エネルギースペクトロメーターを用いて測定した値である。
式(6)によれば、平均エネルギーEが一定である場合、エネルギー特徴量Esは、放射線画像の画素値の平均値にかかわらず一定となるはずであるが、実際のエネルギー特徴量Esは、放射線画像の画素値の平均値に応じて変化することがわかった。
すなわち、平均エネルギーEを特定するためには、エネルギー特徴量Esを補正する必要がある。一般に、FPD104の内部では、放射線フォトンを蛍光体により可視光に変換してから、フォトダイオードで受光し、電子へ変換する複雑な物理過程を経るため、式(6)では、正確な平均エネルギーEが算出されないと考えられる。
そこで、本発明では、この課題を解決して、平均エネルギーEを高い精度で推定するため、図3のような放射線画像の画素値の平均値とエネルギー特徴量Esとの関係を較正テーブル(2軸エネルギー較正テーブル)LUT2Dで表す。較正テーブルLUT2Dを参照して、エネルギー特徴量Esは画素値の平均値Aにより補正される。較正テーブルLUT2Dは、較正テーブル保持部113に保存される。較正テーブル保持部113は、算出されたエネルギー特徴量Esの変動を補正するための較正テーブルLUT2Dを保持する。
エネルギー特徴量Esは、式(7)に従い、画素値の平均値Aにより補正され、平均エネルギーEが補正される。

ステップS205では、平均エネルギー計算部114は、較正テーブルLUT2Dを用いて、平均値A(x,y)による平均値画像とエネルギー特徴量Es(x,y)による特徴量画像から、平均エネルギーE(x,y)による平均エネルギー画像を生成する。平均エネルギー計算部(補正部)114は、較正テーブルLUT2Dに基づいてエネルギー特徴量Esを補正する。このように、平均エネルギー計算部(補正部)114は、エネルギー特徴量Esの変動を平均値Aに基づいて補正することにより、放射線の平均エネルギーEを算出する。
これにより、図3のように、エネルギー特徴量Esから平均エネルギーEが一意に推定されず、エネルギー特徴量Esが放射線画像の画素値の平均値Aに応じて変化する場合であっても、エネルギー特徴量Esを適切に補正することができる。この結果、高精度で平均エネルギーEを特定し、高精度の平均エネルギー画像を提供することができる。
なお、本実施形態では、較正テーブルLUT2Dを参照して、平均エネルギーEが算出されるが、図3のような、エネルギー特徴量Esと画素値の平均値Aとの関係を近似関数などの関数で表し、関数を用いることで、平均エネルギーEが算出されてもよい。
(較正テーブルの作成)
(較正テーブルの作成)
次に、ステップS205で用いられる較正テーブルLUT2Dの作成について詳細に説明する。較正テーブルLUT2Dは、厚さが異なるファントムを撮影して取得された放射線画像に基づいて生成される。図4は、ファントムであるアクリル板を放射線撮影した際の放射線エネルギーと正規化フォトン数の関係をアクリル板の厚さごとに表した放射線エネルギースペクトルである。
図4に示すように、放射線スペクトルは、アクリル板が厚くなるにつれて、放射線エネルギーが低いほど、正規化フォトン数が少なくなり、放射線を減弱する。放射線エネルギーが低い放射線ほど物質中を透過するときに減衰するため、放射線スペクトルのピークは、放射線が透過する物質が厚くなるにつれて(放射線の物質透過距離が長くなるにつれて)、高エネルギー側にシフトする。図4では、ピークP1よりもピークP2のほうが、高エネルギー側にシフトしている。これをビームハードニング(線質硬化)と呼ぶ。
したがって、放射線が透過する物質が厚くなるほど、ビームハードニングにより放射線スペクトルのピークが高エネルギー側にシフトすることで、放射線の平均エネルギーが高くなる。
なお、本実施形態ではアクリル板の厚さを変化させて、ビームハードニングにより平均エネルギーの測定を行っているが、単純に放射線管電圧を変化させて放射線エネルギーを変化させることにより平均エネルギーの測定を行ってもよい。較正テーブルLUT2Dは、管電圧を変化させて取得された放射線画像に基づいて生成される。
ただし、放射線管電圧の変化による平均エネルギーの変化とビームハードングによる平均エネルギーの変化では、放射線スペクトル形状の変化が異なるため、本実施形態では、アクリルの厚さを変化させて平均エネルギーを変化させている。物質の厚さを変化させて平均エネルギーの変化を測定するほうが、実際に被写体を透過した放射線の平均エネルギーの変化に近いからである。
前述したように、平均エネルギーEが一定であっても、エネルギー特徴量Esが平均値Aに応じて変化するため、エネルギー特徴量Esを実際の平均エネルギーEに相当する量に補正する必要がある。
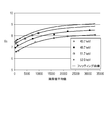
そこで、図5に示すように、平均値Aに対するエネルギー特徴量Esの挙動を関数で近似する。平均エネルギー計算部(補正部)114は、エネルギー特徴量Esと平均値Aとの関係を表す第1の関数に基づいて、エネルギー特徴量Esの変動を補正する。第1の関数は、平均値Aの高次関数である。
本実施形態では、図5に示すように、図3でプロットされた点を平均値Aの3次関数(第1の関数)でそれぞれ近似する。この場合、エネルギー特徴量Esの関数は式(8)で表される。

平均エネルギーE(43.7keV,48.7keV,51.7keV,53.9keV)ごとにそれぞれの係数C1,C2,C3,C4を算出する。
また、所定の平均エネルギーEの係数C1,C2,C3,C4を算出し、係数C1,C2,C3を他の平均エネルギーEに共通に用いてもよい。この場合、平均エネルギーEに応じてC4を変化させることで様々な平均エネルギーEに適用することができる。また、所定の複数の平均エネルギーEの係数C1,C2,C3から、他の平均エネルギーEに共通に用いられる係数を算出してもよい。
本実施形態では、平均エネルギーEに共通に用いられる係数C1,C2,C3を算出し、平均エネルギーEに依存する係数C4をDとして、式(9)によりエネルギー特徴量Esが表され、エネルギー特徴量Es、平均値A、及び平均エネルギーEの関係が表される。

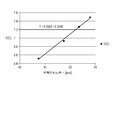
図5は、式(9)用いて3次関数で近似した結果である。図6は、平均エネルギーEとD(E)との関係を示すグラフである。図6に示すように、D(E)は、平均エネルギーEに応じて線形に変化することがわかる。この場合、式(10)に示すように、D(E)は、平均エネルギーEの1次関数で表すことができる。

式(10)に示すように、式(8)の3次関数(第1の関数)における平均値Aの0次項の係数C4は、平均エネルギーEを変数とする1次関数(第2の関数)である。式(9)及び式(10)から式(11)が導かれる。

式(8)の3次関数(第1の関数)又は式(10)の1次関数(第2の関数)は、ファントムや管電圧などを変化させながら測定された放射線のエネルギー測定値から導かれる。前述のように、式(8)の3次関数(第1の関数)又は式(10)の1次関数(第2の関数)は、放射線のエネルギー測定値に基づいて、エネルギー特徴量Es、平均値A、及び平均エネルギーEの関係を近似する関数である。
予め算出された係数、C1,C2,C3,L1,L2に基づいて、較正テーブルLUT2Dが作成される。較正テーブル保持部113に保存された較正テーブルLUT2Dを参照し、式(11)にエネルギー特徴量Es及び平均値Aを入力すると、較正された平均エネルギーEが算出され、高精度のエネルギー較正が可能になる。
前述のステップS205で、平均エネルギー計算部(補正部)114は、式(8)の3次関数(第1の関数)及び式(10)の1次関数(第2の関数)の係数C1,C2,C3,L1,L2を保持する較正テーブルLUT2Dを参照する。これにより、エネルギー特徴量の変動が補正される。
平均エネルギー計算部(補正部)114は、エネルギー特徴量Es、平均値A、及び平均エネルギーEの関係を保持する較正テーブルを参照することにより、エネルギー特徴量Esの変動を補正する。
平均エネルギー計算部(補正部)114は、式(8)の3次関数(第1の関数)及び式(10)の1次関数(第2の関数)の係数C1,C2,C3,L1,L2を共通させて、係数に基づいて、エネルギー特徴量Es及び平均値Aから平均エネルギーEを算出する。
平均エネルギー計算部(補正部)114は、補正されたエネルギー特徴量Esに基づいて平均エネルギー画像を生成する。平均エネルギー計算部114は、較正テーブルLUT2Dを用いて、平均値A(x,y)による平均値画像とエネルギー特徴量Es(x,y)による特徴量画像から、平均エネルギーE(x,y)による平均エネルギー画像を生成する。この結果、高精度で平均エネルギーEを特定し、高精度の平均エネルギー画像を提供することができる。
(第2の実施形態)
第1の実施形態では、平均値A(x,y)による平均値画像とエネルギー特徴量Es(x,y)による特徴量画像から、平均エネルギーE(x,y)による平均エネルギー画像が生成される。
第1の実施形態では、平均値A(x,y)による平均値画像とエネルギー特徴量Es(x,y)による特徴量画像から、平均エネルギーE(x,y)による平均エネルギー画像が生成される。
第2の実施形態では、平均エネルギー計算部(補正部)114は、放射線画像におけるエネルギー特徴量Esの面内分布を補正する。エネルギー特徴量Es(x,y)にフレームの面内分布補正を施し、補正エネルギー特徴量Egs(x,y)が算出される。そして、平均エネルギー計算部114は、平均値A(x,y)による平均値画像と補正エネルギー特徴量Egs(x,y)による特徴量画像から、平均エネルギーE(x,y)による平均エネルギー画像を生成する。
<エネルギー特徴量Esの面内分布補正>
図7は、第2の実施形態の機能構成例を示す図である。図8は、第2の実施形態の処理を示すフローチャートである。なお、第1の実施形態と同様の構成、機能、及び動作についての説明は省略し、主に本実施形態との差異について説明する。
図7は、第2の実施形態の機能構成例を示す図である。図8は、第2の実施形態の処理を示すフローチャートである。なお、第1の実施形態と同様の構成、機能、及び動作についての説明は省略し、主に本実施形態との差異について説明する。
画像処理部109は、面内分布補正部115を具備する。ステップS204では、ステップS205で較正テーブルLUT2Dを適用する前に、エネルギー特徴量Esの面内分布が補正される。面内分布補正部115が、被写体がない状態で撮影された放射線画像から算出された基準エネルギー特徴量Es0に基づいて、式(12)に従い、エネルギー特徴量Esの面内分布(空間分布)を補正し、補正エネルギー特徴量Egsを算出する。

エネルギー特徴量計算部112は、式(3)に従い、被写体がない状態で撮影された放射線画像からエネルギー特徴量Es0(x,y)を生成する。ここで、Es0のオーバーラインは、基準エネルギー特徴量Es0(x,y)の面内平均値(空間平均値)である。
エネルギー特徴量計算部(算出部)112は、被写体がない状態で撮影された放射線画像の画素値の分散値と平均値から放射線の基準エネルギー特徴量Es0(x,y)を算出する。面内分布補正部(補正部)115は、基準エネルギー特徴量Es0(x,y)の放射線画像における面内平均値に基づいて、エネルギー特徴量Esの面内分布を補正する。これにより、画素の位置(x,y)にかかわらず、同じ較正テーブルLUT2Dを適用することで、平均エネルギーEの算出が可能になる。
ステップS205では、平均エネルギー計算部114は、較正テーブルLUT2Dを用いて、平均値A(x,y)による平均値画像と補正エネルギー特徴量Egs(x,y)による特徴量画像から、平均エネルギーE(x,y)による平均エネルギー画像を生成する。
つまり、本実施形態では、エネルギー特徴量Egsが、式(7)の代わりに式(13)に従い、画素値の平均値Aにより補正され、平均エネルギーEが算出される。

以上が本発明の代表的な実施形態の例であるが、本発明は、上記及び図面に示す実施形態に限定することなく、その要旨を変更しない範囲内で適宜変形して実施できるものである。
また、本発明は、例えば、システム、装置、方法、プログラム、若しくは記憶媒体などとしての実施態様を採ることもできる。具体的には、複数の機器から構成されるシステムに適用してもよいし、また、1つの機器からなる装置に適用してもよい。
本発明は、上記の実施形態の機能を実現するソフトウェア(プログラム)をネットワーク又は各種記憶媒体を介してシステム又は装置に供給し、システム又は装置のコンピュータ(CPUやMPUなど)がプログラムを読み出すことにより実行されてもよい。また、本発明は、システム又は装置のコンピュータにおける1つ以上のプロセッサーがプログラムを読出し実行する処理でも実現可能であり、1以上の機能を実現する回路(例えば、ASIC)によっても実現可能である。
本発明は上記実施の形態に制限されるものではなく、本発明の精神及び範囲から離脱することなく、様々な変更及び変形が可能である。従って、本発明の範囲を公にするために以下の請求項を添付する。
この出願は2016年10月6日に出願された日本国特許出願第2016-198468からの優先権を主張するものであり、その内容を引用してこの出願の一部とするものである。
Claims (18)
- 放射線画像の画素値の分散値と平均値から放射線のエネルギー特徴量を算出する算出手段と、
前記エネルギー特徴量の変動を前記平均値に基づいて補正することにより、前記放射線の平均エネルギーを算出する補正手段と、
を備えることを特徴とする放射線撮影装置。 - 前記補正手段は、前記エネルギー特徴量と前記平均値との関係を表す第1の関数に基づいて、前記エネルギー特徴量の変動を補正する請求項1に記載の放射線撮影装置。
- 前記第1の関数は、前記平均値の高次関数であることを特徴とする請求項2に記載の放射線撮影装置。
- 前記第1の関数における前記平均値の0次項の係数は、前記平均エネルギーを変数とする第2の関数であることを特徴とする請求項2又は3に記載の放射線撮影装置。
- 前記第2の関数は、前記平均エネルギーの1次関数であることを特徴とする請求項4に記載の放射線撮影装置。
- 前記第1の関数又は前記第2の関数は、前記放射線のエネルギー測定値から導かれることを特徴とする請求項2乃至5の何れか1項に記載の放射線撮影装置。
- 前記第1の関数又は前記第2の関数は、前記放射線のエネルギー測定値に基づいて、前記エネルギー特徴量、前記平均値、及び前記平均エネルギーの関係を近似する関数であることを特徴とする請求項2乃至6の何れか1項に記載の放射線撮影装置
- 前記補正手段は、前記第1の関数及び前記第2の関数の係数を共通させて、前記係数に基づいて、前記エネルギー特徴量及び前記平均値から前記平均エネルギーを算出することを特徴とする請求項2乃至7の何れか1項に記載の放射線撮影装置。
- 前記補正手段は、前記第1の関数及び前記第2の関数の係数を保持する前記較正テーブルを参照することにより、前記エネルギー特徴量の変動を補正する請求項2乃至8の何れか1項に記載の放射線撮影装置。
- 前記補正手段は、前記エネルギー特徴量、前記平均値、及び前記平均エネルギーの関係を保持する較正テーブルを参照することにより、前記エネルギー特徴量の変動を補正する請求項1乃至9の何れか1項に記載の放射線撮影装置。
- 前記補正手段は、前記放射線画像における前記エネルギー特徴量の面内分布を補正することを特徴とする請求項1乃至10の何れか1項に記載の放射線撮影装置。
- 前記算出手段は、被写体がない状態で撮影された放射線画像の画素値の分散値と平均値から放射線の基準エネルギー特徴量を算出し、
前記補正手段は、前記基準エネルギー特徴量の前記放射線画像における面内平均値に基づいて、前記エネルギー特徴量の面内分布を補正することを特徴とする請求項11に記載の放射線撮影装置。 - 前記補正手段は、補正された前記エネルギー特徴量に基づいて平均エネルギー画像を生成することを特徴とする請求項1乃至12の何れか1項に記載の放射線撮影装置。
- 放射線画像の画素値の分散を算出する分散算出手段と、
放射線画像の画素値の平均値を算出する平均値算出手段と、
前記分散と平均値からエネルギー特徴量を算出する算出手段と、
該算出されたエネルギー特徴量の変動を補正するための較正テーブルを保持する保持手段と、
前記較正テーブルに基づいてエネルギー特徴量を補正する補正手段とを備えることを特徴とする放射線撮影装置。 - 放射線を発生させる放射線発生手段と、
前記放射線を検出し、放射線画像の画像データを出力する放射線検出手段と、
前記放射線画像の画素値の分散値と平均値から放射線のエネルギー特徴量を算出する算出手段と、
前記エネルギー特徴量の変動を前記平均値に基づいて補正することにより、前記放射線の平均エネルギーを算出する補正手段と、
を備えることを特徴とする放射線撮影システム。 - 放射線画像の画素値の分散値と平均値から放射線のエネルギー特徴量を算出する工程と、
前記エネルギー特徴量の変動を前記平均値に基づいて補正することにより、前記放射線の平均エネルギーを算出する工程と、
を備えることを特徴とする放射線撮影方法。 - 放射線画像の画素値の分散を算出する工程と、
放射線画像の画素値の平均値を算出する工程と、
前記分散と平均値からエネルギー特徴量を算出する工程と、
該算出されたエネルギー特徴量の変動を補正するための較正テーブルを保持する工程と、
前記較正テーブルに基づいてエネルギー特徴量を補正する工程と、
を備えることを特徴とする放射線撮影方法。 - コンピュータを請求項1乃至14の何れか1項に記載の放射線撮影装置の各手段として機能させるためのプログラム。
Applications Claiming Priority (2)
| Application Number | Priority Date | Filing Date | Title |
|---|---|---|---|
| JP2016-198468 | 2016-10-06 | ||
| JP2016198468A JP2018057669A (ja) | 2016-10-06 | 2016-10-06 | 放射線撮影装置、放射線撮影システム、放射線撮影方法、及びプログラム |
Publications (1)
| Publication Number | Publication Date |
|---|---|
| WO2018066570A1 true WO2018066570A1 (ja) | 2018-04-12 |
Family
ID=61831852
Family Applications (1)
| Application Number | Title | Priority Date | Filing Date |
|---|---|---|---|
| PCT/JP2017/036019 Ceased WO2018066570A1 (ja) | 2016-10-06 | 2017-10-03 | 放射線撮影装置、放射線撮影システム、放射線撮影方法、及びプログラム |
Country Status (2)
| Country | Link |
|---|---|
| JP (1) | JP2018057669A (ja) |
| WO (1) | WO2018066570A1 (ja) |
Families Citing this family (1)
| Publication number | Priority date | Publication date | Assignee | Title |
|---|---|---|---|---|
| JP7246281B2 (ja) * | 2019-08-02 | 2023-03-27 | キヤノン株式会社 | 画像処理装置およびその制御方法、放射線撮影装置、プログラム |
Citations (2)
| Publication number | Priority date | Publication date | Assignee | Title |
|---|---|---|---|---|
| JP2013236962A (ja) * | 2007-08-15 | 2013-11-28 | Fujifilm Corp | 画像成分分離装置、方法、およびプログラム |
| JP2014128456A (ja) * | 2012-12-28 | 2014-07-10 | Toshiba Corp | X線ct装置及び制御プログラム |
-
2016
- 2016-10-06 JP JP2016198468A patent/JP2018057669A/ja active Pending
-
2017
- 2017-10-03 WO PCT/JP2017/036019 patent/WO2018066570A1/ja not_active Ceased
Patent Citations (2)
| Publication number | Priority date | Publication date | Assignee | Title |
|---|---|---|---|---|
| JP2013236962A (ja) * | 2007-08-15 | 2013-11-28 | Fujifilm Corp | 画像成分分離装置、方法、およびプログラム |
| JP2014128456A (ja) * | 2012-12-28 | 2014-07-10 | Toshiba Corp | X線ct装置及び制御プログラム |
Also Published As
| Publication number | Publication date |
|---|---|
| JP2018057669A (ja) | 2018-04-12 |
Similar Documents
| Publication | Publication Date | Title |
|---|---|---|
| JP5405093B2 (ja) | 画像処理装置及び画像処理方法 | |
| JP6882135B2 (ja) | 画像処理装置、画像処理方法及びプログラム | |
| US20190320993A1 (en) | Information processing apparatus, radiation imaging apparatus, information processing method, and storage medium | |
| EP3342342A1 (en) | Radiation image processing method and radiographic system | |
| JP6156847B2 (ja) | 放射線画像処理装置および方法並びにプログラム | |
| WO2019235087A1 (ja) | 放射線撮影装置、放射線撮影方法およびプログラム | |
| US20080073567A1 (en) | Radiological image capturing system and radiological image capturing method | |
| JP2017060544A (ja) | 線源画像面間距離取得装置、方法およびプログラム、並びに放射線画像処理装置、方法およびプログラム | |
| CN108348202A (zh) | 放射线成像系统、用于放射线图像的信息处理装置、用于放射线图像的图像处理方法和程序 | |
| JPH01259842A (ja) | 放射線診断装置 | |
| WO2018066570A1 (ja) | 放射線撮影装置、放射線撮影システム、放射線撮影方法、及びプログラム | |
| CN111315297A (zh) | 图像处理装置、图像处理方法、放射线摄像装置、放射线摄像装置的控制方法和程序 | |
| TW200408373A (en) | Method for calibrating the intensity profile for a movable x-ray source | |
| JP2013255040A (ja) | 撮像装置、撮像システム、撮像装置の制御方法およびプログラム | |
| JP6238303B2 (ja) | X線投影像補正装置及びx線投影像補正方法 | |
| CN110108728B (zh) | 放射线检查装置及放射线检查方法 | |
| KR101092207B1 (ko) | 비선형 응답특성을 가지는 디지털 방사선 검출 이미지의 밸런스 보정 방법 및 장치 | |
| US20250003895A1 (en) | Image processing apparatus, radiation imaging system, image processing method, and storage medium | |
| WO2020149253A1 (ja) | 放射線撮像装置、放射線撮像システムおよび放射線撮像装置の制御方法 | |
| JP2008237836A (ja) | 放射線撮像装置及び方法 | |
| JP6560990B2 (ja) | 放射線計測方法、放射線計測装置、x線透過像撮影装置及びx線ct装置 | |
| JP7852272B2 (ja) | X線検査装置を用いたx線検査方法、及びx線検査装置 | |
| JP2025068991A (ja) | 厚さ計測装置、厚さ計測方法及び厚さ計測プログラム | |
| WO2018055992A1 (ja) | 放射線撮影装置、放射線撮影システム、放射線撮影方法、及びプログラム | |
| JP6576519B2 (ja) | 放射線画像処理装置、方法およびプログラム |
Legal Events
| Date | Code | Title | Description |
|---|---|---|---|
| 121 | Ep: the epo has been informed by wipo that ep was designated in this application |
Ref document number: 17858407 Country of ref document: EP Kind code of ref document: A1 |
|
| NENP | Non-entry into the national phase |
Ref country code: DE |
|
| 122 | Ep: pct application non-entry in european phase |
Ref document number: 17858407 Country of ref document: EP Kind code of ref document: A1 |