WO2017056905A1 - アミロイドβオリゴマーの検出方法、アミロイドβオリゴマー検出装置及びアミロイドβオリゴマー検出プログラム - Google Patents
アミロイドβオリゴマーの検出方法、アミロイドβオリゴマー検出装置及びアミロイドβオリゴマー検出プログラム Download PDFInfo
- Publication number
- WO2017056905A1 WO2017056905A1 PCT/JP2016/076469 JP2016076469W WO2017056905A1 WO 2017056905 A1 WO2017056905 A1 WO 2017056905A1 JP 2016076469 W JP2016076469 W JP 2016076469W WO 2017056905 A1 WO2017056905 A1 WO 2017056905A1
- Authority
- WO
- WIPO (PCT)
- Prior art keywords
- time
- spectrum
- amyloid
- oligomer
- normalized
- Prior art date
- Legal status (The legal status is an assumption and is not a legal conclusion. Google has not performed a legal analysis and makes no representation as to the accuracy of the status listed.)
- Ceased
Links
Images



Classifications
-
- G—PHYSICS
- G01—MEASURING; TESTING
- G01N—INVESTIGATING OR ANALYSING MATERIALS BY DETERMINING THEIR CHEMICAL OR PHYSICAL PROPERTIES
- G01N21/00—Investigating or analysing materials by the use of optical means, i.e. using sub-millimetre waves, infrared, visible or ultraviolet light
- G01N21/62—Systems in which the material investigated is excited whereby it emits light or causes a change in wavelength of the incident light
- G01N21/63—Systems in which the material investigated is excited whereby it emits light or causes a change in wavelength of the incident light optically excited
- G01N21/64—Fluorescence; Phosphorescence
- G01N21/6408—Fluorescence; Phosphorescence with measurement of decay time, time resolved fluorescence
-
- G—PHYSICS
- G01—MEASURING; TESTING
- G01N—INVESTIGATING OR ANALYSING MATERIALS BY DETERMINING THEIR CHEMICAL OR PHYSICAL PROPERTIES
- G01N21/00—Investigating or analysing materials by the use of optical means, i.e. using sub-millimetre waves, infrared, visible or ultraviolet light
- G01N21/62—Systems in which the material investigated is excited whereby it emits light or causes a change in wavelength of the incident light
- G01N21/63—Systems in which the material investigated is excited whereby it emits light or causes a change in wavelength of the incident light optically excited
- G01N21/64—Fluorescence; Phosphorescence
- G01N21/6428—Measuring fluorescence of fluorescent products of reactions or of fluorochrome labelled reactive substances, e.g. measuring quenching effects, using measuring "optrodes"
-
- G—PHYSICS
- G01—MEASURING; TESTING
- G01N—INVESTIGATING OR ANALYSING MATERIALS BY DETERMINING THEIR CHEMICAL OR PHYSICAL PROPERTIES
- G01N33/00—Investigating or analysing materials by specific methods not covered by groups G01N1/00 - G01N31/00
- G01N33/48—Biological material, e.g. blood, urine; Haemocytometers
- G01N33/50—Chemical analysis of biological material, e.g. blood, urine; Testing involving biospecific ligand binding methods; Immunological testing
- G01N33/68—Chemical analysis of biological material, e.g. blood, urine; Testing involving biospecific ligand binding methods; Immunological testing involving proteins, peptides or amino acids
- G01N33/6893—Chemical analysis of biological material, e.g. blood, urine; Testing involving biospecific ligand binding methods; Immunological testing involving proteins, peptides or amino acids related to diseases not provided for elsewhere
- G01N33/6896—Neurological disorders, e.g. Alzheimer's disease
-
- G—PHYSICS
- G01—MEASURING; TESTING
- G01N—INVESTIGATING OR ANALYSING MATERIALS BY DETERMINING THEIR CHEMICAL OR PHYSICAL PROPERTIES
- G01N21/00—Investigating or analysing materials by the use of optical means, i.e. using sub-millimetre waves, infrared, visible or ultraviolet light
- G01N21/62—Systems in which the material investigated is excited whereby it emits light or causes a change in wavelength of the incident light
- G01N21/63—Systems in which the material investigated is excited whereby it emits light or causes a change in wavelength of the incident light optically excited
- G01N21/64—Fluorescence; Phosphorescence
- G01N21/6408—Fluorescence; Phosphorescence with measurement of decay time, time resolved fluorescence
- G01N2021/6413—Distinction short and delayed fluorescence or phosphorescence
-
- G—PHYSICS
- G01—MEASURING; TESTING
- G01N—INVESTIGATING OR ANALYSING MATERIALS BY DETERMINING THEIR CHEMICAL OR PHYSICAL PROPERTIES
- G01N21/00—Investigating or analysing materials by the use of optical means, i.e. using sub-millimetre waves, infrared, visible or ultraviolet light
- G01N21/62—Systems in which the material investigated is excited whereby it emits light or causes a change in wavelength of the incident light
- G01N21/63—Systems in which the material investigated is excited whereby it emits light or causes a change in wavelength of the incident light optically excited
- G01N21/64—Fluorescence; Phosphorescence
- G01N21/6428—Measuring fluorescence of fluorescent products of reactions or of fluorochrome labelled reactive substances, e.g. measuring quenching effects, using measuring "optrodes"
- G01N2021/6439—Measuring fluorescence of fluorescent products of reactions or of fluorochrome labelled reactive substances, e.g. measuring quenching effects, using measuring "optrodes" with indicators, stains, dyes, tags, labels, marks
-
- G—PHYSICS
- G01—MEASURING; TESTING
- G01N—INVESTIGATING OR ANALYSING MATERIALS BY DETERMINING THEIR CHEMICAL OR PHYSICAL PROPERTIES
- G01N2333/00—Assays involving biological materials from specific organisms or of a specific nature
- G01N2333/435—Assays involving biological materials from specific organisms or of a specific nature from animals; from humans
- G01N2333/46—Assays involving biological materials from specific organisms or of a specific nature from animals; from humans from vertebrates
- G01N2333/47—Assays involving proteins of known structure or function as defined in the subgroups
- G01N2333/4701—Details
- G01N2333/4709—Amyloid plaque core protein
-
- G—PHYSICS
- G01—MEASURING; TESTING
- G01N—INVESTIGATING OR ANALYSING MATERIALS BY DETERMINING THEIR CHEMICAL OR PHYSICAL PROPERTIES
- G01N2800/00—Detection or diagnosis of diseases
- G01N2800/28—Neurological disorders
- G01N2800/2814—Dementia; Cognitive disorders
- G01N2800/2821—Alzheimer
Definitions
- the present invention relates to a method for detecting amyloid ⁇ oligomer, an amyloid ⁇ oligomer detection apparatus, and an amyloid ⁇ oligomer detection program.
- AD Alzheimer type dementia
- a ⁇ amyloid ⁇ peptide
- Patent Document 2 discloses a method using gel electrophoresis and gel filtration chromatography.
- Patent Documents 3 and 4 disclose a method for detecting an A ⁇ oligomer using an antibody.
- JP-T 2009-54494 JP 2010-168385 A JP-T 2009-54494 Special table 2012-524023 gazette
- the present invention has been made in view of the above-mentioned problems, and an object thereof is to provide a method for detecting an amyloid ⁇ oligomer that can detect an A ⁇ oligomer simply and inexpensively. Another object of the present invention is to provide an amyloid ⁇ oligomer detection apparatus and an amyloid ⁇ oligomer detection program.
- the present invention includes a step of bringing a test sample into contact with thioflavin T, a step of measuring fluorescence of thioflavin T to obtain a time-resolved fluorescence spectrum, a time-resolved fluorescence spectrum from time t1 to t2, and a time from time t3 to t4.
- the present invention relates to a method for detecting an amyloid ⁇ oligomer.
- the present invention is based on the novel finding that the time-resolved fluorescence spectrum derived from ThT when A ⁇ oligomer is fluorescently stained with thioflavin T (hereinafter also referred to as “ThT”) shifts to a lower wavelength side as time passes. Based. This shift to the lower wavelength side is specific to A ⁇ oligomers and is not observed in A ⁇ fibers. Since the detection method of the present invention is based on this novel finding, A ⁇ oligomers can be detected easily and inexpensively.
- Fluorescence ratio s1 (fluorescence intensity at wavelength ⁇ 1 of normalized spectrum at time t3 to t4) / (fluorescence intensity at wavelength ⁇ 1 of normalized spectrum at time t1 to t2)
- the fluorescence ratio s1 is less than 1, it may be determined that amyloid ⁇ oligomer is present, or when the fluorescence ratio s1 is 1 or more, it may be determined that amyloid ⁇ oligomer is not present.
- the fluorescence ratio s1 as an index, more objective determination is possible.
- Fluorescence ratio s2 (fluorescence intensity at wavelength ⁇ 2 of normalized spectrum at time t3 to t4) / (fluorescence intensity at wavelength ⁇ 2 of normalized spectrum at time t1 to t2)
- the peak top wavelengths of both normalized spectra are compared in the determining step, and the peak top wavelength of the normalized spectrum at times t3 to t4 is the peak top wavelength of the normalized spectrum at times t1 to t2.
- the wavelength is shorter than the wavelength, it is determined that the amyloid ⁇ oligomer is present, or the peak top wavelength of the normalized spectrum at time t3 to t4 is the same as or longer than the peak top wavelength of the normalized spectrum at time t1 to t2. It may be determined that the amyloid ⁇ oligomer does not exist.
- the peak top wavelength as an index, more objective determination is possible.
- the present invention includes a step of bringing a test sample into contact with thioflavin T, a step of measuring fluorescence of thioflavin T to obtain a time-resolved fluorescence spectrum, a time-resolved fluorescence spectrum from time t1 to t2, and a time from time t3 to t4.
- the present invention also provides an acquisition means for acquiring time-resolved fluorescence spectrum data of thioflavin T brought into contact with a test sample, a time-resolved fluorescence spectrum at times t1 to t2, and times t3 to t4 from the acquired time-resolved fluorescence spectrum data.
- the time-resolved fluorescence spectrum of each of the above is normalized, a calculation means for calculating the normalized spectrum, a comparison means for comparing both normalized spectra, and whether or not amyloid ⁇ oligomer is present in the test sample based on the comparison result
- an amyloid ⁇ oligomer detection apparatus that includes t1 ⁇ t2 ⁇ t3 ⁇ t4.
- the present invention further provides an acquisition means for acquiring time-resolved fluorescence spectrum data of thioflavin T brought into contact with the test sample, a time-resolved fluorescence spectrum at times t1 to t2 from the acquired time-resolved fluorescence spectrum data, and a time t3.
- the present invention also relates to an amyloid ⁇ oligomer detection program for causing a test sample to function as a determination means for determining whether or not amyloid ⁇ oligomer is present.
- the present invention further relates to a computer-readable recording medium on which the amyloid ⁇ oligomer detection program is recorded.
- a ⁇ oligomers can be detected simply and inexpensively. That is, according to the present invention, identification and detection of A ⁇ oligomers that have conventionally required complicated and expensive reagents can be realized by simple and inexpensive measurement using fluorescent staining.
- A Normalized spectrum of A ⁇ 42 fibers.
- B Normalized spectrum of A ⁇ 42 oligomer. It is a graph which shows the fluorescence ratio s computed from the normalized spectrum of A (beta) 42 fiber and A (beta) 42 oligomer. It is a graph which shows the fluorescence ratio s computed from the normalization spectrum of A (beta) 40 fiber and A (beta) 42 oligomer. It is a graph which shows the fluorescence ratio s computed from the normalization spectrum of A (beta) 40 fiber and A (beta) 42 oligomer. It is a graph which shows the fluorescence ratio s computed from the normalization spectrum of A (beta) 40 fiber and A (beta) 40 oligomer.
- the method for detecting an A ⁇ oligomer includes a step of bringing a test sample into contact with thioflavin T (also referred to as “contact step”), a step of measuring fluorescence of thioflavin T, and obtaining a time-resolved fluorescence spectrum (“ Acquisition step)), and a time-resolved fluorescence spectrum at times t1 to t2 and a time-resolved fluorescence spectrum at times t3 to t4, respectively, to obtain a normalized spectrum (also referred to as a “normalization step”). And a step of determining whether or not A ⁇ oligomer is present in the test sample based on both normalized spectra (also referred to as “determination step”).
- Contact step In the contacting step, the test sample and thioflavin T are brought into contact.
- test sample is not particularly limited as long as it is a sample to be examined for the presence of A ⁇ oligomers.
- Specific examples of the test sample include a brain section, cerebrospinal fluid, blood, and mucous membrane.
- Thioflavin T is a known compound which is represented by the following formula and is also called 4- (3,6-dimethyl-1,3-benzothiazol-3-ium-2-yl) -N, N-dimethylaniline chloride. is there. ThT is a fluorescent dye widely used for amyloid staining (ThT staining).
- ThT reagent for the detection method according to the present embodiment, for example, a commercially available ThT reagent can be used without particular limitation.
- ThT emits fluorescence having a peak wavelength near 480 nm (excitation wavelength is, for example, 405 nm).
- ThT generates photoreactants (fluorescent impurities) that emit fluorescence (excitation wavelength is 350 nm, for example) having a peak wavelength near 440 nm by light irradiation.
- commercially available ThT reagents contain this fluorescent impurity.
- ThT from which this fluorescent impurity has been removed is obtained by, for example, dissolving a mixture of fluorescent impurities and ThT in a polar solvent such as water under light shielding or red light, and repeating liquid-liquid extraction with a nonpolar solvent such as hexane. Thus, it can be obtained in a form dissolved in the polar solvent layer.
- a polar solvent such as water under light shielding or red light
- a nonpolar solvent such as hexane
- a ⁇ oligomers are precursors of A ⁇ fibers, also called protofibrils.
- An A ⁇ oligomer is an aggregate of A ⁇ peptide monomers and has a molecular weight of usually about 9 to 200 kDa.
- the number of A ⁇ peptide monomers contained in the A ⁇ oligomer is usually about 2 to 40.
- the time-resolved fluorescence spectrum of thioflavin T brought into contact with the test sample can be obtained by a known method. Specifically, for example, a fluorescence lifetime measuring apparatus irradiates light having a wavelength of 400 to 420 nm (preferably 405 nm) to ThT brought into contact with a test sample, and emits light (fluorescence) having a wavelength of 420 to 620 nm according to this. It can be obtained by measuring.
- a solution containing a test sample and ThT is used as a measurement sample, and the time is measured using a fluorescence lifetime measuring apparatus (for example, a small fluorescence lifetime measuring apparatus: Quantaurus-Tau type, manufactured by Hamamatsu Photonics Co., Ltd.).
- a fluorescence lifetime measuring apparatus for example, a small fluorescence lifetime measuring apparatus: Quantaurus-Tau type, manufactured by Hamamatsu Photonics Co., Ltd.
- a fluorescence decay curve at an excitation wavelength of 405 nm is measured every 10 nm from a wavelength of 420 nm to 620 nm, and the value of the fluorescence decay curve for a predetermined time (for example, 10 to 20 ns from the start of measurement) is integrated. By plotting this by wavelength, a time-resolved fluorescence spectrum can be obtained.
- the time-resolved fluorescence spectrum is obtained by correcting the background value.
- the background value can be, for example, a measurement value when a similar measurement is performed on a measurement sample that does not include ThT. For example, by subtracting the background value from the measured value of the test sample, a luminescent component (for example, Raman scattered light) unrelated to the test sample can be removed, and the A ⁇ oligomer can be detected with higher accuracy.
- a luminescent component for example, Raman scattered light
- Standardization means dividing the fluorescence intensity of each wavelength by the maximum fluorescence intensity in the time-resolved fluorescence spectrum.
- the maximum value of relative fluorescence intensity in the normalized spectrum after normalization is 1.
- t1, t2, t3, and t4 may be, for example, an elapsed time when the time when the fluorescence measurement is started is set to 0, and the rise time of 5% of the peak value of the fluorescence decay curve measured in the acquisition step. It may be the elapsed time when is set to 0. In the latter case, t1, t2, t3 and t4 are typically on the order of picoseconds (ps) to microseconds ( ⁇ s).
- the rise time of 5% of the peak value of the fluorescence decay curve measured in the acquisition step is set to 0, normally, 0 seconds ⁇ t1 ⁇ t2 ⁇ t3 ⁇ t4 ⁇ 100 nanoseconds (ns It is preferable that 0 second ⁇ t1 ⁇ t2 ⁇ t3 ⁇ t4 ⁇ 50 ns, and more preferably 0 second ⁇ t1 ⁇ t2 ⁇ t3 ⁇ t4 ⁇ 30 ns.
- Step it is determined whether or not A ⁇ oligomer is present in the test sample based on both normalized spectra.
- the normalized spectrum at times t3 to t4 is shifted to the lower wavelength side as compared to the normalized spectrum at times t1 to t2. It shows that. Therefore, in the determination step, determination can be performed by any means as long as it can be determined that the shift is to the low wavelength side.
- determination unit specific examples of the determination unit will be described in detail, but the determination step is not limited to these specific examples.
- Fluorescence ratio s1 (fluorescence intensity at wavelength ⁇ 1 of normalized spectrum at time t3 to t4) / (fluorescence intensity at wavelength ⁇ 1 of normalized spectrum at time t1 to t2)
- the wavelength ⁇ 1 only needs to be longer than the peak top wavelength of the time-resolved fluorescence spectrum.
- ⁇ 1 can be appropriately set within a range of more than 480 nm and not more than 600 nm.
- ⁇ 1 is 500 nm.
- the peak top wavelength is a wavelength at which the relative fluorescence intensity is 1.
- Fluorescence ratio s2 (fluorescence intensity at wavelength ⁇ 2 of normalized spectrum at time t3 to t4) / (fluorescence intensity at wavelength ⁇ 2 of normalized spectrum at time t1 to t2)
- the wavelength ⁇ 2 only needs to be shorter than the peak top wavelength of the time-resolved fluorescence spectrum.
- ⁇ 2 can be appropriately set within a range of 430 nm or more and less than 480 nm.
- ⁇ 2 is 460 nm.
- the third determination means compares the peak top wavelengths of both normalized spectra, and the peak top wavelength of the normalized spectrum at times t3 to t4 is greater than the peak top wavelength of the normalized spectrum at times t1 to t2. If short, it is determined that an A ⁇ oligomer is present, or if the peak top wavelength of the normalized spectrum at time t3 to t4 is the same as or longer than the peak top wavelength of the normalized spectrum at time t1 to t2, Judge that it does not exist.
- the data collection method for detecting an A ⁇ oligomer includes a step of bringing a test sample and thioflavin T into contact with each other, a step of measuring fluorescence of thioflavin T to obtain a time-resolved fluorescence spectrum, and a time t1 to t2. Normalizing the time-resolved fluorescence spectrum and time-resolved fluorescence spectrum at times t3 to t4, respectively, to obtain a normalized spectrum. Data (normalized spectrum at time t1 to t2, normalized spectrum at time t3 to t4) collected by the method can be used to determine whether or not A ⁇ oligomers are present in the test sample.
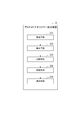
- FIG. 1 is a schematic diagram illustrating a hardware configuration of an amyloid ⁇ oligomer detection apparatus D according to an embodiment.
- FIG. 2 is a schematic diagram illustrating a functional configuration of an A ⁇ oligomer detection apparatus D according to an embodiment. is there.
- the A ⁇ oligomer detection device D is physically a main storage device such as a CPU D11, ROM D12, and RAM D13, an input device D14 such as a keyboard and a mouse, and an output device D15 such as a display.
- the computer is configured as a normal computer including a communication module D16 such as a network card for transmitting and receiving data to and from other devices such as the imaging device C, an auxiliary storage device D17 such as a hard disk, and the like.
- Each function of the A ⁇ oligomer detection apparatus D to be described later is such that an input device D14 and an output device D15 are controlled under the control of the CPU D11 by loading predetermined computer software on hardware such as the CPU D11, ROM D12, RAM D13, and the like. This is realized by operating the communication module D16 and reading and writing data in the main storage devices D12 and D13 and the auxiliary storage device D17.
- the A ⁇ oligomer detection device D includes an acquisition unit D1, a calculation unit D2, a comparison unit D3, a determination unit D4, and a display unit D5 as functional components.
- the acquisition means D1 acquires time-resolved fluorescence spectrum data obtained with a fluorescence lifetime measuring device (not shown).
- the calculation means D2 calculates the above-mentioned normalized spectrum from the acquired time-resolved fluorescence spectrum data.
- the comparing means D3 compares the calculated normalized spectrum at times t1 to t2 with the normalized spectrum at times t3 to t4.
- the determination means D4 determines whether or not A ⁇ oligomer is detected based on the comparison result.
- the display means D5 displays the determined result.
- the A ⁇ oligomer detection program causes a computer to function as the acquisition unit D1, the calculation unit D2, the comparison unit D3, the determination unit D4, and the display unit D5 described above.
- the computer By causing the computer to read the A ⁇ oligomer detection program, the computer operates as the A ⁇ oligomer detection apparatus D.
- the A ⁇ oligomer detection program is provided by being recorded on a computer-readable recording medium, for example.
- the recording medium may be a non-temporary recording medium. Examples of the recording medium include a recording medium such as a flexible disk, a CD, and a DVD, a recording medium such as a ROM, and a semiconductor memory.
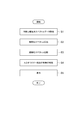
- FIG. 3 is a flowchart of the A ⁇ oligomer detection method.
- the acquisition unit D1 acquires time-resolved fluorescence spectrum data from the fluorescence measurement device.
- the comparison unit D3 compares the normalized spectrum of the times t1 to t2 calculated in the calculation step S2 with the normalized spectrum of the times t3 to t4, and extracts the result.
- the determination means D4 determines whether or not A ⁇ oligomer is detected (whether or not A ⁇ oligomer is present in the test sample) based on the comparison result extracted in the comparison step S3.
- Display step S5 Next, the display means D5 displays the result determined in determination step S4. For example, whether or not A ⁇ oligomer is present in the test sample is displayed by the display means D5.
- Example 1 Discrimination between A ⁇ oligomers and A ⁇ fibers 1
- a ⁇ oligomer was prepared by the following procedure.
- a ⁇ 1-42 (trade name: Amyloid ⁇ -protein Human, 1-42, manufactured by Peptide Institute, Inc.) was dissolved in dimethyl sulfoxide to a concentration of 5 mmol / L, and further ham medium (containing L-glutamine, phenol). was diluted so that the concentration of A ⁇ 1-42 was 100 ⁇ mol / L.
- the obtained A ⁇ preparation was incubated at 4 ° C. for 24 hours using an incubator.
- a sample containing A ⁇ oligomer (A ⁇ 42 oligomer) was prepared by performing the above incubation.
- a ⁇ fibrils were prepared by the following procedure. First, A ⁇ 1-42 is dissolved in dimethyl sulfoxide so as to have a concentration of 5 mmol / L, and further ham medium (containing L-glutamine, not containing phenol red) is used so that the concentration of A ⁇ 1-42 is 100 ⁇ mol / L. Diluted. The obtained A ⁇ preparation was incubated at 37 ° C. for 24 hours using an incubator. A sample containing A ⁇ fibers (A ⁇ 42 fibers) was prepared by performing the above incubation.
- ThT staining A ThT solution was prepared by dissolving 3.4 mg of ThT (manufactured by AAT Bioquest Inc.) in 20 mL of pure water. Since this aqueous solution contains fluorescent impurities, add the aqueous solution to a separatory funnel, add 50 mL of hexane, mix vigorously and perform the extraction operation, then use the ThT solution from the cock below the separatory funnel. Was taken out. A part of this ThT solution was placed in a cuvette, and the fluorescence intensity at an excitation wavelength of 350 nm and an observation wavelength of 440 nm was measured with a fluorescence spectrophotometer RF-5000 (manufactured by Shimadzu Corporation).
- the above extraction operation was repeated 10 times until the fluorescence intensity reached the background level (until the measured value of fluorescence intensity no longer decreased).
- the ThT aqueous solution used for staining was prepared by diluting the ThT aqueous solution containing no fluorescent impurities prepared by the above operation with distilled water until the ThT concentration reached 100 ⁇ mol / L. 20 ⁇ L of a 100 ⁇ mol / L ThT aqueous solution and 220 ⁇ L of a 50 mmol / L glycine-sodium hydroxide solution (pH 9.0) were added to and mixed with 10 ⁇ L of a sample containing A ⁇ oligomers or A ⁇ fibers, and stained with ThT.
- the stained sample is dispensed into a quartz cell having an inner diameter of 3 mm, and a small fluorescence lifetime measurement apparatus (Quantaurus-Tau type, manufactured by Hamamatsu Photonics Co., Ltd.) is used.
- the fluorescence decay curve was measured every 10 nm from 420 nm to 620 nm. 5% of the peak value of the measured fluorescence decay curve is set to time 0, the measured values of the fluorescence decay curve at time 0 to 2 ns and time 10 to 18 ns are integrated, and the background value is subtracted from the integrated value. Time-resolved fluorescence spectra were obtained by plotting the values by wavelength.
- the background value is a value obtained by measuring a sample obtained by adding and mixing 240 ⁇ L of distilled water to 10 ⁇ L of ham medium (containing L-glutamine, not containing phenol red) in the same manner as described above.
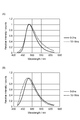
- FIG. 4 shows the normalized spectra obtained in this manner at time 0 to 2 ns and time 10 to 18 ns, respectively.
- 4A is a normalized spectrum of A ⁇ 42 fiber
- FIG. 4B is a normalized spectrum of A ⁇ 42 oligomer. Comparing the normalized spectrum at time 0 to 2 ns with the normalized spectrum at time 10 to 18 ns, A ⁇ fibers show a slight long wavelength shift, whereas A ⁇ oligomers have a clear short wavelength shift. I understand.
- a ⁇ oligomers were identified by the following discriminant.
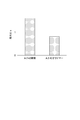
- the fluorescence ratio s thus calculated is shown in FIG. As shown in FIG. 5, the fluorescence ratio s of A ⁇ fibers (A ⁇ 42 fibers) is 1 or more, whereas the fluorescence ratio s of A ⁇ oligomers (A ⁇ 42 oligomers) is less than 1. That is, it is identified as an A ⁇ oligomer when the fluorescence ratio s is less than 1.
- the present inventors have confirmed that the above discrimination method is generally applicable.
- Example 2 Discrimination between A ⁇ oligomer and A ⁇ fiber 2
- Example 2 was carried out by the same procedure as in Example 1 except that preparation of A ⁇ fibers and fluorescence measurement were carried out by the following method.
- a ⁇ 1-40 (trade name: Amyloid ⁇ -protein Human, 1-40, manufactured by Peptide Laboratories, Inc.) was dissolved with dimethyl sulfoxide to a concentration of 5 mmol / L, and further 50 mM sodium phosphate buffer (pH 7. 4) was used to dilute the A ⁇ 1-40 concentration to 100 ⁇ mol / L.
- the obtained A ⁇ preparation was incubated at 37 ° C. for 10 days using an incubator.
- a sample containing A ⁇ fibers (A ⁇ 40 fibers) was prepared by performing the above incubation.
- the stained sample is dispensed into a quartz cell having an inner diameter of 3 mm, and a small fluorescence lifetime measurement apparatus (Quantaurus-Tau type, manufactured by Hamamatsu Photonics Co., Ltd.) is used.
- the fluorescence decay curve was measured every 10 nm from 420 nm to 620 nm. 5% of the peak value of the measured fluorescence decay curve is set to time 0, the measured values of the fluorescence decay curve at time 0 to 2 ns and time 10 to 18 ns are integrated, and the background value is subtracted from the integrated value. Time-resolved fluorescence spectra were obtained by plotting the values by wavelength.
- the background value is a value obtained by measuring a sample prepared by adding and mixing 240 ⁇ L of distilled water to 10 ⁇ L of 50 mM sodium phosphate buffer (pH 7.4) in the same manner as described above.
- the fluorescence ratio s was calculated in the same manner as in Example 1.
- the calculated fluorescence ratio s is shown in FIG.
- the fluorescence ratio s of A ⁇ fibers is 1 or more even if the types of A ⁇ monomers are different. That is, it was shown that A ⁇ oligomers (A ⁇ 42 oligomers) can be identified by the same procedure as in Example 1 even when A ⁇ fibers composed of different types of A ⁇ monomers are present.
- Example 3 Discrimination between A ⁇ oligomer and A ⁇ fiber 3
- Example 3 was carried out in the same manner as in Example 1 except that A ⁇ oligomer preparation, A ⁇ fiber preparation and fluorescence measurement were carried out by the following method.
- a ⁇ 1-40 (trade name: Amyloid ⁇ -protein Human, 1-40, manufactured by Peptide Laboratories, Inc.) was dissolved with dimethyl sulfoxide to a concentration of 5 mmol / L, and further 50 mM sodium phosphate buffer (pH 7. 4) was used to dilute the A ⁇ 1-40 concentration to 100 ⁇ mol / L.
- the obtained A ⁇ preparation was incubated at 37 ° C. for 1 day using an incubator.
- a sample containing A ⁇ oligomer (A ⁇ 40 oligomer) was prepared by performing the incubation.
- a ⁇ 1-40 (trade name: Amyloid ⁇ -protein Human, 1-40, manufactured by Peptide Laboratories, Inc.) was dissolved with dimethyl sulfoxide to a concentration of 5 mmol / L, and further 50 mM sodium phosphate buffer (pH 7. 4) was used to dilute the A ⁇ 1-40 concentration to 100 ⁇ mol / L.
- the obtained A ⁇ preparation was incubated at 37 ° C. for 7 days using an incubator.
- a sample containing A ⁇ fibers (A ⁇ 40 fibers) was prepared by performing the above incubation.
- the stained sample is dispensed into a quartz cell having an inner diameter of 3 mm, and a small fluorescence lifetime measurement apparatus (Quantaurus-Tau type, manufactured by Hamamatsu Photonics Co., Ltd.) is used.
- the fluorescence decay curve was measured every 5 nm from 420 nm to 620 nm. 5% of the peak value of the measured fluorescence decay curve is set to time 0, the measured values of the fluorescence decay curve at time 0 to 2 ns and time 10 to 18 ns are integrated, and the background value is subtracted from the integrated value. Time-resolved fluorescence spectra were obtained by plotting the values by wavelength.
- the background value was the same as above for a sample obtained by adding 240 ⁇ L of 50 mmol / L glycine-sodium hydroxide solution (pH 9.0) to 10 ⁇ L of 50 mM sodium phosphate buffer (pH 7.4) containing 0.8% DMSO. It is the value obtained by measuring by the method.
- the fluorescence ratio s was calculated in the same manner as in Example 1.
- the calculated fluorescence ratio s is shown in FIG.
- the fluorescence ratio s of A ⁇ fibers (A ⁇ 40 fibers) is 1 or more, whereas the fluorescence ratio s of A ⁇ oligomers (A ⁇ 40 oligomers) is less than 1. That is, it was shown that A ⁇ oligomers (A ⁇ 40 oligomers) can be identified by the same procedure as in Example 1.
- D ... Amyloid ⁇ oligomer detection device D1 ... Acquisition means, D2 ... Calculation means, D3 ... Comparison means, D4 ... Determination means, D5 ... Display means, D11 ... CPU, D12 ... ROM, D13 ... RAM, D14 ... Input device, D15: output device, D16: communication module, D17: auxiliary storage device.
Landscapes
- Health & Medical Sciences (AREA)
- Life Sciences & Earth Sciences (AREA)
- Immunology (AREA)
- Chemical & Material Sciences (AREA)
- Engineering & Computer Science (AREA)
- Physics & Mathematics (AREA)
- Biomedical Technology (AREA)
- General Physics & Mathematics (AREA)
- Analytical Chemistry (AREA)
- Pathology (AREA)
- General Health & Medical Sciences (AREA)
- Biochemistry (AREA)
- Urology & Nephrology (AREA)
- Molecular Biology (AREA)
- Hematology (AREA)
- Nuclear Medicine, Radiotherapy & Molecular Imaging (AREA)
- Medicinal Chemistry (AREA)
- Neurosurgery (AREA)
- Cell Biology (AREA)
- Microbiology (AREA)
- Biotechnology (AREA)
- Neurology (AREA)
- Food Science & Technology (AREA)
- Proteomics, Peptides & Aminoacids (AREA)
- Chemical Kinetics & Catalysis (AREA)
- Optics & Photonics (AREA)
- Investigating, Analyzing Materials By Fluorescence Or Luminescence (AREA)
- Investigating Or Analysing Materials By The Use Of Chemical Reactions (AREA)
Abstract
本発明は、被験試料とチオフラビンTとを接触させるステップと、チオフラビンTの蛍光を測定し、時間分解蛍光スペクトルを得るステップと、時間t1~t2の時間分解蛍光スペクトル、及び時間t3~t4の時間分解蛍光スペクトルをそれぞれ規格化し、規格化スペクトルを得るステップと、両規格化スペクトルに基づいて、前記被験試料にアミロイドβオリゴマーが存在するか否かを判定するステップと、を含み、t1<t2≦t3<t4であり、時間t1~t2の規格化スペクトルと比較して、時間t3~t4の規格化スペクトルが低波長側にシフトしていることが、前記被験試料にアミロイドβオリゴマーが存在することを示す、アミロイドβオリゴマーの検出方法に関する。
Description
本発明は、アミロイドβオリゴマーの検出方法、アミロイドβオリゴマー検出装置及びアミロイドβオリゴマー検出プログラムに関する。
社会的問題となっているアルツハイマー型認知症(以下、「AD」と略すこともある。)の研究においては、根本的治療の観点からアミロイドβペプチド(以下、「Aβ」と略すこともある。)が診断及び治療のターゲットとして注目を浴びている。これは、ADにおいて、Aβの脳内蓄積が最初にあらわれる病態だからである。Aβは蓄積及び凝集化することで神経細胞に悪影響を与えるため、診断及び治療の研究では、Aβの濃度又は凝集度に関する情報を測定することが重要となる。
最近の研究から、Aβの神経細胞に対する毒性は、Aβが凝集したAβ線維よりむしろ、Aβオリゴマーと呼ばれる凝集前駆体に由来することが明らかとなってきている(例えば、特許文献1参照)。
Aβオリゴマーを検出する方法として、例えば、特許文献2には、ゲル電気泳動及びゲルろ過クロマトグラフィーによる方法が開示されている。また、特許文献3及び4には、抗体を用いたAβオリゴマーの検出方法が開示されている。
従来のAβオリゴマーを検出する方法は、計測に手間と時間がかかったり、また高価な試薬が必要となるなど、未だ充分なものではなかった。
例えば、特許文献2に記載のようなゲル電気泳動及びゲルろ過クロマトグラフィーによる方法では、Aβオリゴマーか否かの識別は容易であるが、計測に手間と時間がかかる、Aβオリゴマーの分布を画像化することができない等の問題がある。
また、特許文献3及び4に記載のような抗体を使用する方法では、抗体反応を利用していることから高感度なAβオリゴマー検出が可能となるが、実験操作が煩雑で特殊な抗体を必要とする。また測定に時間も必要なことから、簡便で安価な計測法とは言えない。
本発明は、上述の問題点に鑑み、簡便かつ安価にAβオリゴマーを検出できるアミロイドβオリゴマーの検出方法を提供することを目的とする。本発明はまた、アミロイドβオリゴマー検出装置及びアミロイドβオリゴマー検出プログラムを提供することも目的とする。
本発明は、被験試料とチオフラビンTとを接触させるステップと、チオフラビンTの蛍光を測定し、時間分解蛍光スペクトルを得るステップと、時間t1~t2の時間分解蛍光スペクトル、及び時間t3~t4の時間分解蛍光スペクトルをそれぞれ規格化し、規格化スペクトルを得るステップと、両規格化スペクトルに基づいて、上記被験試料にアミロイドβオリゴマーが存在するか否かを判定するステップと、を含み、t1<t2≦t3<t4であり、時間t1~t2の規格化スペクトルと比較して、時間t3~t4の規格化スペクトルが低波長側にシフトしていることが、上記被験試料にアミロイドβオリゴマーが存在することを示す、アミロイドβオリゴマーの検出方法に関する。
本発明は、AβオリゴマーをチオフラビンT(以下、「ThT」ともいう。)で蛍光染色したときのThT由来の時間分解蛍光スペクトルが、時間の経過と共に低波長側にシフトする、という新規な知見に基づく。この低波長側へのシフトは、Aβオリゴマーに特異的であり、Aβ線維では観察されない。本発明の検出方法は、この新規な知見に基づいているため、簡便かつ安価にAβオリゴマーを検出することができる。
上記検出方法は、判定するステップにおいて、両規格化スペクトルの波長λ1(ただし、λ1>480nm)における蛍光強度の値から下記式に従い蛍光比s1を算出し、
蛍光比s1=(時間t3~t4の規格化スペクトルの波長λ1における蛍光強度)/(時間t1~t2の規格化スペクトルの波長λ1における蛍光強度)
蛍光比s1が1未満の場合、アミロイドβオリゴマーが存在すると判定する、又は蛍光比s1が1以上の場合、アミロイドβオリゴマーが存在しないと判定するものであってよい。蛍光比s1を指標とすることにより、より客観的な判定が可能となる。
蛍光比s1=(時間t3~t4の規格化スペクトルの波長λ1における蛍光強度)/(時間t1~t2の規格化スペクトルの波長λ1における蛍光強度)
蛍光比s1が1未満の場合、アミロイドβオリゴマーが存在すると判定する、又は蛍光比s1が1以上の場合、アミロイドβオリゴマーが存在しないと判定するものであってよい。蛍光比s1を指標とすることにより、より客観的な判定が可能となる。
上記検出方法は、判定するステップにおいて、両規格化スペクトルの波長λ2(ただし、λ2<480nm)における蛍光強度の値から下記式に従い蛍光比s2を算出し、
蛍光比s2=(時間t3~t4の規格化スペクトルの波長λ2における蛍光強度)/(時間t1~t2の規格化スペクトルの波長λ2における蛍光強度)
蛍光比s2が1を超える場合、アミロイドβオリゴマーが存在すると判定する、又は蛍光比s2が1以下の場合、アミロイドβオリゴマーが存在しないと判定するものであってよい。蛍光比s2を指標とすることにより、より客観的な判定が可能となる。
蛍光比s2=(時間t3~t4の規格化スペクトルの波長λ2における蛍光強度)/(時間t1~t2の規格化スペクトルの波長λ2における蛍光強度)
蛍光比s2が1を超える場合、アミロイドβオリゴマーが存在すると判定する、又は蛍光比s2が1以下の場合、アミロイドβオリゴマーが存在しないと判定するものであってよい。蛍光比s2を指標とすることにより、より客観的な判定が可能となる。
上記検出方法は、判定するステップにおいて、両規格化スペクトルのピークトップの波長を比較し、時間t3~t4の規格化スペクトルのピークトップの波長が、時間t1~t2の規格化スペクトルのピークトップの波長よりも短い場合、アミロイドβオリゴマーが存在すると判定する、又は時間t3~t4の規格化スペクトルのピークトップの波長が、時間t1~t2の規格化スペクトルのピークトップの波長と同じか若しくは長い場合、アミロイドβオリゴマーが存在しないと判定するものであってよい。ピークトップの波長を指標とすることにより、より客観的な判定が可能となる。
本発明は、被験試料とチオフラビンTとを接触させるステップと、チオフラビンTの蛍光を測定し、時間分解蛍光スペクトルを得るステップと、時間t1~t2の時間分解蛍光スペクトル、及び時間t3~t4の時間分解蛍光スペクトルをそれぞれ規格化し、規格化スペクトルを得るステップと、を含む、アミロイドβオリゴマーの検出のためのデータ収集方法であって、t1<t2≦t3<t4であり、時間t1~t2の規格化スペクトルと比較して、時間t3~t4の規格化スペクトルが低波長側にシフトしていることが、上記被験試料にアミロイドβオリゴマーが存在することを示す、データ収集方法と捉えることもできる。
本発明はまた、被験試料に接触させたチオフラビンTの時間分解蛍光スペクトルデータを取得する取得手段と、取得した時間分解蛍光スペクトルデータから、時間t1~t2の時間分解蛍光スペクトル、及び時間t3~t4の時間分解蛍光スペクトルをそれぞれ規格化し、規格化スペクトルを算出する算出手段と、両規格化スペクトルを比較する比較手段と、比較結果に基づき、上記被験試料にアミロイドβオリゴマーが存在するか否かを判定する判定手段と、を備え、t1<t2≦t3<t4である、アミロイドβオリゴマー検出装置にも関する。
本発明はさらに、コンピュータを、被験試料に接触させたチオフラビンTの時間分解蛍光スペクトルデータを取得する取得手段、取得した時間分解蛍光スペクトルデータから、時間t1~t2の時間分解蛍光スペクトル、及び時間t3~t4の時間分解蛍光スペクトルをそれぞれ規格化し、規格化スペクトルを算出する算出手段(ただし、t1<t2≦t3<t4である)、両規格化スペクトルを比較する比較手段、比較結果に基づき、上記被験試料にアミロイドβオリゴマーが存在するか否かを判定する判定手段、として機能させるためのアミロイドβオリゴマー検出プログラムにも関する。
本発明はさらにまた、上記アミロイドβオリゴマー検出プログラムが記録されたコンピュータ読み取り可能な記録媒体にも関する。
本発明によれば、簡便かつ安価にAβオリゴマーを検出できる。すなわち、本発明によれば、従来煩雑で高価な試薬類を必要としたAβオリゴマーの識別及び検出を、簡便かつ安価な蛍光染色による計測によって実現できる。
以下、本発明を実施するための形態について詳細に説明する。ただし、本発明は以下の実施形態に限定されるものではない。
〔アミロイドβオリゴマーの検出方法〕
本実施形態に係るAβオリゴマーの検出方法は、被験試料とチオフラビンTとを接触させるステップ(「接触ステップ」ともいう。)と、チオフラビンTの蛍光を測定し、時間分解蛍光スペクトルを得るステップ(「取得ステップ」ともいう。)と、時間t1~t2の時間分解蛍光スペクトル、及び時間t3~t4の時間分解蛍光スペクトルをそれぞれ規格化し、規格化スペクトルを得るステップ(「規格化ステップ」ともいう。)と、両規格化スペクトルに基づいて、被験試料にAβオリゴマーが存在するか否かを判定するステップ(「判定ステップ」ともいう。)と、を含む。
本実施形態に係るAβオリゴマーの検出方法は、被験試料とチオフラビンTとを接触させるステップ(「接触ステップ」ともいう。)と、チオフラビンTの蛍光を測定し、時間分解蛍光スペクトルを得るステップ(「取得ステップ」ともいう。)と、時間t1~t2の時間分解蛍光スペクトル、及び時間t3~t4の時間分解蛍光スペクトルをそれぞれ規格化し、規格化スペクトルを得るステップ(「規格化ステップ」ともいう。)と、両規格化スペクトルに基づいて、被験試料にAβオリゴマーが存在するか否かを判定するステップ(「判定ステップ」ともいう。)と、を含む。
(接触ステップ)
接触ステップでは、被験試料とチオフラビンTとを接触させる。接触させる方法には特に制限はなく、例えば、アミロイドをThTで蛍光染色する際に用いられる方法を採用することができる。
接触ステップでは、被験試料とチオフラビンTとを接触させる。接触させる方法には特に制限はなく、例えば、アミロイドをThTで蛍光染色する際に用いられる方法を採用することができる。
被験試料は、Aβオリゴマーの存在の有無を調べたい試料であれば特に制限されるものではない。被験試料の具体例としては、脳切片、脳脊髄液、血液、粘膜が挙げられる。
チオフラビンTは、下記式で表され、4-(3,6-ジメチル-1,3-ベンゾチアゾール-3-イウム-2-イル)-N,N-ジメチルアニリンクロリドとも称される公知の化合物である。ThTは、アミロイドの染色(ThT染色)に汎用されている蛍光色素である。

本実施形態に係る検出方法には、例えば、市販されているThT試薬を特に制限なく使用することができる。
ThTは、480nm付近にピーク波長を有する蛍光(励起波長は、例えば、405nm)を発する。一方、ThTは、光照射により、440nm付近にピーク波長を有する蛍光(励起波長は、例えば、350nm)を発する光反応物(蛍光性不純物)を生じる。市販されているThT試薬は、この蛍光性不純物を含むものである。
Aβオリゴマーの検出感度をより一層向上させる観点からは、本実施形態に係る検出方法には、この蛍光性不純物が除去されたThTを使用することが好ましい。蛍光性不純物が除去されたThTは、例えば、遮光下又は赤色光下で、蛍光性不純物とThTの混合物を水等の極性溶媒に溶解し、ヘキサン等の無極性溶媒で液液抽出を繰り返すことにより、極性溶媒層に溶解した形態で得ることができる。
Aβオリゴマーは、プロトフィブリルとも呼ばれるAβ線維の前駆体である。Aβオリゴマーは、Aβペプチドモノマーが集まった凝集体であり、分子量は通常9~200kDa程度である。Aβオリゴマーに含まれるAβペプチドモノマーの数は、通常、2~40程度である。
(取得ステップ)
取得ステップでは、被験試料と接触させたチオフラビンTの蛍光を測定し、時間分解蛍光スペクトルを得る。
取得ステップでは、被験試料と接触させたチオフラビンTの蛍光を測定し、時間分解蛍光スペクトルを得る。
被験試料と接触させたチオフラビンTの時間分解蛍光スペクトルは、公知の手法により得ることができる。具体的には、例えば、蛍光寿命測定装置により、被験試料と接触させたThTに波長400~420nm(好ましくは405nm)の光を照射し、これに応じた波長420~620nmの発光(蛍光)を測定することにより得ることができる。より具体的には、例えば、被験試料とThTとを含む溶液を測定サンプルとし、蛍光寿命測定装置(例えば、小型蛍光寿命測定装置:Quantaurus-Tau型、浜松ホトニクス株式会社製)を用いて、時間相関単光子係数法により、励起波長405nmにおける蛍光減衰曲線を波長420nmから620nmまで10nmおきに測定し、所定の時間(例えば、測定開始から10~20ns等)の蛍光減衰曲線の値を積算し、これを波長別にプロットすることで時間分解蛍光スペクトルを得ることができる。
時間分解蛍光スペクトルは、バックグラウンド値を補正したものであることが好ましい。バックグラウンド値は、例えば、ThTを含まない測定サンプルに対して同様の測定を行ったときの測定値とすることができる。例えば、被験試料の測定値からバックグラウンド値を引くことによって、被験試料とは無関係の発光成分(例えば、ラマン散乱光)を除去することができ、より精度高くAβオリゴマーを検出することができる。
(規格化ステップ)
規格化ステップでは、時間t1~t2の時間分解蛍光スペクトル、及び時間t3~t4の時間分解蛍光スペクトルをそれぞれ規格化し、規格化スペクトルを得る。ここで、t1<t2≦t3<t4である。
規格化ステップでは、時間t1~t2の時間分解蛍光スペクトル、及び時間t3~t4の時間分解蛍光スペクトルをそれぞれ規格化し、規格化スペクトルを得る。ここで、t1<t2≦t3<t4である。
規格化は、時間分解蛍光スペクトルにおける最大の蛍光強度で各波長の蛍光強度を除することを意味する。規格化後の規格化スペクトルにおける相対蛍光強度の最大値は1である。
t1、t2、t3及びt4は、例えば、蛍光測定を開始した時刻を0としたときの経過時間であってもよく、取得ステップで測定された蛍光減衰曲線のピーク値の5%の立ち上がりの時刻を0としたときの経過時間であってもよい。後者の場合、t1、t2、t3及びt4は、通常、ピコ秒(ps)~マイクロ秒(μs)のオーダーである。具体的には、例えば、取得ステップで測定された蛍光減衰曲線のピーク値の5%の立ち上がりの時刻を0としたとき、通常、0秒≦t1<t2≦t3<t4<100ナノ秒(ns)であり、0秒≦t1<t2≦t3<t4<50nsであることが好ましく、0秒≦t1<t2≦t3<t4<30nsであることがより好ましい。
(判定ステップ)
判定ステップでは、両規格化スペクトルに基づいて、被験試料にAβオリゴマーが存在するか否かを判定する。
判定ステップでは、両規格化スペクトルに基づいて、被験試料にAβオリゴマーが存在するか否かを判定する。
本実施形態に係る検出方法では、時間t1~t2の規格化スペクトルと比較して、時間t3~t4の規格化スペクトルが低波長側にシフトしていることが、被験試料にAβオリゴマーが存在することを示す。したがって、判定ステップでは、低波長側にシフトしていることを判定できる限り、任意の手段によって判定を行うことができる。以下、判定手段の具体例について詳細に説明するが、判定ステップはこれら具体例に限定されるものではない。
第1の判定手段は、両規格化スペクトルの波長λ1(ただし、λ1>480nm)における蛍光強度の値から下記式に従い蛍光比s1を算出し、
蛍光比s1=(時間t3~t4の規格化スペクトルの波長λ1における蛍光強度)/(時間t1~t2の規格化スペクトルの波長λ1における蛍光強度)
蛍光比s1が1未満の場合、Aβオリゴマーが存在すると判定する、又は蛍光比s1が1以上の場合、Aβオリゴマーが存在しないと判定する。
蛍光比s1=(時間t3~t4の規格化スペクトルの波長λ1における蛍光強度)/(時間t1~t2の規格化スペクトルの波長λ1における蛍光強度)
蛍光比s1が1未満の場合、Aβオリゴマーが存在すると判定する、又は蛍光比s1が1以上の場合、Aβオリゴマーが存在しないと判定する。
波長λ1は、時間分解蛍光スペクトルのピークトップの波長より長い波長であればよい。通常は、λ1は480nm超600nm以下の範囲内で適宜設定することができる。λ1は例えば500nmである。ピークトップの波長とは、相対蛍光強度が1になる波長である。
第2の判定手段は、両規格化スペクトルの波長λ2(ただし、λ2<480nm)における蛍光強度の値から下記式に従い蛍光比s2を算出し、
蛍光比s2=(時間t3~t4の規格化スペクトルの波長λ2における蛍光強度)/(時間t1~t2の規格化スペクトルの波長λ2における蛍光強度)
蛍光比s2が1を超える場合、Aβオリゴマーが存在すると判定する、又は蛍光比s2が1以下の場合、Aβオリゴマーが存在しないと判定する。
蛍光比s2=(時間t3~t4の規格化スペクトルの波長λ2における蛍光強度)/(時間t1~t2の規格化スペクトルの波長λ2における蛍光強度)
蛍光比s2が1を超える場合、Aβオリゴマーが存在すると判定する、又は蛍光比s2が1以下の場合、Aβオリゴマーが存在しないと判定する。
波長λ2は、時間分解蛍光スペクトルのピークトップの波長より短い波長であればよい。通常は、λ2は430nm以上480nm未満の範囲内で適宜設定することができる。λ2は例えば460nmである。
第3の判定手段は、両規格化スペクトルのピークトップの波長を比較し、時間t3~t4の規格化スペクトルのピークトップの波長が、時間t1~t2の規格化スペクトルのピークトップの波長よりも短い場合、Aβオリゴマーが存在すると判定する、又は時間t3~t4の規格化スペクトルのピークトップの波長が、時間t1~t2の規格化スペクトルのピークトップの波長と同じか若しくは長い場合、Aβオリゴマーが存在しないと判定する。
〔アミロイドβオリゴマーの検出のためのデータ収集方法〕
本実施形態に係るAβオリゴマーの検出のためのデータ収集方法は、被験試料とチオフラビンTとを接触させるステップと、チオフラビンTの蛍光を測定し、時間分解蛍光スペクトルを得るステップと、時間t1~t2の時間分解蛍光スペクトル、及び時間t3~t4の時間分解蛍光スペクトルをそれぞれ規格化し、規格化スペクトルを得るステップと、を含む。当該方法により収集されたデータ(時間t1~t2の規格化スペクトル、時間t3~t4の規格化スペクトル)は、被験試料にAβオリゴマーが存在するか否かの判定に使用できる。
本実施形態に係るAβオリゴマーの検出のためのデータ収集方法は、被験試料とチオフラビンTとを接触させるステップと、チオフラビンTの蛍光を測定し、時間分解蛍光スペクトルを得るステップと、時間t1~t2の時間分解蛍光スペクトル、及び時間t3~t4の時間分解蛍光スペクトルをそれぞれ規格化し、規格化スペクトルを得るステップと、を含む。当該方法により収集されたデータ(時間t1~t2の規格化スペクトル、時間t3~t4の規格化スペクトル)は、被験試料にAβオリゴマーが存在するか否かの判定に使用できる。
〔アミロイドβオリゴマー検出装置〕
Aβオリゴマー検出装置の構成について説明する。図1は、一実施形態に係るアミロイドβオリゴマー検出装置Dのハードウェア的構成を示す概要図であり、図2は、一実施形態に係るAβオリゴマー検出装置Dの機能的構成を示す概要図である。
Aβオリゴマー検出装置の構成について説明する。図1は、一実施形態に係るアミロイドβオリゴマー検出装置Dのハードウェア的構成を示す概要図であり、図2は、一実施形態に係るAβオリゴマー検出装置Dの機能的構成を示す概要図である。
図1に示すように、Aβオリゴマー検出装置Dは、物理的には、CPU D11、ROM D12及びRAM D13等の主記憶装置、キーボード及びマウス等の入力デバイスD14、ディスプレイ等の出力デバイスD15、例えば撮像装置C等の他の装置との間でデータの送受信を行うためのネットワークカード等の通信モジュールD16、ハードディスク等の補助記憶装置D17等を含む通常のコンピュータとして構成される。後述するAβオリゴマー検出装置Dの各機能は、CPU D11、ROM D12、RAM D13等のハードウェア上に所定のコンピュータソフトウェアを読み込ませることにより、CPU D11の制御の下で入力デバイスD14、出力デバイスD15、通信モジュールD16を動作させるとともに、主記憶装置D12、D13や補助記憶装置D17におけるデータの読み出し及び書き込みを行うことで実現される。
図2に示すように、Aβオリゴマー検出装置Dは、機能的構成要素として、取得手段D1、算出手段D2、比較手段D3、判定手段D4、及び表示手段D5を備える。
取得手段D1は、蛍光寿命測定装置(図示せず)で得た時間分解蛍光スペクトルデータを取得するものである。算出手段D2は、取得した時間分解蛍光スペクトルデータから、上述の規格化スペクトルを算出するものである。比較手段D3は、算出した時間t1~t2の規格化スペクトルと、時間t3~t4の規格化スペクトルを比較するものである。判定手段D4は、比較した結果に基づき、Aβオリゴマーが検出されたか否かを判定するものである。表示手段D5は、判定した結果を表示するものである。
〔アミロイドβオリゴマー検出プログラム〕
Aβオリゴマー検出プログラムは、コンピュータを、上述した取得手段D1、算出手段D2、比較手段D3、判定手段D4、及び表示手段D5として機能させるものである。コンピュータにAβオリゴマー検出プログラムを読み込ませることにより、コンピュータはAβオリゴマー検出装置Dとして動作する。Aβオリゴマー検出プログラムは、例えば、コンピュータ読み取り可能な記録媒体に記録されて提供される。記録媒体は、非一時的記録媒体であってもよい。記録媒体としては、フレキシブルディスク、CD、DVD等の記録媒体、ROM等の記録媒体、半導体メモリ等が例示される。
Aβオリゴマー検出プログラムは、コンピュータを、上述した取得手段D1、算出手段D2、比較手段D3、判定手段D4、及び表示手段D5として機能させるものである。コンピュータにAβオリゴマー検出プログラムを読み込ませることにより、コンピュータはAβオリゴマー検出装置Dとして動作する。Aβオリゴマー検出プログラムは、例えば、コンピュータ読み取り可能な記録媒体に記録されて提供される。記録媒体は、非一時的記録媒体であってもよい。記録媒体としては、フレキシブルディスク、CD、DVD等の記録媒体、ROM等の記録媒体、半導体メモリ等が例示される。
(アミロイドβオリゴマー検出方法)
Aβオリゴマー検出装置Dにより行われるAβオリゴマー検出方法について説明する。図3はAβオリゴマー検出方法のフローチャートである。Aβオリゴマー検出装置Dにより行われるAβオリゴマー検出方法により、被験試料が、Aβオリゴマーを含むか否かを自動的に精度高く行うことができる。
Aβオリゴマー検出装置Dにより行われるAβオリゴマー検出方法について説明する。図3はAβオリゴマー検出方法のフローチャートである。Aβオリゴマー検出装置Dにより行われるAβオリゴマー検出方法により、被験試料が、Aβオリゴマーを含むか否かを自動的に精度高く行うことができる。
[取得ステップS1]
最初に、取得手段D1が蛍光測定装置から時間分解蛍光スペクトルデータを取得する。
最初に、取得手段D1が蛍光測定装置から時間分解蛍光スペクトルデータを取得する。
[算出ステップS2]
次に、算出手段D2が取得した時間分解蛍光スペクトルデータから規格化スペクトルを算出する。
次に、算出手段D2が取得した時間分解蛍光スペクトルデータから規格化スペクトルを算出する。
[比較ステップS3]
次に、比較手段D3が、算出ステップS2にて算出した時間t1~t2の規格化スペクトルと、時間t3~t4の規格化スペクトルを比較し、その結果を抽出する。
次に、比較手段D3が、算出ステップS2にて算出した時間t1~t2の規格化スペクトルと、時間t3~t4の規格化スペクトルを比較し、その結果を抽出する。
[判定ステップS4]
次に、判定手段D4が、比較ステップS3にて抽出した比較の結果に基づき、Aβオリゴマーが検出されたか否か(被験試料にAβオリゴマーが存在するか否か)を判定する。
次に、判定手段D4が、比較ステップS3にて抽出した比較の結果に基づき、Aβオリゴマーが検出されたか否か(被験試料にAβオリゴマーが存在するか否か)を判定する。
[表示ステップS5]
次に、表示手段D5が、判定ステップS4にて判定した結果を表示する。例えば、被験試料にAβオリゴマーが存在するか否かが表示手段D5によって表示される。
次に、表示手段D5が、判定ステップS4にて判定した結果を表示する。例えば、被験試料にAβオリゴマーが存在するか否かが表示手段D5によって表示される。
以下、本発明を実施例に基づいてより具体的に説明する。ただし、本発明は以下の実施例に限定されるものではない。
〔実施例1:AβオリゴマーとAβ線維の識別1〕
(Aβオリゴマーの調製)
非特許文献(J.Biol.Chem.,2003年,278巻(13号),pp.11612-11622)に記載された方法に基づき、下記手順でAβオリゴマーを調製した。まず、Aβ1-42(商品名:Amyloid β-prоtein Human、1-42、株式会社ペプチド研究所製)をジメチルスルホキシドに5mmol/Lとなるように溶解し、さらにハム培地(L-グルタミン含有、フェノールレッド不含)を用いて、Aβ1-42の濃度が100μmol/Lとなるように希釈した。得られたAβの調製液は、インキュベータを用いて4℃で24時間インキュベートした。上記インキュベートを行うことによって、Aβオリゴマー(Aβ42オリゴマー)を含む試料を調製した。
(Aβオリゴマーの調製)
非特許文献(J.Biol.Chem.,2003年,278巻(13号),pp.11612-11622)に記載された方法に基づき、下記手順でAβオリゴマーを調製した。まず、Aβ1-42(商品名:Amyloid β-prоtein Human、1-42、株式会社ペプチド研究所製)をジメチルスルホキシドに5mmol/Lとなるように溶解し、さらにハム培地(L-グルタミン含有、フェノールレッド不含)を用いて、Aβ1-42の濃度が100μmol/Lとなるように希釈した。得られたAβの調製液は、インキュベータを用いて4℃で24時間インキュベートした。上記インキュベートを行うことによって、Aβオリゴマー(Aβ42オリゴマー)を含む試料を調製した。
(Aβ線維の調製)
上述の非特許文献に記載された方法に基づき、下記手順でAβ線維を調製した。まず、Aβ1-42をジメチルスルホキシドに5mmol/Lとなるように溶解し、さらにハム培地(L-グルタミン含有、フェノールレッド不含)を用いて、Aβ1-42の濃度が100μmol/Lとなるように希釈した。得られたAβの調製液は、インキュベータを用いて37℃で24時間インキュベートした。上記インキュベートを行うことによって、Aβ線維(Aβ42線維)を含む試料を調製した。
上述の非特許文献に記載された方法に基づき、下記手順でAβ線維を調製した。まず、Aβ1-42をジメチルスルホキシドに5mmol/Lとなるように溶解し、さらにハム培地(L-グルタミン含有、フェノールレッド不含)を用いて、Aβ1-42の濃度が100μmol/Lとなるように希釈した。得られたAβの調製液は、インキュベータを用いて37℃で24時間インキュベートした。上記インキュベートを行うことによって、Aβ線維(Aβ42線維)を含む試料を調製した。
(ThT染色)
ThT(AAT Bioquest Inc.社製)3.4mgを20mLの純水に溶解してThT溶液を調製した。この水溶液には蛍光性不純物が含まれているため、水溶液を分液ロートに入れ、ヘキサン50mLを添加し、勢いよく混合して抽出操作を行った後、分液ロートの下方のコックからThT溶液を取り出した。このThT溶液の一部をキュベットに取り、蛍光分光光度計RF-5000(株式会社島津製作所製)で励起波長350nm、観測波長440nmにおける蛍光強度を測定した。上記抽出操作を、蛍光強度がバックグラウンドレベルに達するまで(蛍光強度の測定値がそれ以上低下しなくなるまで)、10回繰り返した。染色に用いるThT水溶液は、上記操作により調製した蛍光性不純物を含まないThT水溶液を、蒸留水でThT濃度が100μmol/Lになるまで希釈して調製した。Aβオリゴマー又はAβ線維を含む試料10μLに、100μmol/LのThT水溶液20μL、50mmol/Lグリシン-水酸化ナトリウム溶液(pH9.0)220μLを添加及び混合し、ThT染色した。
ThT(AAT Bioquest Inc.社製)3.4mgを20mLの純水に溶解してThT溶液を調製した。この水溶液には蛍光性不純物が含まれているため、水溶液を分液ロートに入れ、ヘキサン50mLを添加し、勢いよく混合して抽出操作を行った後、分液ロートの下方のコックからThT溶液を取り出した。このThT溶液の一部をキュベットに取り、蛍光分光光度計RF-5000(株式会社島津製作所製)で励起波長350nm、観測波長440nmにおける蛍光強度を測定した。上記抽出操作を、蛍光強度がバックグラウンドレベルに達するまで(蛍光強度の測定値がそれ以上低下しなくなるまで)、10回繰り返した。染色に用いるThT水溶液は、上記操作により調製した蛍光性不純物を含まないThT水溶液を、蒸留水でThT濃度が100μmol/Lになるまで希釈して調製した。Aβオリゴマー又はAβ線維を含む試料10μLに、100μmol/LのThT水溶液20μL、50mmol/Lグリシン-水酸化ナトリウム溶液(pH9.0)220μLを添加及び混合し、ThT染色した。
(蛍光測定)
染色された試料を、内径3mmの石英セルに分注し、小型蛍光寿命測定装置(Quantaurus-Tau型、浜松ホトニクス株式会社製)を用い、時間相関単光子係数法を用いて、励起波長405nmにおける蛍光減衰曲線を、420nmから620nmまで10nmおきに測定した。測定された蛍光減衰曲線のピーク値の5%の立ち上がり部分を時刻0とし、時間0~2ns及び時間10~18nsの蛍光減衰曲線の測定値をそれぞれ積算し、積算値からバックグラウンド値を引いた値を波長別にプロットすることで時間分解蛍光スペクトルを得た。バックグラウンド値は、ハム培地(L-グルタミン含有、フェノールレッド不含)10μLに蒸留水240μLを添加及び混合した試料を上記と同様の方法で測定して得られた値である。
染色された試料を、内径3mmの石英セルに分注し、小型蛍光寿命測定装置(Quantaurus-Tau型、浜松ホトニクス株式会社製)を用い、時間相関単光子係数法を用いて、励起波長405nmにおける蛍光減衰曲線を、420nmから620nmまで10nmおきに測定した。測定された蛍光減衰曲線のピーク値の5%の立ち上がり部分を時刻0とし、時間0~2ns及び時間10~18nsの蛍光減衰曲線の測定値をそれぞれ積算し、積算値からバックグラウンド値を引いた値を波長別にプロットすることで時間分解蛍光スペクトルを得た。バックグラウンド値は、ハム培地(L-グルタミン含有、フェノールレッド不含)10μLに蒸留水240μLを添加及び混合した試料を上記と同様の方法で測定して得られた値である。
(規格化スペクトル)
各時間分解蛍光スペクトルについて、蛍光強度の最大値で各波長の蛍光強度を除して、蛍光強度の最大値が1となるように規格化を行った。
各時間分解蛍光スペクトルについて、蛍光強度の最大値で各波長の蛍光強度を除して、蛍光強度の最大値が1となるように規格化を行った。
(判定)
このようにして得られた時間0~2ns及び時間10~18nsの規格化スペクトルをそれぞれ図4に示した。図4(A)は、Aβ42線維の規格化スペクトルであり、図4(B)は、Aβ42オリゴマーの規格化スペクトルである。時間0~2nsの規格化スペクトルと時間10~18nsの規格化スペクトルを比較すると、Aβ線維ではわずかな長波長シフトが見られるのに対して、Aβオリゴマーでは明らかな短波長シフトが生じているのが分かる。
このようにして得られた時間0~2ns及び時間10~18nsの規格化スペクトルをそれぞれ図4に示した。図4(A)は、Aβ42線維の規格化スペクトルであり、図4(B)は、Aβ42オリゴマーの規格化スペクトルである。時間0~2nsの規格化スペクトルと時間10~18nsの規格化スペクトルを比較すると、Aβ線維ではわずかな長波長シフトが見られるのに対して、Aβオリゴマーでは明らかな短波長シフトが生じているのが分かる。
上記短波長シフトに基づいて、下記判別式によりAβオリゴマーを識別した。時間0~2nsの規格化スペクトルのピークトップの波長よりも長い波長(実施例1では500nm)を選択し、この波長における時間10~18nsの規格化スペクトルの蛍光強度と時間0~2nsの規格化スペクトルの蛍光強度の比(蛍光比s)を、下記に従って計算した。
蛍光比s=時間10~18nsの規格化スペクトルの蛍光強度(波長500nm)/時間0~2nsの規格化スペクトルの蛍光強度(波長500nm)
蛍光比s=時間10~18nsの規格化スペクトルの蛍光強度(波長500nm)/時間0~2nsの規格化スペクトルの蛍光強度(波長500nm)
このようにして算出した蛍光比sを図5に示す。図5に示すとおり、Aβ線維(Aβ42線維)の蛍光比sは1以上であるのに対し、Aβオリゴマー(Aβ42オリゴマー)の蛍光比sは1未満である。すなわち、蛍光比sが1未満であることをもってAβオリゴマーであると識別される。なお、本発明者らは、様々な条件で実験を繰り返した結果、上記の判別方法が一般的に当てはまることを確認している。
〔実施例2:AβオリゴマーとAβ線維の識別2〕
実施例2は、Aβ線維の調製及び蛍光測定を下記方法で実施したこと以外は、実施例1と同様の手順により実施した。
実施例2は、Aβ線維の調製及び蛍光測定を下記方法で実施したこと以外は、実施例1と同様の手順により実施した。
(Aβ線維の調製)
まず、Aβ1-40(商品名:Amyloid β-prоtein Human、1-40、株式会社ペプチド研究所製)をジメチルスルホキシドで5mmol/Lとなるように溶解し、さらに50mMりん酸ナトリウム緩衝液(pH7.4)を用いて、Aβ1-40の濃度が100μmol/Lとなるように希釈した。得られたAβの調製液は、インキュベータを用いて37℃で10日間インキュベートした。上記インキュベートを行うことによって、Aβ線維(Aβ40線維)を含む試料を調製した。
まず、Aβ1-40(商品名:Amyloid β-prоtein Human、1-40、株式会社ペプチド研究所製)をジメチルスルホキシドで5mmol/Lとなるように溶解し、さらに50mMりん酸ナトリウム緩衝液(pH7.4)を用いて、Aβ1-40の濃度が100μmol/Lとなるように希釈した。得られたAβの調製液は、インキュベータを用いて37℃で10日間インキュベートした。上記インキュベートを行うことによって、Aβ線維(Aβ40線維)を含む試料を調製した。
(蛍光測定)
染色された試料を、内径3mmの石英セルに分注し、小型蛍光寿命測定装置(Quantaurus-Tau型、浜松ホトニクス株式会社製)を用い、時間相関単光子係数法を用いて、励起波長405nmにおける蛍光減衰曲線を、420nmから620nmまで10nmおきに測定した。測定された蛍光減衰曲線のピーク値の5%の立ち上がり部分を時刻0とし、時間0~2ns及び時間10~18nsの蛍光減衰曲線の測定値をそれぞれ積算し、積算値からバックグラウンド値を引いた値を波長別にプロットすることで時間分解蛍光スペクトルを得た。バックグラウンド値は、50mMりん酸ナトリウム緩衝液(pH7.4)10μLに蒸留水240μLを添加及び混合した試料を上記と同様の方法で測定して得られた値である。
染色された試料を、内径3mmの石英セルに分注し、小型蛍光寿命測定装置(Quantaurus-Tau型、浜松ホトニクス株式会社製)を用い、時間相関単光子係数法を用いて、励起波長405nmにおける蛍光減衰曲線を、420nmから620nmまで10nmおきに測定した。測定された蛍光減衰曲線のピーク値の5%の立ち上がり部分を時刻0とし、時間0~2ns及び時間10~18nsの蛍光減衰曲線の測定値をそれぞれ積算し、積算値からバックグラウンド値を引いた値を波長別にプロットすることで時間分解蛍光スペクトルを得た。バックグラウンド値は、50mMりん酸ナトリウム緩衝液(pH7.4)10μLに蒸留水240μLを添加及び混合した試料を上記と同様の方法で測定して得られた値である。
(判定)
実施例1と同様にして蛍光比sを計算した。計算された蛍光比sを図6に示す。図6に示すとおり、Aβモノマーの種類が異なっても、Aβ線維(Aβ40線維)の蛍光比sは1以上である。すなわち、別種のAβモノマーから構成されるAβ線維が存在しても、実施例1と同様の手順によりAβオリゴマー(Aβ42オリゴマー)を識別できることが示された。
実施例1と同様にして蛍光比sを計算した。計算された蛍光比sを図6に示す。図6に示すとおり、Aβモノマーの種類が異なっても、Aβ線維(Aβ40線維)の蛍光比sは1以上である。すなわち、別種のAβモノマーから構成されるAβ線維が存在しても、実施例1と同様の手順によりAβオリゴマー(Aβ42オリゴマー)を識別できることが示された。
〔実施例3:AβオリゴマーとAβ線維の識別3〕
実施例3は、Aβオリゴマーの調製、Aβ線維の調製及び蛍光測定を下記方法で実施したこと以外は、実施例1と同様の手順により実施した。
実施例3は、Aβオリゴマーの調製、Aβ線維の調製及び蛍光測定を下記方法で実施したこと以外は、実施例1と同様の手順により実施した。
(Aβオリゴマーの調製)
まず、Aβ1-40(商品名:Amyloid β-prоtein Human、1-40、株式会社ペプチド研究所製)をジメチルスルホキシドで5mmol/Lとなるように溶解し、さらに50mMりん酸ナトリウム緩衝液(pH7.4)を用いて、Aβ1-40の濃度が100μmol/Lとなるように希釈した。得られたAβの調製液は、インキュベータを用いて37℃で1日間インキュベートした。上記インキュベートを行うことによって、Aβオリゴマー(Aβ40オリゴマー)を含む試料を調製した。
まず、Aβ1-40(商品名:Amyloid β-prоtein Human、1-40、株式会社ペプチド研究所製)をジメチルスルホキシドで5mmol/Lとなるように溶解し、さらに50mMりん酸ナトリウム緩衝液(pH7.4)を用いて、Aβ1-40の濃度が100μmol/Lとなるように希釈した。得られたAβの調製液は、インキュベータを用いて37℃で1日間インキュベートした。上記インキュベートを行うことによって、Aβオリゴマー(Aβ40オリゴマー)を含む試料を調製した。
(Aβ繊維の調製)
まず、Aβ1-40(商品名:Amyloid β-prоtein Human、1-40、株式会社ペプチド研究所製)をジメチルスルホキシドで5mmol/Lとなるように溶解し、さらに50mMりん酸ナトリウム緩衝液(pH7.4)を用いて、Aβ1-40の濃度が100μmol/Lとなるように希釈した。得られたAβの調製液は、インキュベータを用いて37℃で7日間インキュベートした。上記インキュベートを行うことによって、Aβ線維(Aβ40線維)を含む試料を調製した。
まず、Aβ1-40(商品名:Amyloid β-prоtein Human、1-40、株式会社ペプチド研究所製)をジメチルスルホキシドで5mmol/Lとなるように溶解し、さらに50mMりん酸ナトリウム緩衝液(pH7.4)を用いて、Aβ1-40の濃度が100μmol/Lとなるように希釈した。得られたAβの調製液は、インキュベータを用いて37℃で7日間インキュベートした。上記インキュベートを行うことによって、Aβ線維(Aβ40線維)を含む試料を調製した。
(蛍光測定)
染色された試料を、内径3mmの石英セルに分注し、小型蛍光寿命測定装置(Quantaurus-Tau型、浜松ホトニクス株式会社製)を用い、時間相関単光子係数法を用いて、励起波長405nmにおける蛍光減衰曲線を、420nmから620nmまで5nmおきに測定した。測定された蛍光減衰曲線のピーク値の5%の立ち上がり部分を時刻0とし、時間0~2ns及び時間10~18nsの蛍光減衰曲線の測定値をそれぞれ積算し、積算値からバックグラウンド値を引いた値を波長別にプロットすることで時間分解蛍光スペクトルを得た。バックグラウンド値は、0.8%DMSOを含む50mMりん酸ナトリウム緩衝液(pH7.4)10μLに50mmol/Lグリシン-水酸化ナトリウム溶液(pH9.0)240μLを添加及び混合した試料を上記と同様の方法で測定して得られた値である。
染色された試料を、内径3mmの石英セルに分注し、小型蛍光寿命測定装置(Quantaurus-Tau型、浜松ホトニクス株式会社製)を用い、時間相関単光子係数法を用いて、励起波長405nmにおける蛍光減衰曲線を、420nmから620nmまで5nmおきに測定した。測定された蛍光減衰曲線のピーク値の5%の立ち上がり部分を時刻0とし、時間0~2ns及び時間10~18nsの蛍光減衰曲線の測定値をそれぞれ積算し、積算値からバックグラウンド値を引いた値を波長別にプロットすることで時間分解蛍光スペクトルを得た。バックグラウンド値は、0.8%DMSOを含む50mMりん酸ナトリウム緩衝液(pH7.4)10μLに50mmol/Lグリシン-水酸化ナトリウム溶液(pH9.0)240μLを添加及び混合した試料を上記と同様の方法で測定して得られた値である。
(判定)
実施例1と同様にして蛍光比sを計算した。計算された蛍光比sを図7に示す。図7に示すとおり、Aβ線維(Aβ40線維)の蛍光比sは1以上であるのに対し、Aβオリゴマー(Aβ40オリゴマー)の蛍光比sは1未満である。すなわち、実施例1と同様の手順によりAβオリゴマー(Aβ40オリゴマー)を識別できることが示された。
実施例1と同様にして蛍光比sを計算した。計算された蛍光比sを図7に示す。図7に示すとおり、Aβ線維(Aβ40線維)の蛍光比sは1以上であるのに対し、Aβオリゴマー(Aβ40オリゴマー)の蛍光比sは1未満である。すなわち、実施例1と同様の手順によりAβオリゴマー(Aβ40オリゴマー)を識別できることが示された。
D…アミロイドβオリゴマー検出装置、D1…取得手段、D2…算出手段、D3…比較手段、D4…判定手段、D5…表示手段、D11…CPU、D12…ROM、D13…RAM、D14…入力デバイス、D15…出力デバイス、D16…通信モジュール、D17…補助記憶装置。
Claims (8)
- 被験試料とチオフラビンTとを接触させるステップと、
チオフラビンTの蛍光を測定し、時間分解蛍光スペクトルを得るステップと、
時間t1~t2の時間分解蛍光スペクトル、及び時間t3~t4の時間分解蛍光スペクトルをそれぞれ規格化し、規格化スペクトルを得るステップと、
両規格化スペクトルに基づいて、前記被験試料にアミロイドβオリゴマーが存在するか否かを判定するステップと、を含み、
t1<t2≦t3<t4であり、
時間t1~t2の規格化スペクトルと比較して、時間t3~t4の規格化スペクトルが低波長側にシフトしていることが、前記被験試料にアミロイドβオリゴマーが存在することを示す、アミロイドβオリゴマーの検出方法。 - 判定するステップにおいて、
両規格化スペクトルの波長λ1(ただし、λ1>480nm)における蛍光強度の値から下記式に従い蛍光比s1を算出し、
蛍光比s1=(時間t3~t4の規格化スペクトルの波長λ1における蛍光強度)/(時間t1~t2の規格化スペクトルの波長λ1における蛍光強度)
蛍光比s1が1未満の場合、アミロイドβオリゴマーが存在すると判定する、又は蛍光比s1が1以上の場合、アミロイドβオリゴマーが存在しないと判定する、請求項1に記載の検出方法。 - 判定するステップにおいて、
両規格化スペクトルの波長λ2(ただし、λ2<480nm)における蛍光強度の値から下記式に従い蛍光比s2を算出し、
蛍光比s2=(時間t3~t4の規格化スペクトルの波長λ2における蛍光強度)/(時間t1~t2の規格化スペクトルの波長λ2における蛍光強度)
蛍光比s2が1を超える場合、アミロイドβオリゴマーが存在すると判定する、又は蛍光比s2が1以下の場合、アミロイドβオリゴマーが存在しないと判定する、請求項1に記載の検出方法。 - 判定するステップにおいて、
両規格化スペクトルのピークトップの波長を比較し、
時間t3~t4の規格化スペクトルのピークトップの波長が、時間t1~t2の規格化スペクトルのピークトップの波長よりも短い場合、アミロイドβオリゴマーが存在すると判定する、又は時間t3~t4の規格化スペクトルのピークトップの波長が、時間t1~t2の規格化スペクトルのピークトップの波長と同じか若しくは長い場合、アミロイドβオリゴマーが存在しないと判定する、請求項1に記載の検出方法。 - 被験試料とチオフラビンTとを接触させるステップと、
チオフラビンTの蛍光を測定し、時間分解蛍光スペクトルを得るステップと、
時間t1~t2の時間分解蛍光スペクトル、及び時間t3~t4の時間分解蛍光スペクトルをそれぞれ規格化し、規格化スペクトルを得るステップと、
を含む、アミロイドβオリゴマーの検出のためのデータ収集方法であって、
t1<t2≦t3<t4であり、
時間t1~t2の規格化スペクトルと比較して、時間t3~t4の規格化スペクトルが低波長側にシフトしていることが、前記被験試料にアミロイドβオリゴマーが存在することを示す、データ収集方法。 - 被験試料に接触させたチオフラビンTの時間分解蛍光スペクトルデータを取得する取得手段と、
取得した時間分解蛍光スペクトルデータから、時間t1~t2の時間分解蛍光スペクトル、及び時間t3~t4の時間分解蛍光スペクトルをそれぞれ規格化し、規格化スペクトルを算出する算出手段と、
両規格化スペクトルを比較する比較手段と、
比較結果に基づき、前記被験試料にアミロイドβオリゴマーが存在するか否かを判定する判定手段と、を備え、
t1<t2≦t3<t4である、
アミロイドβオリゴマー検出装置。 - コンピュータを、
被験試料に接触させたチオフラビンTの時間分解蛍光スペクトルデータを取得する取得手段、
取得した時間分解蛍光スペクトルデータから、時間t1~t2の時間分解蛍光スペクトル、及び時間t3~t4の時間分解蛍光スペクトルをそれぞれ規格化し、規格化スペクトルを算出する算出手段(ただし、t1<t2≦t3<t4である)、
両規格化スペクトルを比較する比較手段、
比較結果に基づき、前記被験試料にアミロイドβオリゴマーが存在するか否かを判定する判定手段、
として機能させるためのアミロイドβオリゴマー検出プログラム。 - 請求項7に記載のアミロイドβオリゴマー検出プログラムが記録されたコンピュータ読み取り可能な記録媒体。
Priority Applications (3)
| Application Number | Priority Date | Filing Date | Title |
|---|---|---|---|
| JP2017543068A JP6832283B2 (ja) | 2015-09-29 | 2016-09-08 | アミロイドβオリゴマーの検出方法、アミロイドβオリゴマー検出装置及びアミロイドβオリゴマー検出プログラム |
| US15/763,935 US11402328B2 (en) | 2015-09-29 | 2016-09-08 | Amyloid β oligomer detection method, amyloid β oligomer detection device, and amyloid β oligomer detection program |
| US17/858,183 US20220357276A1 (en) | 2015-09-29 | 2022-07-06 | Amyloid beta oligomer detection method, amyloid beta oligomer detection device, and amyloid beta oligomer detection program |
Applications Claiming Priority (2)
| Application Number | Priority Date | Filing Date | Title |
|---|---|---|---|
| JP2015191307 | 2015-09-29 | ||
| JP2015-191307 | 2015-09-29 |
Related Child Applications (2)
| Application Number | Title | Priority Date | Filing Date |
|---|---|---|---|
| US15/763,935 A-371-Of-International US11402328B2 (en) | 2015-09-29 | 2016-09-08 | Amyloid β oligomer detection method, amyloid β oligomer detection device, and amyloid β oligomer detection program |
| US17/858,183 Division US20220357276A1 (en) | 2015-09-29 | 2022-07-06 | Amyloid beta oligomer detection method, amyloid beta oligomer detection device, and amyloid beta oligomer detection program |
Publications (1)
| Publication Number | Publication Date |
|---|---|
| WO2017056905A1 true WO2017056905A1 (ja) | 2017-04-06 |
Family
ID=58423396
Family Applications (1)
| Application Number | Title | Priority Date | Filing Date |
|---|---|---|---|
| PCT/JP2016/076469 Ceased WO2017056905A1 (ja) | 2015-09-29 | 2016-09-08 | アミロイドβオリゴマーの検出方法、アミロイドβオリゴマー検出装置及びアミロイドβオリゴマー検出プログラム |
Country Status (3)
| Country | Link |
|---|---|
| US (2) | US11402328B2 (ja) |
| JP (1) | JP6832283B2 (ja) |
| WO (1) | WO2017056905A1 (ja) |
Cited By (2)
| Publication number | Priority date | Publication date | Assignee | Title |
|---|---|---|---|---|
| JP2019032275A (ja) * | 2017-08-09 | 2019-02-28 | 浜松ホトニクス株式会社 | アミロイド凝集体の検出方法、アミロイド凝集体検出装置、及びアミロイド凝集体検出プログラム |
| JP2023002007A (ja) * | 2021-06-22 | 2023-01-10 | 浜松ホトニクス株式会社 | 蛍光寿命計測のバックグラウンド除去方法及び標的物質の定量方法 |
Families Citing this family (1)
| Publication number | Priority date | Publication date | Assignee | Title |
|---|---|---|---|---|
| JP6971535B2 (ja) * | 2015-09-29 | 2021-11-24 | 浜松ホトニクス株式会社 | 純粋なチオフラビンtを精製する方法、純粋なチオフラビンtの製造方法、チオフラビンtを含有する組成物、及びアミロイドの検出方法 |
Citations (4)
| Publication number | Priority date | Publication date | Assignee | Title |
|---|---|---|---|---|
| JP2010120942A (ja) * | 2008-11-22 | 2010-06-03 | Academia Sinica | アルツハイマー病、プリオン病、及び他のアミロイド症と関連するアミロイド線維を分解し及び減少させるナットウキナーゼ |
| JP2014122846A (ja) * | 2012-12-21 | 2014-07-03 | Hamamatsu Photonics Kk | アミロイドの凝集体の定量方法及びその定量装置 |
| WO2015060333A1 (ja) * | 2013-10-25 | 2015-04-30 | 国立大学法人神戸大学 | アミロイド分解能を有する人工ペプチドおよびその利用 |
| JP2015166749A (ja) * | 2010-08-16 | 2015-09-24 | コグノプティックス, インコーポレイテッド | アミロイドタンパク質を検出するためのシステムおよび方法 |
Family Cites Families (3)
| Publication number | Priority date | Publication date | Assignee | Title |
|---|---|---|---|---|
| DE10303974A1 (de) | 2003-01-31 | 2004-08-05 | Abbott Gmbh & Co. Kg | Amyloid-β(1-42)-Oligomere, Verfahren zu deren Herstellung und deren Verwendung |
| EP1882944B1 (en) | 2006-07-28 | 2009-03-18 | VISTA VENTURES GmbH | Method for the detection of amyloid-beta oligomers in body fluids |
| CN102459335B (zh) | 2009-04-17 | 2015-11-25 | 伊缪纳斯制药株式会社 | 特异性结合Aβ寡聚体的抗体及其用途 |
-
2016
- 2016-09-08 JP JP2017543068A patent/JP6832283B2/ja active Active
- 2016-09-08 WO PCT/JP2016/076469 patent/WO2017056905A1/ja not_active Ceased
- 2016-09-08 US US15/763,935 patent/US11402328B2/en active Active
-
2022
- 2022-07-06 US US17/858,183 patent/US20220357276A1/en not_active Abandoned
Patent Citations (4)
| Publication number | Priority date | Publication date | Assignee | Title |
|---|---|---|---|---|
| JP2010120942A (ja) * | 2008-11-22 | 2010-06-03 | Academia Sinica | アルツハイマー病、プリオン病、及び他のアミロイド症と関連するアミロイド線維を分解し及び減少させるナットウキナーゼ |
| JP2015166749A (ja) * | 2010-08-16 | 2015-09-24 | コグノプティックス, インコーポレイテッド | アミロイドタンパク質を検出するためのシステムおよび方法 |
| JP2014122846A (ja) * | 2012-12-21 | 2014-07-03 | Hamamatsu Photonics Kk | アミロイドの凝集体の定量方法及びその定量装置 |
| WO2015060333A1 (ja) * | 2013-10-25 | 2015-04-30 | 国立大学法人神戸大学 | アミロイド分解能を有する人工ペプチドおよびその利用 |
Cited By (4)
| Publication number | Priority date | Publication date | Assignee | Title |
|---|---|---|---|---|
| JP2019032275A (ja) * | 2017-08-09 | 2019-02-28 | 浜松ホトニクス株式会社 | アミロイド凝集体の検出方法、アミロイド凝集体検出装置、及びアミロイド凝集体検出プログラム |
| JP7007132B2 (ja) | 2017-08-09 | 2022-01-24 | 浜松ホトニクス株式会社 | アミロイド凝集体の検出方法、アミロイド凝集体検出装置、及びアミロイド凝集体検出プログラム |
| JP2023002007A (ja) * | 2021-06-22 | 2023-01-10 | 浜松ホトニクス株式会社 | 蛍光寿命計測のバックグラウンド除去方法及び標的物質の定量方法 |
| JP7633102B2 (ja) | 2021-06-22 | 2025-02-19 | 浜松ホトニクス株式会社 | 蛍光寿命計測のバックグラウンド除去方法及び標的物質の定量方法 |
Also Published As
| Publication number | Publication date |
|---|---|
| US20220357276A1 (en) | 2022-11-10 |
| US20190056324A1 (en) | 2019-02-21 |
| JPWO2017056905A1 (ja) | 2018-07-12 |
| JP6832283B2 (ja) | 2021-02-24 |
| US11402328B2 (en) | 2022-08-02 |
Similar Documents
| Publication | Publication Date | Title |
|---|---|---|
| Perelman et al. | JC-1: alternative excitation wavelengths facilitate mitochondrial membrane potential cytometry | |
| US20220357276A1 (en) | Amyloid beta oligomer detection method, amyloid beta oligomer detection device, and amyloid beta oligomer detection program | |
| CN108351302B (zh) | 肿瘤部位的判别方法、肿瘤部位的判别装置 | |
| CN103703367B (zh) | 癌变信息提供方法及癌变信息提供装置 | |
| US8877509B2 (en) | System and method for analyzing samples labeled with 5, 10, 15, 20 tetrakis (4-carboxyphenyl) porphine (TCPP) | |
| CN103740360A (zh) | 荧光比率法检测次氯酸的荧光探针及其制备方法 | |
| EP3729088B1 (en) | Diagnosis and treatment of alpha-synucleinopathies | |
| JP6133053B2 (ja) | アミロイドの凝集体の定量方法及びその定量装置 | |
| Gusel’nikova et al. | Fluorescent characterization of amyloid deposits in the kidneys of mdx mice | |
| JP7007132B2 (ja) | アミロイド凝集体の検出方法、アミロイド凝集体検出装置、及びアミロイド凝集体検出プログラム | |
| Liu et al. | Distinguishing brain tumors by Label-free confocal micro-Raman spectroscopy | |
| JP5699118B2 (ja) | 細胞分析装置、癌化情報提供方法、dna量ヒストグラムの作成方法および検査方法 | |
| US20250362312A1 (en) | Method and device for identifying structural polymorphism of fibrous protein or peptide | |
| EP3902925B1 (en) | Method for measuring telomere associated variables and uses thereof for the diagnosis and/or prognosis of telomeric-associated diseases | |
| CA2842464C (en) | System and method for analyzing samples labeled with 5, 10, 15, 20 tetrakis (4-carboxyphenyl) porphine (tcpp) | |
| Griswold | Detecting Fret Using Excitation-Scanning Hyperspectral Imaging | |
| JP2010043865A (ja) | 異常型プリオンの検出方法 | |
| Patel | A Review of the Forensic Applications for the Analysis of Biological Fluids Using Fluorescence Spectroscopy | |
| Mickert et al. | Increasing Objectivity in Quantitative Analysis in Immune-Histochemistry Biomarker Mapping using Upconverting Nanoparticles | |
| WO2013125932A1 (ru) | Метод определения структурных и функциональных свойств альбумина плазмы крови | |
| HK40030288A (en) | Diagnosis and treatment of alpha-synucleinopathies | |
| HK40030288B (en) | Diagnosis and treatment of alpha-synucleinopathies | |
| CN107389632A (zh) | 一种基于分子探针的汞离子荧光分析方法 |
Legal Events
| Date | Code | Title | Description |
|---|---|---|---|
| 121 | Ep: the epo has been informed by wipo that ep was designated in this application |
Ref document number: 16851079 Country of ref document: EP Kind code of ref document: A1 |
|
| ENP | Entry into the national phase |
Ref document number: 2017543068 Country of ref document: JP Kind code of ref document: A |
|
| NENP | Non-entry into the national phase |
Ref country code: DE |
|
| 122 | Ep: pct application non-entry in european phase |
Ref document number: 16851079 Country of ref document: EP Kind code of ref document: A1 |