WO2015098018A1 - 光音響顕微鏡 - Google Patents
光音響顕微鏡 Download PDFInfo
- Publication number
- WO2015098018A1 WO2015098018A1 PCT/JP2014/006182 JP2014006182W WO2015098018A1 WO 2015098018 A1 WO2015098018 A1 WO 2015098018A1 JP 2014006182 W JP2014006182 W JP 2014006182W WO 2015098018 A1 WO2015098018 A1 WO 2015098018A1
- Authority
- WO
- WIPO (PCT)
- Prior art keywords
- photoacoustic
- depth
- unit
- photoacoustic wave
- time
- Prior art date
- Legal status (The legal status is an assumption and is not a legal conclusion. Google has not performed a legal analysis and makes no representation as to the accuracy of the status listed.)
- Ceased
Links
Images


Classifications
-
- G—PHYSICS
- G01—MEASURING; TESTING
- G01N—INVESTIGATING OR ANALYSING MATERIALS BY DETERMINING THEIR CHEMICAL OR PHYSICAL PROPERTIES
- G01N29/00—Investigating or analysing materials by the use of ultrasonic, sonic or infrasonic waves; Visualisation of the interior of objects by transmitting ultrasonic or sonic waves through the object
- G01N29/04—Analysing solids
- G01N29/06—Visualisation of the interior, e.g. acoustic microscopy
- G01N29/0654—Imaging
- G01N29/0681—Imaging by acoustic microscopy, e.g. scanning acoustic microscopy
-
- A—HUMAN NECESSITIES
- A61—MEDICAL OR VETERINARY SCIENCE; HYGIENE
- A61B—DIAGNOSIS; SURGERY; IDENTIFICATION
- A61B5/00—Measuring for diagnostic purposes; Identification of persons
- A61B5/0093—Detecting, measuring or recording by applying one single type of energy and measuring its conversion into another type of energy
- A61B5/0095—Detecting, measuring or recording by applying one single type of energy and measuring its conversion into another type of energy by applying light and detecting acoustic waves, i.e. photoacoustic measurements
-
- G—PHYSICS
- G01—MEASURING; TESTING
- G01N—INVESTIGATING OR ANALYSING MATERIALS BY DETERMINING THEIR CHEMICAL OR PHYSICAL PROPERTIES
- G01N29/00—Investigating or analysing materials by the use of ultrasonic, sonic or infrasonic waves; Visualisation of the interior of objects by transmitting ultrasonic or sonic waves through the object
- G01N29/02—Analysing fluids
- G01N29/032—Analysing fluids by measuring attenuation of acoustic waves
-
- G—PHYSICS
- G01—MEASURING; TESTING
- G01N—INVESTIGATING OR ANALYSING MATERIALS BY DETERMINING THEIR CHEMICAL OR PHYSICAL PROPERTIES
- G01N29/00—Investigating or analysing materials by the use of ultrasonic, sonic or infrasonic waves; Visualisation of the interior of objects by transmitting ultrasonic or sonic waves through the object
- G01N29/22—Details, e.g. general constructional or apparatus details
- G01N29/24—Probes
- G01N29/2418—Probes using optoacoustic interaction with the material, e.g. laser radiation, photoacoustics
-
- G—PHYSICS
- G01—MEASURING; TESTING
- G01N—INVESTIGATING OR ANALYSING MATERIALS BY DETERMINING THEIR CHEMICAL OR PHYSICAL PROPERTIES
- G01N29/00—Investigating or analysing materials by the use of ultrasonic, sonic or infrasonic waves; Visualisation of the interior of objects by transmitting ultrasonic or sonic waves through the object
- G01N29/44—Processing the detected response signal, e.g. electronic circuits specially adapted therefor
- G01N29/4409—Processing the detected response signal, e.g. electronic circuits specially adapted therefor by comparison
- G01N29/4427—Processing the detected response signal, e.g. electronic circuits specially adapted therefor by comparison with stored values, e.g. threshold values
-
- G—PHYSICS
- G01—MEASURING; TESTING
- G01N—INVESTIGATING OR ANALYSING MATERIALS BY DETERMINING THEIR CHEMICAL OR PHYSICAL PROPERTIES
- G01N2291/00—Indexing codes associated with group G01N29/00
- G01N2291/02—Indexing codes associated with the analysed material
- G01N2291/024—Mixtures
- G01N2291/02483—Other human or animal parts, e.g. bones
-
- G—PHYSICS
- G01—MEASURING; TESTING
- G01N—INVESTIGATING OR ANALYSING MATERIALS BY DETERMINING THEIR CHEMICAL OR PHYSICAL PROPERTIES
- G01N2291/00—Indexing codes associated with group G01N29/00
- G01N2291/02—Indexing codes associated with the analysed material
- G01N2291/028—Material parameters
- G01N2291/0289—Internal structure, e.g. defects, grain size, texture
-
- G—PHYSICS
- G01—MEASURING; TESTING
- G01N—INVESTIGATING OR ANALYSING MATERIALS BY DETERMINING THEIR CHEMICAL OR PHYSICAL PROPERTIES
- G01N2291/00—Indexing codes associated with group G01N29/00
- G01N2291/26—Scanned objects
- G01N2291/263—Surfaces
Definitions
- the present invention relates to a photoacoustic microscope.
- Photoacoustic wave is a kind of elastic wave generated in the thermoelastic process that occurs when a substance is irradiated with light in the absorption wavelength range. Therefore, photoacoustic waves are attracting attention as a technique for imaging absorption characteristics.
- photoacoustic microscopes that apply photoacoustic waves to imaging as detection signals
- pulsed light that matches the absorption wavelength region of the observation object is used as excitation light
- the excitation light is collected by the objective lens and collected in the specimen.
- a method is used in which scanning is performed with a spot, and thereby a photoacoustic wave generated at each focused spot position is detected by a transducer or the like (see Patent Document 1).
- a photoacoustic microscope when a specimen is scanned with a condensing spot, a photoacoustic wave is generated if an absorbing substance is present at the condensing spot position. Therefore, by detecting the photoacoustic wave, absorption within the specimen is performed. Characteristics can be imaged.
- the depth of the absorbing material below the surface can be calculated based on the time delay from the light irradiation to the arrival of the photoacoustic wave in the optical depth range where the light reaches from the surface of the specimen. It is.
- the shape of the acoustic wave is complicated, it is difficult to increase the time delay calculation accuracy.
- the accuracy of the relative depth of other positions relative to an arbitrary position of the absorbent material is required, it has been difficult to calculate the relative depth of the absorbent material with the required level of accuracy. .
- the present invention has been made in view of such a viewpoint, and an object thereof is to provide a photoacoustic microscope capable of calculating the relative depth of an absorbing material with high accuracy.
- the photoacoustic microscope according to the present invention for achieving the above object is A light source that emits excitation light; An objective lens for condensing the excitation light in the specimen; An optical scanning unit that changes a relative position between the sample and a position where excitation light is collected by the objective lens; An acoustic wave detection unit for detecting a photoacoustic wave generated from the sample by irradiation of the excitation light; The waveform of the waveform due to the time change of the photoacoustic wave detected at the calculation target position other than the reference position in the sample with respect to the waveform due to the time change of the photoacoustic wave detected using any position in the scanning range of the sample as the reference position And a calculation unit that calculates a deviation based on the correlation coefficient and calculates depth information from the reference position at the calculation target position based on the deviation.
- FIG. 1 is a schematic diagram showing a configuration of a main part of a photoacoustic microscope according to an embodiment of the present invention.
- the photoacoustic microscope 10 deflects the excitation light L emitted from the pulse light source 11 by the optical scanning unit 12 and irradiates the sample S as a condensed spot through the photoacoustic wave reflection unit 14 by the objective lens 13.
- the photoacoustic wave U generated from the sample S is reflected by the photoacoustic wave reflection unit 14 in a direction different from the optical path of the excitation light L and detected by the photoacoustic wave detection unit 15.
- the pulsed light source 11 emits excitation light L having an absorption wavelength of hemoglobin.
- the observation target is not limited to blood vessels, and can be applied to imaging of endogenous substances such as melanin.
- the excitation light L may be light in the absorption wavelength region of the target substance. It can also be applied to imaging of exogenous substances such as phosphors and metal nanoparticles.
- the excitation light L light in the absorption wavelength region of the target phosphor in the case of a phosphor is used, and light in the resonance wavelength region of the target metal nanoparticle in the case of a metal nanoparticle. Good.
- the pulse light source 11 the light emission timing of the pulsed light is controlled by the control unit 16.
- the optical scanning unit 12 includes, for example, two galvanometer mirrors, and is synchronized with the light emission timing of the pulsed light source 11 by the control unit 16 so that the inside of the sample S is two-dimensionally scanned by the condensed spot of the excitation light L. Drive controlled.
- the optical scanning unit 12 only needs to be able to change the relative positional relationship between the condensing spot of the excitation light L and the sample. Therefore, the optical scanning unit 12 is a sample, a stage on which the sample is placed, or the like. It is also possible to change the position of.
- Objective lenses 13 having different focal lengths are appropriately selected and mounted.
- the photoacoustic wave reflection unit 14 includes two right-angled triangular prisms 14a and 14b, and the inclined surfaces thereof are coupled by a photoacoustic wave reflection member 14c.
- the photoacoustic wave reflecting member 14c is transparent to the excitation light L, and is made of a member having different acoustic impedance, such as silicon oil or air, for the right triangular prism 14b on the sample S side. Since the difference between the acoustic impedance of the right triangular prism 14b and the acoustic impedance of the photoacoustic wave reflection member 14c satisfies a predetermined relationship, the photoacoustic wave U is reflected by the photoacoustic wave reflection member 14c.
- a photoacoustic wave lens (not shown) may be arranged on the sample S side of the right triangular prism 14b.
- the excitation light L that has passed through the objective lens 13 and the photoacoustic wave reflection unit 14 is condensed at the focal position of the objective lens 13.
- the specimen S is arranged so as to overlap with the condensing spot of the excitation light L.
- the photoacoustic wave U generated from the condensing spot position of the excitation light L of the sample S is incident on the right triangular prism 14b.
- the photoacoustic wave U is reflected at a boundary surface between the right triangular prism 14b and the photoacoustic wave reflecting member 14c in a direction different from the optical path of the excitation light L, and is emitted from the right triangular prism 14b to the photoacoustic wave detecting unit 15. Is done.
- At least the space between the objective lens 13 and the sample S and between the right triangular prism 14b and the photoacoustic wave detector 15 is filled with a photoacoustic wave transmission medium such as water through which the photoacoustic wave U easily propagates. It is preferable.
- the photoacoustic wave detection unit 15 is, for example, a transducer that detects the photoacoustic wave U, and detects the photoacoustic wave U emitted from the right triangular prism 14b.
- the photoacoustic wave detection unit 15 outputs the waveform of the intensity change of the photoacoustic wave U with respect to the time change to the signal processing unit 17 as an output signal.
- the signal processing unit 17 includes an association unit 18, a calculation unit 19, a creation unit 20, and a work memory 21.
- the associating unit 18 is synchronized with the driving of the optical scanning unit 12 by the control unit 16, that is, the irradiation timing of the excitation light L when the sample S is two-dimensionally scanned in a plane orthogonal to the optical axis O of the objective lens 13.
- the irradiation position of the excitation light L and the output signal are associated with each other based on the output signal obtained from the photoacoustic wave detection unit 15 in synchronization with the output signal.
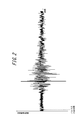
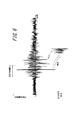
- the association unit 18 further associates the start time of the output signal, that is, the start time of the intensity change (see FIG. 2) of the photoacoustic wave U with respect to the time change, and the emission timing of the pulsed light at the irradiation position. May be.
- the calculation unit 19 calculates the correlation coefficient of the output signal at the calculation target position other than the reference position and the reference position as described below, and calculates the depth at the calculation target position based on the correlation coefficient. .
- the reference position is a position where a substance similar to the substance at the calculation target position is present, and can be set to a position at which the same amount of local light as that applied to the calculation target position is irradiated. More specifically, it can be set to a position arbitrarily determined among all irradiation positions of the excitation light L.
- the reference position may be determined by the observer specifying an arbitrary position on the image generated by the generation unit 20 and displayed on the display 22 using a pointing device such as a mouse. Good. Further, the reference position may be determined as a reference position by automatically analyzing the output signal obtained from the photoacoustic wave detection unit 15 to show a high intensity.
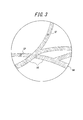
- the depth can be calculated for the absorbing material that generates the photoacoustic wave U. Therefore, as shown in FIG. 3, it is preferable that the observer designates an arbitrary point of the image of the absorbing substance in the image IM created by the creating unit 20 as the reference position SP (see FIG. 3).
- the calculation unit 19 detects the appearance time of the photoacoustic wave U in the output signal associated with the reference position SP.
- the appearance time is a time when the absolute value of the intensity of the photoacoustic wave U exceeds a threshold in the waveform corresponding to the output signal, as shown in FIG.
- the threshold value may be set to an arbitrary value that can exclude white noise generated in a state where the photoacoustic wave U does not appear, for example, a value that is three times the root mean square of the amplitude of white noise that is generally sampled. .
- the calculation unit 19 determines the time position of the target period at the reference position SP based on the detected appearance time.
- the target period is a period during which a part of the waveform corresponding to the output signal is extracted in order to calculate the correlation coefficient.
- the target period is determined in advance to be equal to or greater than a value obtained by dividing the depth by the acoustic velocity.
- the depth is set to the depth ⁇ ⁇ / NA 2 at the time of taking a photograph of the Berek equation ( ⁇ is the wavelength of the excitation light L, and NA is the numerical aperture of the objective lens 13).
- the time position is a coordinate on the time coordinate axis and indicates a specific time.
- the time position of the target period is determined at a time when the center of the target period is coincident with the passage of half of the total period of the target period and the search time range from the appearance time.
- the search time range will be described later.
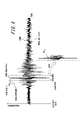
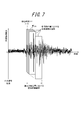
- the calculation unit 19 extracts a waveform of the target period at the reference position SP (see FIG. 4, reference numeral “WF SP ”).
- the target period may be stored in the storage unit 23 in association with the objective lens 13.
- the calculation unit 19 determines a time position in the search time range.
- the search time range will be described here. As will be described later, the calculation unit 19 compares the extracted waveform WF SP at the reference position SP with the waveform at the calculation target position CP (see FIG. 3). For comparison, waveforms within the target period at various time positions are also extracted from the output signal associated with the calculation target position CP.
- the search time range indicates a time position range in which a waveform used for calculating a correlation coefficient is extracted from output signals at the calculation target position CP.
- the length of the search time range is determined in advance to an arbitrary value less than the emission period of the pulsed excitation light L, for example, twice the value obtained by dividing the depth of the objective lens 13 by the acoustic velocity.
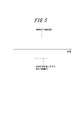
- the time position of the search time range may be determined when the center of the search time range coincides with the center of the target period at the reference position SP (see FIG. 5).
- the length of the search time range may be stored in the storage unit 23.
- the calculation unit 19 first extracts the waveform WF CP1 at the calculation target position CP.
- the start of the target period of the waveform WF CP1 coincides with the start of the search time range (see FIG. 6).
- the length of the waveform WF CP1 is preferably the same as the length of the waveform WF SP .
- the calculation unit 19 calculates correlation coefficients of the waveforms WF SP and WF CP1 in the target period at the extracted reference position SP and calculation target position CP.
- the calculation unit 19 stores the calculated correlation coefficient in the work memory 21.
- the calculation unit 19 extracts the waveform of the target period in which the time position of the target period at the calculation target position CP is shifted backward by the unit time ⁇ t (see FIG. 7).
- the unit time ⁇ t may be determined in advance at an arbitrary interval, for example, the minimum time interval of the digitized output signal.
- the calculating unit 19 calculates a correlation coefficient between the waveform at the reference position SP and the waveform of the target period at the newly extracted calculation target position CP.
- the calculation unit 19 stores the calculated correlation coefficient in the work memory 21.
- the unit time ⁇ t may be stored in the storage unit 23.
- the calculation unit 19 changes the target at the calculation target position CP while displacing the time position of the target period at the calculation target position CP until the end of the target period coincides with the end of the search time range (see symbol E in FIG. 7).
- the extraction of the waveform of the period, the calculation of the correlation coefficient with the waveform at the reference position SP using the newly extracted waveform, and the storage of the correlation coefficient are repeated.
- the calculation unit 19 reads the correlation coefficient stored in the work memory 21 at each of a number of time positions within the search time range.
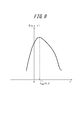
- the correlation coefficient is a function represented by the equation (1), and it is common to draw a curve as shown in FIG.
- R (x, y, ⁇ ) is a waveform of a target period having a time position ⁇ and a reference position SP (coordinate (x b )) at a calculation target position CP (coordinates (x, y)).
- Y b )) is a correlation coefficient with the waveform of the target period.
- a (x b , y b , t) is an amplitude at the reference position SP (coordinates (x b , y b )) at time t.
- a (x, y, t ⁇ ) is an amplitude at the calculation target position CP in which the time position shifted by the time ⁇ with respect to the time position of the target period of the reference position SP is the target period.
- t1 is the start of the target period at the reference position SP
- t2 is the end of the target period at the reference position SP.
- a ave, b is an average value of the amplitude of the reference position SP.
- a ave, b is an average value of the amplitude of the calculation target position CP.
- the calculation unit 19 calculates the difference between the time position of the target period at the calculation target position CP and the time position of the target period of the reference position SP, with the maximum correlation coefficient read out, and calculates the difference as the shift time. Let ⁇ max (x , y) .
- the calculation unit 19 calculates the relative depth of the calculation target position CP with respect to the reference position SP at the calculation target position CP by multiplying the detected deviation time ⁇ max (x , y) by the acoustic velocity. Similarly, the calculation unit 19 calculates the relative depth with respect to the reference position SP at the other calculation target positions CP.
- the calculation unit 19 detects a time position where the absolute value of the amplitude of the output signal associated with the reference position SP is maximum.
- the calculation unit 19 calculates the depth of the absorbing material at the reference position SP based on the time position, the emission timing of the pulsed light, and the distance from the photoacoustic wave detection unit 15 to the sample surface.
- a signal is emitted from the photoacoustic wave detector 15 toward the sample surface, and the return light from the sample surface to the photoacoustic wave detector 15 is output. It may be calculated from the arrival time.
- the calculation unit 19 calculates the depth of each calculation target position CP by adding the depth of the reference position SP to the relative depth of each calculation target position CP.
- the calculation unit 19 stores the calculated depth in the work memory 21 in association with each calculation target position CP.
- the creation unit 20 detects the maximum value of the absolute value of the amplitude and the time position at which the maximum value is detected by the photoacoustic wave detection unit 15 in the output signal associated with each irradiation position of the excitation light L. To do.
- the creation unit 20 calculates a value corresponding to the maximum absolute value of the amplitude at each irradiation position as a luminance value at each irradiation position. That is, the creation unit 20 determines the intensity of the photoacoustic wave U of the sample S based on the irradiation position specified by the relative change amount of the condensing position of the excitation light L with respect to the sample and the detected photoacoustic wave U, that is, the output signal.
- An image IM (see FIG. 3) corresponding to the distribution is created. As described above, in order to designate the reference position SP, the creating unit 20 transmits an image IM before correction, which will be described later, to the display 22 for display.
- the creation unit 20 has a time range in which the time position at which the maximum value is detected by the photoacoustic wave detection unit 15 corresponds to a depth twice the depth of ⁇ / NA 2 with the focal position of the objective lens 13 as the center.
- the luminance value is calculated only for the irradiation position within.
- the creating unit 20 images only the absorbing substance that exists within the range twice the focal depth of the objective lens 13.
- the creation unit 20 corrects the luminance of the image IM corresponding to the intensity distribution of the photoacoustic wave U based on the reference position SP calculated by the calculation unit 19 and the depth of the calculation target position CP.
- the amplitude of the photoacoustic wave U changes in accordance with the intensity of light applied to the absorbing material. As shown in FIG. 9, the light intensity is maximum at the focal position of the objective lens 13, and decreases according to the distance from the focal position. Therefore, the intensity of the photoacoustic wave U of an arbitrary absorbing material decreases according to the distance from the focal position. Therefore, the creation unit 20 corrects the absorbing material existing at any depth so that the image IM is based on the photoacoustic wave U when the same intensity of light is irradiated.
- the intensity of light with respect to the distance from the focal position can be calculated by a PSF (point spread function) unique to the combination of the excitation light L and the sample S. Therefore, the creation unit 20 performs correction for the light intensity (symbol “code“) corresponding to the difference between the depth of the reference position SP and each calculation target position CP (see “D”) and the focal position in the depth direction. LI ”) is read from the previously stored PSF. The creation unit 20 calculates a correction coefficient obtained by dividing the light intensity at the focal position by the read light intensity. The creation unit 20 performs correction by multiplying the luminance value at the reference position SP and each calculation target position CP by a correction coefficient.
- PSF point spread function
- the luminance value of all the absorbing substances in an arbitrary sample S may be corrected to be converted into a specific value.
- the absorption substance to be observed by the photoacoustic microscope 10 may be a single type of absorption substance for the specimen S as desired, such as a capillary blood vessel on the surface of the specimen S. Therefore, it can be assumed that the photoacoustic wave U having the same intensity is generated for the light having the same intensity.
- the creating unit 20 has the above-described luminance only with respect to the absorbing substance existing within the range of the depth of ⁇ / NA 2 from the focal position of the objective lens 13, particularly within the range of twice the depth in consideration of aberration. Correct the value.
- the creation unit 20 outputs the image IM on which the luminance value has been corrected to the display 22 and displays it.
- the control unit 16 controls the overall operation of the photoacoustic microscope 10.
- a storage unit 23 is connected to the control unit 16.
- the storage unit 23 stores an operation program or the like by the control unit 16 as necessary.
- the storage unit 237 may be a built-in memory of the control unit 16.
- the photoacoustic microscope According to the photoacoustic microscope according to the present embodiment as described above, to the photoacoustic wave detection unit 15 of the photoacoustic wave U at the calculation target position CP with respect to the photoacoustic wave U at the reference position SP based on the correlation coefficient. Can be calculated with high accuracy. Since there is a correlation between the deviation of the arrival time with high accuracy and the depth of the absorbing material, in the present embodiment, the relative depth of the absorbing material can be calculated with high accuracy based on the deviation of the arrival time.
- the image IM is corrected based on the depth of the absorbing material, so that the same type of absorbing material is changed from a different type of absorbing material due to a difference in luminance due to a difference in depth. Misidentification can be suppressed.
- the image IM based on the depth is corrected based on the PSF, so that the photoacoustic wave U in a state where the light having the same intensity is irradiated regardless of the depth is imaged. Is possible. Therefore, the observer can more appropriately grasp the state of the sample S.
- correction is performed to adjust the luminance to a constant value regardless of the depth, so that it is possible to suppress misidentification of the same type of absorbing material as a different type of absorbing material. .
- correction is performed regardless of the depth, high-load image processing is not necessary.
- the absorbing substance existing in the range twice the depth of the objective lens 13 is imaged, the absorbing substance existing in the region near the position corresponding to the focal length is visually recognized. It becomes possible. Note that imaging of the absorbing substance outside the range can be performed by adjusting the focal position of the objective lens 13.
- the luminance of the image IM of the absorbing substance existing within the depth range of the objective lens 13 is corrected, so that the absorbing substance having a similar position in the depth direction has the same luminance. It can be displayed. Therefore, the observer can visually recognize the absorbing substance group relatively close to the position corresponding to the focal length and the absorbing substance group relatively distant from the focal position.
- the target period is determined to be equal to or greater than the value obtained by dividing the depth of the objective lens 13 by the acoustic velocity, so that it is possible to calculate a correlation coefficient that highly reflects the similarity of waveforms. It is. As a result, the relative depth can be calculated with high accuracy.
- the center position of the target period at the reference position SP is determined from the appearance time of the photoacoustic wave U at the time of half of the total period of the target period and the search time range.
- the target period at the calculation target position CP can be set after the appearance time of the photoacoustic wave U at the reference position SP. Therefore, it is possible to suppress the burden of calculating the correlation coefficient uselessly before the appearance of the photoacoustic wave U.
Landscapes
- Physics & Mathematics (AREA)
- Health & Medical Sciences (AREA)
- Life Sciences & Earth Sciences (AREA)
- General Health & Medical Sciences (AREA)
- Pathology (AREA)
- Immunology (AREA)
- General Physics & Mathematics (AREA)
- Biochemistry (AREA)
- Analytical Chemistry (AREA)
- Chemical & Material Sciences (AREA)
- Acoustics & Sound (AREA)
- Engineering & Computer Science (AREA)
- Signal Processing (AREA)
- Optics & Photonics (AREA)
- Medical Informatics (AREA)
- Veterinary Medicine (AREA)
- Public Health (AREA)
- Molecular Biology (AREA)
- Animal Behavior & Ethology (AREA)
- Heart & Thoracic Surgery (AREA)
- Biomedical Technology (AREA)
- Biophysics (AREA)
- Surgery (AREA)
- Investigating Or Analyzing Materials By The Use Of Ultrasonic Waves (AREA)
- Ultra Sonic Daignosis Equipment (AREA)
Priority Applications (3)
| Application Number | Priority Date | Filing Date | Title |
|---|---|---|---|
| DE112014005466.6T DE112014005466T5 (de) | 2013-12-25 | 2014-12-11 | Photoakustisches Mikroskop |
| CN201480070297.7A CN105848587B (zh) | 2013-12-25 | 2014-12-11 | 光声显微镜 |
| US15/191,750 US10309933B2 (en) | 2013-12-25 | 2016-06-24 | Photoacoustic microscope |
Applications Claiming Priority (2)
| Application Number | Priority Date | Filing Date | Title |
|---|---|---|---|
| JP2013267398A JP6210873B2 (ja) | 2013-12-25 | 2013-12-25 | 光音響顕微鏡 |
| JP2013-267398 | 2013-12-25 |
Related Child Applications (1)
| Application Number | Title | Priority Date | Filing Date |
|---|---|---|---|
| US15/191,750 Continuation US10309933B2 (en) | 2013-12-25 | 2016-06-24 | Photoacoustic microscope |
Publications (1)
| Publication Number | Publication Date |
|---|---|
| WO2015098018A1 true WO2015098018A1 (ja) | 2015-07-02 |
Family
ID=53477924
Family Applications (1)
| Application Number | Title | Priority Date | Filing Date |
|---|---|---|---|
| PCT/JP2014/006182 Ceased WO2015098018A1 (ja) | 2013-12-25 | 2014-12-11 | 光音響顕微鏡 |
Country Status (5)
| Country | Link |
|---|---|
| US (1) | US10309933B2 (enExample) |
| JP (1) | JP6210873B2 (enExample) |
| CN (1) | CN105848587B (enExample) |
| DE (1) | DE112014005466T5 (enExample) |
| WO (1) | WO2015098018A1 (enExample) |
Cited By (1)
| Publication number | Priority date | Publication date | Assignee | Title |
|---|---|---|---|---|
| US11209532B2 (en) | 2017-01-23 | 2021-12-28 | Olympus Corporation | Signal processing device, photoacoustic wave image-acquisition device, and signal processing method |
Families Citing this family (5)
| Publication number | Priority date | Publication date | Assignee | Title |
|---|---|---|---|---|
| JP6358735B2 (ja) * | 2014-02-26 | 2018-07-18 | オリンパス株式会社 | 光音響顕微鏡装置 |
| KR101808173B1 (ko) * | 2016-07-21 | 2017-12-12 | 포항공과대학교 산학협력단 | 광음향 현미경의 성능을 향상시키는 시간지연곱합 기반 합성개구집속 방법, 및 이를 이용하는 프로세싱 장치 및 광음향 현미경 시스템 |
| KR101936120B1 (ko) * | 2016-11-30 | 2019-01-08 | 부경대학교 산학협력단 | 광음향 단층촬영을 위한 프로브 및 실시간 광음향 단층촬영 장치 |
| CN108742528B (zh) * | 2018-05-29 | 2021-12-10 | 华南师范大学 | 一种无水耦合的快速线性共焦扫描光声探头及其成像方法 |
| CN116183507A (zh) * | 2022-05-30 | 2023-05-30 | 香港理工大学深圳研究院 | 一种基于基底光声的组织硬度研究方法及应用 |
Citations (3)
| Publication number | Priority date | Publication date | Assignee | Title |
|---|---|---|---|---|
| JP2011519281A (ja) * | 2007-10-25 | 2011-07-07 | ワシントン・ユニバーシティ | 光学的方位分解能を備えた共焦点光音響顕微鏡検査 |
| JP2012163526A (ja) * | 2011-02-09 | 2012-08-30 | Canon Inc | 測定装置 |
| JP2013113804A (ja) * | 2011-11-30 | 2013-06-10 | Olympus Corp | 光音響顕微鏡 |
Family Cites Families (11)
| Publication number | Priority date | Publication date | Assignee | Title |
|---|---|---|---|---|
| JP2659429B2 (ja) * | 1989-03-17 | 1997-09-30 | 株式会社日立製作所 | 光音響信号検出方法及びその装置並びに半導体素子内部欠陥検出方法 |
| US5136172A (en) * | 1989-08-16 | 1992-08-04 | Hitachi, Ltd. | Method and apparatus for detecting photoacoustic signal |
| JP2001304840A (ja) * | 2000-04-26 | 2001-10-31 | Advantest Corp | 電子ビーム測長装置及び測長方法 |
| KR100906270B1 (ko) * | 2006-01-20 | 2009-07-06 | 올림푸스 메디칼 시스템즈 가부시키가이샤 | 피검체 정보 분석 장치, 내시경 장치 및 피검체 정보 분석방법 |
| WO2009073979A1 (en) * | 2007-12-12 | 2009-06-18 | Carson Jeffrey J L | Three-dimensional photoacoustic imager and methods for calibrating an imager |
| JP4704519B2 (ja) * | 2009-06-12 | 2011-06-15 | オリンパス株式会社 | 被検体情報分析装置及び被検体情報分析方法 |
| JPWO2011052061A1 (ja) * | 2009-10-29 | 2013-03-14 | キヤノン株式会社 | 光音響装置 |
| JP2012075511A (ja) * | 2010-09-30 | 2012-04-19 | Fujifilm Corp | 光音響画像診断装置、画像生成方法、及びプログラム |
| WO2012174413A1 (en) * | 2011-06-15 | 2012-12-20 | University Of Southern California | Optical coherence photoacoustic microscopy |
| CN103076286B (zh) * | 2011-10-26 | 2015-06-24 | 联发科技股份有限公司 | 用于观察物体的光声显微镜系统及其方法 |
| WO2014103106A1 (ja) * | 2012-12-25 | 2014-07-03 | オリンパス株式会社 | 光音響顕微鏡 |
-
2013
- 2013-12-25 JP JP2013267398A patent/JP6210873B2/ja not_active Expired - Fee Related
-
2014
- 2014-12-11 CN CN201480070297.7A patent/CN105848587B/zh not_active Expired - Fee Related
- 2014-12-11 DE DE112014005466.6T patent/DE112014005466T5/de not_active Withdrawn
- 2014-12-11 WO PCT/JP2014/006182 patent/WO2015098018A1/ja not_active Ceased
-
2016
- 2016-06-24 US US15/191,750 patent/US10309933B2/en not_active Expired - Fee Related
Patent Citations (3)
| Publication number | Priority date | Publication date | Assignee | Title |
|---|---|---|---|---|
| JP2011519281A (ja) * | 2007-10-25 | 2011-07-07 | ワシントン・ユニバーシティ | 光学的方位分解能を備えた共焦点光音響顕微鏡検査 |
| JP2012163526A (ja) * | 2011-02-09 | 2012-08-30 | Canon Inc | 測定装置 |
| JP2013113804A (ja) * | 2011-11-30 | 2013-06-10 | Olympus Corp | 光音響顕微鏡 |
Cited By (1)
| Publication number | Priority date | Publication date | Assignee | Title |
|---|---|---|---|---|
| US11209532B2 (en) | 2017-01-23 | 2021-12-28 | Olympus Corporation | Signal processing device, photoacoustic wave image-acquisition device, and signal processing method |
Also Published As
| Publication number | Publication date |
|---|---|
| JP2015123098A (ja) | 2015-07-06 |
| CN105848587B (zh) | 2018-10-02 |
| CN105848587A (zh) | 2016-08-10 |
| US20160305912A1 (en) | 2016-10-20 |
| DE112014005466T5 (de) | 2016-08-18 |
| JP6210873B2 (ja) | 2017-10-11 |
| US10309933B2 (en) | 2019-06-04 |
Similar Documents
| Publication | Publication Date | Title |
|---|---|---|
| JP6210873B2 (ja) | 光音響顕微鏡 | |
| US9874545B2 (en) | Photoacoustic microscope | |
| JP2007263730A (ja) | 多光子励起型観察装置 | |
| US11209532B2 (en) | Signal processing device, photoacoustic wave image-acquisition device, and signal processing method | |
| JP2014124242A (ja) | 光音響顕微鏡 | |
| US20160299218A1 (en) | Time-of-light-based systems using reduced illumination duty cycles | |
| EP3229010A3 (en) | Confocal photoacoustic microscopy with optical lateral resolution | |
| US11636616B2 (en) | Acoustic wave diagnostic apparatus and control method of acoustic wave diagnostic apparatus | |
| CN105849550A (zh) | 光声显微镜装置 | |
| CN114144120A (zh) | 超声波诊断装置及超声波诊断装置的控制方法 | |
| JP6745889B2 (ja) | 光音響画像生成装置 | |
| JP2015123098A5 (enExample) | ||
| CN103945773B (zh) | 超声波观测装置、超声波观测装置的动作方法以及超声波观测装置的动作程序 | |
| JP5936559B2 (ja) | 光音響画像生成装置および光音響画像生成方法 | |
| JP6626117B2 (ja) | 光走査装置および光走査装置の制御方法 | |
| US10429353B2 (en) | Photoacoustic microscope and photoacoustic signal detection method | |
| US10709329B2 (en) | Image pickup apparatus and method of controlling image pickup apparatus | |
| JPWO2019008867A1 (ja) | 音響波診断装置及び音響波診断装置の作動方法 | |
| US20190183347A1 (en) | Photoacoustic apparatus and object information acquiring method | |
| JP5950538B2 (ja) | 被検体情報取得装置 | |
| JP6086719B2 (ja) | 光音響顕微鏡 | |
| US20210204817A1 (en) | Photoacoustic imaging device and method | |
| US11344205B2 (en) | Photoacoustic measurement device | |
| KR20170091986A (ko) | 광영상 및 레이저 가공을 위한 초점 거리 조절 장치 및 방법 | |
| WO2023112884A1 (ja) | 測距装置、判定装置、判定方法、およびプログラム |
Legal Events
| Date | Code | Title | Description |
|---|---|---|---|
| 121 | Ep: the epo has been informed by wipo that ep was designated in this application |
Ref document number: 14873607 Country of ref document: EP Kind code of ref document: A1 |
|
| WWE | Wipo information: entry into national phase |
Ref document number: 112014005466 Country of ref document: DE |
|
| 122 | Ep: pct application non-entry in european phase |
Ref document number: 14873607 Country of ref document: EP Kind code of ref document: A1 |