WO2014013836A1 - 自動分析装置 - Google Patents
自動分析装置 Download PDFInfo
- Publication number
- WO2014013836A1 WO2014013836A1 PCT/JP2013/066987 JP2013066987W WO2014013836A1 WO 2014013836 A1 WO2014013836 A1 WO 2014013836A1 JP 2013066987 W JP2013066987 W JP 2013066987W WO 2014013836 A1 WO2014013836 A1 WO 2014013836A1
- Authority
- WO
- WIPO (PCT)
- Prior art keywords
- sample
- probe
- suction
- data
- reference data
- Prior art date
Links
Images


Classifications
-
- G—PHYSICS
- G01—MEASURING; TESTING
- G01N—INVESTIGATING OR ANALYSING MATERIALS BY DETERMINING THEIR CHEMICAL OR PHYSICAL PROPERTIES
- G01N35/00—Automatic analysis not limited to methods or materials provided for in any single one of groups G01N1/00 - G01N33/00; Handling materials therefor
- G01N35/10—Devices for transferring samples or any liquids to, in, or from, the analysis apparatus, e.g. suction devices, injection devices
- G01N35/1009—Characterised by arrangements for controlling the aspiration or dispense of liquids
-
- G—PHYSICS
- G01—MEASURING; TESTING
- G01N—INVESTIGATING OR ANALYSING MATERIALS BY DETERMINING THEIR CHEMICAL OR PHYSICAL PROPERTIES
- G01N35/00—Automatic analysis not limited to methods or materials provided for in any single one of groups G01N1/00 - G01N33/00; Handling materials therefor
- G01N35/00584—Control arrangements for automatic analysers
- G01N35/00594—Quality control, including calibration or testing of components of the analyser
- G01N35/00613—Quality control
- G01N35/00663—Quality control of consumables
-
- G—PHYSICS
- G01—MEASURING; TESTING
- G01N—INVESTIGATING OR ANALYSING MATERIALS BY DETERMINING THEIR CHEMICAL OR PHYSICAL PROPERTIES
- G01N35/00—Automatic analysis not limited to methods or materials provided for in any single one of groups G01N1/00 - G01N33/00; Handling materials therefor
- G01N35/10—Devices for transferring samples or any liquids to, in, or from, the analysis apparatus, e.g. suction devices, injection devices
- G01N35/1002—Reagent dispensers
-
- G—PHYSICS
- G01—MEASURING; TESTING
- G01N—INVESTIGATING OR ANALYSING MATERIALS BY DETERMINING THEIR CHEMICAL OR PHYSICAL PROPERTIES
- G01N35/00—Automatic analysis not limited to methods or materials provided for in any single one of groups G01N1/00 - G01N33/00; Handling materials therefor
- G01N35/10—Devices for transferring samples or any liquids to, in, or from, the analysis apparatus, e.g. suction devices, injection devices
- G01N35/1009—Characterised by arrangements for controlling the aspiration or dispense of liquids
- G01N35/1016—Control of the volume dispensed or introduced
-
- G—PHYSICS
- G01—MEASURING; TESTING
- G01N—INVESTIGATING OR ANALYSING MATERIALS BY DETERMINING THEIR CHEMICAL OR PHYSICAL PROPERTIES
- G01N35/00—Automatic analysis not limited to methods or materials provided for in any single one of groups G01N1/00 - G01N33/00; Handling materials therefor
- G01N35/00584—Control arrangements for automatic analysers
- G01N35/00594—Quality control, including calibration or testing of components of the analyser
- G01N35/00613—Quality control
- G01N35/00663—Quality control of consumables
- G01N2035/00673—Quality control of consumables of reagents
-
- G—PHYSICS
- G01—MEASURING; TESTING
- G01N—INVESTIGATING OR ANALYSING MATERIALS BY DETERMINING THEIR CHEMICAL OR PHYSICAL PROPERTIES
- G01N35/00—Automatic analysis not limited to methods or materials provided for in any single one of groups G01N1/00 - G01N33/00; Handling materials therefor
- G01N35/10—Devices for transferring samples or any liquids to, in, or from, the analysis apparatus, e.g. suction devices, injection devices
- G01N35/1009—Characterised by arrangements for controlling the aspiration or dispense of liquids
- G01N35/1016—Control of the volume dispensed or introduced
- G01N2035/1018—Detecting inhomogeneities, e.g. foam, bubbles, clots
-
- G—PHYSICS
- G01—MEASURING; TESTING
- G01N—INVESTIGATING OR ANALYSING MATERIALS BY DETERMINING THEIR CHEMICAL OR PHYSICAL PROPERTIES
- G01N35/00—Automatic analysis not limited to methods or materials provided for in any single one of groups G01N1/00 - G01N33/00; Handling materials therefor
- G01N35/10—Devices for transferring samples or any liquids to, in, or from, the analysis apparatus, e.g. suction devices, injection devices
- G01N35/1009—Characterised by arrangements for controlling the aspiration or dispense of liquids
- G01N2035/1025—Fluid level sensing
-
- G—PHYSICS
- G01—MEASURING; TESTING
- G01N—INVESTIGATING OR ANALYSING MATERIALS BY DETERMINING THEIR CHEMICAL OR PHYSICAL PROPERTIES
- G01N35/00—Automatic analysis not limited to methods or materials provided for in any single one of groups G01N1/00 - G01N33/00; Handling materials therefor
- G01N35/10—Devices for transferring samples or any liquids to, in, or from, the analysis apparatus, e.g. suction devices, injection devices
- G01N2035/1027—General features of the devices
- G01N2035/1034—Transferring microquantities of liquid
Definitions
- the present invention relates to an automatic analyzer equipped with a sample dispensing device.
- an automatic analyzer for example, in a biochemical automatic analyzer, in order to analyze a component of a biological sample such as serum or urine, a test sample is reacted with a reagent, and a change in color tone or turbidity caused by the reaction is analyzed. Optically measured by a photometric unit such as a photometer.
- the automatic analyzer In order to react the test sample and the reagent, it is necessary to perform dispensing from the container in which each is contained to the reaction container. For this reason, the automatic analyzer is provided with a dispensing device that automatically sucks and discharges the sample or reagent from the container in which the sample or reagent is stored into the reaction container.
- a sample dispensing apparatus that dispenses a test sample from a sample container to a reaction container
- dispensing abnormality may occur due to various factors.
- the sample dispensing apparatus is provided with a probe for sucking and discharging the sample.
- a probe clogging due to suction of solid foreign matters such as fibrin is a frequent cause of dispensing abnormality.
- a predetermined amount of sample cannot be dispensed into the reaction container, and a reliable analysis result cannot be obtained.
- the liquid level of the liquid in the container is detected, and the descending operation of the probe is stopped when the tip of the probe reaches slightly below the liquid level. Then, it is common to control the operation so that a predetermined amount of liquid is sucked into the probe.
- the most commonly used capacitance change method is to detect a change in capacitance when the probe touches the liquid level.
- a liquid level sensor is used, as described above, if a bubble or a liquid film exists on the liquid level, it may be erroneously detected as the liquid level, resulting in dispensing abnormality.
- Patent Document 1 data created from time-series data of pressure when suctioned normally is used as reference data, and time-series data of pressure sensor output values during suction is used as comparison data.
- a technique for detecting a suction abnormality based on the Mahalanobis distance calculated from the above is disclosed.
- reference data is prepared according to dispensing conditions including a dispensing amount, and an abnormality can be detected correctly even under different dispensing conditions.
- abnormalities are detected by calculating the Mahalanobis distance based on time-series data of pressure over the entire interval from the start to the end of suction, not only abnormalities caused by specific causes but also abnormalities caused by various causes are detected. can do.
- Patent Document 1 has a problem that it may be difficult to detect a dispensing abnormality under a dispensing condition with a small suction amount. For example, this is the case when minute foreign matter is sucked or when bubbles are sucked. In general, the pressure fluctuations in these cases tend to have a relatively small difference from the case of normal dispensing compared to the case where the probe is completely clogged or the case where a highly viscous sample is sucked.
- An object of the present invention is to realize an automatic analyzer capable of reliably detecting an abnormality during dispensing under a dispensing condition with a small amount of suction and performing a highly reliable analysis.
- the amount of suction is reduced as much as the dummy dose is not sucked, which may make it difficult to detect dispensing abnormality with high accuracy.
- the present invention is configured as follows to achieve the above object.
- the typical inventions are as follows.
- the sample probe accommodated in the sample container is aspirated and discharged into the reaction container; the reagent accommodated in the reagent container is aspirated and discharged into the reaction container; and the reaction container accommodates The analysis unit for analyzing the sample, the pressure sensor for detecting the internal pressure of the sample probe, and the sample probe for the first time suction from the sample container and the suction pressure data of the sample discharged to the reaction container from the pressure sensor
- a plurality of normal values are obtained according to the suction pressure data.
- Normal abnormality determination reference data is selected from the abnormality determination reference data, and the nth same sample suction pressure data detected by the pressure probe is detected by the pressure sensor. Calculating a feature variable, comparing the calculated feature variable with the normal / abnormal reference data, and determining whether or not there is an abnormality in the suction of the sample by the sample probe, the sample probe, the reagent probe, An automatic analyzer including the analysis unit and a controller that controls operations of the signal processing unit.
- the sample contained in the sample container is aspirated, the sample probe discharged to the reaction container, and the reagent contained in the reagent container are aspirated and discharged to the reaction container.
- the sample probe is first sucked from the sample container by the reagent probe, the analysis unit for analyzing the sample contained in the reaction container, the pressure sensor for detecting the internal pressure of the sample probe, and the sample probe.
- the characteristic variable of the suction pressure data detected by the pressure sensor is calculated, and the same sample is aspirated from the sample container by the sample probe at the nth time (2 ⁇ n (n) is a natural number).
- the feature variable of the suction pressure data detected by the pressure sensor at the nth time is calculated, and the first feature variable and the nth feature variable are combined.
- the data is calculated as the determination target data for the nth time, and the normal / abnormality determination reference data according to the suction amount of the sample sucked for the first time, and the normal / abnormality determination reference data according to the suction amount of the sample sucked at the nth time,
- the signal processing unit that compares the reference data combined with the determination target data and determines whether or not there is an abnormality in the suction of the sample by the sample probe, the sample probe, the reagent probe, the analysis unit, And a controller for controlling the operation of the signal processing unit.
- the sample accommodated in the sample container is aspirated, the sample probe ejected to the reaction container, and the reagent accommodated in the reagent container are aspirated and ejected to the reaction container.
- the sample probe is first sucked from the sample container by the reagent probe, the analysis unit for analyzing the sample contained in the reaction container, the pressure sensor for detecting the internal pressure of the sample probe, and the sample probe.
- the characteristic variable of the suction pressure data detected by the pressure sensor is calculated, and the same sample is aspirated from the sample container by the sample probe at the nth time (2 ⁇ n (n) is a natural number).
- the feature variable of the suction pressure data detected by the pressure sensor at the nth time is calculated, and the first feature variable and the nth feature variable are combined.
- the data is calculated as the determination target data for the nth time, and is detected by the first normal / abnormal judgment reference data corresponding to the amount of the sample sucked for the first time, the amount of the sample sucked for the nth time, and the pressure sensor.
- the reference data combining the second normal abnormality determination reference data selected from the plurality of normal abnormality determination reference data is compared with the determination target data
- An automatic analyzer comprising: a signal processing unit that determines whether or not there is an abnormality in sample suction by the sample probe; and a controller that controls operations of the sample probe, the reagent probe, the analysis unit, and the signal processing unit It is.
- an automatic analyzer that can reliably detect abnormalities in dispensing conditions with a small amount of suction and perform highly reliable analysis.
- an automatic analyzer capable of reliably detecting an abnormality and performing a highly reliable analysis in the second and subsequent dispensing operations of the same sample is realized.
- Example 1 is a schematic configuration diagram of an automatic analyzer to which the present invention is applied. It is explanatory drawing of the principal part (pressure signal processing part) in Example 1 of this invention. It is a figure which shows the internal state change of the sample probe from just before the start of aspiration to immediately after completion
- FIG. 1 is a schematic configuration diagram of an automatic analyzer to which the present invention is applied.
- the automatic analyzer includes a sample disk (sample disk) 101 on which a plurality of sample containers (sample containers) 100 for holding a sample can be mounted, and a first reagent disk on which a plurality of reagent containers 103 for holding reagents can be mounted. 104 and a second reagent disk 106, and a reaction disk 111 in which a plurality of reaction vessels 110 are arranged on the circumference.
- the automatic analyzer also supplies a sample probe (sample probe) 102 for dispensing a sample sucked from the sample container 100 to the reaction container 110 and a reagent sucked from the reagent container 103 in the first reagent disk 104 to the reaction container 110.
- a first reagent probe 105 to be dispensed and a second reagent probe 107 to dispense the reagent aspirated from the reagent container 103 in the second reagent disk 106 into the reaction container 110 are provided.
- the automatic analyzer includes a stirring device 108 for stirring the liquid in the reaction vessel 110, a container cleaning mechanism 109 for washing the reaction vessel 110, a light source 112 installed near the inner periphery of the reaction disk 111, and spectral detection. 113, a computer 114 connected to the spectroscopic detector 113, and a controller 115 that controls the operation of the entire automatic analyzer and exchanges data with the outside.
- the sample probe 102 is connected to the metering pump 117 via the dispensing channel 116, and a pressure sensor 118 is provided in the middle of the dispensing channel 116.
- FIG. 2 is an explanatory diagram of a main part (a pressure signal processing part in the sample probe 102) in the first embodiment of the present invention.
- a narrowed portion 200 having a smaller cross-sectional area than other portions is formed at the tip of the sample probe 102.
- the metering pump 117 is provided with a plunger 202 driven by a drive mechanism 201.
- the metering pump 117 is connected to the pump 204 through the valve 203.
- the pressure sensor 118 is connected to a signal processor (signal processing unit) 206 via an AD converter 205.
- the sample probe 102 is filled with the system liquid 207 and the sample 209 is sucked through the separation air 208.
- the example shown in FIG. 2 shows a state where the sample 209 is sucked into the sample probe 102.
- the sample probe 102 has a moving mechanism (not shown), and can move up and down and rotate to the sample container 100 and the reaction container 110.
- a sample to be examined such as serum is placed in a sample container 100 and set on a sample disk 101.
- the type of analysis required for each sample is input from the computer 114 to the controller 115.
- a sample collected from the sample container 100 by the sample probe 102 is dispensed into the reaction container 110 arranged on the reaction disk 111.
- reagent container 103 installed on the first reagent disk 104 or the second reagent disk 106 to the reaction container 110 by the first reagent probe 105 or the second reagent probe 107, and is supplied to the stirring device 108. And stirred.
- the sample and reagent dispensing amounts are set in advance for each type of analysis.
- the reaction disk 111 is periodically rotated and stopped, and photometry is performed by the spectroscopic detector 113 at the timing when the reaction vessel 110 passes in front of the light source 112. Photometry is repeated by the spectroscopic detector 113 during the reaction time of 10 minutes, and then the reaction liquid in the reaction vessel 110 is discharged and washed by the vessel washing mechanism 109. In the meantime, in another reaction vessel 110, operations using different samples and reagents are performed in parallel. Data measured by the spectroscopic detector 113 is calculated by the computer 114, and the concentration of the component corresponding to the type of analysis is calculated and displayed on the display of the computer 114.
- the controller 115 opens and closes the valve 203 to fill the flow path of the sample probe 102 with the system liquid 207 supplied from the pump 204.
- the controller 115 lowers the plunger 202 by the drive mechanism 201 while the tip of the sample probe 102 is in the air, and sucks the separation air 208.
- the controller 115 lowers the sample probe 102 into the sample container 100 and lowers the plunger 202 by a predetermined amount with the tip immersed in the sample, and sucks the sample into the probe 102.
- the suction liquid 209 is a sample.
- the pressure fluctuation of the sample probe 102 during the operation following the suction is detected by the pressure sensor 118, converted into a digital signal by the AD converter 205, and sent to the signal processor 206. Thereafter, the sample probe 102 is moved onto the reaction vessel 110 to discharge the sample.
- the pressure fluctuation during the operation continued from the time when the sample probe 102 is discharged is detected again by the pressure sensor 118, converted into a digital signal by the AD converter 205, and sent to the signal processor 206. Subsequently, the inside and outside of the sample probe 102 is cleaned by opening and closing the valve 203 to prepare for the next analysis.
- the signal processor 206 determines the presence or absence of dispensing abnormality from the pressure waveforms at the time of sample aspiration and discharge by the sample probe 102. If it is determined that there is an abnormality, the analysis is stopped and the computer 114 displays An alarm is displayed on the part, etc., and the recovery operation is performed. The return operation is selected from among other things such as re-dispensing except for the cause of the abnormality, moving to inspection of another sample, and stopping the apparatus.
- FIG. 3 is a diagram showing a change in the internal state of the sample probe 102 from immediately before the start of suction to immediately after the end.
- the sample is dispensed according to the number of analysis items.
- a dummy dose 209a is aspirated for the purpose of preventing thinning of the sample.
- the suction and discharge operations are repeated with the dummy dose 209a held in the sample probe 102.
- 6 to 12 ⁇ l of suction is performed as a dummy dose.
- the first dose is aspirated with the dummy dose 209a, it is easier to catch an abnormality during the dispense from the pressure fluctuation during the aspiration compared to the second and subsequent doses even with the same dispense amount.
- the second and subsequent dispensing since there is no suction of the dummy dose 209a, it is difficult to catch an abnormality at the time of dispensing from the pressure fluctuation at the time of suction.
- the pressure fluctuation information obtained at the time of the first dispensing is reflected in the abnormality determination after the second time, and the abnormality detection performance after the second time is improved.
- FIG. 4 is a schematic view of the output of the pressure sensor 118 during sample suction.
- the vertical axis represents the pressure due to the output of the pressure sensor 118
- the horizontal axis represents the time axis.
- the solid line indicates the pressure fluctuation when the low-viscosity sample A (within the normal range) and the broken line indicates the high-viscosity sample B (within the normal range).
- the more viscous the sample B the larger the amount of change from the pressure value before the start of suction to the pressure value during the suction, and the vibration immediately after the start of suction and immediately after the end is suppressed.
- Even when a normal sample is sucked in this way there are various pressure fluctuation patterns.
- the amount of information that can be acquired is reduced because the suction section is shortened. Therefore, it may be difficult to distinguish between the suction of bubbles in the high-viscosity sample B in the normal range and the suction of the low-viscosity sample A in the normal range when fine foreign matter is sucked.
- the reason for estimating the viscosity by the first suction is that there is a dummy dose suction, so it is larger than the actual discharge dose, and the suction section is longer than when there is no dummy dose suction. Therefore, this is because it is suitable for estimating the differential pressure described later, that is, the viscosity of the sample to be sucked.
- FIG. 5 is an internal configuration diagram of the signal processor 206 according to the first embodiment.
- the signal processor 206 includes a determination amount calculation unit 206e, a reference data selection unit 206f, a statistical distance calculation unit 206a, a memory 206b, a statistical distance calculation unit 206a, a comparison unit 206c, and a determination unit 206d. Is provided.
- the determination unit 206 d of the signal processor 206 transmits the determination result to the controller 115.
- the signal processor 206 may be provided separately from the controller 115, or may be provided in the controller 115.
- FIG. 6 is a diagram illustrating a calculation example of the determination amount in the determination amount calculation unit 206e.
- P0 is the output of the pressure sensor 118 when the sample has not been sucked yet immediately after the liquid level is detected.
- the output of the pressure sensor 118 in this state is a value affected by the atmospheric pressure.
- P1 is the output of the pressure sensor 118 immediately before the end of suction.
- the differential pressure ⁇ P between P0 and P1 reflects the viscosity of the sample. Since the output value of the pressure sensor 118 usually fluctuates finely, it is desirable that P0 and P1 are average values in a certain section.
- FIG. 7 is a diagram illustrating an example of selection of reference data in the reference data selection unit 206f.
- the reference data selection unit 206f uses the determination amount calculated by the determination amount calculation unit 206a to select from a plurality of reference data held.
- each reference data is prepared, and the reference data is selected based on the judgment amount.
- Each reference data is prepared for each dispensing amount or for each fixed dispensing amount range as a result of the characteristic variable.
- the differential pressure When the differential pressure is Pa or more and less than Pb, it becomes the reference data I, and the target viscosity is 0.9 to 1.6 mPa ⁇ s.
- the reference data II When the differential pressure is not less than Pb and less than Pc, the reference data II is obtained, and the target viscosity is 1.6 to 2.3 mPa ⁇ s.
- the reference data III When the differential pressure is equal to or higher than Pc and lower than Pd, the reference data III is obtained, and the target viscosity is 2.3 to 3.0 mPa ⁇ s.
- the statistical distance D calculated by the statistical distance calculation unit 206a is an index obtained by quantifying the similarity between two events represented by a plurality of feature variables.
- the reference data This is a calculation of how far the data measured at that time is.
- the statistical distance D there are various calculation methods for the statistical distance D, such as Mahalanobis distance, Euclidean distance, standard Euclidean distance, Manhattan distance, Chebyshev distance, Minkowski distance, and multivariate normal density.
- Mahalanobis distance D is calculated as follows.
- FIG. 8 is a diagram showing an example of reference data used for calculating the Mahalanobis distance in the first embodiment of the present invention.
- the reference data is x 11 to x 1k ,... Event number for event number 1 .
- the reference data are x n1 to x nk .
- the correlation matrix between each feature variable is obtained from the reference data, and the following calculation is performed from the inverse matrix A and the feature variable group normalized by the following equation (2) to calculate the Mahalanobis distance D.
- FIG. 9 is a flowchart of the determining operation in the first embodiment of the present invention.
- the sample probe 102 performs a suction operation in the first dispensing (STEP 1), and the statistical distance calculation unit 206a calculates a characteristic variable for the digital signal of the pressure waveform sent from the AD converter 205. (STEP2).
- the feature variable here may be anything that can accurately represent the pressure fluctuation pattern.
- the signal processor 206 holds the result of the characteristic variable when the sample probe 102 has successfully dispensed the sample as reference data in the memory 206b, and the statistical distance calculation unit 206a stores the calculated characteristic variable A statistical distance D from the reference data is calculated (STEP 3).
- the comparison unit 206c compares the statistical distance D with a predetermined threshold value stored in the memory 206b (a threshold value for determining whether or not there is an abnormality in the sample suction by the sample probe) (STEP 4). The result is supplied to the determination unit 206d.
- the determination unit 206d determines that there is an abnormality in the suction, and performs the return process 1 (STEP 5). In the return process 1, the determination unit 206d transmits an abnormality to the controller 115 and the computer 114, and the operation proceeds to the alarm process such as an alarm display and the next sample process on the display screen (abnormality notification unit) of the computer 114. This process is executed under the control of the controller 115 and the computer 114.
- the first ejection operation is performed under the control of the controller 115 in accordance with a command from the determination unit 206d (STEP 6).
- it is determined whether or not the second and subsequent dispensing has been ordered (STEP 7). If the second and subsequent dispensing has not been ordered, the process ends.
- the controller 115 determines whether or not the determination can be made independently based on the minimum amount (described later) that can determine whether or not the dispensing is correct (STEP 8).
- the minimum amount that can be determined for dispensing correctness is stored in advance in the memory 206b as a threshold for dispensing amount, and is determined based on whether the planned suction amount is greater than or less than (or exceeds or less than) this threshold.
- the controller 115 instructs the signal processor (signal processing unit) 206 to select the reference data that meets the dispensing amount condition at that time. (STEP 10), then proceed to STEP 11.
- the reason for performing the determination of STEP 8 is that when there is a large amount of dispensing after the second time, it is not necessary to select one of a plurality of reference data in the same dispensing amount, for example, reference data I, II, III. This is because it is possible to determine whether or not there is a suction abnormality by using reference data that meets predetermined dispensing volume conditions.
- the reference data selection unit 206f follows the command from the controller 115, and the reference data selection unit 206f determines the dispensing amount and the determination amount (differential pressure ⁇ P used in the first suction operation). ) To select reference data (STEP 9).
- step STEP 11 the reference data that meets the dispensing amount condition is selected by the determination amount calculation unit 206e and the reference data selection unit 206f. Then, the statistical distance calculation unit 206a calculates (extracts) the characteristic variable for the digital signal of the pressure waveform sent from the AD converter 205 (STEP 12). The statistical distance calculation unit 206a calculates a statistical distance D from the selected reference data of the calculated feature variable (STEP 13). Then, the comparison unit 206c compares the statistical distance D with a predetermined threshold stored in the memory 206b, and supplies the result to the determination unit 206d to determine whether the statistical distance D is smaller than the threshold. (STEP 14).
- the determination unit 206d determines that there is an abnormality in the suction, and performs the return process 2 (STEP 15).
- the return process 2 is a process in which the determination unit 206d transmits the presence of an abnormal suction to the controller 115 and the computer 114, and executes an operation of proceeding to the alarm process and the next sample process under the control of the controller 115 and the computer 118.
- step STEP14 when the statistical distance D is smaller than the threshold value, the controller 115 controls the discharge operation according to the command from the determination unit 206d (STEP 16). Thereafter, STEP 7 to STEP 16 are repeated until the next dispensing is completed.
- FIG. 10 is an example in which the first embodiment of the present invention is applied in actual analysis, and uses the initial information on the dispensing amount, the dummy amount, the discharge capacity, whether or not the determination can be made independently. It is a figure which shows the example of whether to determine.
- an amount (the minimum amount that can be determined for dispensing correct / incorrect) that can be independently determined to determine whether the dispensing is correct or not (STEP 8 in FIG. 9) is experimentally determined, and this dispensing amount is set in advance. .
- the dummy dose is 10.0 ⁇ l.
- a dummy dose is aspirated in addition to the discharge dose of 2.0 ⁇ l.
- the differential pressure ⁇ P is stored in the memory 206b for selection of reference data used for the determination of correctness of the second and subsequent dispensing. deep.
- a 1.2 ⁇ l discharge volume is aspirated. Since it is less than the minimum amount of 4.0 ⁇ l that can be used to determine whether dispensing alone or not, the determination is made using the initial information. The determination here is performed using reference data selected from the differential pressure ⁇ P at the first dispensing and the second dispensing amount.
- a suction volume of 8.0 ⁇ l is aspirated. Since the minimum amount that can be determined for dispensing correctness alone is 4.0 ⁇ l or more, the determination using the first information is not necessary, and the correctness determination here is performed independently.
- suction of 3.5 ⁇ l of discharge volume is performed. Since this is less than the minimum amount of 4.0 ⁇ l at which dispensing correctness can be determined, the determination is made using the initial information. The determination here is performed using reference data selected from the differential pressure ⁇ P at the time of the first dispensing and the fourth dispensing amount.
- FIG. 10 shows an example in which the minimum amount that can determine whether dispensing is correct or not is set. However, it is not always necessary to set such an amount, and the reference data is uniformly selected based on the judgment amount (STEP 9 in FIG. 9). ) That is, STEP 8 in FIG. 9 may be omitted. However, setting this minimum amount eliminates the need to store a plurality of reference data for each dispensing amount in a dispensing amount larger than this minimum amount in the memory 206b. For example, the memory 206b The capacity of can be reduced.
- FIG. 11 is a graph comparing the accuracy of abnormality determination when the present invention is applied and when the present invention is not applied.
- (A) of FIG. 11 is an example in the case where the present invention is not applied, and shows an example in which the information of the first dispensing is not reflected
- (b) in FIG. 11 is an example in the case of applying the present invention. An example of reflecting the information of the first dispensing is shown.
- FIG. 11 (a) there is an overlapping portion between the normal maximum distance and the minimum minimum distance in the statistical distance, and it is determined to be normal while being abnormally dispensed. There are cases where it is judged that there is.
- an automatic operation capable of reliably detecting an abnormality during the dispensing and performing a highly reliable analysis.
- An analyzer can be realized.
- Example 2 the application to the pressure fluctuation at the time of suction has been described.
- the present invention can be similarly applied to the pressure fluctuation at the time of discharge.
- Example 2 Next, a second embodiment of the present invention will be described.
- the difference between the second embodiment and the first embodiment of the present invention is that, in the first embodiment, reference data suitable for determining the correctness of the second and subsequent dispensing is selected based on the information from the pressure fluctuation during the first suction operation.
- reference data suitable for determining the correctness of the second and subsequent dispensing is selected based on the information from the pressure fluctuation during the first suction operation.
- whether or not the correctness determination is performed for the second and subsequent times by calculating the statistical distance between the reference data and the determination target The correctness of dispensing is determined from information obtained by combining the characteristic variables of the pressure fluctuation during the subsequent suction operation.
- FIG. 12 is an internal configuration diagram of the signal processor 206 according to the second embodiment of the present invention.
- the signal processor 206 includes a statistical distance calculation unit 206a, a memory 206b, a comparison unit 206c, a determination unit 206d, and a reference data selection unit 206f.
- the determination unit 206d of the signal processor 206 transmits the determination result to the controller 115.
- the signal processor 206 may be provided separately from the controller 115 or may be provided in the controller 115.
- the statistical distance calculation unit 206a calculates a characteristic variable for the digital signal of the pressure waveform sent from the AD converter 205.
- the characteristic variable here may be anything that can accurately represent the pressure fluctuation pattern. For example, the pressure average value at regular time intervals and the appearance timings of the minimum and maximum points of pressure fluctuation that appear when the plunger 202 starts and stops operation.
- the reference data selection unit 206f instructs the statistical distance calculation unit 206a to select prestored reference data from the memory 206 according to the suction amount.
- the result of the characteristic variable at that time is stored as data in the memory 206b.
- the result of the characteristic variable is stored as data in the memory 206b.
- the determination target whether or not the second normal suction operation is performed is data obtained by combining the result of the first feature variable and the result of the second feature variable.
- the reference data the statistical distance of the combination data of the above characteristic variables is calculated by using, as the reference data, data obtained by combining the reference data determined according to the first dispensing amount and the reference data determined according to the second dispensing amount. Determine whether normal suction.
- the combination of the first aspiration feature variable stored in the memory 206b and the n-th aspiration feature variable is a determination target.
- Normality / abnormality determination is performed by using, as reference data, data obtained by combining reference data determined in accordance with the initial dispensing amount and reference data determined in accordance with the nth dispensing amount.
- FIG. 13 is a flowchart of the discrimination operation in the second embodiment of the present invention.
- the difference between the determination operation flowchart in the second embodiment and the determination operation flowchart in the first embodiment is that step STEP9 in the first embodiment is replaced with step STEP9A in the second embodiment.
- step STEP9A of FIG. 13 data that is a combination of the characteristic variable at the time of normal first suction and the characteristic variable at the time of the nth suction is determined as the determination target, and is determined according to the first dispensing amount.
- the reference data consisting of a combination of the reference data and the reference data determined according to the nth dispensing amount is selected.
- the other steps are the same as in the first and second embodiments.
- the reference data and the data to be determined do not need to be combined data as described above, and are the same as in the first embodiment. Therefore, depending on the determination in STEP 8, the initial reference data in STEP 12 and 13 and the handling of the first characteristic variable are different.
- FIG. 14 is a diagram showing an example of combined reference data at the time of the n-th dispensing in the second embodiment of the present invention. It can be seen that by including the first reference data in the reference data, the amount of information is larger than that of the nth reference data alone. Therefore, in the second and subsequent dispensing conditions with a small amount of suction, the decrease in the amount of information based on the reduction in the amount of suction can be supplemented with the first reference data, and abnormalities during dispensing can be detected reliably. Realize an automated analyzer that can perform highly reliable analysis.
- the third embodiment is a combination of the first and second embodiments.
- the reference data suitable for the correctness determination for the nth dispensing (n ⁇ 2) is selected from a plurality of reference data held in advance.
- the reference data selected here is data composed of a combination of the reference data at the first suction operation and the reference data selected previously, as in the second embodiment.
- the determination target is a combination of the characteristic variable of the first suction pressure data and the characteristic variable of the nth suction pressure data, as in the second embodiment.
- the reference data that matches the dispensing amount condition is selected.
- the characteristic variable calculated from the pressure fluctuation at the first suction and the characteristic variable calculated from the pressure fluctuation at the n-th suction are combined to form one pattern data. Then, a statistical distance between the pattern data and the selected reference data is calculated. Whether the dispensing is correct or not is determined by comparing the calculated statistical distance with a threshold value.
- the internal configuration and other configurations of the signal processing unit 206 in the third embodiment are the same as those in the second embodiment.
- the present invention is applicable not only to biochemical automatic analyzers but also to immune automatic analyzers.
- the present invention can be applied not only to pressure fluctuation during suction but also to pressure fluctuation during discharge.
- DESCRIPTION OF SYMBOLS 100 ... Sample container, 101 ... Sample disk, 102 ... Sample probe, 103 ... Reagent container, 104 ... First reagent disk, 105 ... First reagent probe, 106 ... Second reagent disk, 107 ... second reagent probe, 108 ... stirring device, 109 ... container washing mechanism, 110 ... reaction vessel, 111 ... reaction disk, 112 ... light source, 113 ⁇ ⁇ ⁇ Spectral detector, 114 ... Computer, 115 ... Controller, 116 ... Dispensing flow path, 117 ... Quantitative pump, 118 ... Pressure sensor, 200 ... Throttle part, 201 ... Drive mechanism, 202 ... Plunger, 203 ...
Landscapes
- Analytical Chemistry (AREA)
- Physics & Mathematics (AREA)
- Health & Medical Sciences (AREA)
- Life Sciences & Earth Sciences (AREA)
- Chemical & Material Sciences (AREA)
- Biochemistry (AREA)
- General Health & Medical Sciences (AREA)
- General Physics & Mathematics (AREA)
- Immunology (AREA)
- Pathology (AREA)
- Quality & Reliability (AREA)
- Engineering & Computer Science (AREA)
- Automatic Analysis And Handling Materials Therefor (AREA)
Abstract
吸引量の少ない分注条件において、その分注時の異常を確実に検出して、信頼性の高い分析ができる自動分析装置を実現する。初回分注における吸引動作に対して統計距離算出部206aが特徴変数を計算し、基準データ選択部206fによりメモリ206bから取り出された特徴変数の基準データからの統計距離Dを計算する。比較部206cにより、統計距離Dとメモリ206bに記憶された予め定めた閾値とが比較され、その結果が判定部206dに供給される。判定部206dは、統計距離Dが定められた閾値より小さい場合は、初回の吐出動作を行う。2回目以降の分注の分注量条件により単独で判定が可能か否かをコントローラが判定し、単独判定不可であれば、初回の判断量を基に基準データを選択する。選択した基準データに基づいて、2回目以降の吸引動作の正常異常を判定する。
Description
本発明は、サンプル分注装置を備えた自動分析装置に関する。
自動分析装置において、例えば、生化学自動分析装置では、血清や尿などの生体試料の成分分析を行うために、被検試料と試薬とを反応させ、それによって生じる色調や濁りの変化を、分光光度計等の測光ユニットで光学的に測定する。
被検試料と試薬を反応させるためには、それぞれが収容されている容器から反応容器への分注を行う必要がある。このため自動分析装置では、被検試料あるいは試薬をそれぞれが収容されている容器から反応容器へ自動で吸引・吐出する分注装置を備えている。
被検試料を試料容器から反応容器へ分注するサンプル分注装置においては、種々の要因によって分注異常が発生することがある。サンプル分注装置には、サンプルの吸引、吐出を行うプローブが備えられているが、分注異常の発生要因として頻度が高いのがフィブリン等の固形異物の吸引によるプローブ詰まりである。プローブに詰まりが生じると、所定量の試料を反応容器に分注できず、信頼性のある分析結果を得ることができない。
また、被検試料の液面上に気泡あるいは液膜が存在する場合においては、気泡や液膜を液面と判断してしまい、吸引すべき量の試料を吸引できず、分注異常が発生する。
気泡や液膜が存在する場合の分注異常を回避するため、被検試料中へのプローブの浸漬量を大とすることが考えられるが、試料へのプローブの浸漬量が大となると、コンタミネーションが増大して、分析結果に悪影響を与える恐れが生じる。
そこで、プローブの液体内への浸漬深さを極力低減するために、容器内の液体の液面を検出し、プローブの先端が液面より僅かに下に達した位置でプローブの下降動作を停止させ、次いでプローブ内へ所定量の液体を吸引するように動作制御する手法が一般的である。
被検試料の液面を検出する手段としては、プローブが液面に触れたときの静電容量の変化を検知する静電容量変化方式が最も一般的に用いられている。しかし、このような液面センサを用いる場合、上述したように、液面上に気泡や液膜が存在すると、それを液面と誤検知することがあり、分注異常が発生する。
上記のような分注異常を判断する手段として、サンプルプローブを含む分注流路内に圧力センサを設け、圧力変動を基にサンプルプローブの詰まりなどの分注異常を検出する技術が数多く提案されている。
特許文献1には、正常に吸引された場合の圧力の時系列データから作成したデータを基準データとし、吸引時の圧力センサの出力値の時系列データを比較データとして、基準データと比較データとから計算したマハラノビスの距離に基づいて吸引の異常を検出する技術が開示されている。
特許文献1に記載された技術によると、分注量を含む分注条件に応じて基準データを用意し、異なる分注条件でも正しく異常を検出することができる。また、吸引開始から終了後まで全区間に渡る圧力の時系列データを基にマハラノビスの距離を計算して異常を検出するので、特定の原因によって生じる異常のみでなく、様々な原因による異常を検出することができる。
しかしながら、特許文献1に記載の方法では、吸引量の少ない分注条件において、その分注異常を検出することが困難な場合が生じる問題があった。例えば、微小な異物を吸引した場合や気泡の吸入を行った場合がそれにあたる。一般にこれらの場合の圧力変動は、プローブが完全に詰まった場合や高粘性の試料を吸引した場合と比較して、正常に分注を行った場合との差が比較的小さい傾向にある。
つまり、吸引量の少ない条件では、吸引・吐出動作時間は短く、そこから取得できる圧力情報も限られたものとなる。このため、限られた情報から小さな変化を捉える必要があり、分注異常の検出が困難となっていた。
本発明の目的は、吸引量の少ない分注条件において、その分注時の異常を確実に検出して、信頼性の高い分析ができる自動分析装置を実現することである。特に、同一試料の2回目以降の分注動作は、ダミー用量の吸引がない分、吸引量が少なくなるため、高精度な分注異常の検出が困難になる場合がある。
本発明は、上記目的を達成するために、次のように構成される。
代表的な発明を挙げれば、以下のとおりである。
(1)試料容器に収容された試料を吸引し、反応容器に吐出する試料プローブと、試薬容器に収容された試薬を吸引し、反応容器に吐出する試薬プローブと、上記反応容器に収容された試料を分析する分析部と、上記試料プローブの内部圧力を検出する圧力センサと、上記試料プローブにより、初回に上記試料容器から吸引し、反応容器に吐出する試料の吸引圧力データを上記圧力センサから取得し、同一試料についてn回目(2≦n(n)は自然数)に、上記試料プローブにより、上記試料容器から吸引し、反応容器に吐出する場合、上記吸引圧力データに応じて、複数の正常異常判定基準データのなかから正常異常判断基準データを選択し、上記圧力センサにより検出された、上記試料プローブによるn回目の同一試料吸引圧力データの特徴変数を算出し、算出した特徴変数と上記正常異常基準データとを比較し、上記試料プローブによる試料の吸引に異常があったか否かを判断する信号処理部と、上記試料プローブ、上記試薬プローブ、上記分析部、及び上記信号処理部の動作を制御するコントローラと、を備える自動分析装置である。
(2)また、別の代表的な発明を挙げれば、試料容器に収容された試料を吸引し、反応容器に吐出する試料プローブと、試薬容器に収容された試薬を吸引し、反応容器に吐出する試薬プローブと、上記反応容器に収容された試料を分析する分析部と、上記試料プローブの内部圧力を検出する圧力センサと、上記試料プローブにより、初回に上記試料容器から吸引し、反応容器に吐出することにより、上記圧力センサにより検出された吸引圧力データの特徴変数を算出し、同一試料についてn回目(2≦n(n)は自然数)に、上記試料プローブにより、上記試料容器から吸引し、反応容器に吐出する場合、n回目に上記圧力センサにより検出された吸引圧力データの特徴変数を算出し、上記初回の特徴変数とn回目特徴変数とを組み合わせたデータをn回目の判定対象データとして算出し、初回に吸引される試料の吸引量に応じた正常異常判断基準データと、n回目に吸引される試料の吸引量に応じた正常異常判断基準データとを組み合わせた基準データと、上記判定対象データとを比較して、上記試料プローブによる試料の吸引に異常があったか否かを判断する信号処理部と、上記試料プローブ、上記試薬プローブ、上記分析部、及び上記信号処理部の動作を制御するコントローラと、を備える自動分析装置である。
(3)また、別の代表的な発明を挙げれば、試料容器に収容された試料を吸引し、反応容器に吐出する試料プローブと、試薬容器に収容された試薬を吸引し、反応容器に吐出する試薬プローブと、上記反応容器に収容された試料を分析する分析部と、上記試料プローブの内部圧力を検出する圧力センサと、上記試料プローブにより、初回に上記試料容器から吸引し、反応容器に吐出することにより、上記圧力センサにより検出された吸引圧力データの特徴変数を算出し、同一試料についてn回目(2≦n(n)は自然数)に、上記試料プローブにより、上記試料容器から吸引し、反応容器に吐出する場合、n回目に上記圧力センサにより検出された吸引圧力データの特徴変数を算出し、上記初回の特徴変数とn回目特徴変数とを組み合わせたデータをn回目の判定対象データとして算出し、初回に吸引される試料の吸引量に応じた第1の正常異常判断基準データと、n回目に吸引される試料の吸引量と上記圧力センサにより検出された吸引圧力データに応じて、複数の正常異常判定基準データのなかから選択された第2の正常異常判定基準データと、を組み合わせた基準データと、上記判定対象データとを比較して、上記試料プローブによる試料の吸引に異常があったか否かを判断する信号処理部と、上記試料プローブ、上記試薬プローブ、上記分析部、及び上記信号処理部の動作を制御するコントローラと、を備える自動分析装置である。
吸引量の少ない分注条件において、その分注時の異常を確実に検出して、信頼性の高い分析ができる自動分析装置を実現する。特に、同一試料の2回目以降の分注動作において、異常を確実に検出して、信頼性の高い分析ができる自動分析装置を実現する。
以下、図面を用いて本発明の実施形態を説明する。
(実施例1)
図1は、本発明が適用される自動分析装置の概略構成図である。
図1は、本発明が適用される自動分析装置の概略構成図である。
図1において、自動分析装置は、試料を保持するサンプル容器(試料容器)100を複数搭載可能なサンプルディスク(試料ディスク)101と、試薬を保持する試薬容器103を複数搭載可能な第1試薬ディスク104および第2試薬ディスク106と、周上に複数の反応容器110を配置した反応ディスク111とを備える。
また、自動分析装置は、サンプル容器100から吸引した試料を反応容器110に分注するサンプルプローブ(試料プローブ)102と、第1試薬ディスク104内の試薬容器103から吸引した試薬を反応容器110に分注する第1試薬プローブ105と、第2試薬ディスク106内の試薬容器103から吸引した試薬を反応容器110に分注する第2試薬プローブ107とを備える。
さらに、自動分析装置は、反応容器110内の液体を撹拌する攪拌装置108と、反応容器110を洗浄する容器洗浄機構109と、反応ディスク111の内周付近に設置された光源112と、分光検出器113と、分光検出器113に接続されたコンピュータ114と、自動分析装置全体の動作を制御し、外部とのデータの交換を行うコントローラ115とを備える。
サンプルプローブ102は、分注流路116を介して定量ポンプ117と接続され、分注流路116の途中には圧力センサ118が設けられている。
図2は、本発明の実施例1における要部(サンプルプローブ102内の圧力信号処理部)の説明図である。
図2において、サンプルプローブ102の先端には、他の部位より断面積の小さい絞り部200が形成されている。また、定量ポンプ117には駆動機構201で駆動されるプランジャ202が設けられている。また、定量ポンプ117は、バルブ203を通してポンプ204に接続されている。
また、圧力センサ118は、AD変換器205を介して信号処理器(信号処理部)206に接続されている。サンプルプローブ102内はシステム液207で満たされ、分離空気208を介して試料209が吸引される。図2に示した例は、試料209がサンプルプローブ102内に吸引された状態を示している。
サンプルプローブ102は図示しない移動機構を有しており、上下、回転してサンプル容器100と反応容器110に移動できる。
次の、本発明の実施例1における動作について説明する。
図1、図2において、サンプル容器100には血清等の検査対象の試料が入れられ、サンプルディスク101にセットされる。それぞれの試料で必要な分析の種類はコンピュータ114からコントローラ115に入力される。サンプルプローブ102によってサンプル容器100から採取された試料は反応ディスク111に並べられている反応容器110に一定量分注される。
そして、一定量の試薬が第1試薬ディスク104または第2試薬ディスク106に設置された試薬容器103から第1試薬プローブ105または第2試薬プローブ107により反応容器110に分注され、攪拌装置108にて攪拌される。この試料および試薬の分注量は、分析の種類毎に予め設定されている。
反応ディスク111は、周期的に回転、停止を繰り返し、反応容器110が光源112の前を通過するタイミングで分光検出器113にて測光が行われる。10分間の反応時間の間に分光検出器113により測光を繰り返し、その後、容器洗浄機構109で反応容器110内の反応液の排出および洗浄がなされる。それらの間に別の反応容器110では、別の試料、試薬を用いた動作が並行して実施される。分光検出器113にて測光したデータはコンピュータ114で演算され、分析の種類に応じた成分の濃度を算出してコンピュータ114のディスプレイに表示される。
サンプルプローブ102の動作を、詳細に説明する。
試料を吸引する前に、まず、コントローラ115は、バルブ203を開閉してサンプルプローブ102の流路内部をポンプ204から供給されるシステム液207で満たす。次に、コントローラ115は、サンプルプローブ102の先端が空中にある状態で、駆動機構201によりプランジャ202を下降動作させ、分離空気208を吸引する。
次に、コントローラ115は、サンプルプローブ102をサンプル容器100の中に下降させ、その先端が試料内に浸かった状態でプランジャ202を所定量下降して試料をプローブ102内に吸引する。この場合、吸引液209は試料である。サンプルプローブ102の、吸引から引き続く動作中の圧力変動は、圧力センサ118で検出され、AD変換器205でデジタル変換されて信号処理器206に送られる。その後、サンプルプローブ102を反応容器110上に移動して試料を吐出する。
サンプルプローブ102の試料吐出時から引き続く動作中の圧力変動は、再び圧力センサ118で検出され、AD変換器205でデジタル変換されて信号処理器206に送られる。引き続いてサンプルプローブ102はバルブ203の開閉で内外部が洗浄され、次の分析に備える。
信号処理器206ではサンプルプローブ102の試料吸引時、および吐出時の圧力波形から分注の異常の有無を判別し、異常があったと判断された場合は、その分析を中止させ、コンピュータ114の表示部等にアラームを表示して、復帰動作をする。復帰動作は、異常の原因を除いて再分注する、別の試料の検査に移る、装置を停止するなどの中から選択される。
図3は、吸引の開始直前から終了直後にかけてのサンプルプローブ102の内部の状態変化を示す図である。
同一試料に対し複数の分析項目測定依頼がある場合には、分析項目数に応じて、試料の分注が行われる。図3において、同一試料の初回の分注においては、吐出用量209bに加えて試料の薄まり防止の目的でダミー用量209aの吸引が行われる。2回目以降の分注においては、このダミー用量209aをサンプルプローブ102内に保持した状態で吸引・吐出の動作が繰り返される。通常、ダミー用量として6~12μlの吸引が行われる。初回の分注には、ダミー用量209aの吸引が加わるため、同一の分注量であっても2回目以降と比較して吸引時の圧力変動から分注時の異常を捉え易い。一方、2回目以降の分注においては、このダミー用量209aの吸引がないため吸引時の圧力変動から分注時の異常を捉え難い。本発明では、この初回の分注時で得られる圧力変動情報を2回目以降の異常判定に反映させて分注2回目以降の異常検知性能を向上させる。
図4は、試料吸引時の圧力センサ118の出力の概形である。
図4において、縦軸は圧力センサ118の出力による圧力を表し、横軸は時間軸を示す。そして、図4に示した波形は、実線が低粘性試料A(正常範囲内)および破線が高粘性試料B(正常範囲内)を吸引した場合の圧力変動を示しており、試料の粘性の違いによって、圧力の変化量および振動の現れ方が異なることがわかる。
図4に示すように、高粘性の試料Bほど、吸引開始前の圧力値から吸引中の圧力値への変化量が大きく、吸引開始直後および終了直後の振動は抑制されたものとなる。このように正常な試料を吸引した場合においても、圧力変動パターンは多様なものとなる。特に、吸引量の少ない条件で吸引する場合、吸引区間が短くなるため取得できる情報量が減ることになる。従い、正常範囲ではあるが高粘性試料Bの気泡の吸入と、正常範囲ではあるが微小な異物吸引した場合の低粘性試料Aの吸引との区別が難しい場合がある。しかし、高精度な異常検出を行う場合には、いずれかを異常又は両方を異常と判別することが望ましい。このため、初回の吸引である程度の試料の粘度を見積もり、2回目以降の夫々の試料分注で、この粘度に応じて最適な正常異常判定用の基準データを選択して、異常判定を行う。詳細は後述する。
初回の吸引で粘度を見積もるのは、ダミー用量の吸引があるため、実際の吐出用量より多く、ダミー用量の吸引がない場合に比べ吸引区間が長い。従い、後述の差圧、つまり吸引対象試料の粘度を見積もるのに適しているためである。
図5は、本実施例1における信号処理器206の内部構成図である。
図5において、信号処理器206は、判断量算出部206eと、基準データ選択部206fと、統計距離算出部206aと、メモリ206bと、統計距離算出部206aと、比較部206c、判定部206dとを備える。信号処理器206の判定部206dは、その判定結果をコントローラ115に伝達する。信号処理器206は、コントローラ115とは別箇に設けられていてもよいし、コントローラ115内に備えられていてもよいものである。
図6は、判断量算出部206eにおける判断量の算出例を示す図である。図6において、P0は、試料の液面検知直後の未だ吸引を行っていない時の圧力センサ118の出力である。この状態での圧力センサ118の出力は、大気圧の影響を受けた値となる。
また、図6において、P1は、吸引終了直前の圧力センサ118の出力である。P0とP1の差圧ΔPを求めることにより、大気圧による影響を回避できる。モータである駆動機構201の駆動パターンが同じ分注量範囲では、P0とP1の差圧ΔPは、試料の粘性を反映したものとなる。圧力センサ118の出力値は、通常細かく変動しているので、P0およびP1は一定区間の平均値とすることが望ましい。
図7は、基準データ選択部206fにおける基準データの選択例を示す図である。図7において、基準データ選択部206fは、判断量算出部206aにおいて算出した判断量を用いて、複数保持している基準データの中から選択する。
この例においては3つの基準データが用意されており、判断量に基づいて基準データを選択する。各基準データは、特徴変数の結果として分注量ごとあるいは一定分注量範囲ごとに用意されている。
差圧がPa以上でありPb未満の場合は、基準データIとなり、対象とする粘度は、0.9~1.6mPa・sである。また、差圧がPb以上でありPc未満の場合は、基準データIIとなり、対象とする粘度は、1.6~2.3mPa・sである。また、差圧がPc以上でありPd未満の場合は、基準データIIIとなり、対象とする粘度は、2.3~3.0mPa・sである。
統計距離算出部206aで計算される統計距離Dは、複数の特徴変数で代表される2つの事象間の類似性を数値化した指標であり、本発明の実施例1の場合は、上記基準データの集合に対して、その時に測定したデータが、どれだけ離れているかの計算になる。統計距離Dの計算法には、マハラノビス距離、ユークリッド距離、標準ユークリッド距離、マンハッタン距離、チェビシェフ距離、ミンコフスキー距離、多変量正規密度などいくつもの計算法がある。
例えば、マハラノビスの距離Dは以下のように計算する。
図8は、本発明の実施例1におけるマハラノビスの距離を算出するために用いる基準データの例を示す図である。
図8に示すように、特徴変数番号が、1からkまであり、事象番号が1からnまであれば、事象番号1に対して、基準データは、x11~x1k、・・・事象番号nに対して、基準データは、xn1~xnkとする。
判定対象の各特徴変数x1、x2、・・・、xkに対し、基準データの各特徴変数の平均x’1、x’2、・・・、x’k(式(1)中では変数xにバーを付す)および標準偏差σ1、σ2、・・・、σkを用いて、次式(1)の演算を行い正規化する。

ただし、式(1)において、i=1、2、・・・、k(整数)である。
基準データから各特徴変数間の相関行列を求め、その逆行列Aと、次式(2)により正規化した特徴変数群から以下の演算を行い、マハラノビスの距離Dを算出する。
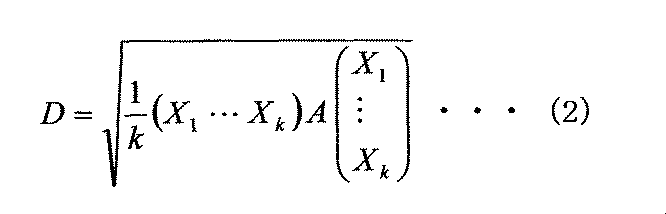
図9は、本発明の実施例1における判別動作のフローチャートである。
図9において、サンプルプローブ102にて初回の分注における吸引動作を行い(STEP1)、統計距離算出部206aが、AD変換器205から送られてくる圧力波形のデジタル信号について、特徴変数を計算する(STEP2)。
ここでの特徴変数は、圧力変動のパターンを的確に表現できるものであればよい。例えば、一定時間間隔ごとの圧力平均値やプランジャ202の動作開始および停止時に現れる圧力変動の極小点および極大点の出現タイミングなどである。
また、信号処理器206は、サンプルプローブ102が正常に試料を分注できた場合の特徴変数の結果を基準データとしてメモリ206bに保持しており、統計距離算出部206aは、計算した特徴変数の基準データからの統計距離Dを計算する(STEP3)。
そして、比較部206cにより、統計距離Dと、メモリ206bに記憶された予め定めた閾値(試料プローブによる試料の吸引に異常があったか否かを判断するための閾値)とが比較され(STEP4)、その結果が判定部206dに供給される。
判定部206dは、統計距離Dが定められた閾値よりも大きい場合には、吸引に異常ありと判定し、復帰処理1を実施する(STEP5)。この復帰処理1は、判定部206dがコントローラ115及びコンピュータ114に吸引異常ありを伝達し、コンピュータ114の表示画面(異常報知部)によりアラーム表示等のアラーム処理及び次の検体の処理に進む動作を、コントローラ115、コンピュータ114の制御により実行する処理である。
STEP4において、統計距離Dが閾値より小さい場合は、判定部206dからの指令に従って、コントローラ115の制御により、初回の吐出動作に移行する(STEP6)。次に、2回目以降の分注がオーダーされているかの判断を行い(STEP7)、2回目以降の分注がオーダーされていなければ処理は終了する。STEP7において、2回目以降の分注がオーダーされている場合、分注正否判断可能最少量(後述する)により、単独で判定が可能か否かをコントローラ115が判定する(STEP8)。この分注正否判定可能最少量は、予めメモリ206bに分注量の閾値として格納されており、予定吸引量が、この閾値以上か未満か(若しくは、越えるか以下か)で判定される。STEP8において、単独での判定が可能(閾値以上)であれば、コントローラ115から信号処理器(信号処理部)206に指令し、そのときの分注量条件に合う基準データを選択させることを決定し(STEP10)、STEP11に進む。STEP8の判定を行う理由は、2回目以降の分注量が多い場合には、同じ分注量における複数の基準データ、例えば基準データI、II、IIIの内から1つを選択しなくても、予め定められた分注量条件に合う基準データを用いることで、吸引異常か否かを判別できるためである。
STEP8において、単独での判定が不可(閾値未満)の場合は、コントローラ115からの指令に従って、基準データ選択部206fは、分注量と、初回の吸引動作において用いられた判断量(差圧ΔP)とに基づいて基準データを選択する(STEP9)。
次に、同一サンプルの2回目以降の吸引動作が行われる(STEP11)。ステップSTEP10により基準データを選択することが決定されている場合は、判断量算出部206e、基準データ選択部206fにより分注量条件に合う基準データが選択される。そして、統計距離算出部206aが、AD変換器205から送られてくる圧力波形のデジタル信号について、特徴変数を計算(抽出)する(STEP12)。統計距離算出部206aは、計算した特徴変数の選択した基準データからの統計距離Dを計算する(STEP13)。そして、比較部206cにより、統計距離Dと、メモリ206bに記憶された予め定めた閾値とが比較され、その結果が判定部206dに供給され、統計距離Dが閾値より小さいか否かが判定される(STEP14)。
判定部206dは、統計距離Dが定められた閾値より以上の場合には、吸引に異常ありと判定し、復帰処理2を実施する(STEP15)。この復帰処理2は、判定部206dがコントローラ115、コンピュータ114に吸引異常ありを伝達し、アラーム処理及び次の検体の処理に進む動作を、コントローラ115、コンピュータ118の制御により実行する処理である。
ステップSTEP14において、統計距離Dが閾値より小さい場合は、判定部206dからの指令に従って、コントローラ115の制御により、吐出動作に移行する(STEP16)。以後、次の分注が終了するまでSTEP7からSTEP16を繰り返す。
図10は、実際の分析における本発明の実施例1を適用した例であり、各回の分注量、ダミー量、吐出容量、単独での判定が可能か否か、初回の情報を使用して判定するか否かの例を示す図である。図10において、予め単独での分注の正否判断(図9のSTEP8)が可能な量(分注正否判断可能最少量)を実験的に求めておき、この分注量を予め設定しておく。
この場合、4.0μlを単独での分注の正否判断が可能な最少量と設定したとする。また、この場合のダミー用量については、10.0μlとする。初回の分注においては、吐出用量2.0μlに加えてダミー用量の吸引が行われる。単独での分注の正否判定を行い、正常であると判定された場合には、2回目以降の分注の正否判定に使用する基準データの選択用に差圧ΔPをメモリ206bに格納しておく。
2回目の分注では、吐出用量1.2μlの吸引が行われる。単独での分注正否判断可能最少量4.0μl未満であるので、初回の情報を使用して判定がなされる。ここでの判定は、初回分注時の差圧ΔPと、2回目の分注量とから選択した基準データを使用して判定を行う。
3回目の分注では、吐出用量8.0μlの吸引が行われる。単独での分注正否判断可能最少量4.0μl以上であるので、初回の情報を使用しての判定は不要であり、ここでの正否判定は、単独での判定を行う。4回目の分注では、吐出用量3.5μlの吸引が行われる。これは、分注正否判断可能最少量4.0μl未満であるので、初回の情報を使用して判定がなされる。ここでの判定は、初回分注時の差圧ΔPと4回目の分注量とから選択した基準データを使用して判定を行う。
図10は、分注正否判定可能最少量を設定した場合の例を示したが、このような量を必ずしも設定する必要はなく、一律に判断量を基に基準データを選択(図9のSTEP9)してもよい。つまり、図9のSTEP8を9を省略してもよい。しかしながら、この最少量を設定しておくことで、この最少量よりも多い分注量における、分注量ごとの複数の基準データを、メモリ206bに格納しておく必要がなくなるので、例えばメモリ206bの容量を小さくすることができる。
図11は、本発明を適用した場合と、本発明を適用しなかった場合の、異常判定の精度を比較するグラフである。図11の(a)は本発明を適用しない場合の例であり、初回分注の情報を反映しない場合の例を示し、図11の(b)は本発明を適用した場合の例であり、初回分注の情報を反映した場合の例を示す。
図11の(a)では統計距離における、正常の最大距離と異常の最少距離とで重複する部分が存在し、異常分注でありながら、正常と判断し、正常分注でありながら、異常であると判断したケースがある。
一方、図11の(b)に示す、本願を適用した場合は、統計距離における、正常の最大距離と異常の最少距離とは重複する部分はなく、異常分注と正常分注とが明確に区別されていることが分かる。
以上のように、本発明の実施例1によれば、2回目以降の吸引量の少ない分注条件においても、その分注時の異常を確実に検出して、信頼性の高い分析ができる自動分析装置を実現することができる。
なお、本実施例1では、吸引時の圧力変動に対する適用について述べたが、本発明は吐出時の圧力変動に対しても同様に適用可能である。
(実施例2)
次に、本発明の実施例2について、説明する。なお、実施例1と共通する構成及び動作については、図示及びその詳細な説明は省略する。つまり、実施例1において説明した図1~図3で示した構成、動作は、実施例2においても、同様な構成、動作となっている。
(実施例2)
次に、本発明の実施例2について、説明する。なお、実施例1と共通する構成及び動作については、図示及びその詳細な説明は省略する。つまり、実施例1において説明した図1~図3で示した構成、動作は、実施例2においても、同様な構成、動作となっている。
本発明の実施例2と実施例1との違いは、実施例1では初回の吸引動作時の圧力変動からの情報を基に2回目以降の分注の正否判定に適した基準データを選択して、その基準データと判定対象との統計距離を求めることにより2回目以降の正否判定を行っていたのに対して、本実施例2では初回の吸引動作時の圧力変動の特徴変数と、それ以降の回の吸引動作時圧力変動の特徴変数とを組み合わせた情報から分注の正否判定を行うことである。
図12は、本発明の実施例2における信号処理器206の内部構成図である。図12において、信号処理器206は、統計距離算出部206aと、メモリ206bと、比較部206cと、判定部206dと、基準データ選択部206fとを備える。
信号処理器206の判定部206dは、その判定結果をコントローラ115に伝達する。信号処理器206は、コントローラ115とは別箇に設けられていてもよいし、コントローラ115内に備えられていてもよい。初回の分注における吸引動作が行われると、統計距離算出部206aが、AD変換器205から送られてくる圧力波形のデジタル信号について、特徴変数を計算する。ここでの特徴変数は、圧力変動のパターンを的確に表現できるものであればよい。例えば、一定時間間隔ごとの圧力平均値やプランジャ202の動作開始および停止時に現れる圧力変動の極小点および極大点の出現タイミングなどである。
そして、メモリ206bに格納された基準データと計算した特徴変数との統計距離を算出する。基準データ選択部206fは、初回の吸引動作の場合は、予め格納された基準データを吸引量に応じてメモリ206から選択するように、統計距離算出部206aに指令する。
サンプルプローブ102が正常に試料を分注できた場合、そのときの特徴変数の結果をデータとしてメモリ206bに格納する。そして、2回目の吸引においても特徴変数の結果をデータとしてメモリ206bに格納する。2回目の正常吸引動作か否かの判定対象は、この初回の特徴変数の結果と、2回目の特徴変数の結果とを組み合わせたデータとする。基準データとして、初回の分注量に応じて定まる基準データと2回目の分注量に応じて定まる基準データとを組み合わせたデータを基準データとして、上記特徴変数の組合せデータの統計距離を算出し、正常吸引か否かを判断する。
そして、n回目(2≦n(n)は自然数)の試料吸引においては、メモリ206bに格納された初回の吸引時の特徴変数と、n回目吸引時特徴変数とを組み合わせたデータを判定対象とし、初回の分注量に応じて定まる基準データとn回目の分注量に応じて定まる基準データを組み合わせたデータを基準データして、正常異常判定を行う。
図13は、本発明の実施例2における判別動作のフローチャートである。この実施例2における判別動作フローチャートと、実施例1における判別動作フローチャートとの相違点は、実施例1のステップSTEP9が実施例2では、ステップSTEP9Aに置き換わっているところである。
つまり、図13のステップSTEP9Aにおいては、正常な初回の吸引時の特徴変数と、n回目吸引時特徴変数とを組み合わせたデータを判定対象として、基準データとして、初回の分注量に応じて定まる基準データとn回目の分注量に応じて定まる基準データとの組み合わせからなる基準データを選択する。他のステップは、実施例1と実施例2とは同等となっている。なお、STEP8で、単独での判定が可能な場合(STEP10)においては、基準データや判定対象のデータを、上述のような組合せデータとする必要がなく、実施例1と同様である。従い、STEP8での判定により、STEP12と13の初回の基準データと初回の特徴変数の扱いも異なる。
図14は、本発明の実施例2におけるn回目の分注時における組合せられた基準データの例を示す図である。基準データに、初回の基準データを含ませることで、n回目の基準データ単独よりも情報量が多くなっていることが分かる。従い、2回目以降の吸引量の少ない分注条件において、吸引量が減ることに基づく、情報量の減少を初回の基準データで補完することができ、分注時の異常を確実に検出して、信頼性の高い分析ができる自動分析装置を実現する。
以上のように、本発明の実施例2においても、実施例1と同様な効果を得ることができる。
(実施例3)
次に、本発明の実施例3について説明する。実施例3は、実施例1と2との組合せである。実施例1と同様に、初回の吸引動作時の圧力変動情報を基に、分注n回目(n≧2)の正否判定に適した基準データを、予め複数保持する基準データの中から選択する。さらに、ここで選択する基準データは、実施例2と同様に、初回の吸引動作時の基準データと、先に選択された基準データとの組合せからなるデータである。一方、判定対象は実施例2と同様に、初回の吸引圧力データの特徴変数と、n回目の吸引圧力データの特徴変数とのの組み合わせからなるものである。
次に、本発明の実施例3について説明する。実施例3は、実施例1と2との組合せである。実施例1と同様に、初回の吸引動作時の圧力変動情報を基に、分注n回目(n≧2)の正否判定に適した基準データを、予め複数保持する基準データの中から選択する。さらに、ここで選択する基準データは、実施例2と同様に、初回の吸引動作時の基準データと、先に選択された基準データとの組合せからなるデータである。一方、判定対象は実施例2と同様に、初回の吸引圧力データの特徴変数と、n回目の吸引圧力データの特徴変数とのの組み合わせからなるものである。
分注n回目(n≧2)の正否判定においては、単独での判定が可能であれば、分注量条件に合致する基準データを選択する。単独での不可の場合は、初回の吸引時の圧力変動から算出した特徴変数と、n回目の吸引時の圧力変動から算出した特徴変数とを組み合わせ、一つのパターンデータとする。そして、このパターンデータと、選択した基準データとの統計距離を計算する。計算した統計距離と閾値との比較により、分注の正否を判断する。
実施例3における、信号処理部206の内部構成その他の構成は、実施例2と同様となっている。
本発明の実施例3においても、実施例1、2と同様な効果を得ることができる。
なお、本発明は、生化学自動分析装置のみならず、免疫自動分析装置にも適用可能である。
また、本発明は、吸引時の圧力変動のみならず、吐出時の圧力変動に対しても同様に適用可能である。
100・・・サンプル容器、 101・・・サンプルディスク、 102・・・サンプルプローブ、 103・・・試薬容器、 104・・・第1試薬ディスク、 105・・・第1試薬プローブ、 106・・・第2試薬ディスク、 107・・・第2試薬プローブ、 108・・・攪拌装置、 109・・・容器洗浄機構、 110・・・反応容器、 111・・・反応ディスク、 112・・・光源、 113・・・分光検出器、 114・・・コンピュータ、 115・・・コントローラ、 116・・・分注流路、 117・・・定量ポンプ、 118・・・圧力センサ、 200・・・絞り部、 201・・・駆動機構、 202・・・プランジャ、 203・・・バルブ、 204・・・ポンプ、 205・・・A/D変換器、 206・・・信号処理器、 206a・・・判断量算出部、 206b・・・メモリ、 206c・・・比較部、 206d・・・判定部、 206e・・・ 判断量算出部、 206f・・・基準データ算出部、 207・・・システム液、 208・・・分離空気、 209・・・吸引液
Claims (12)
- 試料容器に収容された試料を吸引し、反応容器に吐出する試料プローブと、
試薬容器に収容された試薬を吸引し、反応容器に吐出する試薬プローブと、
上記反応容器に収容された試料を分析する分析部と、
上記試料プローブの内部圧力を検出する圧力センサと、
上記試料プローブにより、初回に上記試料容器から吸引し、反応容器に吐出する試料の吸引圧力データを上記圧力センサから取得し、
同一試料についてn回目(2≦n(n)は自然数)に、上記試料プローブにより、上記試料容器から吸引し、反応容器に吐出する場合、上記吸引圧力データに応じて、複数の正常異常判定基準データのなかから正常異常判断基準データを選択し、
上記圧力センサにより検出された、上記試料プローブによるn回目の同一試料吸引圧力データの特徴変数を算出し、
算出した特徴変数と上記正常異常基準データとを比較し、上記試料プローブによる試料の吸引に異常があったか否かを判断する信号処理部と、
上記試料プローブ、上記試薬プローブ、上記分析部、及び上記信号処理部の動作を制御するコントローラと、
を備えることを特徴とする自動分析装置。 - 請求項1に記載の自動分析装置において、
前記正常異常判定基準データは、上記吸引圧力データの上記試料プローブ内の圧力と試料吸引終了直前の上記試料プローブ内の圧力との圧力差に応じて選択されることを特徴とする自動分析装置。 - 請求項2に記載の自動分析装置において、
上記信号処理部は、上記同一試料について、n回目(2≦n(n)は自然数)に、上記試料プローブにより、上記試料容器から吸引し、反応容器に吐出する場合、n回目に吸引し、吐出する試料の量が所定の量未満であれば、上記初回の試料情報の上記圧力差及びn回目の試料の吸引量に従って上記正常異常判断基準データを選択し、
上記吸引し、吐出する試料の量が上記所定の量以上であれば、上記吸引し吐出する試料の吸引量に従って正常異常判断基準データを選択し、
上記試料プローブによる同一試料のn回目における吸引圧力データの特徴変数と上記選択したいずれかの基準データとを比較し、上記試料プローブによる試料の吸引に異常があったか否かを判断することを特徴とする自動分析装置。 - 請求項3に記載の自動分析装置において、
上記信号処理部は、
上記試料プローブによる試料の吸引圧力データの圧力差である判断量を算出する判断量算出部と、
試料の吸引量毎に予め定められた正常異常判断基準データと、上記試料プローブによる初回の試料吸引圧力データと、上記試料プローブによる試料の吸引圧力データの特徴変数と基準データとの比較により上記試料プローブによる試料の吸引に異常があったか否かを判断するための異常判定閾値とを格納するメモリと、
上記判断量算出部により算出された判断量に基づいて、上記メモリに格納された複数の上記正常異常判断基準データのうちのいずれかを選択する基準データ選択部と、
上記試料プローブによる試料の吸引圧力データの特徴変数と上記選択したいずれかの基準データとの統計距離を算出する統計距離算出部と、
上記統計距離算出部により算出された統計距離と上記メモリに記憶された異常判定閾値とを比較する比較部と、
上記比較部による比較に基づいて上記試料プローブによる試料の吸引動作が正常か異常かを判定する判定部と、
を有することを特徴とする自動分析装置。 - 請求項4に記載の自動分析装置において、
上記圧力差は、上記試料プローブが試料の液面を検知して停止してから試料の吸引が開始されるまでの間における上記圧力センサの検出圧力と試料の吸引中における上記圧力センサの検出圧力との差圧であることを特徴とする自動分析装置。 - 請求項4に記載の自動分析装置において、
上記メモリに格納された上記正常異常判断基準データは、試料の粘性に従って区分された圧力波形データであることを特徴とする自動分析装置。 - 請求項4に記載の自動分析装置において、
上記統計距離算出部が算出する上記統計距離は、マハラノビス距離、ユークリッド距離、標準ユークリッド距離、マンハッタン距離、チェビシェフ距離、ミンコフスキー距離、多変量正規密度のいずれかであることを特徴とする自動分析装置。 - 試料容器に収容された試料を吸引し、反応容器に吐出する試料プローブと、
試薬容器に収容された試薬を吸引し、反応容器に吐出する試薬プローブと、
上記反応容器に収容された試料を分析する分析部と、
上記試料プローブの内部圧力を検出する圧力センサと、
上記試料プローブにより、初回に上記試料容器から吸引し、反応容器に吐出することにより、上記圧力センサにより検出された吸引圧力データの特徴変数を算出し、同一試料についてn回目(2≦n(n)は自然数)に、上記試料プローブにより、上記試料容器から吸引し、反応容器に吐出する場合、n回目に上記圧力センサにより検出された吸引圧力データの特徴変数を算出し、上記初回の特徴変数とn回目特徴変数とを組み合わせたデータをn回目の判定対象データとして算出し、
初回に吸引される試料の吸引量に応じた正常異常判断基準データと、n回目に吸引される試料の吸引量に応じた正常異常判断基準データとを組み合わせた基準データと、上記判定対象データとを比較して、上記試料プローブによる試料の吸引に異常があったか否かを判断する信号処理部と、
上記試料プローブ、上記試薬プローブ、上記分析部、及び上記信号処理部の動作を制御するコントローラと、
を備えることを特徴とする自動分析装置。 - 請求項8に記載の自動分析装置において、
上記信号処理部は、上記同一試料において、n回目(2≦n(n)は自然数)に、上記試料プローブにより、上記試料容器から吸引し、反応容器に吐出する場合、n回目に吸引し、吐出する試料の量が所定の量未満であれば、上記組み合わせた基準データと、上記組み合わせた判定対象データとを比較し、
上記吸引し、吐出する試料の量が上記所定の量以上であれば、上記吸引し吐出する試料の吸引量に従って正常異常判断基準データと、上記試料プローブによる同一試料のn回目における吸引圧力データの特徴変数を判定対象データとして比較し、
上記試料プローブによる試料の吸引に異常があったか否かを判断することを特徴とする自動分析装置。 - 請求項9に記載の自動分析装置において、
上記信号処理部は、
上記試料プローブによる試料の吸引に異常があったか否かを判断するための異常判定閾値と、
上記判定対象データと上記正常異常判断基準データとの統計距離を算出する統計距離算出部と、
上記統計距離算出部により算出された統計距離とメモリに記憶された異常判定閾値とを比較する比較部と、
上記比較部による比較に基づいて上記試料プローブによる試料の吸引動作が正常か異常かを判定する判定部と、
を有することを特徴とする自動分析装置。 - 試料容器に収容された試料を吸引し、反応容器に吐出する試料プローブと、
試薬容器に収容された試薬を吸引し、反応容器に吐出する試薬プローブと、
上記反応容器に収容された試料を分析する分析部と、
上記試料プローブの内部圧力を検出する圧力センサと、
上記試料プローブにより、初回に上記試料容器から吸引し、反応容器に吐出することにより、上記圧力センサにより検出された吸引圧力データの特徴変数を算出し、同一試料についてn回目(2≦n(n)は自然数)に、上記試料プローブにより、上記試料容器から吸引し、反応容器に吐出する場合、n回目に上記圧力センサにより検出された吸引圧力データの特徴変数を算出し、上記初回の特徴変数とn回目特徴変数とを組み合わせたデータをn回目の判定対象データとして算出し、
初回に吸引される試料の吸引量に応じた第1の正常異常判断基準データと、n回目に吸引される試料の吸引量と上記圧力センサにより検出された吸引圧力データに応じて、複数の正常異常判定基準データのなかから選択された第2の正常異常判定基準データと、を組み合わせた基準データと、上記判定対象データとを比較して、上記試料プローブによる試料の吸引に異常があったか否かを判断する信号処理部と、
上記試料プローブ、上記試薬プローブ、上記分析部、及び上記信号処理部の動作を制御するコントローラと、
を備えることを特徴とする自動分析装置。 - 請求項11に記載の自動分析装置において、
前記第2の正常異常判定基準データは、上記吸引圧力データの上記試料プローブ内の圧力と試料吸引終了直前の上記試料プローブ内の圧力との圧力差に応じて選択されることを特徴とする自動分析装置。
Priority Applications (3)
| Application Number | Priority Date | Filing Date | Title |
|---|---|---|---|
| US14/410,113 US9897624B2 (en) | 2012-07-20 | 2013-06-20 | Automatic analyzer |
| EP13819196.0A EP2876449B1 (en) | 2012-07-20 | 2013-06-20 | Automatic analysis device |
| CN201380037974.0A CN104487851B (zh) | 2012-07-20 | 2013-06-20 | 自动分析装置 |
Applications Claiming Priority (2)
| Application Number | Priority Date | Filing Date | Title |
|---|---|---|---|
| JP2012162026A JP5899075B2 (ja) | 2012-07-20 | 2012-07-20 | 自動分析装置 |
| JP2012-162026 | 2012-07-20 |
Publications (1)
| Publication Number | Publication Date |
|---|---|
| WO2014013836A1 true WO2014013836A1 (ja) | 2014-01-23 |
Family
ID=49948671
Family Applications (1)
| Application Number | Title | Priority Date | Filing Date |
|---|---|---|---|
| PCT/JP2013/066987 WO2014013836A1 (ja) | 2012-07-20 | 2013-06-20 | 自動分析装置 |
Country Status (5)
| Country | Link |
|---|---|
| US (1) | US9897624B2 (ja) |
| EP (1) | EP2876449B1 (ja) |
| JP (1) | JP5899075B2 (ja) |
| CN (1) | CN104487851B (ja) |
| WO (1) | WO2014013836A1 (ja) |
Cited By (4)
| Publication number | Priority date | Publication date | Assignee | Title |
|---|---|---|---|---|
| WO2015174226A1 (ja) * | 2014-05-15 | 2015-11-19 | 株式会社日立ハイテクノロジーズ | 自動分析装置 |
| EP3101431A4 (en) * | 2014-01-27 | 2017-10-25 | Hitachi High-Technologies Corporation | Automatic analytical apparatus |
| US10267817B2 (en) * | 2014-07-29 | 2019-04-23 | Hitachi High-Technologies Corporation | Automatic analysis apparatus |
| WO2021111725A1 (ja) * | 2019-12-05 | 2021-06-10 | 株式会社日立ハイテク | 自動分析装置及び分注方法 |
Families Citing this family (10)
| Publication number | Priority date | Publication date | Assignee | Title |
|---|---|---|---|---|
| JP6018828B2 (ja) * | 2012-07-27 | 2016-11-02 | 株式会社日立ハイテクノロジーズ | 自動分析装置 |
| EP3086127A4 (en) * | 2013-12-16 | 2017-08-02 | Shimadzu Corporation | Liquid collection device and automated analyzer provided therewith |
| WO2016130964A1 (en) | 2015-02-13 | 2016-08-18 | Abbott Laboratories | Decapping and capping apparatus, systems and methods for use in diagnostic analyzers |
| US11169166B2 (en) * | 2015-02-23 | 2021-11-09 | Hitachi High-Tech Corporation | Automatic analyzer |
| JP6567890B2 (ja) * | 2015-06-19 | 2019-08-28 | 株式会社日立ハイテクノロジーズ | 自動分析装置 |
| CN110291406B (zh) * | 2017-02-07 | 2023-07-18 | 株式会社日立高新技术 | 自动分析装置 |
| JP7033668B2 (ja) * | 2018-09-26 | 2022-03-10 | 株式会社日立ハイテク | 自動分析システム |
| WO2020148853A1 (ja) * | 2019-01-17 | 2020-07-23 | 株式会社島津製作所 | クロマトグラフ用オートサンプラ及び流体クロマトグラフィー分析システム |
| JP7181821B2 (ja) * | 2019-03-15 | 2022-12-01 | 株式会社日立ハイテク | 自動分析装置 |
| JP2022188829A (ja) * | 2021-06-10 | 2022-12-22 | 株式会社日立ハイテク | 分注装置、自動分析装置及び分注方法 |
Citations (4)
| Publication number | Priority date | Publication date | Assignee | Title |
|---|---|---|---|---|
| JP2004125780A (ja) * | 2002-08-07 | 2004-04-22 | Hitachi High-Technologies Corp | サンプル分注装置およびそれを用いた自動分析装置 |
| JP2004177308A (ja) * | 2002-11-28 | 2004-06-24 | Toshiba Medical System Co Ltd | 吸引状態判定方法及び自動化学分析装置 |
| JP2004271266A (ja) * | 2003-03-06 | 2004-09-30 | Hitachi High-Technologies Corp | 分注装置およびそれを用いた自動分析装置 |
| JP2008224691A (ja) | 2002-08-07 | 2008-09-25 | Hitachi High-Technologies Corp | 自動分析装置 |
Family Cites Families (5)
| Publication number | Priority date | Publication date | Assignee | Title |
|---|---|---|---|---|
| WO2007086477A1 (ja) * | 2006-01-27 | 2007-08-02 | Kabushiki Kaisha Toshiba | 自動分析装置及びプローブ昇降方法 |
| JP2007322319A (ja) | 2006-06-02 | 2007-12-13 | Olympus Corp | サンプル分注装置 |
| JP2008002897A (ja) | 2006-06-21 | 2008-01-10 | Olympus Corp | 分注装置および自動分析装置 |
| EP2031403B1 (en) * | 2007-08-27 | 2016-02-17 | Roche Diagnostics GmbH | Method for monitoring a fluid transfer process |
| JP5300447B2 (ja) * | 2008-12-04 | 2013-09-25 | ベックマン コールター, インコーポレイテッド | 自動分析装置および自動分析装置における検体分注方法 |
-
2012
- 2012-07-20 JP JP2012162026A patent/JP5899075B2/ja active Active
-
2013
- 2013-06-20 US US14/410,113 patent/US9897624B2/en active Active
- 2013-06-20 CN CN201380037974.0A patent/CN104487851B/zh active Active
- 2013-06-20 EP EP13819196.0A patent/EP2876449B1/en active Active
- 2013-06-20 WO PCT/JP2013/066987 patent/WO2014013836A1/ja active Application Filing
Patent Citations (4)
| Publication number | Priority date | Publication date | Assignee | Title |
|---|---|---|---|---|
| JP2004125780A (ja) * | 2002-08-07 | 2004-04-22 | Hitachi High-Technologies Corp | サンプル分注装置およびそれを用いた自動分析装置 |
| JP2008224691A (ja) | 2002-08-07 | 2008-09-25 | Hitachi High-Technologies Corp | 自動分析装置 |
| JP2004177308A (ja) * | 2002-11-28 | 2004-06-24 | Toshiba Medical System Co Ltd | 吸引状態判定方法及び自動化学分析装置 |
| JP2004271266A (ja) * | 2003-03-06 | 2004-09-30 | Hitachi High-Technologies Corp | 分注装置およびそれを用いた自動分析装置 |
Non-Patent Citations (1)
| Title |
|---|
| See also references of EP2876449A4 |
Cited By (11)
| Publication number | Priority date | Publication date | Assignee | Title |
|---|---|---|---|---|
| EP3101431A4 (en) * | 2014-01-27 | 2017-10-25 | Hitachi High-Technologies Corporation | Automatic analytical apparatus |
| US10031152B2 (en) | 2014-01-27 | 2018-07-24 | Hitachi High-Technologies Corporation | Automatic analyzer |
| WO2015174226A1 (ja) * | 2014-05-15 | 2015-11-19 | 株式会社日立ハイテクノロジーズ | 自動分析装置 |
| CN106461693A (zh) * | 2014-05-15 | 2017-02-22 | 株式会社日立高新技术 | 自动分析装置 |
| JPWO2015174226A1 (ja) * | 2014-05-15 | 2017-04-20 | 株式会社日立ハイテクノロジーズ | 自動分析装置 |
| EP3144678A4 (en) * | 2014-05-15 | 2017-12-27 | Hitachi High-Technologies Corporation | Automated analysis device |
| US10288637B2 (en) | 2014-05-15 | 2019-05-14 | Hitachi High-Technologies Corporation | Automatic analyzer |
| US10267817B2 (en) * | 2014-07-29 | 2019-04-23 | Hitachi High-Technologies Corporation | Automatic analysis apparatus |
| WO2021111725A1 (ja) * | 2019-12-05 | 2021-06-10 | 株式会社日立ハイテク | 自動分析装置及び分注方法 |
| JP2021089232A (ja) * | 2019-12-05 | 2021-06-10 | 株式会社日立ハイテク | 自動分析装置及び分注方法 |
| JP7269869B2 (ja) | 2019-12-05 | 2023-05-09 | 株式会社日立ハイテク | 自動分析装置及び分注方法 |
Also Published As
| Publication number | Publication date |
|---|---|
| JP5899075B2 (ja) | 2016-04-06 |
| CN104487851B (zh) | 2016-11-09 |
| US9897624B2 (en) | 2018-02-20 |
| JP2014021022A (ja) | 2014-02-03 |
| EP2876449A1 (en) | 2015-05-27 |
| EP2876449B1 (en) | 2023-03-29 |
| CN104487851A (zh) | 2015-04-01 |
| US20150323557A1 (en) | 2015-11-12 |
| EP2876449A4 (en) | 2016-03-23 |
Similar Documents
| Publication | Publication Date | Title |
|---|---|---|
| JP5899075B2 (ja) | 自動分析装置 | |
| JP5865633B2 (ja) | 自動分析装置 | |
| US9335335B2 (en) | Automatic analyzer | |
| JP6076108B2 (ja) | 自動分析装置 | |
| JP6602753B2 (ja) | 自動分析装置 | |
| JP5761753B2 (ja) | 自動分析装置及びその動作不良判定方法 | |
| JP6649942B2 (ja) | 自動分析装置 | |
| JP5736280B2 (ja) | 自動分析装置 | |
| JP6567890B2 (ja) | 自動分析装置 | |
| JP6407895B2 (ja) | 自動分析装置 | |
| JP2004271266A (ja) | 分注装置およびそれを用いた自動分析装置 | |
| WO2018163744A1 (ja) | 自動分析装置 | |
| WO2022259767A1 (ja) | 分注装置、自動分析装置及び分注方法 |
Legal Events
| Date | Code | Title | Description |
|---|---|---|---|
| 121 | Ep: the epo has been informed by wipo that ep was designated in this application |
Ref document number: 13819196 Country of ref document: EP Kind code of ref document: A1 |
|
| WWE | Wipo information: entry into national phase |
Ref document number: 2013819196 Country of ref document: EP |
|
| WWE | Wipo information: entry into national phase |
Ref document number: 14410113 Country of ref document: US |
|
| NENP | Non-entry into the national phase |
Ref country code: DE |