WO2013183385A1 - 信号品質評価装置、信号品質評価方法、再生装置 - Google Patents
信号品質評価装置、信号品質評価方法、再生装置 Download PDFInfo
- Publication number
- WO2013183385A1 WO2013183385A1 PCT/JP2013/062487 JP2013062487W WO2013183385A1 WO 2013183385 A1 WO2013183385 A1 WO 2013183385A1 JP 2013062487 W JP2013062487 W JP 2013062487W WO 2013183385 A1 WO2013183385 A1 WO 2013183385A1
- Authority
- WO
- WIPO (PCT)
- Prior art keywords
- bit
- signal quality
- pattern
- error
- error pattern
- Prior art date
Links
Images


Classifications
-
- H—ELECTRICITY
- H03—ELECTRONIC CIRCUITRY
- H03M—CODING; DECODING; CODE CONVERSION IN GENERAL
- H03M13/00—Coding, decoding or code conversion, for error detection or error correction; Coding theory basic assumptions; Coding bounds; Error probability evaluation methods; Channel models; Simulation or testing of codes
- H03M13/37—Decoding methods or techniques, not specific to the particular type of coding provided for in groups H03M13/03 - H03M13/35
- H03M13/45—Soft decoding, i.e. using symbol reliability information
- H03M13/451—Soft decoding, i.e. using symbol reliability information using a set of candidate code words, e.g. ordered statistics decoding [OSD]
- H03M13/456—Soft decoding, i.e. using symbol reliability information using a set of candidate code words, e.g. ordered statistics decoding [OSD] wherein all the code words of the code or its dual code are tested, e.g. brute force decoding
-
- G—PHYSICS
- G11—INFORMATION STORAGE
- G11B—INFORMATION STORAGE BASED ON RELATIVE MOVEMENT BETWEEN RECORD CARRIER AND TRANSDUCER
- G11B20/00—Signal processing not specific to the method of recording or reproducing; Circuits therefor
- G11B20/10—Digital recording or reproducing
- G11B20/10009—Improvement or modification of read or write signals
- G11B20/10268—Improvement or modification of read or write signals bit detection or demodulation methods
- G11B20/10277—Improvement or modification of read or write signals bit detection or demodulation methods the demodulation process being specifically adapted to partial response channels, e.g. PRML decoding
-
- G—PHYSICS
- G11—INFORMATION STORAGE
- G11B—INFORMATION STORAGE BASED ON RELATIVE MOVEMENT BETWEEN RECORD CARRIER AND TRANSDUCER
- G11B20/00—Signal processing not specific to the method of recording or reproducing; Circuits therefor
- G11B20/10—Digital recording or reproducing
- G11B20/10009—Improvement or modification of read or write signals
- G11B20/10305—Improvement or modification of read or write signals signal quality assessment
- G11B20/10361—Improvement or modification of read or write signals signal quality assessment digital demodulation process
- G11B20/10379—Improvement or modification of read or write signals signal quality assessment digital demodulation process based on soft decisions, e.g. confidence values, probability estimates, likelihoods values or path metrics of a statistical decoding algorithm
-
- G—PHYSICS
- G11—INFORMATION STORAGE
- G11B—INFORMATION STORAGE BASED ON RELATIVE MOVEMENT BETWEEN RECORD CARRIER AND TRANSDUCER
- G11B20/00—Signal processing not specific to the method of recording or reproducing; Circuits therefor
- G11B20/10—Digital recording or reproducing
- G11B20/18—Error detection or correction; Testing, e.g. of drop-outs
- G11B20/1833—Error detection or correction; Testing, e.g. of drop-outs by adding special lists or symbols to the coded information
-
- H—ELECTRICITY
- H03—ELECTRONIC CIRCUITRY
- H03M—CODING; DECODING; CODE CONVERSION IN GENERAL
- H03M13/00—Coding, decoding or code conversion, for error detection or error correction; Coding theory basic assumptions; Coding bounds; Error probability evaluation methods; Channel models; Simulation or testing of codes
- H03M13/63—Joint error correction and other techniques
- H03M13/6343—Error control coding in combination with techniques for partial response channels, e.g. recording
-
- H—ELECTRICITY
- H03—ELECTRONIC CIRCUITRY
- H03M—CODING; DECODING; CODE CONVERSION IN GENERAL
- H03M13/00—Coding, decoding or code conversion, for error detection or error correction; Coding theory basic assumptions; Coding bounds; Error probability evaluation methods; Channel models; Simulation or testing of codes
- H03M13/37—Decoding methods or techniques, not specific to the particular type of coding provided for in groups H03M13/03 - H03M13/35
- H03M13/39—Sequence estimation, i.e. using statistical methods for the reconstruction of the original codes
- H03M13/41—Sequence estimation, i.e. using statistical methods for the reconstruction of the original codes using the Viterbi algorithm or Viterbi processors
Definitions
- the present disclosure includes a signal quality evaluation apparatus, a signal quality evaluation method, and such a signal quality evaluation apparatus, which are suitable for performing decoding processing using PRML (Partial Response Maximum Likelihood), for example, on a reproduction signal from a recording medium.
- PRML Partial Response Maximum Likelihood
- the present invention relates to a reproducing apparatus for reproducing information.
- CD Compact Disc
- DVD Digital Versatile Disc
- BD Blu-ray Disc (registered trademark)
- PRML partial response maximum likelihood
- PRML is a technique that combines the process of partial response and the technique of maximum likelihood detection.
- a partial response is a process of returning an output longer than 1 bit with respect to a 1-bit input, that is, a process of determining an output by a plurality of input bits, and is often used particularly for an optical disc such as a Blu-ray disc.
- a process in which a reproduction signal is obtained as a signal obtained by multiplying the input of continuous 4-bit information bits by sequentially multiplying them by 1, 2, 2, 1 is PR (1, 2, 2, 1 ).
- a distance called a path metric is defined between two signal sequences, and the distance between the actual signal and the signal expected from the assumed bit sequence is examined.
- the path metric is a distance defined as a distance obtained by adding the square of the amplitude difference between two signals at the same time over the entire time.
- Viterbi detection is used to search for a bit sequence that minimizes this distance.
- the partial response maximum likelihood detection combining these is a bit sequence that is assumed to be the reproduced signal obtained by adjusting the signal obtained from the bit information of the recording medium so that it becomes a partial response process by a filter called an equalizer.
- Patent Documents 1, 2, 3, and 4 disclose a signal quality evaluation method that has a good correlation with the PRML error rate even during high-density recording on a conventional optical disk.
- the PRML class that is actually used several error patterns with a statistically high error occurrence frequency are extracted, index values are obtained for each, and the index values are configured by integrating them. is doing. This is because the distribution of metric differences (distribution average value and variance) is different for each error pattern, so that it cannot be handled as a single distribution.
- the frequency characteristics of the channel are significantly degraded, and the code interference of the reproduced signal is further strengthened. Therefore, a PRML class having a longer constraint length and adapting to the frequency characteristics of the channel is newly added. If it is not introduced in the above, sufficient reproduction performance cannot be secured.
- the dominant error pattern also changes from the conventional condition in accordance with the frequency characteristics of the reproduction channel and the PRML class change. Specifically, due to the high frequency cutoff of the optical amplitude transfer function (MTF), the short mark reproduction signal amplitude is extremely reduced, and the reproduction signal amplitude of not only the shortest mark but also the second shortest mark can be obtained. Absent.
- MTF optical amplitude transfer function
- an error pattern in maximum likelihood decoding of PRML can be understood by a bit unit or 1 bit shift of the shortest mark at most. In other words, it is sufficient to consider only these error patterns to express the signal quality.
- the error pattern in PRML maximum likelihood decoding includes a block error including polarity inversion of recording marks and spaces. A lot is newly generated. And the contribution of these error patterns is dominant in the overall error rate. Since the block-like error pattern has an error propagation property, an error may occur over a very long interval of 10 clock intervals or more in some cases. For this reason, for example, even if only an error pattern such as a 1-bit shift of the shortest mark is detected and an evaluation value is generated, the evaluation value is unlikely to reflect the actual error rate.
- an object of the present disclosure is to provide a signal evaluation technique that can have a high error rate correlation, that is, a high accuracy even if high-density recording is further advanced.
- the signal quality evaluation apparatus inputs binary data obtained by performing PRML decoding processing by partial response equalization and maximum likelihood decoding on a reproduction signal of bit information, and has a bit longer than the constraint length of the PRML decoding processing.
- An error pattern detection unit that detects one or more specific error patterns that are patterns
- a metric difference calculation unit that calculates a metric difference for the specific error pattern detected by the error pattern detection unit
- the metric difference calculation unit An index value generation unit that generates an index value of the reproduction signal quality using the distribution of the obtained metric difference.
- the playback device further includes a playback unit that plays back a playback signal of bit information from a recording medium, and a PRML decoding process using partial response equalization and maximum likelihood decoding for the playback signal.
- the decoding part which decodes.
- the signal quality evaluation method inputs binary data obtained by performing PRML decoding processing by partial response equalization and maximum likelihood decoding on a reproduction signal of bit information, and has a bit longer than the constraint length of PRML decoding processing.
- One or a plurality of specific error patterns which are patterns are detected, a metric difference is calculated for the detected specific error pattern, and a reproduction signal quality index value is generated using the distribution of the metric difference.
- Such a technique of the present disclosure can appropriately calculate an evaluation value for reproduction signal quality even in a high-density recording situation.
- the error pattern considered is only an isolated error, and its length is not more than the maximum likelihood decoding of PRML, that is, the so-called Viterbi detection constraint length (PRML constraint length).
- PRML constraint length the so-called Viterbi detection constraint length
- a high error rate correlation that is, an index value for signal evaluation that can have high accuracy can be obtained for a reproduction signal of high density recording.
- the signal quality evaluation unit 10 mounted on the reproduction apparatus 1 is an example of the signal quality evaluation apparatus referred to in the claims. ⁇ 1.
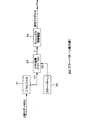
- FIG. 1 shows a configuration example of a reproduction apparatus 1 including a signal quality evaluation apparatus (signal quality evaluation unit 10) according to an embodiment.
- the reproduction signal 1 in this case is configured to perform signal reproduction from an optical disc 90 as an example of a recording medium and obtain an index value Pq for evaluating the reproduction signal quality.
- the reproduction apparatus 1 includes an optical pickup 2 that reproduces bit information from an optical disk 90 that is a removable medium, for example, and a preamplifier unit 3 that converts a signal read by the optical pickup 2 into a reproduction signal (RF signal).
- the reproduction apparatus 1 also includes an AGC (Automatic Gain Control) unit 4 that performs processing on a reproduction signal (RF signal), a waveform equalization unit 5, an A / D conversion unit 6, and a PLL (Phase Locked Loop) unit 7.
- the playback device 1 includes a PR (Partial Response) equalization unit 8 and a maximum likelihood decoding unit 9, and further includes a signal quality evaluation unit 10 and an optical disk controller unit 15 in order to perform PRML decoding processing.
- PR Partial Response
- the reproduced optical disk 90 is, for example, a high-density disk that achieves a 33.4 GB capacity equivalent to BD, or a high-density disk that achieves a 40 GB capacity equivalent to BD.
- the BD equivalent here means that the capacity of one recording layer is 40 GB under the physical conditions of the Blu-ray Disc.
- the recording linear density of bit information recorded on the optical disc for example, it is 55.87 nm / bit in the case of 33.4 GB and 46.65 nm / bit in the case of 40 GB.
- an index for performing appropriate reproduction signal evaluation can be obtained for a reproduction signal from a recording medium having a recording linear density of 46.65 nm / bit or more.
- the optical head unit 2 converges the laser beam on the recording layer of the optical disc 90 through the objective lens, receives the reflected light, and reproduces it as an analog signal indicating the bit information read from the optical disc 90.
- a signal (RF signal) is generated.
- the preamplifier unit 3 amplifies the reproduction signal with a predetermined gain and outputs the amplified signal to the AGC unit 4.
- the AGC unit 4 adjusts the amplitude of the reproduction signal from the preamplifier unit 3 by amplifying or attenuating based on the output from the A / D conversion unit 6, and outputs it to the waveform equalization unit 5.
- the waveform equalization unit 5 has an LPF (Low Pass Filter) characteristic that cuts off the high frequency range of the reproduction signal and an HPF (High Pass Filter) characteristic that blocks the low frequency range of the reproduction signal.
- LPF Low Pass Filter
- HPF High Pass Filter
- the reproduction signal output from the waveform equalization unit 5 is sampled by the A / D conversion unit 6 and converted into digital data.
- the PLL unit 7 Based on the output from the A / D conversion unit 6, the PLL unit 7 generates a reproduction clock synchronized with the reproduction signal after waveform equalization by PLL processing. Sampling in the A / D converter 6 is performed at the timing of the regenerated clock generated by the PLL circuit 7.
- the recovered clock is also used by the PR equalization unit 8 and the maximum likelihood decoding unit 9, the signal quality evaluation unit 10, and the optical disk controller unit 15 for PRML decoding.
- PRML decoding is performed on the reproduced signal converted into digital data by the PR equalization unit 8 and the maximum likelihood decoding unit 9, and binary data DD as a decoding result is obtained.
- the PR equalization unit 8 equalizes the channel response to a target response such as PR (1, 2, 2, 1), PR (1, 2, 2, 2, 1), for example. That is, high frequency noise is suppressed and intentional intersymbol interference is added to the digital reproduction signal.
- a target response such as PR (1, 2, 2, 1), PR (1, 2, 2, 2, 1, 1, for example. That is, high frequency noise is suppressed and intentional intersymbol interference is added to the digital reproduction signal.
- high-density recording of 40 GB or more equivalent to BD is assumed as an optical disk.
- the PR equalization unit 8 has a target response of PR (1, 2, 3, 3, 3, 2, 1), for example.
- the constraint length of the PRML decoding process is 7.
- the reproduction signal RF (EQ) subjected to equalization processing by the PR equalization unit 8 is
- the maximum likelihood decoding unit 9 is configured as, for example, a Viterbi decoder.
- Viterbi detection uses a Viterbi detector consisting of a plurality of states configured in units of continuous bits of a predetermined length and branches represented by transitions between them, and all possible bit sequences are used. A desired bit sequence is efficiently detected from the inside.
- a register that stores a partial response sequence and signal path metric up to that state called a path metric register, and a bit up to that state called a path memory register
- a path metric register a register that stores a sequence flow (path memory)
- a branch metric unit that calculates a partial response sequence and a signal path metric at that bit. It is prepared.
- various bit sequences can be associated in a one-to-one relationship by one of the paths passing through the state.
- the path metric between the partial response sequence that passes through these paths and the actual signal (reproduced signal) is the transition between the states that constitute the above path, that is, the branch metrics described above in the branch sequentially. It is obtained by adding.
- paths with smaller path metrics are sequentially selected while comparing the magnitudes of path metrics of two or less branches that arrive in each state. This can be achieved.
- This selection information to the path memory register information representing the path reaching each state in a bit sequence is stored. The value of the path memory register converges into a bit sequence that finally updates the path metric while being sequentially updated, and the result is output.
- the binarized data DD obtained as a decoding result by the maximum likelihood decoding unit 9 is output to the optical disk controller unit 15 and the signal quality evaluation unit 10.
- the optical disk controller 15 demodulates the reproduction data from the optical disk 90 by performing decoding processing, error correction processing, etc. on the binarized data.
- the signal quality evaluation unit 10 inputs the reproduction signal RF (EQ) subjected to equalization processing by the PR equalization unit 8 and the binarized data DD to evaluate the reproduction signal quality.
- Index value Pq is generated, and the index value Pq is output to the optical disk controller unit 15.
- the optical disk controller unit 15 can evaluate the reproduction signal quality based on the index value Pq.
- the bit detection method by PRML is based on the Euclidean distance between the partial response sequence obtained from the correct bit sequence and the reproduced signal (that is, the path metric for the correct bit sequence) and the partial sequence obtained from the erroneous bit sequence.
- the magnitude relationship of the Euclidean distance between the response sequence and the reproduced signal (that is, the path metric for the erroneous bit sequence) is compared.
- an algorithm that leaves a closer path that is, a path path with a smaller value of the path metric as a more reliable path, and finally detects a path that survived by repeating this operation (maximum likelihood path) is obtained.
- the difference between the path metrics of the top two paths (which are the maximum likelihood path Pa and the second path Pb) having a small path metric value, which are final surviving path selection candidates, is determined. If is large, the surviving path is more accurate, and if it is small, it is more confusing, that is, the possibility of detection error is large. This point will be described with reference to FIG.
- FIG. 2A and 2B are diagrams illustrating the relationship between the maximum likelihood path Pa, the second path Pb, and the actual reproduction signal (the reproduction signal RF (EQ) PR-equalized by the PR equalization unit 8).
- PR (1, 2, 2, 1) is shown.
- FIG. 2A and FIG. 2B each value of “+3, +2, +1, 0, ⁇ 1, ⁇ 2, ⁇ 3” on the vertical axis represents each criterion assumed in PR (1, 2, 2, 1). Shows the level value.
- the maximum likelihood path Pa and the second path Pb shown in the figure can be regarded as two paths that are finally compared with the reproduction signal RF (EQ).
- the path metric value for the maximum likelihood path Pa and the path metric value for the second path Pb are compared, and the path with the smaller value is selected as the surviving path.
- the path metric corresponds to each sampling value of the reproduction signal RF (EQ) obtained at each sampling timing indicated by a black circle in the figure in the maximum likelihood path Pa (or the second path Pb).
- the sum of the Euclidean distances with the respective values obtained at the sampling timing that is, the sum of the branch metrics.
- the Euclidean distance between the maximum likelihood path Pa and the reproduction signal RF (EQ) is expanded and the Euclidean distance between the second path Pb and the reproduction signal RF (EQ) is closer than in the case of FIG. It has become a relationship. That is, in this case, the value of the path metric for the maximum likelihood path Pa is larger than that in the case of FIG. 2A, and conversely, the value of the path metric for the second path Pb is smaller, so that the maximum likelihood as the detection path in this case The certainty of the pass Pa decreases. In other words, in this case, the probability of the other second path Pb is increased, and there is a high possibility that the second path Pb is the most likely path. Therefore, there is a high possibility that the detected path as the maximum likelihood path Pa is a path erroneously detected with respect to the path indicated as the second path Pb.
- the path metric value for the maximum likelihood path Pa is sufficiently smaller than the path metric value for the second path Pb, it can be determined that more probable bit detection is being performed.
- the path metric value for the maximum likelihood path Pa is larger and the path metric value for the second path Pb is smaller, the detection path as the maximum likelihood path Pa is more likely to be erroneous. Judgment can be made.
- the detection accuracy when the PRML method is adopted, the difference between the path metric value for the maximum likelihood path Pa and the path metric value for the second path Pb, that is, the metric difference is obtained. Can be estimated.
- a metric difference (referred to as MD) is defined as follows.
- PB i ”, PA i ”, and “R i ” represent the values of the second path Pb, the maximum likelihood path Pa, and the reproduction signal RF at the same sampling timing, respectively. That is, the metric difference MD in this case is defined as a value obtained by subtracting the value of the path metric for the maximum likelihood path Pa from the value of the path metric for the second path Pb.
- Such a metric difference MD has a maximum value when the value of the path metric for the maximum likelihood path Pa on the right side of the above equation is “0”, that is, when the maximum likelihood path Pa and the reproduction signal RF completely match. It is done. That is, the metric difference MD is information indicating that the larger the value, the higher the detection accuracy (that is, the better the signal quality). From FIG. 2 above, the fact that the maximum likelihood path Pa and the reproduction signal RF completely match in this way means that the path metric for the second path Pb in this case is the maximum likelihood path Pa and the second path Pb. It turns out that it becomes Euclidean distance. Therefore, the maximum value of the metric difference MD as described above is the value of the Euclidean distance between the maximum likelihood path Pa and the second path Pb.
- the minimum value is “0” when the path metric value for the maximum likelihood path Pa and the path metric value for the second path Pb are the same value, that is, the maximum likelihood path Pa in the case of FIG. And the second path Pb are obtained at a position where the reproduction signal RF is exactly in the middle. That is, depending on the value “0” of the metric difference MD, it indicates that both the maximum likelihood path and the second path are equally likely, and therefore indicates the highest possibility of error. become.
- the metric difference MD indicates that the detection accuracy is higher as it is closer to the value (maximum value) of the Euclidean distance between the maximum likelihood path Pa and the second path Pb, and conversely, it is closer to “0” (minimum value). It can be seen that the lower the detection accuracy, the higher the possibility of error.
- an error in the PRML decoding process The incidence can be estimated.
- a metric difference value as a difference between the path metric value for the maximum likelihood path Pa and the path metric value for the second path Pb
- statistical information such as a variance value thereof is obtained.
- the error rate was estimated.
- the difference pattern (error pattern) between the maximum likelihood path and the second path that can actually cause a detection error is limited to some extent.
- the bit sequence pattern of the second pass is caused by a one-bit error such as an edge being shifted by one bit with respect to the bit sequence pattern of the maximum likelihood path, or the disappearance of the 2T mark that is the shortest mark.
- a 2-bit error For example, a 2-bit error.
- the error pattern that actually appeared as an error was limited to almost 100% 1-bit error. Therefore, the signal quality can be properly evaluated by obtaining the distribution of the metric difference for only the 1-bit error which is the only error pattern.
- the PRML class that is actually used several error patterns with a statistically high error frequency are extracted, index values are obtained for each, and the index values are formed by integrating them. ing. This is because the distribution of metric differences (distribution average value and variance) is different for each error pattern, so that it cannot be handled as a single distribution.
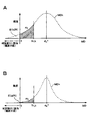
- FIG. 3 shows a distribution example of the metric difference MD for error patterns having different Euclidean distances.
- the vertical axis represents the sample frequency
- the horizontal axis represents the value of the metric difference MD.
- three error patterns PTk (k is 1 to 3) mainly contribute to actual error occurrence, and an example of the distribution of their metric difference MD is shown.
- the distribution shown as MD1 in the figure shows an error pattern PT1 corresponding to a so-called 1-bit error in which the number of bits different between the bit sequence of the maximum likelihood path Pa and the bit sequence of the second pass Pb is one bit. It is assumed that the distribution of the metric difference MD is.
- the distribution shown as MD2 is, for example, the distribution of the metric difference MD for the error pattern PT2 corresponding to the 2-bit error due to the shortest mark shift or the like, and the distribution of the metric difference MD for the error pattern PT3 corresponding to the 3-bit error is MD3. It can be illustrated as In the figure, the distribution indicated as “MD whole” indicates the superposition of these three distributions MD1 to MD3.
- the Euclidean distance between the maximum likelihood path Pa and the second path Pb can be calculated by calculating the square of the difference between the values followed by each path and then calculating the sum thereof. Therefore, at this time, the Euclidean distance “d k 2 ” in each error pattern k is PA i and PB i , respectively, at the same sampling timing in the maximum likelihood path Pa and the second path Pb. Can be expressed as
- the average value of each distribution is a value of the Euclidean distance d k 2 between the maximum likelihood path Pa and the second path Pb in the error pattern k. . That is, if the distribution of the metric difference MD is a Gaussian distribution in this way, the average value of the distribution should be the value of the metric difference MD when the signal quality is the best. Then, the value of the metric difference MD when the signal quality is the best as described above is the maximum likelihood path Pa and the second path Pb according to the calculation formula of the metric difference MD according to [Formula 1]. Is the Euclidean distance value.
- the portion where the value of the metric difference MD shown on the horizontal axis in this figure is “0” indicates that the path metric with respect to the maximum likelihood path Pa and the second path, as can be understood from the description of the previous metric difference MD.
- a portion where the value of the metric difference MD exceeds (below) the portion where the value is “0” indicates a portion that actually becomes a detection error, and this portion becomes an unobservable portion in PRML. That is, when the value of the metric difference MD exceeds “0” and becomes a negative value, the path metric value for the second path Pb is smaller than the path metric value for the maximum likelihood path Pa.
- the path with the smallest path metric value is detected as the maximum likelihood path as understood from the above description, and thus the value of the metric difference MD is determined in this way. It can never be negative. Therefore, the part that causes this detection error cannot be actually observed.
- FIG. 4A shows the distribution (MDk) of the metric difference MD in an error pattern PTk.
- the vertical axis represents the sample frequency and the horizontal axis represents the metric difference MD.
- a predetermined threshold value (Th_k) is set for the value of the metric difference MD, and the error rate is estimated by obtaining the appearance frequency (Fk) of the value of the metric difference MD below this value.
- the appearance frequency Fk of the value of the metric difference MD below the threshold Th_k is correlated with a portion where the metric difference MD ⁇ 0 (bit error rate bER). That is, for example, if the bit error rate bER is increased assuming that the signal quality has deteriorated, the distribution MDk at that time is a distribution in which the base is relatively wide as shown in FIG. 4A, for example. Along with this, the appearance frequency Fk (the area of the Fk portion in the figure) tends to increase. That is, as the bit error rate bER increases, the appearance frequency Fk also increases. On the other hand, when the signal quality is better than that in the case of FIG.
- the distribution MDk has a sharper shape as shown in FIG. 4B, for example.
- the appearance frequency Fk also decreases, and it can be seen that the value of the appearance frequency Fk decreases as the bit error rate bER decreases.
- an index correlating with the bit error rate bER is obtained by the appearance frequency Fk of the value of the metric difference MD below the threshold Th_k.
- a threshold Th_k is appropriately set, and the value of the metric difference MD that falls below the threshold Th_k.
- the signal quality evaluation unit 10 includes an error pattern detection unit 20 (20-1, 20-2... 20-n), a delay compensation unit 21, and a metric difference calculation unit 22 (22-1 22-2... 22 -N), a distribution calculation unit 23 (23-1, 23-2... 23-n), and an index value calculation unit 24.
- Each error pattern detection unit 20 performs binarization obtained by performing PRML decoding processing on the reproduced signal of bit information by partial response equalization in the PR equalization unit 8 and Viterbi decoding in the maximum likelihood decoding unit 9
- Data DD is input, and one or more specific error patterns which are bit patterns longer than the constraint length are detected.
- a detection flag Fdet is output in response to the detection.
- Each error pattern detection unit 20 detects a specific error pattern.
- n error pattern detection units 20-1, 20-2... 20-n are shown as the error pattern detection unit 20, but at least one or more are provided.
- the specific error pattern is an error pattern that has a statistically high error occurrence frequency in the reproduction system.
- PR (1, 2, 3, 3, 3, 2, 1)
- the constraint length in the PRML decoding process performed by the PR equalization unit 8 and the maximum likelihood decoding unit 9 is used. Is 7.
- the following error patterns PTa, PTb, and PTc are detected as specific error patterns that are longer than the constraint length and detected by the error pattern detection unit 20.
- PTa 8-bit pattern that becomes “10111101” when the location where bit inversion occurs is indicated by “1”
- PTb 13 bits that becomes “1011110111101” when the location where bit inversion occurs is indicated by “1”
- Pattern PTc 14-bit pattern that becomes “10111100111101” when the place where bit inversion occurs is indicated by “1” Note that the place where bit inversion occurs in the above is “1” “ “0” is a different place. In the correct pattern and the error pattern, some of the “1” locations are not different, but all “1” locations are different bit patterns.
- an error pattern dominant as an error occurrence frequency is selected and its distribution is used. Therefore, if there is one specific error pattern used as the dominant error pattern, only one error pattern detection unit 20 (for example, only the error pattern detection unit 20-1) may be used. If there are two dominant error patterns and two specific error patterns used for index value calculation, two error pattern detection units 20 (for example, error pattern detection units 20-1 and 20-2) are provided. What is necessary is just to provide. In that sense, “n” is the number of selected specific error patterns. Since the metric difference calculation unit 22 and the distribution calculation unit 23 are also provided corresponding to the error pattern detection unit 20, the meaning of “n” is the same.
- the above three error patterns PTa, PTb, and PTc are specific error patterns.
- error pattern detection units 20-1, 20-2, and 20-3 are provided. . Then, the error pattern detection unit 20-1 detects the error pattern PTa, the error pattern detection unit 20-2 detects the error pattern PTb, and the error pattern detection unit 20-3 performs an operation of detecting the error pattern PTc.
- One error pattern detection unit 20 includes a shift register 31, an error pattern generation unit 32, an exclusive OR operation unit 33, and a run length restriction confirmation unit 34.
- the error pattern detection unit 20 first receives an input bit string as the binarized data DD by the shift register 31 and captures data in the same clock section as the specific error pattern. For example, when an 8-bit specific error pattern PTa is to be detected, data in an 8-clock interval is captured. Then, the data in the clock interval is output to the exclusive OR calculator 33 (output X1). Further, the error pattern generation unit 32 outputs a specific error pattern. For example, an 8-bit pattern “10111101” is output to the exclusive OR calculator 33 as the specific error pattern PTa (output X2).
- the exclusive OR operation unit 33 performs an EX-OR operation of the bit pattern (X1) from the shift register 31 and the specific error pattern (X2). That is, with respect to the bit pattern from the shift register 31, bit inversion is performed at a location where “1” is set in “10111101” of the specific error pattern PTa.
- the calculation result Y is supplied to the run length limit confirmation unit 34.
- the run length restriction confirmation unit 34 checks whether or not the run length restriction of the modulation code is satisfied. That is, the 8-bit bit pattern supplied from the shift register 31 to the exclusive OR operation unit 33 and the 8-bit bit pattern in which the bit inversion of the portion where “1” is set in the specific error pattern PTa are specified. There is a relationship between the maximum likelihood path where the error corresponding to the error pattern PTa may occur and the second path. However, this is the case when the 8-bit pattern of the exclusive OR operation result satisfies the run length restriction. This is because if the run length restriction is not satisfied, it cannot be a bit sequence of false detection in the first place. Accordingly, when the exclusive OR operation result satisfies the run length restriction, an error pattern is detected. In this case, the run length restriction confirmation unit 34 outputs the detection flag Fdet.
- the operation of the error pattern detection unit 20-1 for detecting the specific error pattern PTa has been described as an example, but the error pattern detection unit 20-2 for detecting the specific error pattern PTb or the specific error pattern PTc is detected.
- the concept of the configuration and operation of the error pattern detection unit 20-3 is the same.
- the shift register 31 supplies the binarized data DD for 13 clock intervals to the exclusive OR operation unit 33.
- the error pattern generation unit 32 supplies a 13-bit pattern that becomes “1011110111101” as the specific error pattern PTb to the exclusive OR operation unit 33. If these exclusive OR calculation results satisfy the run length restriction, the detection flag Fdet is output.
- the reproduction signal RF (EQ) that is the output of the PR equalization unit 8 in FIG. 1 is input to the delay compensation unit 21.
- the delay compensation unit 21 performs delay compensation on the reproduced signal waveform after PR equalization in consideration of the Viterbi detection process in the maximum likelihood decoding unit 9 and the detection process in the error pattern detection unit 20, and the error pattern detection unit The synchronization relationship between the detection flag Fdet output from 20 and the reproduction signal RF (EQ) is ensured.
- the metric difference calculation units 22 (22-1, 22-2... 22-n) are provided corresponding to the error pattern detection units 20 (20-1, 20-2... 20-n), respectively. .
- Each metric difference calculation unit 22 is supplied with a detection flag Fdet from the corresponding error pattern detection unit 20 and a reproduction signal RF (EQ) via the delay compensation unit 21.
- the metric difference calculation unit 22 obtains a metric difference for the reproduction signal RF (EQ) when the specific error pattern is detected.
- Equation 2 calculation of the metric difference requires information on the maximum likelihood path and the second path together with the reproduction signal RF (EQ). Then, the maximum likelihood path and the second path can be obtained from the information of the reproduction signal RF (EQ) and the detection flag Fdet.
- the metric difference calculation unit 22-1 is supplied with the detection flag Fdet for the specific error pattern PTa in the 8-clock section “10111101” in the error pattern detection unit 20-1.
- the bit string in a relationship in which all the bits of “1” are inverted in the reproduction signal RF (EQ) of the section becomes the maximum likelihood path and the second path.
- the distribution calculation units 23 respectively calculate the metric differences obtained by the metric difference calculation units 22 (22-1, 22-2,... 22-n). Perform distribution calculation. For example, the distribution as described in FIGS. 3 and 4 is obtained. In this way, a difference metric distribution representing the detection margin for each specific error pattern can be obtained.
- the index value calculation unit 24 calculates a comprehensive index value Pq using the distribution for each specific error pattern obtained by each distribution calculation unit 23 (23-1, 23-2... 23-n). 1 is output to the optical disk controller 15 in FIG. That is, the distribution calculation unit 23 and the index value calculation unit 24 perform processing for generating an index value Pq for generating a reproduction signal quality index value using the metric difference distribution obtained by the metric difference calculation unit 22.
- the specific process may be the process described with reference to FIGS. 2 and 3, for example, the process described in Patent Document 4, and various examples are conceivable.
- the signal quality evaluation unit 10 of the present embodiment is configured as described above.
- the above-described specific error patterns PTa, PTb, and PTc are employed as the specific error pattern to be detected. The reason for this will be described.
- the optical disk 90 is a high-density disk that achieves a recording linear density of 46.65 nm / bit or more, that is, a 40 GB capacity equivalent to BD.
- the frequency characteristics of the channel, particularly high-frequency components are significantly degraded, and the code interference interference of the reproduced signal becomes very strong.
- a new PRML class that conforms to the frequency characteristics is introduced, sufficient reproduction performance cannot be ensured.
- the dominant error pattern also changes from the previous condition with the frequency characteristics of the reproduction channel and the PRML class change. Specifically, due to the high frequency cutoff of the optical amplitude transfer function (MTF), the short mark reproduction signal amplitude is extremely reduced, and the reproduction signal amplitude of not only the shortest mark but also the second shortest mark can be obtained. Absent.
- MTF optical amplitude transfer function
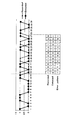
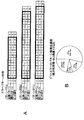
- the error pattern in PRML maximum likelihood decoding has been understood in bit units or about 1 bit shift of the shortest mark (that is, these errors are used to express signal quality). On the other hand, it was enough to consider only the pattern). On the other hand, under ultra-high density recording conditions, as shown in Fig. 7, many new block errors including polarity reversal of recording marks and spaces occurred. To come. This makes the contribution of these block-like error patterns dominant at the overall error rate. Since the block-like error pattern has an error propagation property, an error may occur over a very long interval of 10 clock intervals or more in some cases.
- FIG. 7 Illustrated in FIG. 7 is an optical simulation waveform at a linear density (46.65 nm / bit) equivalent to BD40GB detected by PRML class PR (1, 2, 3, 3, 3, 2, 1) ML.
- PRML class PR (1, 2, 3, 3, 3, 2, 1) ML.
- This is an example of an error occurring when In contrast to the recording data pattern (correct answer pattern) indicated by the broken line, actually, the binarized data DD which is erroneous in the 14 clock interval has been detected as indicated by the solid line.
- the bit pattern of the portion where the error has occurred is shown in the lower part of the figure. In this case, the recorded bit information (that is, the correct pattern) is “10001100001100”, whereas the detected bit information (the error is The generated pattern) is “00110000110001”.
- the only considered error pattern is an isolated error, and the length thereof is less than the constraint length of PRML maximum likelihood decoding, so-called Viterbi detection.
- the index value using the previous error pattern has a poor correlation with the reproduction signal quality. That is, the index value is less likely to be a value that appropriately represents the reproduction signal quality. Therefore, in the present embodiment, a block-like error pattern that becomes dominant in high-density recording equivalent to BD of 40 GB or more is taken into consideration, and an error pattern longer than the Viterbi constraint length is newly detected and incorporated in signal evaluation.
- the specific error patterns PTa, PTb, and PTc described above are error patterns that are employed for signal quality evaluation as patterns longer than the PRML constraint length for the above reasons.
- FIG. 8A shows specific error patterns PTa, PTb, PTc and specific pattern examples thereof.
- the thick frame in the row indicated as “bit error” corresponds to the specific error patterns PTa, PTb, and PTc. That is, the pattern where the bit inversion occurs between the correct pattern and the error pattern is “1”.
- the specific error pattern PTa is “10111101”, and examples of the correct answer pattern and the error pattern corresponding to this are “100001100” and “00110001”.
- the specific error pattern PTb is “1011110111101”, and examples of the correct answer pattern and the error pattern corresponding to this are “10000110001100” and “0011000110001”.
- the specific error pattern PTc is “10111100111101”, and examples of the correct pattern and error pattern corresponding to this are “10001100001100” and “001100000110001”, that is, the patterns illustrated in FIG.
- three error pattern detection units 20-1 to 20-3 are provided as the error pattern detection units 20-1 to 20-n in FIG.
- the three error pattern detection units 20-1 to 20-3 detect bit patterns corresponding to the specific error patterns PTa, PTb, and PTc.
- the index value is calculated from the distribution of the metric difference when the specific error pattern is detected.
- the index value Pq is not appropriate unless the specific error patterns PTa, PTb, and PTc are actually dominant error patterns.
- the occurrence frequency of each bit error pattern when the recording linear density is 44 GB in terms of BD is examined, and the result is as shown in FIG. 8B. That is, the specific error pattern PTa was 53.7%, the specific error pattern PTb was 17.1%, the specific error pattern PTc was 7.6%, and the other patterns were 21.5%. That is, the three specific error patterns PTa, PTb, and PTc have a dominant situation in which almost 80% of the total number of errors is covered. In this case, by calculating the index value Pq based on the detection of the specific error patterns PTa, PTb, PTc, it can be said that the value has high correlation with the bit error rate and is highly accurate.
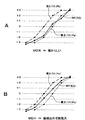
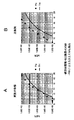
- FIGS. 9 and 10 show simulation results. Each of FIGS. 9 and 10 shows the correlation between the signal quality evaluation value and the bit error rate in the optical simulation model.
- the horizontal axis is the index value
- the vertical axis is the bit error rate (bER)
- the calculated index value is plotted with black triangles and black squares.
- the solid line indicated by TH in the figure is the theoretical value of the relationship between the index value and the bit error rate when Gaussian noise is assumed.
- FIG. 9A and FIG. 10A correspond to an embodiment in which all new specific error patterns PTa, PTb, PTc are added to a specific error pattern shorter than a conventional constraint length. This is a case where an evaluation value is obtained by performing the same calculation as in the case indicated by.
- FIG. 10B show a case where an evaluation value is obtained using only the previous specific error pattern as a comparative example.
- FIG. 11 shows an example of the previous specific error pattern.
- the error pattern PTd1 is a pattern corresponding to a bit error as an edge shift
- the error pattern PTd2 is a pattern corresponding to a bit error of continuous 2T shift.
- FIG. 9 shows a case where detection is performed with PR (1, 2, 2, 2, 1) ML, which is 5 tap PRML, under a linear density condition of BD conversion of 33 GB.
- the comparative example and the example of the embodiment are in good agreement with the theoretical value, and in either method, high accuracy can be expected as the index value Pq.
- FIG. 10 shows the case of an ultra-high linear density condition of 40 GB in BD conversion far exceeding the conventional optical disk, and detection is performed with PR (1,2,3,3,3,2,1) ML which is 7 tap PRML. Is going. Under this condition, the result of the comparative example of FIG.
- the index value Pq is greatly deviated from the theoretical value, and it is expected that the index value and the error rate correlation vary depending on various signal deterioration factors in the actual machine conditions. The accuracy has greatly deteriorated.
- the index value Pq matches the theoretical value equivalent to the conventional optical disk condition, and high accuracy (against the error) Rate correlation).
- PRML decoding performed by PR (1, 2, 3, 3, 3, 2, 1) ML and performed by PR equalization unit 8 and maximum likelihood decoding unit 9 is performed.
- the constraint length in the process is 7.
- the error pattern detection unit 20 detects the specific error patterns PT1 “10111101”, PT2 “1011110111101”, and PT3 “10111100111101” (“1” in each pattern indicates a place where bit inversion occurs. ) Then, a metric difference is calculated for these specific error patterns, and a reproduction signal quality index value Pq is generated using the distribution of the metric difference. Thereby, a highly accurate index value as a signal quality evaluation value can be obtained.
- the “arithmetic processing system” referred to below indicates a processing system corresponding to one specific error pattern, that is, a processing system of the error pattern detection unit 20, the metric difference calculation unit, and the distribution calculation unit 23.
- a processing system of the error pattern detection unit 20 the metric difference calculation unit, and the distribution calculation unit 23.
- FIG. 5 of the above-described embodiment it is shown as having n arithmetic processing systems, but the following is a specific example.
- Example 8 Two or more arithmetic processing systems are provided (n ⁇ 2), one of the first specific error patterns (for example, any one of PTa, PTb, and PTc) and one or a plurality of second specific error patterns
- Example 9 of calculating index value Pq by using the example 9 Three or more arithmetic processing systems are provided (n ⁇ 3), two specific error patterns as the first specific error pattern, and one or a plurality of second specific Configuration example for calculating index value Pq using error pattern
- Example 10 Four or more arithmetic processing systems are provided (n ⁇ 4), three specific error patterns as first specific error patterns, and one or more second Of calculating the index value Pq using the specific error pattern
- the bit error rate is used particularly in high-density recording equivalent to or higher than BD40GB by using the first specific error pattern (for example, one or more of PTa, PTb, and PTc).
- the index value Pq having a high correlation can be calculated.
- the configuration of the playback device is not limited to this.
- the PR class is effective (that is, the error can be sufficiently low and practical) at a recording line density equivalent to BD equivalent to 40 GB or more
- the above-described specific error patterns PTa, PTb, and PTc are dominant. Even when the PR class is adopted, the technique of the present disclosure is effective.
- the specific error pattern longer than the constraint length patterns other than the specific error patterns PT1, PT2, and PT3 are also conceivable.
- a specific error pattern in a long section (section exceeding the constraint length) corresponding to a block-like error may be selected in accordance with a PR class selected according to high-density recording, frequency characteristics, or the like.
- the technology of the present disclosure can be widely applied to decoding bit information reproduced from a recording medium and decoding bit information transmitted.
- the recording medium is not limited to an optical disc, and any recording medium is assumed.
- this technique can also take the following structures.
- An error pattern detection unit for detecting a specific error pattern of For the specific error pattern detected by the error pattern detector, a metric difference calculator that calculates a metric difference;
- An index value generation unit that generates an index value of the reproduction signal quality using the distribution of the metric difference obtained by the metric difference calculation unit;
- a signal quality evaluation apparatus A signal quality evaluation apparatus.
- At least one of the specific error patterns is The signal quality evaluation apparatus according to (1) above, which is an 8-bit pattern that becomes “10111101” when a location where bit inversion occurs is indicated by “1”.
- At least one of the specific error patterns is The signal quality evaluation apparatus according to the above (1) or (2), which is a 13-bit pattern that becomes “1011110111101” when a place where bit inversion occurs is indicated by “1”.
- At least one of the specific error patterns is The signal quality evaluation apparatus according to any one of (1) to (3) above, which is a 14-bit pattern that becomes “10111100111101” when a location where bit inversion occurs is indicated by “1”.
- the error pattern detection unit detects one or a plurality of second specific error patterns that are bit patterns shorter than the constraint length
- the metric difference calculation unit calculates a metric difference for each of the first and second specific error patterns detected by the error pattern detection unit.
- 1 playback device 8 PR equalization unit, 9 maximum likelihood decoding unit, 10 signal quality evaluation unit, 20 (20-1 ... 20-n) error pattern detection unit, 21 delay compensation unit, 22 (22-1 ⁇ ⁇ 22-n) Metric difference calculation unit, 23 (23-1 ... 23-n) Distribution calculation unit, 24 index value calculation unit
Landscapes
- Engineering & Computer Science (AREA)
- Signal Processing (AREA)
- Physics & Mathematics (AREA)
- Probability & Statistics with Applications (AREA)
- Theoretical Computer Science (AREA)
- Signal Processing For Digital Recording And Reproducing (AREA)
- Error Detection And Correction (AREA)
Abstract
Description
特にBDレベルの高密度記録となると、ビット検出方法としてパーシャルレスポンス最尤(PRML)検出とよばれる手法が用いる方法が一般的となってきている。
また、最尤検出とは、二つの信号列間にパスメトリックとよばれる距離を定義して、実際の信号と想定されるビット系列から予想される信号との間の距離を調べて、その距離が最も近くなるようなビット系列を検出する方法である。なお、ここで、パスメトリックとは、同じ時刻での2つの信号の振幅差の二乗を全時刻にわたって加算した距離として定義される距離である。また、この距離を最小とするビット系列の探索には、ビタビ検出をもちいる。
これらを組み合わせたパーシャルレスポンス最尤検出は、記録媒体のビット情報から得られた信号をイコライザとよばれるフィルタでパーシャルレスポンスの過程となるように調整し、得られた再生信号と想定されるビット系列のパーシャルレスポンスとの間のパスメトリックを調べて、その距離が最も近くなるようなビット系列を検出する方法である。
例えば上記の特許文献1,2,3,4等で、従来の光ディスクの高密度記録時にもPRMLのエラーレートと良好な相関をもつ信号品質評価方法が示されている。
そのいずれにおいても、実際に使用されるPRMLのクラスにおいて、統計的にエラー発生頻度の高い幾つかのエラーパターンを抽出し、その各々に対し指標値を求め、それらを統合して指標値を構成している。
これは、エラーパターン毎に、メトリック差分の分布(分布平均値および分散)が異なるため、単一の分布として取り扱う事が出来ない理由による。
具体的には光学的振幅伝達関数(MTF)の高域カットオフのため、短マーク再生信号振幅は極度に低下し、最短マークだけでなく、二番目に短いマークの再生信号振幅もほとんど得られない。
従来は、PRMLの最尤復号でのエラーパターンは、ビット単位か、高々最短マークの1ビットシフトで理解できていた。すなわち、信号品質を表現するのに、これらのエラーパターンだけを考慮することで充分であった。
ところが、BD相当で40GBを超えるような超高密度記録条件では、上記の状況のため、PRMLの最尤復号でのエラーパターンとしては、記録マーク、スペースの極性反転をも含む、ブロック的な誤りが新たに多く発生するようになっている。そして全体のエラーレートでこれらのエラーパターンの寄与が支配的にもなっている。ブロック的なエラーパターンは、エラー伝搬的性質を持つので、場合によっては10クロック区間以上の、非常に長い区間にわたってエラーが発生することもある。
このことから、例えば最短マークの1ビットシフト等のエラーパターンのみを検出して評価値を生成しても、実際のエラーレートを反映しているとはいいにくい評価値となってしまう。
本開示の再生装置は、以上に加えて、記録媒体からビット情報の再生信号を再生する再生部と、上記再生信号についてパーシャルレスポンス等化及び最尤復号によるPRML復号処理を行って2値化データを復号する復号部とを備える。
従来の信号品質評価では、考慮されていたエラーパターンは孤立のエラーのみであり、その長さは、高々PRMLの最尤復号、いわゆるビタビ検出の拘束長(PRML拘束長)以下のものであった。本開示では、高密度記録の再生信号において支配的になったブロック的なエラーパターンに対応するため、PRML復号処理の拘束長よりも長いエラーパターン検出を行い、信号評価に用いるようにする。
<1.再生装置構成>
<2.メトリック差分を用いた指標値生成の一例>
<3.信号品質評価部の構成及び動作>
<4.変形例>
図1は実施の形態に係る信号品質評価装置(信号品質評価部10)を備えた再生装置1の構成例を示している。
この場合の再生信号1は、記録媒体の一例としての光ディスク90からの信号再生を行うとともに、その再生信号品質評価のための指標値Pqを求める構成とされる。
また再生装置1は、再生信号(RF信号)について処理を行うAGC(Automatic gain Control)部4、波形等化部5、A/D変換部6、PLL(Phase Locked Loop)部7を備える。
また再生装置1は、PRML復号処理を行うために、PR(Partial Response)等化部8及び最尤復号部9を備え、さらに信号品質評価部10、光ディスクコントローラ部15を備える。
特に本実施の形態では、記録線密度46.65nm/bit以上の記録媒体からの再生信号についても、適切な再生信号評価を行う指標が得られるようにしている。
プリアンプ部3は、再生信号を所定のゲインで増幅してAGC部4に出力する。
AGC部4は、プリアンプ部3からの再生信号の振幅を、A/D変換部6からの出力に基づいて増幅又は減衰させて調整し、波形等化部5へ出力する。
波形等化部5は、再生信号の高域を遮断するLPF(Low Pass Filter)特性と、再生信号の低域を遮断するHPF(High Pass Filter)特性とを有しており、再生信号波形を必要な特性に整形してA/D変換部6に出力する。
PLL部7は、A/D変換部6からの出力に基づいて、PLL処理により波形等化後の再生信号に同期される再生クロックを生成する。A/D変換部6におけるサンプリングは、PLL回路7で生成される再生クロックのタイミングで行われる。なお図示は省略しているが、再生クロックは、PRML復号のためPR等化部8や最尤復号部9、さらには信号品質評価部10、光ディスクコントローラ部15でも用いられる。
PR等化部8は、チャネルレスポンスを、例えばPR(1,2,2,1)、PR(1,2,2,2,1)などのターゲットレスポンスに等化する。即ちデジタル再生信号に対して高域雑音の抑制及び意図的な符号間干渉の付加を行う。
特に本例においては、例えば光ディスクとしてBD相当40GB以上の高密度記録を想定する。その場合、PR等化部8としては、例えばPR(1,2,3,3,3,2,1)のターゲットレスポンスとする。PRML復号処理の拘束長は7となる。
このPR等化部8によって等化処理が施された再生信号RF(EQ)は、最尤復号部9に供給される共に、信号品質評価部10にも供給される。
ビタビ検出は、所定の長さの連続ビットを単位として構成される複数のステートと、それらの間の遷移によって表されるブランチで構成されるビタビ検出器が用いられ、全ての可能なビット系列の中から、効率よく所望のビット系列を検出するように構成されている。
実際の回路では、各ステートに対してパスメトリックレジスタとよばれるそのステートにいたるまでのパーシャルレスポンス系列と信号のパスメトリックを記憶するレジスタ、および、パスメモリレジスタとよばれるそのステートにいたるまでのビット系列の流れ(パスメモリ)を記憶するレジスタの2つのレジスタが用意され、また、各ブランチに対してはブランチメトリックユニットとよばれるそのビットにおけるパーシャルレスポンス系列と信号のパスメトリックを計算する演算ユニットが用意されている。
さらに、上記のパスメトリックを最小にするようなパスを選択するには、この各ステートにおいて到達する2つ以下のブランチが有するパスメトリックの大小を比較しながら、パスメトリックの小さいパスを順次選択することで実現できる。この選択情報をパスメモリレジスタに転送することで、各ステートに到達するパスをビット系列で表現する情報が記憶される。パスメモリレジスタの値は、順次更新されながら最終的にパスメトリックを最小にするようなビット系列に収束していくので、その結果を出力する。
光ディスクコントローラ部15では、2値化データについてデコード処理、エラー訂正処理等を行って光ディスク90からの再生データを復調する。
信号品質評価部10は、詳細は後述するが、PR等化部8によって等化処理が施された再生信号RF(EQ)、及び2値化データDDを入力して、再生信号品質評価のための指標値Pqを生成し、指標値Pqを光ディスクコントローラ部15に出力する。光ディスクコントローラ部15では、指標値Pqにより、再生信号品質の評価を行うことができる。
信号品質評価部10の構成の説明に先立ち、信号品質評価部10で行うメトリック差分を用いた指標値Pq生成方式について説明する。なお、以下説明していく手法は、本実施の形態に適用できる一例に過ぎず、本開示の技術が当該方式に限定されるものではない。
なお、ここでは図示及び説明の簡略化のため、PR(1,2,2,1)の場合で示している。
この図2A、図2Bにおいて、縦軸の「+3,+2,+1,0,-1,-2,-3」の各値は、PR(1,2,2,1)において想定される各基準レベルの値を示している。
ここで、図示する最尤パスPaと第2パスPbとは、最終的に再生信号RF(EQ)との比較が行われる2つのパスであるとみることができる。つまりは、最尤パスPaに対するパスメトリックの値と、第2パスPbに対するパスメトリックの値が比較され、より値の小さい方のパスが生き残りパスとして選択されるというものである。
なお、パスメトリックとは、この図2で言えば、図中黒丸により示す各サンプリングタイミングで得られる再生信号RF(EQ)の各サンプリング値に対する、最尤パスPa(或いは第2パスPb)における対応するサンプリングタイミングで得られるそれぞれの値とのユークリッド距離の和、すなわちブランチメトリックの和である。
これに対し、図2Bでは、図2Aの場合よりも最尤パスPaと再生信号RF(EQ)とのユークリッド距離が拡大して、第2パスPbと再生信号RF(EQ)のユークリッド距離が近づく関係となっている。つまりこの場合、最尤パスPaに対するパスメトリックの値は図2Aの場合よりも大きくなり、逆に第2パスPbに対するパスメトリックの値がより小さくなることで、この場合の検出パスとしての最尤パスPaの確からしさは低下する。換言すれば、この場合は他方の第2パスPbの確からしさが増すこととなって、この第2パスPbが最尤のパスである可能性が高くなる。従って最尤パスPaとしての検出パスは、第2パスPbとして示されるパスに対して誤検出されたパスである可能性が高くなる。
また、逆に最尤パスPaに対するパスメトリックの値がより大きくなって、第2パスPbに対するパスメトリックの値が小さくなる程、最尤パスPaとしての検出パスは誤りである可能性が高いと判断することができる。
PRMLの手法が採られる場合の検出精度(再生信号品質)は、このようにして最尤パスPaに対するパスメトリックの値と、第2パスPbに対するパスメトリックの値との差、すなわちメトリック差分を求めることで見積もることができる。

すなわち、この場合のメトリック差分MDは、第2パスPbに対するパスメトリックの値から、最尤パスPaに対するパスメトリックの値を減算した値として定義される。
先の図2より、このようにして最尤パスPaと再生信号RFが完全に一致するということは、この場合の第2パスPbに対するパスメトリックは、最尤パスPaと第2パスPbとのユークリッド距離となることがわかる。従って上記のようなメトリック差分MDの最大値としては、最尤パスPaと第2パスPbとのユークリッド距離の値となる。
一般的には、このような最尤パスPaに対するパスメトリックの値と第2パスPbに対するパスメトリックの値との差分としてのメトリック差分の値について、例えばその分散値などの統計的な情報を得ることで、エラーレートを見積もるようにされていた。
一例を挙げれば、第2パスのビット系列のパターンが、最尤パスのビット系列のパターンに対してエッジが1ビット分シフトするなどの1ビットエラーや、最短マークである2Tマークの消滅などによる2ビットエラーなどが挙げられる。
しかしながら近年、光ディスクの高記録密度化が進むにつれて、実際のエラーとして現れ得るエラーパターンが単一でなく、複数のパターンがエラーに寄与するようになってきている。
そこで従前より、実際に使用されるPRMLのクラスにおいて、統計的にエラー発生頻度の高い幾つかのエラーパターンを抽出し、その各々に対し指標値を求め、それらを統合して指標値を構成している。
これは、エラーパターン毎に、メトリック差分の分布(分布平均値および分散)が異なるため、単一の分布として取り扱う事が出来ない理由による。
この図3においては、例えば3つのエラーパターンPTk(kは1~3)が実際のエラー発生に主に寄与するものとし、それらのメトリック差分MDの分布の例を示している。
例えば、図中MD1として示す分布は、最尤パスPaのビット系列と第2パスPbのビット系列とで相違しているビット数が1ビット分となる所謂1ビットエラーに該当するエラーパターンPT1についてのメトリック差分MDの分布であるとする。また、MD2として示す分布は例えば最短マークシフト等による2ビットエラーに該当するエラーパター
ンPT2についてのメトリック差分MDの分布、さらにMD3は3ビットエラーに該当するエラーパターンPT3についてのメトリック差分MDの分布などとして例示できる。
なお、図中「MD全体」と示す分布は、これら3つの分布MD1~MD3についての重ね合わせを示している。
ここで、これら最尤パスPaと第2パスPbとのユークリッド距離は、各パスが辿る値どうしの差の2乗を求めた上で、それらの和を求めることで計算できる。
従ってこの際、各エラーパターンkでのユークリッド距離「dk 2」は、最尤パスPa、第2パスPbにおける同じサンプリングタイミングでの値をそれぞれPAi、PBiとすると、

ここでは、エラーパターンPT1での最尤パスPaと第2パスPbとのユークリッド距離をユークリッド距離d1 2とし、エラーパターンPT2、エラーパターンPT3での最尤パスPaと第2パスPbとのユークリッド距離を、それぞれユークリッド距離d2 2、ユークリッド距離d3 2と表記している。
そして、このメトリック差分MDの値が「0」となる部分を超える(下回る)部分は、実際に検出エラーとなる部分を示し、PRMLにおいてこの部分は観測不能な部分となる。つまり、このようにメトリック差分MDの値が「0」を超えて負の値となるということは、最尤パスPaに対するパスメトリックの値よりも第2パスPbに対するパスメトリックの値の方が小さくなることを意味するが、PRMLの検出手法では、これまでの説明から理解されるようにパスメトリックの値が最小となるパスを最尤パスとして検出するので、このようにメトリック差分MDの値が負の値となることはあり得ない。従って、この検出エラーとなる部分は、実際に観測することが不可能となるものである。
図4Aは、或るエラーパターンPTkでのメトリック差分MDの分布(MDk)を示している。
なお、この図も図3と同様に縦軸にはサンプルの頻度、横軸にはメトリック差分MDの値をとっている。
この図に示されるように、メトリック差分MDの値について所定の閾値(Th_k)を設定し、これを下回るメトリック差分MDの値の出現頻度(Fk)を求めることで、エラーレートを見積もるものとする。
すなわち、例えば信号品質が悪化したとして、ビットエラーレートbERが上昇したとすると、そのときの分布MDkは、例えば次の図4Aに示すようにして裾野が比較的広がったような分布とされるが、これに伴っては、上記した出現頻度Fk(図中Fkの部分の面積)としても増加する傾向となる。つまり、ビットエラーレートbERの上昇に伴い、出現頻度Fkも上昇する。
また一方、図4Aの場合よりも良好な信号品質とされビットエラーレートbERが低下する場合には、例えば図4Bに示されるように分布MDkはより先鋭な形状となる。この場合には出現頻度Fkとしても減少し、従ってビットエラーレートbERの低下に応じて出現頻度Fkの値は低下することがわかる。
このように閾値Th_kを下回るメトリック差分MDの値の出現頻度Fkにより、ビットエラーレートbERと相関する指標が得られる。
特定のエラーパターンのメトリック差分の分布を利用する手法としては、他にも、例えば上記特許文献4に開示されている手法などもある。
以下説明していく本実施の形態の信号品質評価部10では、これらの手法を利用して指標値Pqを算出できる。
信号品質評価部10の構成例を図5に示す。
信号品質評価部10は、エラーパターン検出部20(20-1、20-2・・・20-n)、遅延補償部21、メトリック差分演算部22(22-1、22-2・・・22-n)、分布演算部23(23-1、23-2・・・23-n)、指標値演算部24を備える。
特定エラーパターンとは、その再生系において統計的にエラー発生頻度の高いとされるエラーパターンである。
例えば上述のように本実施の形態では、PR(1,2,3,3,3,2,1)としており、PR等化部8及び最尤復号部9で行われるPRML復号処理における拘束長は7である。この場合に、エラーパターン検出部20で検出する、拘束長より長いビットパターンである特定エラーパターンとしては、次のエラーパターンPTa,PTb,PTcとする。
PTb:ビット反転が起きる箇所を「1」で示したときに、「1011110111101」となる13ビットのパターン
PTc:ビット反転が起きる箇所を「1」で示したときに、「10111100111101」となる14ビットのパターン
なお、以上においてビット反転が起きる箇所とは、正解パターンと誤りパターンにおいて「1」「0」が異なっている箇所のことである。そして正解パターンと誤りパターンでは、「1」の箇所のうちの一部が異なるのではなく、全ての「1」の箇所が異なるビットパターンとなる。
従って支配的なエラーパターンとして使用する特定エラーパターンが1つであれば、エラーパターン検出部20は1つ(例えばエラーパターン検出部20-1のみ)でよい。また支配的なエラーパターンが2つであって指標値算出に使用する特定エラーパターンが2つであれば、エラーパターン検出部20は2つ(例えばエラーパターン検出部20-1、20-2)設ければよい。その意味で、「n」は選択した特定エラーパターンの数となる。
メトリック差分演算部22、分布演算部23も、それぞれエラーパターン検出部20に対応して設けられるため、その「n」の意味は同様となる。
そしてエラーパターン検出部20-1がエラーパターンPTaを検出し、エラーパターン検出部20-2がエラーパターンPTbを検出し、エラーパターン検出部20-3がエラーパターンPTcを検出する動作を行う。
エラーパターン検出部20では、まず2値化データDDとしての入力ビット列を、シフトレジスタ31で受けて、特定エラーパターンと同じクロック区間のデータを取り込む。例えば8ビットの特定エラーパターンPTaを検出対象とする場合、8クロック区間のデータを取り込む。そしてそのクロック区間のデータを排他的論理和演算部33に出力する(出力X1)。
またエラーパターン発生部32は、特定エラーパターンを出力する。例えば特定エラーパターンPTaとして「10111101」の8ビットパターンを排他的論理和演算部33に出力する(出力X2)。
つまりシフトレジスタ31から排他的論理和演算部33に供給された8ビットのビットパターンと、特定エラーパターンPTaにおいて「1」が立っている箇所のビット反転がなされた8ビットのビットパターンは、特定エラーパターンPTaに該当するエラーが起こる可能性のある最尤パスと第2パスの関係にある。但しその関係となるのは、排他的論理和演算結果の8ビットパターンがランレングス制限を満たしている場合である。ランレングス制限を満たしていなければ、そもそも誤検出のビット系列となり得ないからである。
従って、排他的論理和演算結果がランレングス制限を満たしている場合、エラーパターンが検出されたことになり、その場合、ランレングス制限確認部34から検出フラグFdetが出力される。
例えば特定エラーパターンPTbを検出するエラーパターン検出部20-2では、シフトレジスタ31で13クロック区間の2値化データDDを排他的論理和演算部33に供給する。またエラーパターン発生部32は、特定エラーパターンPTbとして「1011110111101」となる13ビットのパターンを排他的論理和演算部33に供給する。そしてこれらの排他的論理和演算結果がランレングス制限を満たしていれば検出フラグFdetが出力される。
各メトリック差分演算部22には、それぞれ対応するエラーパターン検出部20での検出フラグFdetと、遅延補償部21を介した再生信号RF(EQ)が供給される。
そしてこのメトリック差分演算部22では、特定エラーパターンが検出された際の再生信号RF(EQ)についてメトリック差分を求める。
なお、先の(数2)からもわかるように、メトリック差分の演算には、再生信号RF(EQ)とともに、最尤パスと第2パスの情報が必要であるが、各メトリック差分演算部22では、再生信号RF(EQ)と検出フラグFdetの情報から最尤パスと第2パスを求めることができる。例えばメトリック差分演算部22-1では、エラーパターン検出部20-1での8クロック区間「10111101」の特定エラーパターンPTaの検出フラグFdetが供給される。その場合、当該区間の再生信号RF(EQ)で、「1」の箇所のビットをすべて反転させた関係にあるビット列が、最尤パスと第2パスとなるためである。
指標値演算部24は、各分布演算部23(23-1、23-2・・・23-n)で求められた各特定エラーパターンについての分布を用いて総合的な指標値Pqを算出し、図1の光ディスクコントローラ部15へ出力する。
つまり分布演算部23及び指標値演算部24では、メトリック差分演算部22で求められたメトリック差分の分布を用いて再生信号品質の指標値を生成する指標値Pqを生成する処理が行われる。具体的な処理は、図2,図3で説明したような処理でも良いし、例えば特許文献4に記載された処理でもよく、各種の例が考えられる。
この場合において、特に本例では、検出対象の特定エラーパターンとして、上述の特定エラーパターンPTa、PTb、PTcを採用する。
この理由について説明する。
このような超高密度記録を行った場合には、チャネルの周波数特性、特に高域成分の顕著な劣化がおこり、再生信号の符号関干渉が非常に強まるため、より拘束長が長く、かつチャネルの周波数特性に適合したPRMLクラスを新たに導入しなければ、十分な再生性能を確保できない。
このとき、支配的なエラーパターンも再生チャネルの周波数特性、及びPRMLのクラス変更に伴い、従前の条件と変化する。
具体的には光学的振幅伝達関数(MTF)の高域カットオフのため、短マーク再生信号振幅は極度に低下し、最短マークだけでなく、二番目に短いマークの再生信号振幅もほとんど得られない。
ブロック的なエラーパターンは、エラー伝搬的性質を持つので、場合によっては10クロック区間以上の、非常に長い区間にわたってエラーが発生することもある。
破線で示した記録データパターン(正解パターン)に対して、実際には実線に示したように14クロック区間で誤った2値化データDDが検出されてしまっている。
エラーが発生している部分のビットパターンを図の下部に示しているが、この場合記録されたビット情報(つまり正解パターン)は「10001100001100」であるのに対し、検出されたビット情報(誤りが発生したパターン)は「00110000110001」となっている。
この場合、正解パターンと誤りが発生したパターンにおいてビット反転が起きている箇所を「1」で表すと、「10111100111101」となる。つまり、上述の特定エラーパターンPTcに対応するエラー発生の例であり、正解パターンと誤りが発生したパターンを比較してわかるように、位相シフトだけでなく極性反転のようなエラーも伴っている。
そこで本実施の形態では、BD相当40GB以上の高密度記録において支配的になったブロック的なエラーパターンを考慮し、新たにビタビ拘束長よりも長いエラーパターン検出を行い、信号評価に組み込む。
図8Aに特定エラーパターンPTa、PTb、PTcと、その具体的なパターン例を示している。
図8Aにおいて、「ビット誤り」として示している行の太枠内が、特定エラーパターンPTa、PTb、PTcに該当する。つまり正解パターンと誤りパターンでビット反転が生じる箇所を「1」としたパターンである。
特定エラーパターンPTaは「10111101」であるが、これに相当する正解パターンと誤りパターンの一例が「10001100」と「00110001」である。
特定エラーパターンPTbは「1011110111101」であるが、これに相当する正解パターンと誤りパターンの一例が「1000110001100」と「0011000110001」である。
特定エラーパターンPTcは「10111100111101」であるが、これに相当する正解パターンと誤りパターンの一例が「10001100001100」と「00110000110001」、つまり図7に例示したパターンである。
ここで記録線密度をBD換算で44GBとした場合のビットエラーのパターン毎の発生頻度を調べたところ、図8Bのようになった。
即ち特定エラーパターンPTaは53.7%、特定エラーパターンPTbは17.1%、特定エラーパターンPTcは7.6%、他のパターンが21.5%となった。
つまり3つの特定エラーパターンPTa、PTb、PTcで、全体のエラー数のほぼ8割がカバーされるという、支配的な状況となった。この場合、特定エラーパターンPTa、PTb、PTcの検出に基づいて指標値Pqを算出することで、その値はビットエラーレートと高い相関性を持つ、精度の高いものといえる。
図9,図10の各図は、光学シミュレーションモデルでの信号品質評価値とビットエラーレートの相関を示している。横軸は指標値、縦軸はビットエラーレート(bER)であり、算出された指標値を黒塗り三角、黒塗り四角でプロットしている。図中のTHで示される実線は、ガウシャンノイズを仮定した場合での、指標値とビットエラーレートの関係の理論値である。
図9A、図10Aは、従前の拘束長より短い特定エラーパターンに、新たな特定エラーパターンPTa,PTb,PTcすべてを加えた実施の形態に相当するもので、各分布に対し、例えば特許文献4で示した場合と同様の演算を行って評価値を得た場合である。図9B、図10Bは比較例として、従前の特定エラーパターンのみで評価値を求めた場合である
なお、従前の特定エラーパターンの例を図11に示しておく。エラーパターンPTd1はエッジシフトとしてのビットエラーに対応するパターン、エラーパターンPTd2は連続2Tシフトのビットエラーに対応するパターンである。
図10は従前の光ディスクをはるかに超えるBD換算40GBの超高線密度条件の場合であり、7tapのPRMLである、PR(1,2,3,3,3,2,1)MLで検出を行っている。この条件では、図10Bの比較例の結果は、指標値Pqが理論値と大きく乖離しており、実機条件の様々な信号劣化要因によって指標値とエラーレート相関がばらつく事が予想され、指標の精度が大きく悪化している。
一方で図10Aのように実施の形態では、この線密度条件においても、指標値Pqは、従前の光ディスク条件と同等の理論値との一致がみられており、実機条件でも高い精度(対エラーレート相関)が期待できる。
以上実施の形態を説明してきたが、実施の形態としては各種変形例が考えられる。
まず、検出対象の特定エラーパターンとしては、上述の特定エラーパターンPTa,PTb,PTcのすべてを用いなくてもよい。
またPRML拘束長より長いビットパターンである特定エラーパターン(PTa,PTb,PTc等)を第1の特定エラーパターンとしたときに、PRML拘束長より短いビットパターンである第2の特定エラーパターン(例えば図11のPTd1、PTd2等)を組み合わせて用いてもよい。
従って信号品質評価部10の具体例として以下の構成例が考えられる。なお以下で言う「演算処理系統」とは、エラーパターン検出部20、メトリック差分演算部、分布演算部23の処理系、つまり1つの特定エラーパターンに対応した処理系を示す。上述の実施の形態の図5では、n個の演算処理系統を有するものとして示したが、以下はその具体例となる。
例2:演算処理系統を1つ設け(n=1)、特定エラーパターンPTbを用いて指標値Pqを算出する構成例
例3:演算処理系統を1つ設け(n=1)、特定エラーパターンPTcを用いて指標値Pqを算出する構成例
例4:演算処理系統を2つ設け(n=2)、特定エラーパターンPTaとPTbを用いて指標値Pqを算出する構成例
例5:演算処理系統を2つ設け(n=2)、特定エラーパターンPTaとPTbを用いて指標値Pqを算出する構成例
例6:演算処理系統を2つ設け(n=2)、特定エラーパターンPTbとPTcを用いて指標値Pqを算出する構成例
例7:演算処理系統を3つ設け(n=3)、特定エラーパターンPTa、PTb、PTcを用いて指標値Pqを算出する構成例
例9:演算処理系統を3以上設け(n≧3)、第1の特定エラーパターンとしての2つの特定エラーパターンと、1又は複数の第2の特定エラーパターンを用いて指標値Pqを算出する構成例
例10:演算処理系統を4以上設け(n≧4)、第1の特定エラーパターンとしての3つの特定エラーパターンと、1又は複数の第2の特定エラーパターンを用いて指標値Pqを算出する構成例
例えばBD相当40GB以上の記録線密度において有効な(つまりエラーが十分低くでき、実用可能な)PRクラスであれば、上述の特定エラーパターンPTa,PTb,PTcのパターンが支配的であるため、他のPRクラスを採用する場合でも本開示の技術は有効である。
また、拘束長より長い特定エラーパターンとして、上記の特定エラーパターンPT1,PT2,PT3以外のパターンも考えられる。高密度記録に応じて選択するPRクラスや周波数特性などに応じて、ブロック的なエラーに対応する長区間(拘束長を越える区間)の特定エラーパターンが選定されればよい。
(1)ビット情報の再生信号についてパーシャルレスポンス等化及び最尤復号によるPRML復号処理を行って得られた2値化データを入力し、PRML復号処理の拘束長より長いビットパターンである1又は複数の特定エラーパターンを検出するエラーパターン検出部と、
上記エラーパターン検出部で検出された特定エラーパターンについて、メトリック差分を算出するメトリック差分演算部と、
上記メトリック差分演算部で求められたメトリック差分の分布を用いて再生信号品質の指標値を生成する指標値生成部と、
を備えた信号品質評価装置。
(2)上記拘束長が7である場合、
上記特定エラーパターンの少なくとも1つは、
ビット反転が起きる箇所を「1」で示したときに、「10111101」となる8ビットのパターンである上記(1)に記載の信号品質評価装置。
(3)上記拘束長が7である場合、
上記特定エラーパターンの少なくとも1つは、
ビット反転が起きる箇所を「1」で示したときに、「1011110111101」となる13ビットのパターンである上記(1)又は(2)に記載の信号品質評価装置。
(4)上記拘束長が7である場合、
上記特定エラーパターンの少なくとも1つは、
ビット反転が起きる箇所を「1」で示したときに、「10111100111101」となる14ビットのパターンである上記(1)乃至(3)に記載の信号品質評価装置。
(5)上記拘束長より長いビットパターンである1又は複数の特定エラーパターンを第1の特定エラーパターンとしたときに、
上記エラーパターン検出部は、上記第1の特定エラーパターンに加えて、上記拘束長より短いビットパターンである1又は複数の第2の特定エラーパターンの検出も行い、
上記メトリック差分演算部は、上記エラーパターン検出部で検出された第1及び第2の特定エラーパターンについて、それぞれメトリック差分を算出する上記(1)乃至(4)に記載の信号品質評価装置。
(6)上記ビット情報の再生信号は、記録線密度が44.65nm/bit以上でビット情報が記録された記録媒体から再生された信号である上記(1)乃至(5)に記載の信号品質評価装置。
Claims (8)
- ビット情報の再生信号についてパーシャルレスポンス等化及び最尤復号によるPRML復号処理を行って得られた2値化データを入力し、PRML復号処理の拘束長より長いビットパターンである1又は複数の特定エラーパターンを検出するエラーパターン検出部と、
上記エラーパターン検出部で検出された特定エラーパターンについて、メトリック差分を算出するメトリック差分演算部と、
上記メトリック差分演算部で求められたメトリック差分の分布を用いて再生信号品質の指標値を生成する指標値生成部と、
を備えた信号品質評価装置。 - 上記拘束長が7である場合、
上記特定エラーパターンの少なくとも1つは、
ビット反転が起きる箇所を「1」で示したときに、「10111101」となる8ビットのパターンである請求項1に記載の信号品質評価装置。 - 上記拘束長が7である場合、
上記特定エラーパターンの少なくとも1つは、
ビット反転が起きる箇所を「1」で示したときに、「1011110111101」となる13ビットのパターンである請求項1に記載の信号品質評価装置。 - 上記拘束長が7である場合、
上記特定エラーパターンの少なくとも1つは、
ビット反転が起きる箇所を「1」で示したときに、「10111100111101」となる14ビットのパターンである請求項1に記載の信号品質評価装置。 - 上記拘束長より長いビットパターンである1又は複数の特定エラーパターンを第1の特定エラーパターンとしたときに、
上記エラーパターン検出部は、上記第1の特定エラーパターンに加えて、上記拘束長より短いビットパターンである1又は複数の第2の特定エラーパターンの検出も行い、
上記メトリック差分演算部は、上記エラーパターン検出部で検出された第1及び第2の特定エラーパターンについて、それぞれメトリック差分を算出する請求項1に記載の信号品質評価装置。 - 上記ビット情報の再生信号は、記録線密度が44.65nm/bit以上でビット情報が記録された記録媒体から再生された信号である請求項1に記載の信号品質評価装置。
- ビット情報の再生信号についてパーシャルレスポンス等化及び最尤復号によるPRML復号処理を行って得られた2値化データを入力し、PRML復号処理の拘束長より長いビットパターンである1又は複数の特定エラーパターンを検出し、
検出された上記特定エラーパターンについて、メトリック差分を算出し、
上記メトリック差分の分布を用いて再生信号品質の指標値を生成する信号品質評価方法。 - 記録媒体からビット情報の再生信号を再生する再生部と、
上記再生信号についてパーシャルレスポンス等化及び最尤復号によるPRML復号処理を行って2値化データを復号する復号部と、
上記2値化データを入力し、PRML復号処理の拘束長より長いビットパターンである1又は複数の特定エラーパターンを検出するエラーパターン検出部と、
上記エラーパターン検出部で検出された特定エラーパターンについて、メトリック差分を算出するメトリック差分演算部と、
上記メトリック差分演算部で求められたメトリック差分の分布を用いて再生信号品質の指標値を生成する指標値生成部と、
を備えた再生装置。
Priority Applications (5)
| Application Number | Priority Date | Filing Date | Title |
|---|---|---|---|
| KR1020147032852A KR102071092B1 (ko) | 2012-06-04 | 2013-04-26 | 신호 품질 평가 장치, 신호 품질 평가 방법, 재생 장치 |
| EP13799823.3A EP2858070B1 (en) | 2012-06-04 | 2013-04-26 | Signal quality evaluation device, signal quality evaluation method, and playback device |
| CN201380028675.0A CN104335278B (zh) | 2012-06-04 | 2013-04-26 | 信号质量评估装置、信号质量评估方法以及再生装置 |
| JP2014519884A JP6090315B2 (ja) | 2012-06-04 | 2013-04-26 | 信号品質評価装置、信号品質評価方法、再生装置 |
| US14/403,482 US9461672B2 (en) | 2012-06-04 | 2013-04-26 | Signal quality evaluation apparatus, signal quality evaluation method, and reproducing device |
Applications Claiming Priority (2)
| Application Number | Priority Date | Filing Date | Title |
|---|---|---|---|
| JP2012-126966 | 2012-06-04 | ||
| JP2012126966 | 2012-06-04 |
Publications (1)
| Publication Number | Publication Date |
|---|---|
| WO2013183385A1 true WO2013183385A1 (ja) | 2013-12-12 |
Family
ID=49711786
Family Applications (1)
| Application Number | Title | Priority Date | Filing Date |
|---|---|---|---|
| PCT/JP2013/062487 WO2013183385A1 (ja) | 2012-06-04 | 2013-04-26 | 信号品質評価装置、信号品質評価方法、再生装置 |
Country Status (7)
| Country | Link |
|---|---|
| US (1) | US9461672B2 (ja) |
| EP (1) | EP2858070B1 (ja) |
| JP (1) | JP6090315B2 (ja) |
| KR (1) | KR102071092B1 (ja) |
| CN (1) | CN104335278B (ja) |
| TW (1) | TWI530942B (ja) |
| WO (1) | WO2013183385A1 (ja) |
Cited By (2)
| Publication number | Priority date | Publication date | Assignee | Title |
|---|---|---|---|---|
| WO2018042814A1 (ja) * | 2016-08-30 | 2018-03-08 | ソニーセミコンダクタソリューションズ株式会社 | 信号品質評価装置、信号品質評価値生成方法、再生装置 |
| WO2019102733A1 (ja) | 2017-11-27 | 2019-05-31 | ソニーセミコンダクタソリューションズ株式会社 | 復号装置、復号方法 |
Citations (5)
| Publication number | Priority date | Publication date | Assignee | Title |
|---|---|---|---|---|
| JP3711140B2 (ja) | 2005-03-07 | 2005-10-26 | 株式会社東芝 | 情報記録再生装置及びその信号評価方法 |
| JP3857685B2 (ja) | 2003-01-28 | 2006-12-13 | 日本電気株式会社 | 信号評価方法と情報記録再生装置と情報再生装置及び情報媒体 |
| WO2010001588A1 (ja) | 2008-07-01 | 2010-01-07 | パナソニック株式会社 | 再生信号評価方法、再生信号評価装置及びこれを備えた光ディスク装置 |
| WO2010090136A1 (ja) * | 2009-02-03 | 2010-08-12 | 日立コンシューマエレクトロニクス株式会社 | 再生信号の評価方法および光ディスク装置 |
| JP4750488B2 (ja) | 2005-07-08 | 2011-08-17 | ソニー株式会社 | 評価装置、再生装置、評価方法 |
Family Cites Families (10)
| Publication number | Priority date | Publication date | Assignee | Title |
|---|---|---|---|---|
| US6801061B2 (en) | 2002-08-29 | 2004-10-05 | Micron Technology, Inc. | Reduced current input buffer circuit |
| JP2005285153A (ja) * | 2004-03-26 | 2005-10-13 | Toshiba Corp | 情報記録媒体、情報再生装置、情報再生方法、および情報記録方法 |
| CN100570728C (zh) | 2004-05-07 | 2009-12-16 | 株式会社日立制作所 | 再生信号的评价方法以及光盘装置 |
| JP4313755B2 (ja) * | 2004-05-07 | 2009-08-12 | 株式会社日立製作所 | 再生信号の評価方法および光ディスク装置 |
| JP4622632B2 (ja) * | 2005-03-31 | 2011-02-02 | ソニー株式会社 | 最尤復号装置、信号評価方法、再生装置 |
| US20100039912A1 (en) * | 2006-09-11 | 2010-02-18 | Masaki Nakano | Optical information recording/reproducing unit and method of measuring recorded-mark quality |
| JP5003284B2 (ja) * | 2007-05-24 | 2012-08-15 | 日本電気株式会社 | 信号品質測定装置及び情報再生装置 |
| US20080299403A1 (en) * | 2007-06-01 | 2008-12-04 | Weyerhaeuser Co. | Gas barrier packaging board |
| JPWO2009041598A1 (ja) * | 2007-09-26 | 2011-01-27 | 日本電気株式会社 | 信号品質評価装置、方法、及び、情報記録再生装置 |
| JP2012048774A (ja) * | 2010-08-25 | 2012-03-08 | Sony Corp | 対物レンズ、レンズ製造方法、光学ドライブ装置 |
-
2013
- 2013-04-25 TW TW102114898A patent/TWI530942B/zh active
- 2013-04-26 US US14/403,482 patent/US9461672B2/en active Active
- 2013-04-26 WO PCT/JP2013/062487 patent/WO2013183385A1/ja active Application Filing
- 2013-04-26 JP JP2014519884A patent/JP6090315B2/ja active Active
- 2013-04-26 KR KR1020147032852A patent/KR102071092B1/ko active IP Right Grant
- 2013-04-26 EP EP13799823.3A patent/EP2858070B1/en active Active
- 2013-04-26 CN CN201380028675.0A patent/CN104335278B/zh active Active
Patent Citations (5)
| Publication number | Priority date | Publication date | Assignee | Title |
|---|---|---|---|---|
| JP3857685B2 (ja) | 2003-01-28 | 2006-12-13 | 日本電気株式会社 | 信号評価方法と情報記録再生装置と情報再生装置及び情報媒体 |
| JP3711140B2 (ja) | 2005-03-07 | 2005-10-26 | 株式会社東芝 | 情報記録再生装置及びその信号評価方法 |
| JP4750488B2 (ja) | 2005-07-08 | 2011-08-17 | ソニー株式会社 | 評価装置、再生装置、評価方法 |
| WO2010001588A1 (ja) | 2008-07-01 | 2010-01-07 | パナソニック株式会社 | 再生信号評価方法、再生信号評価装置及びこれを備えた光ディスク装置 |
| WO2010090136A1 (ja) * | 2009-02-03 | 2010-08-12 | 日立コンシューマエレクトロニクス株式会社 | 再生信号の評価方法および光ディスク装置 |
Cited By (4)
| Publication number | Priority date | Publication date | Assignee | Title |
|---|---|---|---|---|
| WO2018042814A1 (ja) * | 2016-08-30 | 2018-03-08 | ソニーセミコンダクタソリューションズ株式会社 | 信号品質評価装置、信号品質評価値生成方法、再生装置 |
| TWI638539B (zh) * | 2016-08-30 | 2018-10-11 | 日商索尼半導體解決方案公司 | Signal quality evaluation device, signal quality evaluation value generation method, and regeneration device |
| WO2019102733A1 (ja) | 2017-11-27 | 2019-05-31 | ソニーセミコンダクタソリューションズ株式会社 | 復号装置、復号方法 |
| US11070238B2 (en) | 2017-11-27 | 2021-07-20 | Sony Semiconductor Solutions Corporation | Decoding device and decoding method |
Also Published As
| Publication number | Publication date |
|---|---|
| TW201351402A (zh) | 2013-12-16 |
| JP6090315B2 (ja) | 2017-03-08 |
| CN104335278B (zh) | 2018-04-03 |
| CN104335278A (zh) | 2015-02-04 |
| EP2858070A4 (en) | 2016-06-15 |
| US9461672B2 (en) | 2016-10-04 |
| US20150143208A1 (en) | 2015-05-21 |
| KR20150023281A (ko) | 2015-03-05 |
| TWI530942B (zh) | 2016-04-21 |
| EP2858070A1 (en) | 2015-04-08 |
| KR102071092B1 (ko) | 2020-01-29 |
| EP2858070B1 (en) | 2019-08-14 |
| JPWO2013183385A1 (ja) | 2016-01-28 |
Similar Documents
| Publication | Publication Date | Title |
|---|---|---|
| JP4622632B2 (ja) | 最尤復号装置、信号評価方法、再生装置 | |
| JP4750488B2 (ja) | 評価装置、再生装置、評価方法 | |
| RU2497205C2 (ru) | Способ оценки сигнала воспроизведения, устройство оценки сигнала воспроизведения и устройство на оптическом диске, оснащенное таким устройством оценки сигнала воспроизведения | |
| JP3926688B2 (ja) | 再生信号品質評価方法および情報再生装置 | |
| JP3857685B2 (ja) | 信号評価方法と情報記録再生装置と情報再生装置及び情報媒体 | |
| JP6090315B2 (ja) | 信号品質評価装置、信号品質評価方法、再生装置 | |
| JP5441906B2 (ja) | 再生信号評価方法、再生信号評価装置及びこれを備えた光ディスク装置 | |
| US7441177B2 (en) | Information reproduction apparatus and method using maximum likelihood decoding | |
| US20100085851A1 (en) | Method and apparatus for evaluating information recording medium | |
| JP2010140551A (ja) | 光ディスク再生方法および再生装置 | |
| WO2018042814A1 (ja) | 信号品質評価装置、信号品質評価値生成方法、再生装置 | |
| JP2005332437A (ja) | 再生信号評価方法及び情報記録再生装置 | |
| WO2009122642A1 (ja) | 再生信号品質評価装置及び方法 | |
| JP2005093043A (ja) | 非対称データチャネルでのビット再生方法 | |
| JP2008300023A (ja) | 情報再生装置及び方法 | |
| JP2009238283A (ja) | 光学的情報再生装置、情報再生方法 |
Legal Events
| Date | Code | Title | Description |
|---|---|---|---|
| 121 | Ep: the epo has been informed by wipo that ep was designated in this application |
Ref document number: 13799823 Country of ref document: EP Kind code of ref document: A1 |
|
| WWE | Wipo information: entry into national phase |
Ref document number: 2013799823 Country of ref document: EP |
|
| ENP | Entry into the national phase |
Ref document number: 20147032852 Country of ref document: KR Kind code of ref document: A |
|
| WWE | Wipo information: entry into national phase |
Ref document number: 14403482 Country of ref document: US |
|
| ENP | Entry into the national phase |
Ref document number: 2014519884 Country of ref document: JP Kind code of ref document: A |
|
| NENP | Non-entry into the national phase |
Ref country code: DE |