WO2013081072A1 - 測定装置、測定方法および半導体デバイス製造方法 - Google Patents
測定装置、測定方法および半導体デバイス製造方法 Download PDFInfo
- Publication number
- WO2013081072A1 WO2013081072A1 PCT/JP2012/080984 JP2012080984W WO2013081072A1 WO 2013081072 A1 WO2013081072 A1 WO 2013081072A1 JP 2012080984 W JP2012080984 W JP 2012080984W WO 2013081072 A1 WO2013081072 A1 WO 2013081072A1
- Authority
- WO
- WIPO (PCT)
- Prior art keywords
- pattern
- wafer
- exposure
- focus
- desired portion
- Prior art date
- Legal status (The legal status is an assumption and is not a legal conclusion. Google has not performed a legal analysis and makes no representation as to the accuracy of the status listed.)
- Ceased
Links
Images








Classifications
-
- H—ELECTRICITY
- H10—SEMICONDUCTOR DEVICES; ELECTRIC SOLID-STATE DEVICES NOT OTHERWISE PROVIDED FOR
- H10P—GENERIC PROCESSES OR APPARATUS FOR THE MANUFACTURE OR TREATMENT OF DEVICES COVERED BY CLASS H10
- H10P76/00—Manufacture or treatment of masks on semiconductor bodies, e.g. by lithography or photolithography
- H10P76/20—Manufacture or treatment of masks on semiconductor bodies, e.g. by lithography or photolithography of masks comprising organic materials
- H10P76/204—Manufacture or treatment of masks on semiconductor bodies, e.g. by lithography or photolithography of masks comprising organic materials of organic photoresist masks
- H10P76/2041—Photolithographic processes
-
- G—PHYSICS
- G03—PHOTOGRAPHY; CINEMATOGRAPHY; ANALOGOUS TECHNIQUES USING WAVES OTHER THAN OPTICAL WAVES; ELECTROGRAPHY; HOLOGRAPHY
- G03F—PHOTOMECHANICAL PRODUCTION OF TEXTURED OR PATTERNED SURFACES, e.g. FOR PRINTING, FOR PROCESSING OF SEMICONDUCTOR DEVICES; MATERIALS THEREFOR; ORIGINALS THEREFOR; APPARATUS SPECIALLY ADAPTED THEREFOR
- G03F7/00—Photomechanical, e.g. photolithographic, production of textured or patterned surfaces, e.g. printing surfaces; Materials therefor, e.g. comprising photoresists; Apparatus specially adapted therefor
- G03F7/70—Microphotolithographic exposure; Apparatus therefor
- G03F7/70483—Information management; Active and passive control; Testing; Wafer monitoring, e.g. pattern monitoring
- G03F7/70605—Workpiece metrology
- G03F7/70616—Monitoring the printed patterns
- G03F7/70641—Focus
-
- G—PHYSICS
- G03—PHOTOGRAPHY; CINEMATOGRAPHY; ANALOGOUS TECHNIQUES USING WAVES OTHER THAN OPTICAL WAVES; ELECTROGRAPHY; HOLOGRAPHY
- G03F—PHOTOMECHANICAL PRODUCTION OF TEXTURED OR PATTERNED SURFACES, e.g. FOR PRINTING, FOR PROCESSING OF SEMICONDUCTOR DEVICES; MATERIALS THEREFOR; ORIGINALS THEREFOR; APPARATUS SPECIALLY ADAPTED THEREFOR
- G03F7/00—Photomechanical, e.g. photolithographic, production of textured or patterned surfaces, e.g. printing surfaces; Materials therefor, e.g. comprising photoresists; Apparatus specially adapted therefor
- G03F7/70—Microphotolithographic exposure; Apparatus therefor
- G03F7/708—Construction of apparatus, e.g. environment aspects, hygiene aspects or materials
- G03F7/7085—Detection arrangement, e.g. detectors of apparatus alignment possibly mounted on wafers, exposure dose, photo-cleaning flux, stray light, thermal load
-
- H—ELECTRICITY
- H10—SEMICONDUCTOR DEVICES; ELECTRIC SOLID-STATE DEVICES NOT OTHERWISE PROVIDED FOR
- H10P—GENERIC PROCESSES OR APPARATUS FOR THE MANUFACTURE OR TREATMENT OF DEVICES COVERED BY CLASS H10
- H10P74/00—Testing or measuring during manufacture or treatment of wafers, substrates or devices
- H10P74/23—Testing or measuring during manufacture or treatment of wafers, substrates or devices characterised by multiple measurements, corrections, marking or sorting processes
- H10P74/235—Testing or measuring during manufacture or treatment of wafers, substrates or devices characterised by multiple measurements, corrections, marking or sorting processes comprising optical enhancement of defects or not-directly-visible states
Definitions
- the present invention relates to a measuring apparatus and a measuring method for measuring an exposure condition of a pattern exposed for each predetermined area on a substrate. Moreover, it is related with the semiconductor device manufacturing method using such a measuring method.
- test exposure or the like is performed prior to production so that the pattern (semiconductor circuit pattern) image surface projected on the wafer by the exposure apparatus matches the wafer exposure surface (resist or topcoat-treated surface). Has been adjusted.
- a method is known in which a test pattern is exposed and developed using a dedicated mask (reticle), and the focus offset amount is measured from the positional deviation of the obtained test pattern. (For example, refer to Patent Document 1).
- the line width and shape may differ between the dedicated pattern for obtaining the focus offset and the actual pattern, and the focus offset (focus state) obtained with the dedicated pattern and the focus offset state of the actual pattern (semiconductor circuit pattern) are different. There was a problem of being different. In addition, depending on the device, there are cases where there are many different function portions in one chip, and there is a problem that a divergence is likely to occur between the focus offset obtained from the dedicated pattern and the focus offset of the actual pattern.
- the present invention has been made in view of such a problem, and an object thereof is to provide an apparatus and a method capable of measuring a focus state of a pattern of a device projected on a wafer.
- the measuring apparatus detects and detects an illumination unit that illuminates a substrate having a pattern formed by exposure on the surface with illumination light, and illumination light modulated by the pattern.
- a detection unit that outputs a signal; and a measurement unit that measures an exposure condition of the pattern in a desired portion using detection signals detected in a plurality of portions of the pattern.
- the measurement unit is configured to measure the exposure condition of the pattern of the desired portion using detection signals detected in a plurality of portions including the desired portion. Also good.
- the measurement unit may be configured to measure an exposure condition of the pattern of the desired portion from a detection signal detected in a portion around the desired portion.
- the measurement unit corresponds to the desired portion obtained from the detection signal detected at the desired portion and the detection signal detected at a portion other than the desired portion.
- the exposure condition of the pattern of the desired portion may be measured from the signal.
- the measurement unit may be configured to obtain a detection signal corresponding to the desired portion by interpolation from signals detected in a portion around the desired portion.
- the measurement unit may determine the exposure condition of the pattern of the desired portion, the desired portion, and a portion around the desired portion, which are correlated with the desired portion. You may comprise so that it may measure using the detection signal detected in a certain part.
- a detection condition for detecting the modulated illumination light may be set for each portion.
- the detection unit may be configured to detect modulation based on diffraction or polarization by the pattern.
- the measurement apparatus having the above configuration further includes a storage unit that stores in advance a detection signal detected by a pattern formed under a plurality of exposure conditions, and the measurement unit includes a detection signal stored in the storage unit and The detection condition detected by the detection unit may be compared to measure the exposure condition of the desired pattern on the surface.
- the exposure condition measured by the measurement unit may be at least one of a focus state and an exposure amount in the exposure.
- the measurement method illuminates a substrate having a pattern formed by exposure on the surface with illumination light, detects the illumination light modulated by the pattern, outputs a detection signal, and outputs a desired signal.
- the exposure condition of the pattern is measured using detection signals detected at a plurality of portions of the pattern.
- the exposure condition of the pattern of the desired portion may be measured using detection signals detected in a plurality of portions including the desired portion.
- the exposure condition of the pattern of the desired portion may be determined based on the desired signal obtained from the detection signal detected at the desired portion and the detection signal detected at a portion other than the desired portion. You may make it measure from the signal corresponding to this part.
- a signal corresponding to the desired portion is obtained from detection signals detected in a partial region around the desired portion, and an exposure condition of the pattern of the desired portion is measured. Also good.
- a detection signal corresponding to the desired portion may be obtained by interpolation from signals detected in a portion around the desired portion.
- the exposure condition of the pattern of the desired portion may be determined by detecting a detection signal detected in the desired portion and a portion other than the desired portion that is correlated with the desired portion. You may make it measure from the signal corresponding to this desired part calculated
- a detection condition for detecting the modulated illumination light may be set for each portion.
- the detection may be detection of modulation based on diffraction or polarization by the pattern.
- a detection signal detected by a pattern formed under a plurality of exposure conditions is stored in advance, and the stored detection signal is compared with the detected detection signal to obtain a desired signal on the surface. You may make it measure the exposure condition of the pattern of this part.
- the exposure condition to be measured may be at least one of a focus state and an exposure amount in the exposure.
- the semiconductor device manufacturing method according to the present invention includes a lithography step of exposing a pattern to the surface of the substrate, and the exposure method is performed on the substrate provided with the pattern using the measuring method according to the present invention.
- An exposure condition at the time of exposure is measured, the exposure condition is corrected based on the measured exposure condition, and a pattern is exposed on the surface of the substrate under the corrected exposure condition.
- the present invention it is possible to measure the focus state when the pattern is exposed from the pattern of the device formed on the wafer.
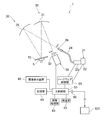
- FIG. 1 shows a surface inspection apparatus 1 having the function of a measuring apparatus according to the present invention.
- a schematic configuration of the surface inspection apparatus 1 will be described with reference to FIG.
- the surface inspection apparatus 1 includes a stage 5 that supports a substantially disc-shaped semiconductor wafer 10 (hereinafter referred to as a wafer 10) conveyed by a conveyance apparatus (not shown) by vacuum suction.
- the stage 5 supports the wafer 10 so that the wafer 10 can be rotated (rotated within the surface of the wafer 10) with the rotational symmetry axis of the wafer 10 (the central axis of the stage 5) as the rotation axis.
- the orientation of the wafer due to this rotation is referred to as a wafer orientation angle (an angle based on a notch or an orientation flat) for convenience.
- the stage 5 can tilt (tilt) the wafer 10 around an axis passing through a support surface that supports the wafer 10 or a plane parallel to the support surface, so that the incident angle of illumination light can be adjusted. It has become.
- the surface inspection apparatus 1 further includes an illumination system 20 that irradiates illumination light as parallel light on the entire surface of the wafer 10 supported by the stage 5, and regular reflection from the entire surface of the wafer 10 when irradiated with illumination light.
- a light receiving system 30 that collects light, diffracted light, scattered light, and the like; an imaging device 35 that receives light collected by the light receiving system 30 to detect an image of the surface of the wafer 10; an image processing unit 40;
- a unit 42, a storage unit 45, an image display device 46, a main control unit 50, and a hardware control unit 55 connected to the main control unit 50 are configured.
- the illumination system 20 includes an illumination unit 21 that emits illumination light, and an illumination-side concave mirror 25 that reflects the illumination light emitted from the illumination unit 21 toward the surface of the wafer 10.
- the illumination unit 21 includes a light source unit 22 such as a metal halide lamp or a mercury lamp, and a light control unit 23 that extracts (selectively transmits) light having a predetermined wavelength from the light from the light source unit 22 and adjusts the intensity.
- the light guide fiber 24 guides the light from the light control unit 23 to the illumination side concave mirror 25 as illumination light.
- the main control unit 50 controls the light source unit 22 and the light control unit 23 via the hardware control unit 55.
- the light emitted from the light source unit 22 passes through the light control unit 23 and is adjusted to illumination light with a predetermined intensity having a predetermined wavelength (for example, a wavelength of 248 nm). Then, the illumination light is emitted from the light guide fiber 24 to the illumination side concave mirror 25, and since the emission part of the light guide fiber 24 is disposed on the focal plane of the illumination side concave mirror 25, the illumination side concave mirror 25 generates a parallel light flux.
- the surface of the wafer 10 supported by the stage 5 is irradiated.
- the relationship between the incident angle and the emission angle of the illumination light with respect to the wafer 10 is determined by tilting the stage 5 and placing the wafer 10 thereon. It can be adjusted by changing the angle (support angle).
- an illumination-side polarization filter 26 is detachably provided on the optical path, and the illumination-side polarization filter 26 is removed from the optical path as shown in FIG.
- An inspection using diffracted light in the state (hereinafter referred to as a diffraction inspection for convenience) is performed.
- an inspection using polarization (change in polarization state due to structural birefringence) with the illumination side polarization filter 26 inserted in the optical path hereinafter referred to as PER inspection for convenience). (Details of the illumination-side polarizing filter 26 will be described later).
- the emitted light (diffracted light or specularly reflected / scattered light) from the surface of the wafer 10 irradiated with illumination light by the illumination system 20 is collected by the light receiving system 30.
- the light receiving system 30 includes a light receiving side concave mirror 31 disposed to face the stage 5.
- the outgoing light (diffracted light or specularly reflected / scattered light) collected by the light-receiving-side concave mirror 31 reaches the imaging surface of the imaging device 35, and an image of the wafer 10 is formed.
- a light-receiving side polarizing filter 32 is provided so as to be able to be inserted into and extracted from the optical path. As shown in FIG. 1, the light-receiving side polarizing filter 32 is removed from the optical path. Diffraction inspection is performed. On the other hand, as shown in FIG. 2, the PER inspection is performed with the light receiving side polarizing filter 32 inserted in the optical path (details of the light receiving side polarizing filter 32 will be described later).
- the imaging device 35 photoelectrically converts the image of the surface of the wafer 10 formed on the imaging surface to generate an image signal (digital image data), and sends it to the main control unit 50.
- the main control unit 50 receives an image signal of the image of the surface of the wafer 10 from the imaging device 35 and outputs the image signal to the image processing unit 40.
- the image processing unit 40 generates a digital image of the wafer 10 based on the image signal of the wafer 10 input from the imaging device 35.
- the digital image of the wafer 10 generated by the image processing unit 40 is sent to the inspection unit 42 via the main control unit 50.
- the inspection unit 42 compares the image data of the wafer 10 sent from the main control unit 50 (image processing unit 40) with the image data of the non-defective wafer stored in advance in the storage unit 45, and Inspect for surface defects (abnormalities). Then, the inspection result by the inspection unit 42 and the image of the wafer 10 at that time are output and displayed on the image display device 46, and are sent to the storage unit 45 and stored therein.
- the inspection unit 42 can obtain a focus state at the time of exposure by the exposure apparatus 101 using an image of the wafer (details will be described later). If the inspection for the presence or absence of defects on the surface of the wafer 10 is easily affected by the underlayer of the wafer 10, the illumination-side polarizing filter 26 is disposed in the illumination system 20 so that the illumination light becomes s-polarized light. By illuminating with polarized light, the influence of the underlayer can be reduced. In this case as well, the light-receiving side polarizing filter 32 is removed from the optical path.
- the wafer 10 is projected and exposed with a predetermined mask pattern onto the uppermost resist film by the exposure device 101, developed by a developing device (not shown), and then a wafer cassette (not shown) by a transport device (not shown). Or it is conveyed on the stage 5 from a developing device. At this time, the wafer 10 is transferred onto the stage 5 in a state where the alignment is performed with reference to the pattern or outer edge (notch, orientation flat, etc.) of the wafer 10.
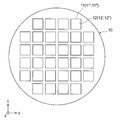
- a plurality of chip regions 11 are arranged vertically and horizontally (in the XY directions in FIG. 3) on the surface of the wafer 10, and a line pattern or hole pattern is formed as a semiconductor pattern in each chip region 11.
- a repetitive pattern 12 is formed.
- the repetitive pattern 12 includes a first pattern area A composed of one or a plurality of repetitive patterns, and the first pattern area A has a repetitive pattern configuration.
- a different second pattern region B is included.
- a device formed on the wafer 10 is a logic device having a small area of a pattern formed on the surface and a plurality of regions having different pattern configurations.
- one shot of exposure often includes a plurality of chip areas, in FIG. 3, one chip is taken as one shot for easy understanding.
- the processing speed is improved by performing illumination and light reception all at once.
- illumination and light reception can be performed for one shot or a smaller range.
- the exposure apparatus 101 is the above-described step-and-scan exposure apparatus, and is electrically connected to the signal output unit 60 of the surface inspection apparatus 1 of the present embodiment via a cable or the like.
- the exposure control can be adjusted based on the data (signal).
- the illumination side polarization filter 26 and the light reception side polarization filter 32 are moved from the optical path.
- the wafer 10 is removed and transferred to the stage 5 by a transfer device (not shown).
- the positional information of the pattern formed on the surface of the wafer 10 is acquired by an alignment mechanism (not shown) during the transfer, and the wafer 10 is placed at a predetermined position on the stage 5 in a predetermined direction. Can do.
- the stage 5 is rotated so that the illumination direction on the surface of the wafer 10 matches the pattern repetition direction (in the case of a line pattern, it is orthogonal to the line). Further, when the pitch of the pattern is P, the wavelength of the illumination light applied to the surface of the wafer 10 is ⁇ , the incident angle of the illumination light is ⁇ 1, and the emission angle of the nth-order diffracted light is ⁇ 2, from Huygens' principle, Setting is performed so as to satisfy the following expression (the stage 5 is tilted).
- the illumination system 20 irradiates the surface of the wafer 10 with illumination light.
- the light emitted from the light source unit 22 in the illumination unit 21 passes through the light control unit 23 and has a predetermined wavelength (for example, a wavelength of 248 nm).
- the illumination light having a predetermined intensity is adjusted.
- the illumination light is emitted from the light guide fiber 24 to the illumination side concave mirror 25, and the illumination light reflected by the illumination side concave mirror 25 is irradiated onto the surface of the wafer 10 as a parallel light flux.
- the diffracted light diffracted on the surface of the wafer 10 is collected by the light-receiving-side concave mirror 31 and reaches the image pickup surface of the image pickup device 35 to form an image (diffraction image) of the wafer 10.
- a condition of diffracted light determined by a combination of a wafer azimuth angle, an illumination wavelength, an illumination angle (incident angle), an emission angle, a diffraction order, and the like is referred to as a “diffraction condition”.
- the imaging device 35 photoelectrically converts the image of the surface of the wafer 10 formed on the imaging surface to generate an image signal, and outputs the image signal to the image processing unit 40 via the main control unit 50.
- the image processing unit 40 based on the image signal of the wafer 10 input from the imaging device 35, the digital image of the wafer 10 (hereinafter, the digital image of the wafer 10 based on the diffracted light is referred to as “diffracted image” for convenience). Is generated. Further, when generating the diffraction image of the wafer 10, the image processing unit 40 sends the diffraction image to the inspection unit 42 via the main control unit 50.
- the inspection unit 42 compares the diffraction image data of the wafer 10 with the image data of the non-defective wafer stored in advance in the storage unit 45 and inspects for the presence or absence of defects (abnormalities) on the surface of the wafer 10. Then, the inspection results by the image processing unit 40 and the inspection unit 42 and the diffraction image of the wafer 10 at that time are output and displayed on the image display device 46 and stored in the storage unit 45.
- the signal intensity (luminance value) of the diffraction image of a non-defective wafer shows the highest signal intensity (luminance value). For example, a change in signal intensity (luminance change) compared to a non-defective wafer is determined in advance. If it is larger than the threshold value (allowable value), it is determined as “abnormal”, and if it is smaller than the threshold value, it is determined as “normal”.
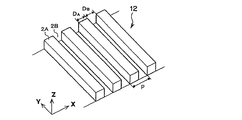
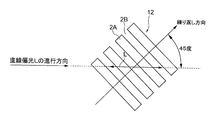
- the repeated pattern 12 is a resist pattern (line pattern) in which a plurality of line portions 2A are arranged at a constant pitch (interval) P along the short direction (X direction) as shown in FIG.
- a space 2B is provided between the adjacent line portions 2A.
- the arrangement direction (X direction) of the line portions 2A will be referred to as a “repetitive direction of the repetitive pattern 12”.
- the PER inspection performs an abnormality inspection of the repetitive pattern 12 by using a change in the volume ratio between the line portion 2A and the space portion 2B in the repetitive pattern 12 as described above.
- the ideal volume ratio (design value) is 1: 1.
- the change in the volume ratio appears due to deviation from the appropriate value of the exposure focus.
- the volume ratio can also be referred to as the area ratio of the cross-sectional shape.
- the illumination side polarizing filter 26 and the light receiving side polarizing filter 32 are inserted on the optical path.
- the stage 5 tilts the wafer 10 to an inclination angle at which the regular reflection light from the wafer 10 irradiated with the illumination light can be received by the light receiving system 30. Further, the stage 5 stops at a predetermined rotational position, and the repeating direction of the repeated pattern 12 on the wafer 10 is changed with respect to the vibration direction of the illumination light (linearly polarized light L) on the surface of the wafer 10 as shown in FIG. , Support at an angle of 45 degrees. This is for making the light quantity of the inspection of the repeated pattern 12 the highest. If the angle is 22.5 degrees or 67.5 degrees, the inspection sensitivity is increased. In addition, an angle is not restricted to these, It can set to an arbitrary angle direction.
- the illumination-side polarizing filter 26 is disposed between the light guide fiber 24 and the illumination-side concave mirror 25, and its transmission axis (vibration direction of the polarized electric field that can pass through the filter) is set to a predetermined direction. Accordingly, linearly polarized light is extracted from the light from the illumination unit 21.
- the illumination-side concave mirror 25 converts the light transmitted through the illumination-side polarizing filter 26 into a parallel light beam and is a wafer as a substrate. Illuminate 10.
- the light emitted from the light guide fiber 24 becomes p-polarized linearly polarized light L (see FIG. 6) via the illumination-side polarizing filter 26 and the illumination-side concave mirror 25, and is applied to the entire surface of the wafer 10 as illumination light. Irradiated.
- the traveling direction of the linearly polarized light L (the direction of the principal ray of the linearly polarized light L reaching an arbitrary point on the surface of the wafer 10) is substantially parallel to the optical axis, the linearly polarized light at each point of the wafer 10 The incident angles of L are the same because of the parallel light flux. Further, since the linearly polarized light L incident on the wafer 10 is p-polarized light, as shown in FIG. 6, the repeating direction of the repeated pattern 12 is the incident surface of the linearly polarized light L (the traveling direction of the linearly polarized light L on the surface of the wafer 10).
- the angle formed by the vibration direction of the linearly polarized light L on the surface of the wafer 10 and the repeating direction of the repeating pattern 12 is also set to 45 degrees.
- the linearly polarized light L changes into the repeated pattern 12 so as to cross the repeated pattern 12 diagonally with the vibration direction of the linearly polarized light L on the surface of the wafer 10 inclined by 45 degrees with respect to the repeated direction of the repeated pattern 12. It will be incident.
- the specularly reflected light reflected from the surface of the wafer 10 is collected by the light receiving side concave mirror 31 of the light receiving system 30 and reaches the image pickup surface of the image pickup device 35, but when reflected by the repeat pattern 12, the structure of the repeat pattern 12.
- the polarization state of the linearly polarized light L changes due to the characteristic birefringence.
- the light receiving side polarizing filter 32 is disposed between the light receiving side concave mirror 31 and the imaging device 35.
- the direction of the transmission axis of the light-receiving side polarizing filter 32 is set to be orthogonal to the transmission axis of the illumination-side polarizing filter 26 described above (crossed Nicol state).
- the light receiving side polarizing filter 32 allows the polarized light component (for example, the s-polarized light component) whose vibration direction is substantially perpendicular to the linearly polarized light L of the regular reflected light from the wafer 10 (repeated pattern 12) to pass through, and to capture the image pickup device. 35.
- a reflected image of the wafer 10 is formed on the imaging surface of the imaging device 35 with a polarized light component whose vibration direction is substantially perpendicular to the linearly polarized light L of the regular reflected light from the wafer 10.
- the light receiving side polarizing filter 32 can be rotated about the optical axis, and the sensitivity is improved by adjusting the minor axis direction of the elliptically polarized regular reflected light and the transmission axis of the light receiving side polarizing filter 32. Can be made. Also in this case, the adjustment angle is several degrees, which is a substantially orthogonal category.
- the illumination side polarization filter 26 and the light reception side polarization filter 32 are inserted in the optical path, and the conveyance apparatus (not shown)
- the wafer 10 is transferred onto the stage 5.
- the positional information of the pattern formed on the surface of the wafer 10 is acquired by an alignment mechanism (not shown) during the transfer, and the wafer 10 is placed at a predetermined position on the stage 5 in a predetermined direction. Can do.
- the stage 5 tilts the wafer 10 at an inclination angle at which the regular reflection light from the wafer 10 irradiated with the illumination light can be received by the light receiving system 30.
- the stage 5 stops at a predetermined rotational position, and the repeating direction of the repeating pattern 12 on the wafer 10 is inclined by 45 degrees with respect to the vibration direction of the illumination light (linearly polarized light L) on the surface of the wafer 10. To support.
- the illumination system 20 irradiates the surface of the wafer 10 with illumination light.
- the illumination light is irradiated on the surface of the wafer 10 under such conditions, the light emitted from the light guide fiber 24 of the illumination unit 21 is p-polarized linearly polarized light via the illumination side polarization filter 26 and the illumination side concave mirror 25. L, and the entire surface of the wafer 10 is irradiated as illumination light.
- the specularly reflected light reflected from the surface of the wafer 10 is collected by the light-receiving-side concave mirror 31 and reaches the image pickup surface of the image pickup device 35 to form an image (reflected image) of the wafer 10.
- the polarization state of the linearly polarized light L changes due to the structural birefringence in the repeating pattern 12, and the light receiving side polarizing filter 32 causes the linearly polarized light L and the vibration direction of the regular reflected light from the wafer 10 (repeating pattern 12).
- a reflected image of the wafer 10 is formed on the imaging surface of the imaging device 35 with a polarized light component that is substantially perpendicular to the linearly polarized light L of the regular reflected light from the wafer 10.
- the imaging device 35 photoelectrically converts an image (reflection image) of the surface of the wafer 10 formed on the imaging surface to generate an image signal (digital image data), and the image signal is passed through the main control unit 50.
- the image processing unit 40 generates a digital image of the wafer 10 (hereinafter, the digital image of the wafer 10 based on polarization is referred to as a “polarized image” for convenience) based on the image signal of the wafer 10 input from the imaging device 35. Generate. Further, when generating the polarization image of the wafer 10, the image processing unit 40 sends the polarization image to the inspection unit 42 via the main control unit 50.
- the inspection unit 42 compares the polarization image data of the wafer 10 with the non-defective wafer image data stored in advance in the storage unit 45, and inspects whether there is a defect (abnormality) on the surface of the wafer 10.
- the inspection results from the image processing unit 40 and the inspection unit 42 and the polarization image of the wafer 10 at that time are output and displayed on the image display device 46 and stored in the storage unit 45. Since the signal intensity (luminance value) of the reflected image of the non-defective wafer is considered to indicate the highest signal intensity (luminance value), for example, a change in signal intensity (luminance change) compared to the non-defective wafer is determined in advance. If it is larger than the threshold value (allowable value), it is determined as “abnormal”, and if it is smaller than the threshold value, it is determined as “normal”.
- the signal intensity is a signal intensity corresponding to light detected by the imaging element of the imaging device 35, such as a reflection efficiency, an intensity ratio, and an energy ratio.
- regular reflection inspection it is also possible to perform inspection based on specularly reflected light from the surface of the wafer 10 (hereinafter referred to as “regular reflection inspection” for convenience).
- regular reflection inspection the image processing unit 40 generates a digital image based on regular reflection light from the surface of the wafer 10 (hereinafter referred to as “regular reflection image” for convenience), and based on the regular reflection image. Then, the surface of the wafer 10 is inspected for defects (abnormalities).
- the inspection unit 42 uses a wafer image that has been exposed and developed under conditions in which the focus offset amount of the exposure apparatus 101 is changed for each shot, and uses a focus curve (focus offset amount and diffracted light of the exposure apparatus 101).
- a curve indicating the relationship between signal strengths) can be obtained.
- the image plane of the mask pattern projected and exposed by the exposure apparatus 101 is obtained.
- the inclination can be obtained. In the case of diffracted light, if the line-and-space duty ratio is set to 10 or more for a line of 1, the focus offset amount that maximizes the signal intensity becomes the best focus.
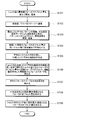
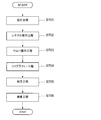
- a method for obtaining the inclination of the image plane of the mask pattern projected and exposed by the exposure apparatus 101 will be described with reference to the flowchart shown in FIG.
- a wafer on which a repeated pattern is formed by changing the focus offset amount (known) of the exposure apparatus 101 is created (step S101).
- step S101 a wafer on which a repeated pattern is formed by changing the focus offset amount (known) of the exposure apparatus 101 is created.
- exposure is performed by setting shots with the same focus offset amount (shots with the same number in FIG. 8) at different positions on the wafer, develop.
- a conditional wafer 10a such a wafer is referred to as a conditional wafer 10a.
- shots with the same focus offset amount are set at different positions on the wafer, for example, because of differences in resist conditions that occur between the center side and the outer periphery side of the wafer, so-called left / right differences during scan exposure, etc. This is done to offset the impact.
- a resist film (photoresist) formed on a wafer is applied by spin coating. In this case, as the resist stock solution spreads due to spin, the solvent component volatilizes and the viscosity increases and the film tends to be thick, and a difference in resist conditions occurs between the central side and the outer peripheral side of the wafer.
- the so-called left / right difference means that, for example, when the scanning direction is the X direction, the reticle moves in the X + direction (wafer moves in the X ⁇ direction) and the reticle moves in the X ⁇ direction ( This is the difference in exposure while the wafer is moving in the X + direction.
- the condition-waving wafer 10a swings the focus offset amount in 16 steps from ⁇ 175 nm to +200 nm in increments of 25 nm.
- Each shot in FIG. 8 indicates the number of steps (1 to 16) of the focus offset amount that is shaken in increments of 25 nm. If the scan direction is reverse with the same focus offset amount, “′” is displayed. It is attached. For example, exposure with the same focus offset amount as in the shot of the focus offset amount indicated by number 12 is performed with one shot on the reticle movement X + direction / center side, one shot on the reticle movement X + direction / outer side, and reticle movement X.
- Four positions can be set, such as one shot in the-direction / center side and one shot in the reticle movement X-direction / outer periphery side. Further, for example, exposure with the same focus offset amount as in the shot of the focus offset amount indicated by the number 15, the reticle movement X + direction / outer peripheral side two shots, reticle movement, with the center of the conditioned wafer 10a as the symmetry point Four positions can be set like 2 shots in the X-direction / outer peripheral side.
- the focus offset amount is 16 steps, and each of the focus offset amounts is a total of 64 shots, for a total of 64 shots, which are set at different positions (disposed separately) to create the conditionally adjusted wafer 10a. is doing.
- a plurality of conditioned wafers may be made to obtain the focus curve.
- the shot arrangement for each focus offset amount of each conditionally adjusted wafer is set so as to cancel the influence of conditions other than the focus offset amount.
- the conditioned wafer 10a is transferred onto the stage 5 in the same manner as in the above-described diffraction inspection (step S102).
- the illumination system 20 irradiates illumination light onto the surface of the conditional wafer 10a, and the imaging device 35 photoelectrically converts the diffraction image of the conditional wafer 10a to generate an image signal.
- the image signal is output to the image processing unit 40 (step S103).
- the diffraction conditions are obtained by using the information of the exposed mask pattern or the diffraction condition search, and the same setting as in the diffraction inspection is performed so that diffracted light is obtained.
- the tilt angle of the stage 5 is changed stepwise in an angle range other than specular reflection, images are acquired at the respective tilt angles, and the tilt angle at which the image becomes bright, that is, the diffracted light is obtained is obtained. Refers to the function.
- the image processing unit 40 generates a diffracted image of the conditionally adjusted wafer 10a based on the image signal of the conditionally adjusted wafer 10a input from the imaging device 35, and performs a pixel unit for each shot with the same focus offset amount (respectively).
- the signal intensities are averaged between the corresponding pixels of the shots (step S104). Note that a portion determined to be a defect by the diffraction inspection is excluded from the above-described averaging target.
- the image processing unit 40 has a plurality of setting areas A (small rectangles) set in the shot as shown in FIG.
- the average value of the signal intensity in the enclosed area (hereinafter referred to as “average luminance” for convenience) is obtained (step S105).
- the average luminance is obtained for each of the plurality of setting areas A provided in the exposure shot when the focus offset is changed in 16 steps from -175 nm to +200 nm in increments of 25 nm.
- the image processing unit 40 sends the averaged data to the inspection unit 42 via the main control unit 50.
- the inspection unit 42 corresponds to the average brightness in the setting area A at the same position in each shot (with different focus offset amounts).
- a graph showing the relationship with the focus offset amount to be obtained, that is, a focus curve is obtained (step S106).
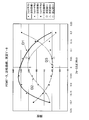
- the inspection unit 42 obtains approximate curves of the focus curve, respectively (step S107). Note that it is preferable to use a quartic equation as the approximate curve equation.
- the focus curve obtained here is referred to as a “reference focus curve”.
- the inspection unit 42 obtains a focus offset amount at which the average luminance is maximum in the approximate curve of the focus curve (that is, the maximum focus offset amount is in the range of ⁇ 175 nm to +200 nm) (step S108).
- the focus offset amount at which the average luminance is maximized is 2.5 nm.
- the focus offset amount at which the average luminance is maximized is ⁇ 14.5 nm.
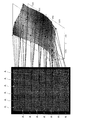
- a focus offset amount that maximizes the average luminance is obtained for each setting area A (step S109). In this way, as shown in FIG. 12, it is possible to obtain the distribution of the focus offset amount that maximizes the average brightness of the diffracted light in the shot.
- the focus offset amount gradient in the long side direction of the slit (light) exposed by the exposure apparatus 101 (that is, the distribution of the focus offset amount in which the average luminance of the diffracted light is maximized in the shot is obtained in this way (that is, (The amount of inclination of the image plane) and the inclination of the focus offset amount in the scanning direction with respect to the reticle stage and wafer stage of the exposure apparatus 101 are obtained (approximately).
- the inclination of the image plane is a relative positional relationship between the image forming points. Therefore, the inclination of the image plane can be obtained by obtaining the maximum value of the average luminance.
- the image plane inclination obtained in this way is converted into a parameter acceptable to the exposure apparatus 101, such as the curvature of field, maximum / minimum value, or diagonal inclination, and then output from the main controller 50 as a signal output.
- the data is output to the exposure apparatus 101 via the unit 60 and reflected in the exposure by the exposure apparatus 101.
- the image plane inclination in the present embodiment is the total image plane with respect to the photoresist layer on the wafer due to the image plane inclination of the projection image by the projection lens in the exposure apparatus 101 and the running error of the reticle stage and wafer stage. It is a slope.
- the inspection unit 42 also has a measurement function.
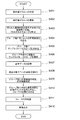
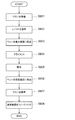
- the inspection unit 42 obtains the focus state at the time of exposure by the exposure apparatus 101, more specifically, the fluctuation state of the focus of the exposure apparatus 101 with respect to the entire surface of the wafer 10, from the diffraction image of the wafer 10 to be inspected. Be able to. Therefore, a first embodiment of a method for obtaining the focus state during exposure by the exposure apparatus 101 will be described with reference to the flowchart shown in FIG.
- a conditioned wafer 10b (a so-called FEM wafer) is formed in which a pattern is repeatedly formed by changing the focus offset amount and the dose amount (exposure amount) of the exposure apparatus 101 in a matrix (step S201).
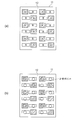
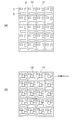
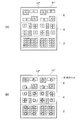
- the repeated pattern formed at this time is the same pattern as the repeated pattern 12 of the wafer 10 to be inspected. That is, as shown in FIG. 4A, a first pattern area A composed of one type or a plurality of types of repetitive patterns, and a second pattern area B having a repetitive pattern configuration different from the first pattern area A.
- a repetitive pattern composed of The conditionally adjusted wafer 10b is created by, for example, setting the exposure shot at the center of the conditionally adjusted wafer 10b as the best focus and best dose, changing the focus offset amount for each exposure shot arranged in the horizontal direction, and for each exposure shot arranged in the vertical direction. The exposure is carried out while changing the dose to develop.
- a diffraction image of the conditionally adjusted wafer 10b is captured and acquired (step S202).
- the conditioned wafer 10b is first transferred onto the stage 5 as in the case of the above-described diffraction inspection. Then, the illumination system 20 irradiates the surface of the conditioned wafer 10b with illumination light, and the imaging device 35 photoelectrically converts the diffraction image of the conditioned wafer 10b to generate an image signal, and outputs the image signal to the image processing unit 40. To do.
- the image processing unit 40 generates a diffraction image of the conditioned wafer 10b based on the image signal of the conditioned wafer 10b input from the imaging device 35. At this time, the diffraction images of the conditionally adjusted wafer 10b are captured and acquired for a plurality of conditions determined by a combination of the azimuth angle, illumination wavelength, incident angle, and emission angle of the wafer, that is, for a plurality of diffraction conditions.
- the repetitive pattern of the conditioned wafer 10b has a base layer or base unevenness
- use of illumination light with a short wavelength for example, 248 nm, 313 nm, etc.
- a short wavelength for example, 248 nm, 313 nm, etc.
- the illumination side polarizing filter 26 with the transmission axis set in a predetermined direction is inserted on the optical path so that s-polarized light can be obtained as illumination light, it can be made less susceptible to the influence of the ground.
- the light-receiving side polarizing filter 32 having the transmission axis set in a predetermined direction so as to receive only diffracted light by s-polarized light is inserted on the optical path, it is possible to make it less susceptible to the influence of the ground.
- the image processing unit 40 captures the diffraction signals of the first pattern region A in the repetitive pattern from the plurality of diffraction images captured and acquired under a plurality of diffraction conditions. And those obtained by capturing the diffraction signal of the second pattern region B (step S203). Since the position information of the first and second pattern areas A and B is known as design values in advance, the position information of the first and second pattern areas A and B and the position where the diffraction signal intensity is obtained in the diffraction image A plurality of diffraction images can be classified by comparing with information.
- a group of diffraction images capturing the diffraction signals of the first pattern region A is referred to as a first image group G A
- a group of diffraction images capturing the diffraction signals of the second pattern region B is referred to as a second image group GB.
- Step S203 When classifying diffraction image in each image group in step S203, the image processing unit 40, in each of the first image group G A and the second image group G B, determined for each diffraction image, the signal strength of each shot, respectively ( Step S204). At this time, an average value of signal intensities in shots having the same focus offset amount and dose amount is obtained, and the average value is set as the signal intensity of each shot. Thereby, the influence of the inclination of the image plane can be removed.
- the image processing unit 40 sends the average value of the signal intensity of each shot to the inspection unit 42 via the main control unit 50.
- sample focus curves of a plurality of diffraction conditions can be obtained for each of the first and second image groups G A and G B for each different dose amount.
- approximate curves of the sample focus curve are obtained. Note that it is preferable to use a quartic equation as the approximate curve equation.
- the inspection unit 42 in each of the first image group G A and the second image group G B, at least 2 to be used from a sample focus curve of a plurality of diffraction conditions, to determine the focus state at the time of exposure
- a type of sample focus curve is selected (step S206). That is, for example, three types of reference samples focus curve in the first image group G A, three types of reference samples focus curve in the second image group G B, selecting and determining a total of six types of reference samples focus curve.
- a sample focus curve that is sensitive to a change in the focus offset amount (high focus sensitivity) is extracted from a plurality of sample focus curves.
- a sample focus curve with low sensitivity to change in dose amount (low dose sensitivity) and less influence of background change is extracted.
- at least two types (for example, three types) of sample focus curves having different peak and bottom positions (focus offset amounts) from among sample focus curves having high focus sensitivity and low influence of dose sensitivity and background change. is selected and determined as the reference sample focus curve.
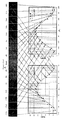
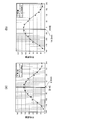
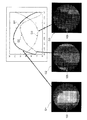
- FIG. 14 shows a diffraction image G1 from which a first reference sample focus curve D1 is obtained, a diffraction image G2 from which a second reference sample focus curve D2 is obtained, and a third reference sample focus, along with three types of reference sample focus curves D1 to D3.
- the diffraction images G3 from which the curve D3 is obtained are respectively shown. Note that each of the diffraction images G1 to G3 shown in FIG.
- each diffraction image is a diffraction image of the conditioned wafer 10b obtained by imaging while changing the diffraction conditions. Further, the pattern pitch, the illumination wavelength, and the like are the same, and each diffraction image may be captured and acquired by changing only the order of the diffracted light.
- step S206 Selecting determining the reference sample focus curve in step S206, the image processing unit 40, the first image group G A and the second image group G reference data data for Expression approximate curve of the reference sample focus curve determined in each B Is output to the storage unit 45 and stored (step S207).
- the image processing unit 40 outputs a data map indicating the relationship between the focus offset amount obtained from the approximate curve equation and the signal intensity to the storage unit 45 as reference data, not limited to the approximate curve equation of the reference sample focus curve. However, it may be stored.
- a diffraction image of the wafer 10 to be inspected is captured and acquired (step S208).
- each of the same diffraction conditions as the diffraction image reference sample focus curve selected in the first image group G A is obtained, it obtains captured diffraction image of the wafer 10.
- each of the same diffraction conditions as the diffraction image reference sample focus curve selected in the second image group G B is obtained, it obtains captured diffraction image of the wafer 10.
- the six types of reference sample focus curves are obtained.
- the diffraction image of the wafer 10 is captured and acquired under the same six types of diffraction conditions as the diffraction image.
- the diffraction image of the wafer 10 to be inspected when acquiring imaging at step S208 the image processing unit 40, first and second image group G A, for each group in G B, from the signal strength of each pixel of the diffractive image, It is determined whether or not the area corresponding to each pixel is a measurement area in the shot, and pixels corresponding to streets and the like are excluded from the measurement target. Then, the image processing unit 40 obtains an average value of the signal intensity of a predetermined number of pixels for each diffraction image, and obtains the average value as the signal intensity of each shot (step S209).
- the image processing unit 40 sends information on the average value of these signal intensities to the inspection unit 42 via the main control unit 50.
- the inspection unit 42 determines the focus fluctuation state of the exposure apparatus 101 with respect to the surface of the wafer 10 from the diffraction image of the wafer 10 to be inspected (hereinafter referred to as focus). (Also referred to as a state) is obtained (step S210).
- the exposure apparatus for the surface of the wafer 10 from the signal intensity of the diffraction image of the wafer 10 A focus offset amount 101 is obtained for each predetermined pixel (in units of one or more pixels). From the first pattern area A, the focus state of the measurement point in the area A shown in FIG. 4 is obtained, and from the second pattern area B, the focus state of the measurement point in the area B shown in FIG.
- the storage unit 45 stores approximate curve formulas (or data maps) of the reference sample focus curve respectively corresponding to the three types of diffraction conditions. Therefore, the focus offset amount can be obtained for each predetermined pixel from the signal intensity of the diffraction image of the wafer 10 captured and acquired under the same conditions. Since the focus curve is a curve, a plurality of candidates for the focus offset amount (one depending on conditions) are calculated from the signal intensity of one diffraction image. On the other hand, by using three types of reference sample focus curves D1 to D3 having different peak or bottom positions (focus offset amounts), one calculated focus offset amount is obtained as shown in FIG. It is decided.
- the focus offset amount that minimizes the sum of squares of the difference between the signal intensity under each diffraction condition and the approximate curve corresponding to this condition is obtained.
- three types of reference sample focus curves D1 to D3 may be prepared for each different dose amount, and the focus offset amount at the dose amount that minimizes the sum of squared differences may be employed.
- the signal intensity may be weighted (contribution increased) under the condition that the slope of the curve is relatively large (that is, the sensitivity to the focus change is relatively high).
- the result may not be adopted as an abnormal value.
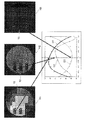
- the diffraction image H1 and the second reference sample focus curve D2 of the wafer 10 imaged under the diffraction conditions for obtaining the first reference sample focus curve D1 are obtained together with the three types of reference sample focus curves D1 to D3.
- a diffraction image H2 of the wafer 10 imaged under the diffraction condition and a diffraction image H3 of the wafer 10 imaged under the diffraction condition for obtaining the third reference sample focus curve D3 are shown.
- the degree of coincidence with one reference data (first reference sample focus curve D1), the second detection signal (second signal intensity K2) corresponding to the diffracted light from the repetitive pattern 12 under the second diffraction condition, and corresponding to this diffraction condition The degree of coincidence with the second reference data (second reference sample focus curve D2) to be performed, the third detection signal (third signal intensity K3) corresponding to the diffracted light from the repetitive pattern 12 under the third diffraction condition, and this It can be seen that the degree of coincidence with the third reference data (third reference sample focus curve D3) corresponding to the diffraction condition is high.
- step S210 the first and second image group G A, when determining the focus state of the fluctuation of the exposure apparatus 101 for each group in G B, the focus of an exposure apparatus 101 at all measurement points of the repeat pattern 12 integrates these Is obtained (step S211). At this time, there may be a minute gain or offset amount difference in the focus state between the focus state of the first pattern region A and the focus state of the second pattern region B. May adjust these minute differences, for example, to smooth the focus state of all the measurement points shown in FIG. 4B.
- step S211 when the focus offset amount is obtained for every predetermined pixel at all measurement points (the entire surface of the wafer 10) of the repetitive pattern 12, the inspection unit 42 inspects whether or not the obtained focus offset amount is abnormal. (Step S212). At this time, for example, if the obtained focus offset amount is within a predetermined threshold range, the inspection unit 42 determines that the normal state is normal, and if the obtained focus offset amount is out of the predetermined threshold range, an abnormality occurs. Is determined.
- the image processing unit 40 When the presence / absence of the focus offset amount is inspected in step S212, the image processing unit 40 generates an image of the wafer 10 obtained by converting the obtained focus offset amount into the signal intensity at the pixel, and the focus offset amount inspection result. And the like are displayed on the image display device 46 (step S213). Further, the image of the wafer 10 and the inspection result are stored in the storage unit 45.
- the image display device 46 is not limited to the one provided in the surface inspection device 1, and an image display device 46 provided and connected to the outside of the inspection device (for example, a management room of a semiconductor production line) may be used. .
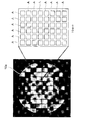
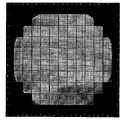
- an example of an image of the wafer 10 obtained by converting the focus offset amount into the signal intensity is shown in FIG. Note that the image shown in FIG. 17 is not limited to a black and white image, and may be displayed as a color image.
- step S206 for example, when selecting a total of six types of reference sample focus curves in the first and second image groups G A and G B , one of the diffraction conditions of the first pattern region A and the second pattern region One of the diffraction conditions of B may happen to coincide.
- step S208 the diffraction image of the wafer 10 may be captured and acquired under the five types of diffraction conditions including the matched diffraction conditions.
- the measurement area is determined and the signal intensity is measured. Find the fluctuation state. Then, the variation state of the focus of the exposure apparatus 101 obtained for each group is integrated to obtain the variation state of the focus of the exposure apparatus 101 at all measurement points (the entire surface of the wafer 10) of the repetitive pattern 12. As a result, even if the wafer 10 of the logic device has a small area of the pattern formed on the wafer 10 and a large number of regions having different pattern configurations, the wafer 10 exposed with the mask pattern used for actual exposure is used. The focus state at the time of exposure can be obtained based on the image.
- reference sample focus curves D1 to D3 Three types of reference data (reference sample focus curves D1 to D3) that are sensitive to changes in focus and less sensitive to changes in dose (exposure amount) are used, and the sensitivity (detection signal) to changes in focus Change) is greater than the sensitivity to the change in dose (change in detection signal). Therefore, it is possible to eliminate the influence due to the change in the dose amount, and it is possible to measure the focus state at the time of exposure more accurately.
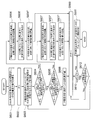
- a second embodiment of a method for obtaining a focus state during exposure by the exposure apparatus 101 will be described with reference to a flowchart shown in FIG.
- a plurality of diffraction conditions necessary for measuring the focus state are obtained (obtained) in each of the first and second pattern areas A and B.
- the first and second patterns In each of the regions A and B, a plurality of diffraction conditions necessary for measurement, that is, a plurality of diffraction conditions having high focus sensitivity, low dose sensitivity, small influence of background change, and different peak or bottom positions are obtained. May not be possible.
- the pattern density of the first and second pattern areas A and B may be sparse, or may be configured by repeating one kind of simple pattern. In some cases, a plurality of diffraction conditions necessary for measuring the focus state cannot be obtained.
- a method for obtaining a focus state at the time of exposure in this case will be described. It is assumed that the arrangement configuration of the repeated pattern is the same as that of FIG. 4 used in the description of the first embodiment, and the same FIG. 4 is referred to.
- steps S301 to S305 in the second embodiment are the same as steps S201 to S205 in the first embodiment shown in FIG. That is, a conditioned wafer 10b (see FIG. 14) is created (step S301), and the conditioned wafer 10b is imaged under various diffraction conditions (step S302).
- the obtained plurality of diffraction images are classified into one that captures the diffraction signal of the first pattern region A and one that captures the diffraction signal of the second pattern region B (step S303).
- the signal strength for each diffraction image was measured, calculated shot average value (step S304), obtains the sample focus curve (step S305).
- the first image group G A 2 types, selecting and determining a total of three types of reference samples focus curve in the second image group G B.
- a sample focus curve with low sensitivity to change in dose amount (low dose sensitivity) and small influence of background change is extracted.
- the sample focus curve with a different peak or bottom position (focus offset amount) is selected and determined as a reference sample focus curve from among sample focus curves with high focus sensitivity, low dose sensitivity, and small influence of background changes. To do.
- step S306 Selecting determining the reference sample focus curve in step S306, the image processing unit 40, the first image group G A and the second image group G reference data data for Expression approximate curve of the reference sample focus curve determined in each B Is output to the storage unit 45 and stored (step S307).
- the image processing unit 40 outputs a data map indicating the relationship between the focus offset amount obtained from the approximate curve equation and the signal intensity to the storage unit 45 as reference data, not limited to the approximate curve equation of the reference sample focus curve. However, it may be stored.
- the reference data is obtained for each of the plurality of exposure apparatuses and for each illumination condition. It is preferable to store in the storage unit 45.
- a diffraction image of the wafer 10 to be inspected is captured and acquired (step S308).
- each of the same diffraction conditions as the diffraction image reference sample focus curve selected in the first image group G A is obtained, it obtains captured diffraction image of the wafer 10.
- each of the same diffraction conditions as the diffraction image reference sample focus curve selected in the second image group G B is obtained, it obtains captured diffraction image of the wafer 10.
- the three types of reference samples focus curve
- the diffraction image of the wafer 10 is captured and acquired under the same three types of diffraction conditions as the diffraction image from which is obtained.
- the image processing unit 40 calculates the signal intensity for each pixel of the diffraction image for each group in the first and second image groups G A and G B. It is determined whether or not the area corresponding to each pixel is a measurement area in the shot, and pixels corresponding to streets and the like are excluded from the measurement target. Then, the image processing unit 40 obtains the average value of the signal intensity at the measurement point for each diffraction image, and obtains the average value as the signal intensity at each measurement point (step S309).
- the image processing unit 40 obtains the signal intensity by interpolation at a measurement point at which the signal intensity cannot be obtained for each of all the diffraction conditions for obtaining the focus offset (where there is no pattern that generates diffracted light under the diffraction condition).
- Step S310 The diffraction image captured by the diffraction condition selected from the first image group G A, only the first pattern region A shown in FIG. 4 (a) have a bright image, other parts including the second pattern region B Is getting darker. For this reason, among the measurement points shown in FIG. 4B, the signal strength is obtained for those in the first pattern region A, but the signal strength is not obtained for those in the second pattern region B.
- the signal strength is obtained by interpolation from the signal strength at the measurement point in the first pattern region A around the measurement point.
- interpolation There are several generally known methods for interpolation, and any interpolation may be used.
- nearest neighbor interpolation is the simplest interpolation, and the value of the nearest point where a measured value exists is obtained as a point value.
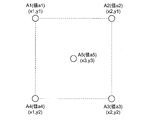
- Linear interpolation calculates the value of a point obtained by linear calculation from a plurality of surrounding points. An example of a calculation formula for this linear interpolation is shown in Formula 2.
- Formula 2 is an example of a calculation formula in the case where the four points A1 to A4 where measured values exist around the point A5 to be obtained are in the positional relationship of the four corners of the rectangle (see FIG. 19).
- interpolation can be performed by linear calculation.
- there are various methods such as cubic convolution interpolation.
- the interpolation accuracy can be improved by considering the image plane inclination of the entire shot.
- the image processing unit 40 sends the information on the average value of the signal strengths and the signal strength obtained by interpolation to the inspection unit 42 via the main control unit 50.
- the inspection unit 42 determines the focus fluctuation state (hereinafter also referred to as a focus state) of the exposure apparatus 101 with respect to the surface of the wafer 10 from the diffraction image (signal intensity) of the wafer 10 to be inspected and the signal intensity obtained by interpolation. Obtained (step S311).
- a focus offset amount of the exposure apparatus 101 with respect to the surface of the wafer 10 is obtained for each measurement point.
- the measurement point is not a plurality of pixels but one pixel, a focus offset is obtained for each pixel.
- step S311 when the focus offset amounts of all the measurement points of the repeated pattern 12 are obtained, the inspection unit 42 inspects whether or not the obtained focus offset amount is abnormal (step S312). At this time, for example, if the obtained focus offset amount is within a predetermined threshold range, the inspection unit 42 determines that the normal state is normal, and if the obtained focus offset amount is out of the predetermined threshold range, an abnormality occurs. Is determined.
- the image processing unit 40 converts the focus offset amount obtained for each measurement point into the signal intensity at each measurement point (see FIG. 17). ) And is displayed on the image display device 46 together with the inspection result of the focus offset amount (step S313). Further, the image of the wafer 10 and the inspection result are stored in the storage unit 45.
- step S310 when the value of the measurement point near the boundary of the shot is obtained, the value of the measurement point exceeding the shot is not used, and the interpolation is performed using only the data of the neighboring point in the shot.
- the former may be used when the fluctuation within the shot is the main, and the latter may be used when the fluctuation of the entire wafer surface is the main.
- the surface inspection apparatus 1 of the second embodiment in order to obtain the focus state by determining the measurement region and measuring the signal intensity for each group in the first and second image groups G A and G B.
- the signal strength of the missing part is obtained by interpolation.
- the fluctuation state of the focus of the exposure apparatus 101 at all measurement points (the entire surface of the wafer 10) of the repeated pattern 12 is obtained. It has become.
- the wafer 10 exposed with the mask pattern used for actual exposure is used.
- the focus state at the time of exposure can be obtained based on the image. Therefore, as in the case of using a dedicated mask (reticle), it does not require time for parameter setting necessary for measurement using the dedicated mask, that is, test exposure and line width measurement. The state can be measured in a short time.
- a pattern used for an actual device can be used instead of a dedicated mask pattern, and the illumination condition of the exposure apparatus 101 is not restricted, the focus state during exposure can be accurately measured. .
- FIG. FIG. 20 is a diagram showing an arrangement configuration different from the above embodiment of the pattern on the surface of the wafer 10.
- a plurality of 4 ⁇ 5 small chips (20 in total) are arranged in one shot.
- the repetitive pattern 12 ′ formed in the chip region 11 ′ is configured to have a third pattern region C, a fourth pattern region D, and a fifth pattern region E having different repetitive pattern configurations. .
- This wafer 10 is also a logic device wafer having a small pattern area formed on the surface and a plurality of regions having different pattern configurations.
- a plurality of diffraction conditions necessary for focus measurement cannot be selected individually, and one type is provided for each of the third to fifth pattern regions C to E, for a total of three. It is assumed that the pattern configuration allows focus measurement if different types of diffraction conditions are selected.
- FIG. 20B shows focus measurement points with circles.
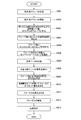
- steps S401 to S405 in the third embodiment are the same as steps S201 to S205 in the first embodiment shown in FIG. That is, a conditioned wafer 10b (see FIG. 14) is created (step S401), and the conditioned wafer 10b is imaged under various diffraction conditions (step S402).
- the obtained plurality of diffraction images are obtained by capturing a diffraction signal of the third pattern region C, capturing a diffraction signal of the fourth pattern region D, and capturing a diffraction signal of the fifth pattern region E. (Step S403).
- the signal intensity for each diffraction image was measured, calculated shot average value (step S404), obtains the sample focus curve ( Step S405).
- the inspection unit 42 uses at least one set (at least a third image) used to obtain a focus state at the time of exposure from a plurality of sample focus curves.
- one from a group G C, one from the fourth image group G D selects the reference sample focus curve one) from the fifth image group G E (step S406).
- one in the third image group G C, one in the fourth image group G D one selects determine the total 3 types of reference samples focus curve in the fifth image group G E.
- To select and determine the reference sample focus curve first extract a sample focus curve that is sensitive to changes in the focus offset amount (high focus sensitivity) from a plurality of sample focus curves, as in the above embodiment. To do.
- a sample focus curve that is less sensitive to changes in the dose amount (low dose sensitivity) and less affected by background changes is extracted.
- the sample focus curve with a different peak or bottom position (focus offset amount) is selected and determined as a reference sample focus curve from among sample focus curves with high focus sensitivity, low dose sensitivity, and small influence of background changes. To do.
- the image processing unit 40 stores, as reference data, data related to the approximate curve formula of the reference sample focus curve determined in each of the third image groups G C to G E. To be stored (step S407).
- the image processing unit 40 outputs a data map indicating the relationship between the focus offset amount obtained from the approximate curve equation and the signal intensity to the storage unit 45 as reference data, not limited to the approximate curve equation of the reference sample focus curve. However, it may be stored.
- the reference data is obtained for each of the plurality of exposure apparatuses and for each illumination condition. It is preferable to store in the storage unit 45.
- a diffraction image of the wafer 10 to be inspected is captured and acquired (step S408).
- a diffraction image of the wafer 10 is captured and acquired under each of the same diffraction conditions as those for obtaining the reference sample focus curve selected in the third to fifth image groups G C to G E.
- one in the third image group G C, one in the fourth image group G D, one of the reference sample focus curve in the fifth image group G E if you select a total of three types of reference samples focus curve Captures and acquires a diffraction image of the wafer 10 under the same three types of diffraction conditions as the diffraction image from which the three types of reference sample focus curves are obtained.
- the image processing unit 40 calculates the signal intensity for each pixel of the diffraction image for each group in the third to fifth image groups G C to G E. It is determined whether or not the area corresponding to each pixel is a measurement area in the shot, and pixels corresponding to streets and the like are excluded from the measurement target. Then, the image processing unit 40 obtains the average value of the signal intensity at the measurement point for each diffraction image, and obtains the average value as the signal intensity at each measurement point (step S409).
- the image processing unit 40 sends information on the average value of these signal intensities to the inspection unit 42 via the main control unit 50.
- the inspection unit 42 regards the signal intensities obtained for each group in the third to fifth image groups G C to G E as the signals of the measurement points indicated by circles in FIG. From this, a fluctuation state of focus of the exposure apparatus 101 with respect to the surface of the wafer 10 (hereinafter also referred to as a focus state) is obtained (step S410).
- the wafer 10 is obtained from the signal intensity obtained from the signal intensity of the diffraction image of the wafer 10.
- the amount of focus offset of the exposure apparatus 101 with respect to the surface is determined for each predetermined pixel (in units of a single pixel or a plurality of pixels).
- the positions of the third to fifth pattern areas C to E are different from each other, but the difference in the position is smaller than the pitch of the measurement point for obtaining the focus state. Can be considered.
- step S410 when the focus offset amount is obtained for all measurement points (the entire surface of the wafer 10) for obtaining the focus state of the repeated pattern 12, the inspection unit 42 inspects whether or not the obtained focus offset amount is abnormal ( Step S411). At this time, for example, if the obtained focus offset amount is within a predetermined threshold range, the inspection unit 42 determines that the normal state is normal, and if the obtained focus offset amount is out of the predetermined threshold range, an abnormality occurs. Is determined.
- the image processing unit 40 converts an image of the wafer 10 obtained by converting the focus offset amount obtained for each pixel into the signal intensity at the pixel (see FIG. 17). It is generated and displayed on the image display device 46 together with the inspection result of the focus offset amount (step S412). Further, the image of the wafer 10 and the inspection result are stored in the storage unit 45.
- step S410 regarding the signals of the third to fifth pattern regions C to E of each chip as signals of measurement points, in other words, measurement is performed by nearest neighbor interpolation in the above-described second embodiment.
- the signal strength of a point is obtained.
- the signal strength of the measurement point may be obtained from the third to fifth pattern regions C to E using linear interpolation, cubic convolution interpolation, or the like instead of nearest neighbor interpolation.
- the measurement area is determined and the signal intensity is measured for each group in the third to fifth image groups G C to G E , and the obtained signal intensity is focused. It is regarded as the signal of the measurement point for which the state is to be obtained. Then, from the signal intensities of the third to fifth image groups G C to G E regarded as the measurement point signals, the focus fluctuation state of the exposure apparatus 101 at all the measurement points of the repeated pattern 12 (the entire surface of the wafer 10) is determined. It comes to ask for.
- the wafer 10 of the logic device has a small area of the pattern formed on the wafer 10 and a large number of regions having different pattern configurations, the wafer 10 exposed with the mask pattern used for actual exposure is used.
- the focus state at the time of exposure can be obtained based on the image. Therefore, unlike the case where a dedicated mask (reticle) is used, it does not take time to set the parameters necessary for measurement using the dedicated mask, so that the focus state during exposure can be measured in a short time. Become.
- a pattern used for an actual device can be used instead of a dedicated mask pattern, and the illumination condition of the exposure apparatus 101 is not restricted, the focus state during exposure can be accurately measured. .
- FIG. 22 is a diagram showing an arrangement configuration different from the above embodiment of the pattern on the surface of the wafer 10.
- a plurality of chip regions 11 ′′ are arranged on the surface of the wafer 10, and a repeated pattern 12 ′′ is formed in the chip region 11 ′′.
- the repeated pattern 12 ′′ is a repeated pattern.
- the first pattern area A, the second pattern area B, the third pattern area C, the fourth pattern area D, the fifth pattern area E, and the sixth pattern area F are different from each other.
- This wafer 10 is also a logic device wafer having a small pattern area formed on the surface and a plurality of regions having different pattern configurations.
- each of the pattern areas C to E has a pattern configuration in which a plurality of diffraction conditions necessary for focus measurement cannot be selected alone.
- the sixth pattern region F has a memory pattern configuration.
- steps S501 to S505 in the fourth embodiment are the same as steps S201 to S205 in the first embodiment shown in FIG. That is, a conditioned wafer 10b (see FIG. 14) is created (step S501), and the conditioned wafer 10b is imaged under various diffraction conditions (step S502).
- the obtained plurality of diffraction images are classified into those obtained by capturing the diffraction signals of the respective regions in the first to sixth pattern regions A to F (step S503).
- the signal intensity is measured for each diffraction image, the shot average value is obtained (step S504), and the sample focus curve is obtained for each group (step S505).
- the inspection unit 42 shoots a shot in a shot partial region obtained by grouping measurement points that can be measured with the same measurement method and diffraction conditions for the measurement points in the shot. Divide (step S506).
- N measurement points in a shot (N is an integer) are set, and numbers from 1 to N are assigned (step S601).
- the measurement method is examined and determined for each measurement point.
- region (group) in which a diffraction signal exists in the position or its vicinity is extracted (step S603).
- the extracted pattern areas are checked in order, and it is checked whether there is a pattern area that can select a plurality of diffraction conditions necessary for measuring the P-th measurement point from one pattern area (step S604).
- step S606 the measurement method of the Pth measurement point, that is, measurement under a plurality of diffraction conditions selected from one pattern area, and the diffraction conditions are determined, and if necessary A calculation formula to be interpolated from the nearby diffraction signal is defined.
- step S604 if there is no one pattern region from which a plurality of diffraction conditions for measuring the focus state of the measurement point is obtained, a plurality of diffraction conditions necessary for measurement are obtained from the plurality of extracted pattern regions. It is checked whether there is a combination that can be selected (step S605).
- the measurement method of the Pth measurement point that is, measurement under a plurality of diffraction conditions selected from a plurality of pattern regions, and the diffraction conditions are determined, and if necessary, the vicinity A calculation formula to be interpolated from the diffraction signal is defined (step S607).
- the measurement point is defined as being unmeasurable (step S608).
- the number P for examining the measurement method is incremented by 1 (step S609), and when P exceeds N, the measurement method for all measurement points is determined including (unmeasurable). Since (Step S610), measurement points having the same measurement method and diffraction conditions are grouped (Step S611), and the division of the shot partial region is completed.
- the measurement time increases as the number of these diffraction conditions increases. Therefore, it is necessary to reduce the number of diffraction conditions necessary for measuring all measurement points as much as possible. Therefore, for example, as shown in FIG. 25, when the measurement direction and diffraction conditions of one measurement point are determined, it is checked whether there are other measurement points that can be measured with the same measurement method and diffraction conditions (steps S606 ′ and 606). It is effective that one diffraction condition is shared by as many measurement points as possible, such as "", 607 ', 607 ").
- the first shot partial area X having the first pattern area A and the second pattern area B is obtained.
- step S506 when the shot is divided into a plurality of shot partial areas, the plurality of sample focus curves obtained in step S505 are classified into those corresponding to the first to third shot partial areas X to Z (step S507). ). Then, for each shot partial area, a reference sample focus curve used for obtaining a focus state at the time of exposure is selected (step S508).
- a reference sample focus curve used for obtaining a focus state at the time of exposure is selected (step S508).
- a sample focus curve that is less sensitive to changes in the dose amount (low dose sensitivity) and less affected by background changes is extracted.
- the sample focus curve with a different peak or bottom position (focus offset amount) is selected and determined as a reference sample focus curve from among sample focus curves with high focus sensitivity, low dose sensitivity, and small influence of background changes.
- the image processing unit 40 When the reference sample focus curve is selected and determined for each shot partial area in step S508, the image processing unit 40 performs data relating to the approximate curve formula of the reference sample focus curve determined in each of the first to third shot partial areas X to Z. Is output to the storage unit 45 as reference data and stored (step S509).
- the image processing unit 40 outputs a data map indicating the relationship between the focus offset amount obtained from the approximate curve equation and the signal intensity to the storage unit 45 as reference data, not limited to the approximate curve equation of the reference sample focus curve. However, it may be stored.
- the reference data is obtained for each of the plurality of exposure apparatuses and for each illumination condition. It is preferable to store in the storage unit 45.
- step S509 when the reference data regarding the reference sample focus curve is stored in the storage unit 45, a diffraction image of the wafer 10 to be inspected is captured and acquired (step S510). At this time, a diffraction image of the wafer 10 is captured and acquired under each of the same diffraction conditions as those for obtaining the reference sample focus curve selected in the first to third shot partial regions X to Z.
- step S510 when the diffraction image of the wafer 10 to be inspected is captured and acquired, the image processing unit 40 calculates the signal intensity for each pixel of the diffraction image for each region in the first to third shot partial regions X to Z. It is determined whether or not the area corresponding to each pixel is a measurement area in the shot, and pixels corresponding to streets and the like are excluded from the measurement target. Then, the image processing unit 40 obtains an average value of the signal intensity at each measurement point for each diffraction image, obtains the average value as the signal intensity at each measurement point (step S511), and interpolates the signal intensity as necessary. (Step S512).
- the image processing unit 40 sends information on the average value of these signal intensities to the inspection unit 42 via the main control unit 50.
- the inspection unit 42 determines the focus fluctuation state (focus state) of the exposure apparatus 101 with respect to the surface of the wafer 10 from the diffraction image of the wafer 10 to be inspected for each of the first to third shot partial regions X to Z. Obtained (step S513).
- the wafer 10 is obtained from the signal intensity obtained from the signal intensity of the diffraction image of the wafer 10.
- the amount of focus offset of the exposure apparatus 101 with respect to the surface is determined for each measurement point.
- step S513 when the fluctuation state of the focus of the exposure apparatus 101 is obtained for each of the first to third shot partial areas X to Z, these are integrated and the focus of the exposure apparatus 101 at all measurement points of the repetitive pattern 12 ′′. Is obtained (step S514).
- step S514 when the focus offset amount is obtained for all measurement points (the entire surface of the wafer 10) for obtaining the focus state of the repeated pattern 12, the inspection unit 42 inspects whether or not the obtained focus offset amount is abnormal ( Step S515). At this time, for example, if the obtained focus offset amount is within a predetermined threshold range, the inspection unit 42 determines that the normal state is normal, and if the obtained focus offset amount is out of the predetermined threshold range, an abnormality occurs. Is determined.
- the image processing unit 40 converts the image of the wafer 10 obtained by converting the focus offset amount obtained for each pixel into the signal intensity at the pixel (see FIG. 17). It is generated and displayed on the image display device 46 together with the inspection result of the focus offset amount (step S516). Further, the image of the wafer 10 and the inspection result are stored in the storage unit 45.
- step S506 when a shot is divided into a plurality of shot partial areas in step S506, if there is a shot partial area where focus measurement cannot be performed due to the pattern condition, that part is set as a shot non-measurable partial area. Do not measure.
- the same measurement method and diffraction conditions are used based on the sample focus curves obtained for the respective pattern regions in the first to sixth image groups G A to G F.
- a shot is divided into shot partial areas obtained by grouping measurable measurement points.
- the variation state of the focus of the exposure apparatus 101 obtained for each shot partial area is integrated to obtain the variation state of the focus of the exposure apparatus 101 at all measurement points (the entire surface of the wafer 10) of the repetitive pattern 12 ′′.
- the focus state at the time of exposure can be obtained based on the image of the wafer 10. Therefore, as in the case where a dedicated mask (reticle) is used, it takes time to determine the parameters necessary for measurement using the dedicated mask. Therefore, the focus state during exposure can be measured in a short time. Rather than the mask pattern of use, it can be used pattern used for actual device, also, since the illumination conditions of the exposure apparatus 101 is also not limited, so the focus state at the time of exposure can be measured accurately.
- a fifth embodiment of a method for obtaining the focus state during exposure by the exposure apparatus 101 will be described with reference to the flowchart shown in FIG.
- a method for obtaining a focus state at the time of exposure when a plurality of diffraction conditions necessary for measurement of the focus state cannot be obtained in each of the first and second pattern regions A and B will be described.
- the arrangement of the repeated patterns is assumed to be the same as that in FIG. 4 used in the description of the first embodiment, and the same FIG. 4 will be referred to.
- steps S901 to S905 of the fifth embodiment are the same as steps S201 to S205 of the first embodiment shown in FIG. That is, a conditioned wafer 10b (see FIG. 14) is created (step S901), and the conditioned wafer 10b is imaged under various diffraction conditions (step S902).
- the obtained plurality of diffraction images are classified into one that captures the diffraction signal of the first pattern region A and one that captures the diffraction signal of the second pattern region B (step S903).
- the signal strength for each diffraction image was measured, calculated shot average value (step S904), obtains the sample focus curve (step S905).
- the first image group G A 2 types, selecting and determining a total of three types of reference samples focus curve in the second image group G B.
- a sample focus curve with low sensitivity to change in dose amount (low dose sensitivity) and small influence of background change is extracted.
- the sample focus curve with a different peak or bottom position (focus offset amount) is selected and determined as a reference sample focus curve from among sample focus curves with high focus sensitivity, low dose sensitivity, and small influence of background changes. To do.
- step S906 Selecting determining the reference sample focus curve in step S906, the image processing unit 40, the first image group G A and the second image group G reference data data for Expression approximate curve of the reference sample focus curve determined in each B Is output to the storage unit 45 and stored (step S907).
- the image processing unit 40 outputs a data map indicating the relationship between the focus offset amount obtained from the approximate curve equation and the signal intensity to the storage unit 45 as reference data, not limited to the approximate curve equation of the reference sample focus curve. However, it may be stored.
- the reference data is obtained for each of the plurality of exposure apparatuses and for each illumination condition. It is preferable to store in the storage unit 45.
- a diffraction image of the wafer 10 to be inspected is captured and acquired (step S908).
- each of the same diffraction conditions as the diffraction image reference sample focus curve selected in the first image group G A is obtained, it obtains captured diffraction image of the wafer 10.
- each of the same diffraction conditions as the diffraction image reference sample focus curve selected in the second image group G B is obtained, it obtains captured diffraction image of the wafer 10.
- the three types of reference samples focus curve
- the diffraction image of the wafer 10 is captured and acquired under the same three types of diffraction conditions as the diffraction image from which is obtained.
- the image processing unit 40 calculates the signal intensity for each pixel of the diffraction image for each group in the first and second image groups G A and G B. It is determined whether or not the area corresponding to each pixel is a measurement area in the shot, and pixels corresponding to streets and the like are excluded from the measurement target. Then, the image processing unit 40 obtains the average value of the signal intensity at the measurement point for each diffraction image, and obtains the average value as the signal intensity of each measurement point (step S909).
- the image processing unit 40 can not uniquely determine the focus offset.
- the focus offset amount candidates are about 0.05 and about ⁇ 0.14. As such, the focus offset cannot be uniquely determined.
- the image processing unit 40 obtains a portion (high correlation point) that is highly correlated with the measurement point without being affected by the dose fluctuation or the background, and determines the focus offset using the measurement point and the high correlation point (Ste S910).
- a high correlation point is obtained from a range of 1/8 of the shot in the slit longitudinal direction and 1/16 of the shot in the scan direction.
- a high correlation point is obtained from a range of 1/8 of the shot for both X and Y.
- Three reference sample focus curves were prepared by adding a reference sample focus curve (for example, one type) at a certain point within the above range to a reference sample focus curve (for example, two types) at the measurement point. To do. Similar to the first embodiment, the focus offset amount that minimizes the sum of squares of differences from the signal intensity is obtained using these three types of reference sample focus curves. Here, by searching for several points within the above range, the point where the minimum value of the sum of squared differences is the smallest is searched. In this way, a high correlation point can be obtained by searching for a point where the minimum value of the sum of squared differences obtained in the above procedure is the smallest within the above range.
- the image processing unit 40 uses not only the reference sample focus curve of the measurement point but also the reference sample focus curve at the high correlation point having a high correlation with the measurement point, so that the exposure apparatus 101 for the surface of the wafer 10 A focus offset amount is obtained for each measurement point (step S911).
- the measurement point is not a plurality of pixels but one pixel, a focus offset is obtained for each pixel.
- step S911 when the focus offset amounts of all measurement points of the repeated pattern 12 are obtained, the inspection unit 42 inspects whether or not the obtained focus offset amount is abnormal (step S912). At this time, for example, if the obtained focus offset amount is within a predetermined threshold range, the inspection unit 42 determines that the normal state is normal, and if the obtained focus offset amount is out of the predetermined threshold range, an abnormality occurs. Is determined.
- the image processing unit 40 converts the focus offset amount obtained for each measurement point into a signal intensity at each measurement point (see FIG. 17). ) And is displayed on the image display device 46 together with the inspection result of the focus offset amount (step S913).
- the image of the wafer 10 and the obtained focus offset amount / inspection result are stored in the storage unit 45.
- the determination of the measurement region the first and second image group G A, for each group in G B measures the signal strength.
- three types of reference sample focus curves are prepared by taking into account the reference sample focus curve at the high correlation point having a high correlation with the measurement point. It was decided.
- the wafer 10 of the logic device has a small area of the pattern formed on the wafer 10 and a large number of regions having different pattern configurations, the wafer 10 exposed with the mask pattern used for actual exposure is used. The focus state at the time of exposure can be obtained based on the image.
- a dedicated mask reticle
- it does not require time for parameter setting necessary for measurement using the dedicated mask, that is, test exposure and line width measurement.
- the state can be measured in a short time.
- a pattern used for an actual device can be used instead of a dedicated mask pattern, and the illumination condition of the exposure apparatus 101 is not restricted, the focus state during exposure can be accurately measured. .
- three types of reference data are used to measure the focus state (processing conditions) at the time of exposure for the repetitive pattern 12 on the wafer 10.
- the present invention is not limited to this.
- two kinds of reference data or five kinds of reference data may be used, and at least two kinds of reference data having different detection signal change methods with respect to a focus change are used.
- the focus state at the time of exposure may be measured.
- the inspection of the repeated pattern 12 exposed and formed on the resist film on the wafer 10 is performed.
- the present invention is not limited to this, and the pattern after etching may be inspected. Good. Thereby, not only the focus state at the time of exposure but also a defect (abnormality) at the time of etching can be detected.
- the polarization image (PER image) of the conditioned wafer 10b is used for each different dose amount in the same manner as described above.
- a plurality of sample focus curves based on the polarization determined by the azimuth angle and the illumination wavelength may be obtained, and a plurality of reference sample focus curves based on the polarization may be selected and determined from these.
- the reference sample focus curve (reference data) based on the polarization the fluctuation state of the focus of the exposure apparatus 101 with respect to the surface of the wafer 10 is obtained from the signal intensity of the polarization image captured and acquired by the imaging apparatus 35.
- the focus state at the time of exposure can be measured with higher accuracy.
- the focus offset amount at which the signal intensity is maximized in the focus curve is considered as the best focus, it is possible to easily know the focus offset amount that is the best focus.
- the diffraction image and the polarization image may be used in combination such that the first detection signal is a diffraction image and the second detection signal is a polarization image.
- the repetitive pattern 12 on the wafer 10 is used by using three types of reference data (reference sample focus curves D1 to D3) that are sensitive to a change in focus and less sensitive to a change in dose.
- the focus state during exposure is measured, but by extracting multiple sample focus curves from multiple sample focus curves that are sensitive to changes in dose and less sensitive to changes in focus,
- the dose amount at the time of exposure of the repetitive pattern 12 on the wafer 10 can also be measured using the sample dose curve obtained by replacing the focus of the sample focus curve with the dose.
- the diffraction or polarization signal intensity often monotonously decreases or monotonously increases as the dose increases.
- multiple sample focus curves are used for measurement. There may be one kind. This is because when the sample dose curve is monotonously decreasing or monotonically increasing, the dose amount can be uniquely determined from the signal intensity during measurement.
- the focus fluctuation state (focus offset amount) of the exposure apparatus 101 with respect to the surface of the wafer 10 obtained by the inspection unit 42 is exposed from the main control unit 50 via the signal output unit 60 to the exposure apparatus 101. Can be fed back to the setting of the exposure apparatus 101.
- An exposure system provided with the above-described surface inspection apparatus 1 will be described with reference to FIG.
- the exposure system 100 includes an exposure apparatus 101 that projects and exposes a predetermined mask pattern (repeated pattern) on the surface of a wafer 10 coated with a resist, an exposure process by the exposure apparatus 101, and a development process by a developing apparatus (not shown). And the like, and a surface inspection apparatus 1 for inspecting the wafer 10 having the repeated pattern 12 formed on the surface.
- the exposure apparatus 101 includes an illumination system 110, a reticle stage 120, a projection unit 130, a local liquid immersion apparatus 140, a stage apparatus 150, and a main controller (not shown). Configured.
- the directions of arrows X, Y, and Z shown in FIG. 27 will be described as an X-axis direction, a Y-axis direction, and a Z-axis direction, respectively.
- the illumination system 110 includes a light source, an illuminance equalizing optical system including an optical integrator, and an illumination optical system including a reticle blind.
- the reticle is defined by the reticle blind.
- the slit-shaped illumination area on R is illuminated with illumination light (exposure light) with substantially uniform illuminance.
- illumination light for example, ArF excimer laser light (wavelength 193 nm) is used.
- a reticle (photomask) R having a predetermined pattern (for example, a line pattern) formed on its pattern surface (the lower surface in FIG. 27) is fixedly held by, for example, vacuum suction.
- the reticle stage 120 can be moved in the XY plane by a reticle stage driving device including a linear motor, for example, and can be moved at a predetermined scanning speed in the scanning direction (here, the Y-axis direction). .
- Position information of the reticle stage 120 in the XY plane (including rotation information about the rotation direction around the Z axis) is reflected on the first reflecting mirror 123 having a reflecting surface orthogonal to the Y axis provided on the reticle stage 120 and the X axis.
- Detection is performed by the reticle interferometer 125 via a second reflecting mirror (not shown) having an orthogonal reflecting surface.
- the position information detected by the reticle interferometer 125 is sent to the main controller, and the main controller controls the position (and moving speed) of the reticle stage 120 via the reticle stage driving device based on the position information. .
- the projection unit 130 is disposed below the reticle stage 120 and includes a lens barrel 131 and a projection optical system 135 held in the lens barrel 131.
- the projection optical system 135 has a plurality of optical elements (lens elements) arranged along the optical axis AX of illumination light, is telecentric on both sides, and has a predetermined projection magnification (for example, 1/4 times, 1/5 times or 1/8 times, etc.). For this reason, when the illumination area on the reticle R is illuminated by the illumination light emitted from the illumination system 110, the illumination light transmitted through the reticle R arranged so that the object plane and the pattern plane of the projection optical system 135 substantially coincide with each other.
- a reduced image of the pattern of the reticle R in the illumination area via the projection optical system 135 is conjugated to the exposure area on the wafer 10 arranged on the image plane side of the projection optical system 135 (the illumination area on the reticle R).
- a region The reticle R is moved in the scanning direction (Y-axis direction) with respect to the illumination area by the synchronous driving of the reticle stage 120 and the stage apparatus 150 that holds the wafer 10, and the wafer 10 is moved in the scanning direction with respect to the exposure area.
- scanning exposure of one shot area on the wafer 10 is performed, and the pattern (mask pattern) of the reticle R is transferred to the shot area.
- the stage apparatus 150 includes a wafer stage 151 disposed below the projection unit 130 and a stage driving device (not shown) that drives the wafer stage 151.
- the wafer stage 151 is configured to hold the wafer 10 on the upper surface by vacuum suction.
- the wafer stage 151 is movable in the XY plane along the upper surface of the base member 105 by a motor constituting a stage driving device.
- the position information of the wafer stage 151 in the XY plane is detected by an encoder device (not shown).
- the position information detected by this encoder device is sent to the main control device, and the main control device controls the position (and moving speed) of the wafer stage 151 via the stage driving device based on the position information.
- the object plane and the pattern plane of the projection optical system 135 are substantially aligned.
- the reduced image of the pattern of the reticle R in the illumination area is supported on the wafer stage 151 and arranged on the image plane side of the projection optical system 135 through the projection optical system 135 by the illumination light transmitted through the reticle R. Is formed in an exposed region on the wafer 10 (region conjugate to the illumination region on the reticle R).
- the reticle R is moved in the scanning direction (Y-axis direction) with respect to the illumination area, and the wafer 10 is moved in the scanning direction with respect to the exposure area.
- scanning exposure of one shot area on the wafer 10 is performed, and the pattern of the reticle R is transferred to the shot area.
- the pattern 12 is repeatedly formed on the surface by the surface inspection apparatus 1 according to the above-described embodiment after the development process by the development apparatus (not shown).
- the surface of the wafer 10 is inspected.
- the inspection unit 42 of the surface inspection apparatus 1 obtains the fluctuation state of the focus of the exposure apparatus 101 with respect to the surface of the wafer 10 as described above, and the signal output unit 60 and the connection cable (see FIG.
- the information about the obtained focus fluctuation state (focus offset amount) is output to the exposure apparatus 101 via a not-shown).
- the correction processing unit 210 provided in the main controller 200 of the exposure apparatus 101 focuses the exposure apparatus 101 on the surface of the wafer 10 based on the focus fluctuation state of the exposure apparatus 101 input from the surface inspection apparatus 1.
- Various setting parameters related to the focus of the exposure apparatus 101 and the optical elements so that the state is constant the dose amount that corresponds to a predetermined energy amount when the image surface of the pattern exposed by the exposure apparatus coincides with the resist surface. Correct the placement status.
- the exposure setting is corrected in order to correct the focus setting of the exposure apparatus 101 according to the focus state at the time of exposure input from the surface inspection apparatus 1 according to the above-described embodiment. Since the focus state at the time can be accurately measured in a short time, correction based on the focus state with higher accuracy can be performed, and the focus of the exposure apparatus 101 can be set more appropriately.
- a semiconductor device includes a design process (step S701) for performing functional / performance design of the device, a reticle manufacturing process (step S702) for manufacturing a reticle based on the design process, and a wafer for manufacturing a wafer from a silicon material.
- Manufacturing process step S703
- lithography pattern including exposure process, development process, etc.
- lithography process step S704
- reticle pattern is transferred to wafer by exposure, etc.
- device assembly dicing process, bonding process, packaging process, etc.
- step S705 the device inspection process
- a wafer is prepared (step S801), and a resist is applied to the wafer surface to have a predetermined thickness using a coating apparatus such as a spin coater (not shown) (step S802).
- a coating apparatus such as a spin coater (not shown)
- the solvent component of the resist is evaporated and hardened by the drying device in the coating device on the wafer that has been coated.
- the wafer on which the resist has been applied and hardened is transferred to the exposure apparatus 101 by a transfer device (not shown) (step S803).
- the wafer carried into the exposure apparatus 101 is aligned by the alignment apparatus provided in the exposure apparatus 101 (step S804).
- the reticle pattern is subjected to reduced exposure on the aligned wafer (step S805).
- the exposed wafer is transferred from the exposure apparatus 101 to a developing device (not shown) and developed (step S806).
- the developed wafer is set by the surface inspection apparatus 1, the focus state of the exposure apparatus 101 is obtained as described above, and the pattern produced on the wafer is inspected by performing diffraction inspection / polarization inspection (S807).
- a wafer in which a defect (abnormality) occurs more than a reference predetermined in the inspection is sent to rework (regeneration processing), and a wafer whose defect (abnormality) is less than the reference is subjected to post-processing such as etching.
- the focus state of the exposure apparatus 101 obtained in step S807 is fed back to the exposure apparatus 101 for correction of focus setting (step S808). Exposure to the next substrate is performed by the exposure apparatus in which the fed back focus state is constant.
- pattern exposure is performed using the exposure system 100 according to the above-described embodiment in a lithography process. That is, as described above, when the exposure process by the exposure apparatus 101 is performed, the wafer 10 on which the repeated pattern 12 is formed on the surface by the surface inspection apparatus 1 after the development process by the developing apparatus (not shown) and the like. Perform surface inspection. At this time, the focus state at the time of exposure is measured by the surface inspection apparatus 1, and the exposure apparatus 101 corrects the focus setting of the exposure apparatus 101 according to the focus state at the time of exposure input from the surface inspection apparatus 1. . As described above, according to the semiconductor device manufacturing method of the present embodiment, the focus state at the time of exposure can be accurately measured in a short time, so that the focus of the exposure apparatus 101 can be set more appropriately. Highly integrated semiconductor devices can be manufactured with high productivity.
- the present invention is not limited to this. It is also possible to measure the state. For example, if the imaging magnification is increased and a single shot is captured as a single image, it is possible to measure a change in focus state for each smaller area in units of shots.
- the apparatus configuration is basically the same as that of the above-described embodiment (surface inspection apparatus 1).
- the optical magnification of the optical system is increased so that each shot in the wafer plane can be imaged.
- a mechanism such as an XY stage for changing the relative position of the system may be added.
- Such a detailed measurement of the focus state for each region can also be performed using a microscope apparatus.
- 30 is configured by adding a polarizer 205 and an analyzer 206 to a microscope optical system having a half mirror 201, a first objective lens 202, a second objective lens 203, and an image sensor 204, and the pattern on the wafer 10 is linear.
- It is a schematic block diagram of the microscope apparatus 200 provided with the optical system which irradiates with a polarized illumination light and detects the change of the polarization state by the structural birefringence in a pattern.
- this microscope apparatus 200 it is possible to two-dimensionally detect a change in the polarization state in the pattern in the microscope field of view, and by repeating imaging by changing the relative positional relationship between the optical system and the wafer 10, It is possible to detect a change in the polarization state in the pattern densely or ancestorly on the entire surface of the wafer 10.
- images are acquired under a plurality of optical conditions such as wafer azimuth angle, illumination wavelength, polarizer angle, and analyzer angle, and a plurality of focus curves are acquired. By doing so, it is possible to measure the focus state. Further, the focus state of the pattern on the logic wafer can be measured by performing signal interpolation similar to that in the above-described embodiment.
- FIG. 31 shows a microscope apparatus 200 in which a polarizer 205 and an analyzer 206 are removed from the optical path, and a wafer tilt mechanism capable of tilting (tilting) the surface of the wafer 10 with respect to the optical axis of illumination light is added.
- 1 is a schematic configuration diagram of a microscope apparatus 200 ′ configured and capable of detecting diffracted light from a pattern on a wafer 10.
- FIG. 1 the diffraction conditions such as the wafer azimuth angle, the illumination wavelength, the illumination angle (incident angle), the emission angle, and the diffraction order are changed by tilting the wafer 10 by the wafer tilt mechanism, as in the above-described embodiment.
- the focus state can be measured by acquiring an image under a plurality of diffraction conditions and acquiring a plurality of focus curves. Further, the focus state of the pattern on the logic wafer can be measured by performing signal interpolation similar to that in the above-described embodiment. Further, although not shown, the optical state for detecting the change in the polarization state shown in FIG. 30 and the diffractive optical system for detecting the diffracted light shown in FIG. 31 are combined to measure the focus state using both optical conditions. You may comprise as follows.
- m is the diffraction order
- ⁇ is the wavelength of the illumination light
- the tilt angle ⁇ is positive in the clockwise direction. From this equation, diffracted light corresponding to the tilt angle and pattern pitch can be detected. Therefore, the microscope apparatus 200 ′ can acquire images under a plurality of diffraction conditions by tilting the wafer 10.
- the microscope apparatus 200 ′ is a telecentric optical system in which the incident angle of the illumination light is the same at each point on the wafer and the diffracted light having the same emission angle from each point on the wafer is received by the image sensor. Preferably it is. Note that the requirements of the above-described embodiments can be combined as appropriate. Some components may not be used. In addition, as long as it is permitted by law, the disclosures of all published publications and US patents related to the inspection devices and the like cited in the above embodiments and modifications are incorporated herein by reference.
Landscapes
- Physics & Mathematics (AREA)
- General Physics & Mathematics (AREA)
- Health & Medical Sciences (AREA)
- Engineering & Computer Science (AREA)
- Environmental & Geological Engineering (AREA)
- Epidemiology (AREA)
- Public Health (AREA)
- Investigating Materials By The Use Of Optical Means Adapted For Particular Applications (AREA)
- Testing Or Measuring Of Semiconductors Or The Like (AREA)
- Exposure And Positioning Against Photoresist Photosensitive Materials (AREA)
- Exposure Of Semiconductors, Excluding Electron Or Ion Beam Exposure (AREA)
- Length Measuring Devices By Optical Means (AREA)
Abstract
Description


なお、上述の各実施形態の要件は、適宜組み合わせることができる。また、一部の構成要素を用いない場合もある。また、法令で許容される限りにおいて、上述の各実施形態及び変形例で引用した検査装置などに関する全ての公開公報及び米国特許の開示を援用して本文の記載の一部とする。
10 ウェハ(10a,10b 条件振りウェハ)
20 照明系(照明部)
30 受光系(検出部)
35 撮像装置(検出部)
40 画像処理部
42 検査部(測定部)
45 記憶部
50 主制御部
100 露光システム
101 露光装置
200、200′ 顕微鏡装置
Claims (21)
- 露光により形成されたパターンを表面に有する基板を照明光で照明する照明部と、
前記パターンによって変調された照明光を検出して検出信号を出力する検出部と、
所望の部分の前記パターンの露光条件を、該パターンの複数の部分で検出された検出信号を用いて測定する測定部とを備える測定装置。 - 前記測定部は、前記所望の部分のパターンの露光条件を、前記所望の部分を含む複数の部分で検出された検出信号を用いて測定する請求項1に記載の測定装置。
- 前記測定部は、前記所望の部分の周囲の部分で検出された検出信号から、前記所望の部分のパターンの露光条件を測定する請求項1または2に記載の測定装置。
- 前記測定部は、前記所望の部分で検出された検出信号と、該所望の部分以外の部分で検出された検出信号から求められた該所望の部分に対応する信号とから、該所望の部分のパターンの露光条件を測定する請求項1~3のいずれかに記載の測定装置。
- 前記測定部は、前記所望の部分の周囲の部分で検出された信号から、前記所望の部分に対応する検出信号を補間により求める請求項3または4に記載の測定装置。
- 前記測定部は、前記所望の部分のパターンの露光条件を、前記所望の部分と、前記所望の部分の周囲の部分であって、前記所望の部分と相関のある部分で検出された検出信号を用いて測定する請求項4に記載の測定装置。
- 前記変調された照明光を検出する検出条件が、前記部分ごとに設定される請求項1~6のいずれかに記載の測定装置。
- 前記検出部は、前記パターンによる回折または偏光に基づく変調を検出する請求項1~7のいずれかに記載の測定装置。
- 複数の露光条件で形成されたパターンで検出される検出信号を予め記憶した記憶部をさらに有し、
前記測定部は、前記記憶部に記憶された検出信号と前記検出部で検出された検出信号を比較して前記表面上の所望の部分のパターンの露光条件を測定する請求項1~8のいずれかに記載の測定装置。 - 前記測定部で測定される前記露光条件は、前記露光におけるフォーカス状態と露光量のうちの少なくとも一方である請求項1~9のいずれかに記載の測定装置。
- 露光により形成されたパターンを表面に有する基板を照明光で照明し、
前記パターンによって変調された照明光を検出して検出信号を出力し、
所望の部分の前記パターンの露光条件を、該パターンの複数の部分で検出された検出信号を用いて測定する測定方法。 - 前記所望の部分のパターンの露光条件を、前記所望の部分を含む複数の部分で検出された検出信号を用いて測定する請求項11に記載の測定方法。
- 前記所望の部分のパターンの露光条件を、前記所望の部分で検出された検出信号と、該所望の部分以外の部分で検出された検出信号から求められた該所望の部分に対応する信号とから測定する請求項11または12に記載の測定方法。
- 前記所望の部分の周囲の部分領域で検出された検出信号から前記所望の部分に対応する信号を求め、前記所望の部分のパターンの露光条件を測定する請求項11~13のいずれかに記載の測定方法。
- 前記所望の部分の周囲の部分で検出された信号から、前記所望の部分に対応する検出信号を補間により求める請求項13または14に記載の測定方法。
- 前記所望の部分のパターンの露光条件を、前記所望の部分で検出された検出信号と、該所望の部分以外の部分であって、前記所望部分と相関のある部分で検出された検出信号から求められた該所望の部分に対応する信号とから測定する請求項13に記載の測定方法。
- 前記変調された照明光を検出する検出条件が、前記部分ごとに設定される請求項11~16のいずれかに記載の測定方法。
- 前記検出は、前記パターンによる回折または偏光の基づく変調を検出する請求項11~17のいずれかに記載の測定方法。
- 複数の露光条件で形成されたパターンで検出される検出信号を予め記憶し、
前記記憶された検出信号と前記検出された検出信号を比較して前記表面上の所望の部分のパターンの露光条件を測定する請求項11~18のいずれかに記載の測定方法。 - 前記測定される前記露光条件は、前記露光におけるフォーカス状態と露光量のうちの少なくとも一方である請求項11~19のいずれかに記載の測定方法。
- 基板の表面にパターンを露光するリソグラフィー工程を有した半導体デバイス製造方法であって、
前記露光の後に、請求項11~20のいずれかに記載の測定方法を用いて、前記パターンが設けられた基板に対する前記露光時の露光条件を測定し、
該測定された露光条件に基づいて露光条件を修正し、
修正された露光条件で基板の表面にパターンを露光する半導体デバイス製造方法。
Priority Applications (3)
| Application Number | Priority Date | Filing Date | Title |
|---|---|---|---|
| KR1020147017999A KR20140104468A (ko) | 2011-11-29 | 2012-11-29 | 측정 장치, 측정 방법 및 반도체 디바이스 제조 방법 |
| US14/361,219 US20140315330A1 (en) | 2011-11-29 | 2012-11-29 | Measurement device, measurement method, and method for manufacturing semiconductor device |
| CN201280054130.2A CN103918059A (zh) | 2011-11-29 | 2012-11-29 | 测定装置、测定方法、及半导体元件制造方法 |
Applications Claiming Priority (2)
| Application Number | Priority Date | Filing Date | Title |
|---|---|---|---|
| JP2011-260929 | 2011-11-29 | ||
| JP2011260929 | 2011-11-29 |
Publications (1)
| Publication Number | Publication Date |
|---|---|
| WO2013081072A1 true WO2013081072A1 (ja) | 2013-06-06 |
Family
ID=48535520
Family Applications (1)
| Application Number | Title | Priority Date | Filing Date |
|---|---|---|---|
| PCT/JP2012/080984 Ceased WO2013081072A1 (ja) | 2011-11-29 | 2012-11-29 | 測定装置、測定方法および半導体デバイス製造方法 |
Country Status (6)
| Country | Link |
|---|---|
| US (1) | US20140315330A1 (ja) |
| JP (1) | JPWO2013081072A1 (ja) |
| KR (1) | KR20140104468A (ja) |
| CN (1) | CN103918059A (ja) |
| TW (1) | TW201329651A (ja) |
| WO (1) | WO2013081072A1 (ja) |
Families Citing this family (15)
| Publication number | Priority date | Publication date | Assignee | Title |
|---|---|---|---|---|
| JP5944850B2 (ja) | 2013-03-11 | 2016-07-05 | 株式会社日立ハイテクノロジーズ | 欠陥検査方法及びこれを用いた装置 |
| JP6299111B2 (ja) * | 2013-08-28 | 2018-03-28 | オムロン株式会社 | レーザ加工装置 |
| US9575412B2 (en) * | 2014-03-31 | 2017-02-21 | Taiwan Semiconductor Manufacturing Company, Ltd. | Method and system for reducing pole imbalance by adjusting exposure intensity |
| US9841689B1 (en) * | 2014-08-22 | 2017-12-12 | Kla-Tencor Corporation | Approach for model calibration used for focus and dose measurement |
| US20170004617A1 (en) * | 2015-06-30 | 2017-01-05 | Hon Hai Precision Industry Co., Ltd | Electronic device and mehod for capturing multi-aspect images using the electronic device |
| US11217009B2 (en) | 2015-11-30 | 2022-01-04 | Photopotech LLC | Methods for collecting and processing image information to produce digital assets |
| US10778877B2 (en) * | 2015-11-30 | 2020-09-15 | Photopotech LLC | Image-capture device |
| CN107782731B (zh) * | 2016-08-31 | 2021-08-03 | 西门子能源有限公司 | 用于维护零部件表面受损的机械设备的方法 |
| JP6945367B2 (ja) * | 2017-07-05 | 2021-10-06 | 東京エレクトロン株式会社 | 基板反り監視装置及びこれを用いた基板処理装置、並びに基板反り監視方法 |
| KR102220759B1 (ko) | 2017-07-18 | 2021-02-26 | 주식회사 히타치하이테크 | 결함 검사 장치 및 패턴 칩 |
| WO2019110211A1 (en) * | 2017-12-04 | 2019-06-13 | Asml Netherlands B.V. | Measurement method, patterning device and device manufacturing method |
| JP7202828B2 (ja) * | 2018-09-26 | 2023-01-12 | 東京エレクトロン株式会社 | 基板検査方法、基板検査装置および記録媒体 |
| EP3657257A1 (en) * | 2018-11-26 | 2020-05-27 | ASML Netherlands B.V. | Method for of measuring a focus parameter relating to a structure formed using a lithographic process |
| JP7229138B2 (ja) * | 2019-09-27 | 2023-02-27 | Hoya株式会社 | パターン検査方法、フォトマスクの検査装置、フォトマスクの製造方法、および表示装置の製造方法 |
| US12590900B2 (en) * | 2021-12-15 | 2026-03-31 | Samsung Electronics Co., Ltd. | Wafer inspection apparatus using three-dimensional image and method of inspecting wafer using the same |
Citations (4)
| Publication number | Priority date | Publication date | Assignee | Title |
|---|---|---|---|---|
| JP2006135211A (ja) * | 2004-11-09 | 2006-05-25 | Nikon Corp | 表面検査装置および表面検査方法および露光システム |
| JP2008294094A (ja) * | 2007-05-23 | 2008-12-04 | Renesas Technology Corp | 半導体集積回路装置の製造方法 |
| JP2011040433A (ja) * | 2009-08-06 | 2011-02-24 | Nikon Corp | 表面検査装置 |
| JP2011040434A (ja) * | 2009-08-06 | 2011-02-24 | Nikon Corp | 検査装置 |
Family Cites Families (7)
| Publication number | Priority date | Publication date | Assignee | Title |
|---|---|---|---|---|
| US5830611A (en) * | 1992-03-05 | 1998-11-03 | Bishop; Kenneth P. | Use of diffracted light from latent images in photoresist for optimizing image contrast |
| US6646735B2 (en) * | 2000-09-13 | 2003-11-11 | Nikon Corporation | Surface inspection apparatus and surface inspection method |
| JP4529366B2 (ja) * | 2003-03-26 | 2010-08-25 | 株式会社ニコン | 欠陥検査装置、欠陥検査方法及びホールパターンの検査方法 |
| KR101248674B1 (ko) * | 2004-06-16 | 2013-03-28 | 가부시키가이샤 니콘 | 표면 검사 장치 및 표면 검사 방법 |
| JP4692892B2 (ja) * | 2006-06-01 | 2011-06-01 | 株式会社ニコン | 表面検査装置 |
| KR20110000573A (ko) * | 2008-04-09 | 2011-01-03 | 가부시키가이샤 니콘 | 표면 검사 방법 및 표면 검사 장치 |
| TW201115624A (en) * | 2009-07-01 | 2011-05-01 | Nikon Corp | Exposure condition setting method and surface inspection apparatus |
-
2012
- 2012-11-29 JP JP2013547221A patent/JPWO2013081072A1/ja active Pending
- 2012-11-29 TW TW101144925A patent/TW201329651A/zh unknown
- 2012-11-29 KR KR1020147017999A patent/KR20140104468A/ko not_active Withdrawn
- 2012-11-29 CN CN201280054130.2A patent/CN103918059A/zh active Pending
- 2012-11-29 WO PCT/JP2012/080984 patent/WO2013081072A1/ja not_active Ceased
- 2012-11-29 US US14/361,219 patent/US20140315330A1/en not_active Abandoned
Patent Citations (4)
| Publication number | Priority date | Publication date | Assignee | Title |
|---|---|---|---|---|
| JP2006135211A (ja) * | 2004-11-09 | 2006-05-25 | Nikon Corp | 表面検査装置および表面検査方法および露光システム |
| JP2008294094A (ja) * | 2007-05-23 | 2008-12-04 | Renesas Technology Corp | 半導体集積回路装置の製造方法 |
| JP2011040433A (ja) * | 2009-08-06 | 2011-02-24 | Nikon Corp | 表面検査装置 |
| JP2011040434A (ja) * | 2009-08-06 | 2011-02-24 | Nikon Corp | 検査装置 |
Also Published As
| Publication number | Publication date |
|---|---|
| KR20140104468A (ko) | 2014-08-28 |
| CN103918059A (zh) | 2014-07-09 |
| JPWO2013081072A1 (ja) | 2015-04-27 |
| TW201329651A (zh) | 2013-07-16 |
| US20140315330A1 (en) | 2014-10-23 |
Similar Documents
| Publication | Publication Date | Title |
|---|---|---|
| JP5867412B2 (ja) | 表面検査装置及びその方法 | |
| JPWO2013081072A1 (ja) | 測定装置、測定方法および半導体デバイス製造方法 | |
| JP5765345B2 (ja) | 検査装置、検査方法、露光方法、および半導体デバイスの製造方法 | |
| KR101261047B1 (ko) | 표면 검사장치, 표면 검사방법 및 노광 시스템 | |
| CN102884609B (zh) | 检查装置及检查方法 | |
| JP2014174052A (ja) | 欠陥検査方法及びこれを用いた装置 | |
| KR101994524B1 (ko) | 포커싱 장치, 포커싱 방법 및 패턴 검사 방법 | |
| JP2015064569A (ja) | 撮像装置、検査装置および検査方法 | |
| KR20180045817A (ko) | 편광 이미지 취득 장치, 패턴 검사 장치, 편광 이미지 취득 방법 및 패턴 검사 방법 | |
| JPWO2014104194A1 (ja) | 検査装置、検査方法、露光システム及び露光方法、並びにデバイス製造方法 | |
| JP5434353B2 (ja) | 表面検査装置および表面検査方法 | |
| JP5434352B2 (ja) | 表面検査装置および表面検査方法 | |
| TWI575228B (zh) | 影像感測器、感測方法及微影裝置 | |
| WO2013108868A1 (ja) | 光学装置、収差測定方法および半導体デバイスの製造方法 | |
| JP2005337912A (ja) | 位置計測装置、露光装置、及びデバイスの製造方法 | |
| JP2006269669A (ja) | 計測装置及び計測方法、露光装置並びにデバイス製造方法 | |
| JP6633892B2 (ja) | 偏光イメージ取得装置、パターン検査装置、及び偏光イメージ取得方法 | |
| JP6893842B2 (ja) | パターン検査方法およびパターン検査装置 | |
| JP2000114158A (ja) | 露光条件測定方法及びそれを用いた露光装置 | |
| JP2006250839A (ja) | 表面検査装置 |
Legal Events
| Date | Code | Title | Description |
|---|---|---|---|
| 121 | Ep: the epo has been informed by wipo that ep was designated in this application |
Ref document number: 12854151 Country of ref document: EP Kind code of ref document: A1 |
|
| ENP | Entry into the national phase |
Ref document number: 2013547221 Country of ref document: JP Kind code of ref document: A |
|
| WWE | Wipo information: entry into national phase |
Ref document number: 14361219 Country of ref document: US |
|
| NENP | Non-entry into the national phase |
Ref country code: DE |
|
| ENP | Entry into the national phase |
Ref document number: 20147017999 Country of ref document: KR Kind code of ref document: A |
|
| 122 | Ep: pct application non-entry in european phase |
Ref document number: 12854151 Country of ref document: EP Kind code of ref document: A1 |