WO2012160839A1 - 線形系係数推定方法、集積回路、及び電子機器 - Google Patents
線形系係数推定方法、集積回路、及び電子機器 Download PDFInfo
- Publication number
- WO2012160839A1 WO2012160839A1 PCT/JP2012/050918 JP2012050918W WO2012160839A1 WO 2012160839 A1 WO2012160839 A1 WO 2012160839A1 JP 2012050918 W JP2012050918 W JP 2012050918W WO 2012160839 A1 WO2012160839 A1 WO 2012160839A1
- Authority
- WO
- WIPO (PCT)
- Prior art keywords
- target coefficients
- dimensional vectors
- order
- parallel
- driving
- Prior art date
- Legal status (The legal status is an assumption and is not a legal conclusion. Google has not performed a legal analysis and makes no representation as to the accuracy of the status listed.)
- Ceased
Links
Images










Classifications
-
- G—PHYSICS
- G06—COMPUTING OR CALCULATING; COUNTING
- G06F—ELECTRIC DIGITAL DATA PROCESSING
- G06F3/00—Input arrangements for transferring data to be processed into a form capable of being handled by the computer; Output arrangements for transferring data from processing unit to output unit, e.g. interface arrangements
- G06F3/01—Input arrangements or combined input and output arrangements for interaction between user and computer
- G06F3/03—Arrangements for converting the position or the displacement of a member into a coded form
- G06F3/041—Digitisers, e.g. for touch screens or touch pads, characterised by the transducing means
- G06F3/0416—Control or interface arrangements specially adapted for digitisers
- G06F3/04166—Details of scanning methods, e.g. sampling time, grouping of sub areas or time sharing with display driving
-
- G—PHYSICS
- G06—COMPUTING OR CALCULATING; COUNTING
- G06F—ELECTRIC DIGITAL DATA PROCESSING
- G06F3/00—Input arrangements for transferring data to be processed into a form capable of being handled by the computer; Output arrangements for transferring data from processing unit to output unit, e.g. interface arrangements
- G06F3/01—Input arrangements or combined input and output arrangements for interaction between user and computer
- G06F3/03—Arrangements for converting the position or the displacement of a member into a coded form
- G06F3/041—Digitisers, e.g. for touch screens or touch pads, characterised by the transducing means
- G06F3/044—Digitisers, e.g. for touch screens or touch pads, characterised by the transducing means by capacitive means
- G06F3/0446—Digitisers, e.g. for touch screens or touch pads, characterised by the transducing means by capacitive means using a grid-like structure of electrodes in at least two directions, e.g. using row and column electrodes
Definitions
- the present invention relates to a linear system coefficient estimation method, an integrated circuit, and an electronic device for driving a drive line based on a plurality of code sequences to estimate or detect a capacitance value of a capacitance configured in a matrix.
- a device for detecting capacitance values distributed in a matrix for example, capacitance detection for detecting the distribution of capacitance values of a capacitance matrix formed between M drive lines and L sense lines
- An apparatus is disclosed in US Pat.
- the capacitance detection device reduces the capacitance value of the touched capacitance, and thus detects a change in the capacitance value and detects a touch of the finger or the pen.
- FIG. 21 is a schematic view showing a configuration of a conventional touch panel system 91.
- FIG. 22 is a diagram for describing a driving method of touch panel system 91.
- the touch panel system 91 includes a touch panel 92.
- Touch panel 92 has drive lines DL1 to DL4, sense lines SL1 to SL4, and electrostatic capacitances C11 to C44 arranged at positions where drive lines DL1 to DL4 and sense lines SL1 to SL4 intersect. .
- the touch panel system 91 is provided with a drive unit 94.
- the driving unit 94 drives the drive lines DL1 to DL4 based on the 4-row 4-column code sequence shown in Equation 3 of FIG. If the element of the code sequence is “1”, the drive unit 94 applies the power supply voltage VDD, and if the element is “0”, it applies zero volts.
- the touch panel system 91 has four amplifiers 98 arranged at positions corresponding to the sense lines SL1 to SL4, respectively.
- the amplifier 98 receives and amplifies the linear sums Y1, Y2, Y3, and Y4 of the capacitances along the sense line driven by the drive unit 94.
- the drive unit 94 applies the power supply voltage VDD to the drive line DL1 and applies zero volts to the remaining drive lines DL2 to DL4. Do. Then, for example, from the sense line SL3, an output corresponding to the electrostatic capacitance C31 shown in the formula 1 of FIG. 22 is supplied to the amplifier 98 as the measurement value Y1.
- the power supply voltage VDD is applied to the drive line DL2, and zero volts is applied to the remaining drive lines DL1, DL3, and DL4. Then, from the sense line SL3, an output corresponding to the capacitance C32 shown by the equation 2 in FIG. 22 is supplied to the amplifier 98 as the measurement value Y2.
- the power supply voltage VDD is applied to the drive line DL3 and zero volts is applied to the remaining drive lines.
- the power supply voltage VDD is applied to the drive line DL4, and zero volts is applied to the remaining drive lines.
- the measured values Y1, Y2, Y3, Y4 themselves are associated with the capacitance values C1, C2, C3, C4, respectively.
- An object of the present invention is to provide a linear system coefficient estimation method, an integrated circuit and an electronic device capable of correctly detecting a capacitance change of capacitance.
- the linear system coefficient estimation method drives N target coefficients in parallel by N M-dimensional vectors to obtain N linear sums of the target coefficients.
- the M target coefficients are driven in parallel according to the first order of the N M-dimensional vectors to estimate the first estimated value of the M target coefficients, and the first different from the first order According to the order of 2, M target coefficients are driven in parallel to estimate a second estimated value of M target coefficients, and the first estimated value and the second estimated value are averaged to obtain M target coefficient values Estimate For this reason, the estimation results of the capacitances are averaged every time the scan order is changed. Therefore, it is possible to reduce false peaks different from the original peak of the capacity distribution that occurs when the value of the target coefficient changes during the period for obtaining the N linear sums of the target coefficient.
- M target coefficients are driven in parallel by N M-dimensional vectors to generate N linear sums of the target coefficients.
- a value obtained by adding the number of transitions from increase to decrease along the horizontal direction and the number of transitions from decrease to increase is lined up so as to change monotonously along the vertical direction, and the N M-dimensional vectors
- the M target coefficients are arranged in parallel in the order of arrangement along the vertical direction Moving to characterized in that it comprises a monotonic variation estimation step of estimating the value of the M target coefficients.
- each M-dimensional vector has M elements aligned in the horizontal direction, and the N M-dimensional vectors are aligned in the vertical direction, and the N M-dimensional vectors are The number of times the M elements of each M-dimensional vector increase and decrease along the horizontal direction is arranged so as to change monotonously along the vertical direction, and in the vertical direction of the N M-dimensional vectors
- the M target coefficients are driven in parallel in the order of alignment along the line to estimate the values of the M target coefficients.
- the N M-dimensional vectors are such that the number of times the M elements of each M-dimensional vector turn from increasing to decreasing along the lateral direction and from decreasing to increasing monotonously along the longitudinal direction
- the elements are arranged in the order of increasing and decreasing frequency along the horizontal direction.
- the target coefficient when the target coefficient is estimated by driving by N pieces of M-dimensional vectors arranged in order of frequency, the value of the target coefficient changes during a period for obtaining N linear sums of the target coefficient. It is possible to reduce false peaks different from the original volume distribution peaks that occur.
- the integrated circuit according to the present invention is based on a drive unit that drives M target coefficients in parallel by N M-dimensional vectors, and parallel drive by the drive unit.
- An estimation unit for obtaining the N linear sums of the target coefficients and estimating the values of the M target coefficients by an inner product operation of the N linear sums of the target coefficients and N M-dimensional vectors
- the driving unit drives in parallel the M target coefficients in accordance with a first order of the N M-dimensional vectors, and the estimating unit drives in parallel according to the first order.
- Estimating the first estimated value of the M target coefficients based on the plurality of target coefficients and the driving unit is configured to calculate the M target coefficients according to a second order different from the first order of the N M-dimensional vectors.
- the estimation unit is configured to perform parallel driving according to the second order.
- an averaging unit configured to estimate a second estimated value of the M target coefficients and average the first estimated value and the second estimated value to estimate the values of the M target coefficients. It is characterized by
- the drive unit drives M target coefficients in parallel according to the first order of the N M-dimensional vectors, and the estimation unit generates M target coefficients based on the parallel drive according to the first order.
- the driver estimates in parallel the M target coefficients according to a second order different from the first order of the N M-dimensional vectors, and the estimation unit calculates a second order value of the second order.
- the second estimated values of the M target coefficients are estimated based on parallel driving according to the equation (4), and the first estimated values and the second estimated values are averaged to estimate the values of the M target coefficients. For this reason, the estimation results of the capacitances are averaged every time the scan order is changed. Therefore, it is possible to reduce false peaks different from the original peak of the capacity distribution that occurs when the value of the target coefficient changes during the period for obtaining the N linear sums of the target coefficient.
- another integrated circuit is based on a drive unit for driving M target coefficients in parallel by N M-dimensional vectors, and parallel drive by the drive unit.
- An estimation unit for obtaining the N linear sums of the target coefficients and estimating the values of the M target coefficients by an inner product operation of the N linear sums of the target coefficients and N M-dimensional vectors;
- Integrated circuit each M-dimensional vector having M elements arranged in the lateral direction, wherein the N M-dimensional vectors are arranged in the longitudinal direction, and the N M-dimensional vectors are arranged.
- the dimension vector is arranged such that the number of times the M elements of each M-dimensional vector turn from increasing to decreasing and decreasing to increasing along the lateral direction monotonously changes along the longitudinal direction.
- the estimation unit is along the vertical direction of the N M-dimensional vectors.
- the M target coefficients as well order parallel driven to and estimates the value of the M target coefficients.
- each M-dimensional vector has M elements arranged in the lateral direction, N M-dimensional vectors are arranged in the longitudinal direction, and N M-dimensional vectors have each M dimension
- the number of times the M elements of the vector increase and decrease along the horizontal direction is arranged so as to change monotonously along the vertical direction, and the estimation unit is arranged along the vertical direction of the N M-dimensional vectors
- the M target coefficients are driven in parallel in the order of arrangement to estimate the values of the M target coefficients.
- the N M-dimensional vectors are arranged such that the number of times the M elements of each M-dimensional vector increase or decrease along the horizontal direction changes monotonously along the vertical direction, and each element is in the horizontal direction Are arranged in order of increasing and decreasing frequency.
- the target coefficient when the target coefficient is estimated by driving by N pieces of M-dimensional vectors arranged in order of frequency, the value of the target coefficient changes during a period for obtaining N linear sums of the target coefficient. It is possible to reduce false peaks different from the original volume distribution peaks that occur.
- the electronic device includes the integrated circuit according to the present invention, a touch panel controlled by the integrated circuit, and the touch panel superimposed or built-in And a display panel.
- the M target coefficients are driven in parallel according to the first order of the N M-dimensional vectors to generate the first target coefficients of the M target coefficients.
- the M target coefficients are driven in parallel according to a first estimation step of estimating estimated values, and a second order different from the first order of the N M-dimensional vectors,
- the method includes a second estimation step of estimating a second estimated value, and an averaging step of estimating the M target coefficients by averaging the first estimated value and the second estimated value. It is possible to reduce false peaks that are different from the peak of the original volume distribution that occurs when the value of the target coefficient changes during the period for finding the N linear sums of coefficients.
- (A) is a schematic diagram which shows the structure of the touch panel system used as the premise of embodiment
- (b) is a figure which shows the structure of the code series for driving the said touch panel system.
- (A) is a diagram showing a specific example of a matrix F of M rows ⁇ N columns
- (b) is a diagram showing a specific example of a matrix H of N rows ⁇ M columns
- (c) is a specific example of a matrix Eb It is a figure which shows an example.
- (A) and (b) are figures for demonstrating the method to estimate the value of electrostatic capacitance by the drive by the said code sequence. It is a figure which shows an example of the said code sequence.
- FIG. 1 is a schematic view showing a configuration of a touch panel system according to Embodiment 1.
- (A) is a figure which shows the Hadamard matrix of 32 rows x 32 columns produced
- (b) is the Hadamard Walsh (ed according to Embodiment 1
- Fig. 3 illustrates a Hadamard-Walsh transformation matrix.
- (A) is a graph which shows the change model of distribution of electrostatic capacitance which the said touch panel system tries to estimate
- (b) is the simulation result which estimated said electrostatic capacitance distribution based on the Hadamard matrix by said Sylvester method It is a graph which shows
- (c) is a graph which shows the simulation result which presumed the above-mentioned electrostatic capacitance distribution based on the above-mentioned Hadamard-Walsh transformation matrix.
- (A) is a graph which shows the other change model of distribution of electrostatic capacitance which the said touch panel system tries to estimate
- (b) is the simulation which estimated said electrostatic capacitance distribution based on the Hadamard matrix by said Sylvester method It is a graph which shows a result
- (c) is a graph which shows the simulation result which estimated the said electrostatic capacitance distribution based on the said Hadamard-Walsh transformation matrix.
- (A) is a graph which shows the change of distribution of the electrostatic capacitance which the said touch panel system tends to estimate
- (b) shows the experimental result which estimated said electrostatic capacitance distribution based on the Hadamard matrix by said Sylvester method It is a graph
- (c) is a graph which shows the experimental result which estimated said electrostatic capacitance distribution based on said Hadamard-Walsh transformation matrix.
- (A) is a graph which shows the other change of distribution of the electrostatic capacitance which the said touch panel system tries to estimate
- (b) is an experimental result which estimated said electrostatic capacitance distribution based on the Hadamard matrix by said Sylvester method
- (C) is a graph which shows the experimental result which estimated said electrostatic capacitance distribution based on said Hadamard-Walsh transformation matrix.
- (A) is a figure which shows the method to reverse and drive the drive order by the code sequence which concerns on Embodiment 1 for the 2nd time
- (b) is the estimation of the electrostatic capacitance distribution estimated based on the drive by the said method It is a graph which shows a result.
- FIG. 10 is a diagram for describing the nature of a code sequence according to a second embodiment.
- FIG. 16 is a functional block diagram showing a configuration of a mobile phone according to Embodiment 3. It is a schematic diagram which shows the structure of the conventional touch panel system. It is a figure for demonstrating the drive method of the said touch panel system.
- the inventors of the present invention have been driven based on orthogonal code sequences in the prior Japanese patent application (Japanese Patent Application No. 2011-022022, filing date: February 9, 2011, priority date: November 12, 2010).
- the touch panel system which drives a line and estimates capacity is proposed, and this embodiment presupposes this proposed touch panel system. Therefore, first, the touch panel system proposed in the above-mentioned prior application will be mainly described as a premise of the present embodiment, and thereafter, various touch panel systems according to the present embodiment will be described.
- FIG. 1A is a schematic view showing the configuration of a touch panel system 51 on which the embodiment is based
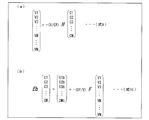
- FIG. 1B is a view showing the configuration of a code sequence H for driving the touch panel system 51
- FIG. 2A shows a specific example of an M-row ⁇ N-column matrix F
- FIG. 2B shows a specific example of an N-row ⁇ M-column matrix H
- FIG. 2C shows a matrix Eb. It is a figure which shows the specific example of.
- FIGS. 3 (a) and 3 (b) are diagrams for explaining a method of estimating the value of capacitance by driving with the above-described orthogonal code sequence.
- the touch panel system 51 includes the touch panel 2 and the touch panel controller 53.
- the touch panel 2 has M drive lines DL1 to DLM and a plurality of sense lines. However, in order to simplify the description, the sense line is described as being provided with only one sense line SL. Capacitances C1 to CM are disposed at the intersections of the drive lines DL1 to DLM and the sense lines SL.
- the touch panel controller 53 is provided with a drive unit 54.
- the drive unit 54 drives the drive lines DL1 to DLM in parallel based on the code sequence H of N rows ⁇ M columns (M ⁇ N) shown in Expression 8 of FIG. 1B. If the element of the code sequence H is “1”, the drive unit 54 applies a voltage V, and if the element is “ ⁇ 1”, a voltage ⁇ V is applied.
- the code sequence F of M rows ⁇ N columns represented by Equation 7 in FIG. 1B is a square matrix of M rows ⁇ M columns as a result of inner product operation with the code sequence H, and the absolute value of the diagonal components It is assumed that the code sequence is such that the value is relatively large compared with the absolute value of the non-diagonal component to obtain a relatively large matrix Eb.
- an orthogonal code sequence can be used as the code sequence H, but a code sequence that is not an orthogonal code sequence can also be used.
- orthogonal code sequence examples include a Hadamard matrix generated by the sylvester method, a Hadamard-Walsh transform matrix, and a discrete cosine transform (DCT) matrix.
- DCT discrete cosine transform
- the Sylvester Hadamard matrix forms a basic unit of 2 rows ⁇ 2 columns as a basic structure.
- the upper right, upper left, and lower left bits of this basic unit are the same, and the lower right is these bit inversions.
- a Hadamard matrix is a square matrix in which each element is either 1 or -1 and each row is orthogonal to each other. That is, any two rows of the Hadamard matrix represent vectors perpendicular to one another.
- the “orthogonal code sequence” according to the present invention can use a matrix obtained by arbitrarily extracting N rows from the Mth-order Hadamard matrix (where N ⁇ M).
- N ⁇ M the Mth-order Hadamard matrix
- Hadamard matrices according to methods other than the Sylvester method can also be applied to the present invention.
- Hadamard matrices by methods other than these Sylvester methods can also be used as orthogonal code sequences according to the present embodiment.
- the touch panel controller 53 has an amplifier 6 disposed at a position corresponding to the sense line SL.
- Equation 9 of FIG. 3A and Equation 10 of FIG. 3B matrix calculations of measured values (linear sums) V1, V2,..., VM,. Capacitances C1, C2,..., CM can be approximated.
- the value of the capacitance of the estimation target changes.
- the drive lines DL1 to DLM try to drive at such a high speed that the movement of the finger on the touch panel can be ignored, but if the movement speed of the finger is still high, the drive line is driven to drive plural linear sums V1. , V2,..., While moving the finger, the capacitance may be slightly changed. Then, drive lines DL1 to DLM are driven a plurality of times on the premise that there is originally one fixed capacitance solution, but the capacitance to be a solution changes little by little. . For this reason, it is an object of the present invention to estimate the capacitance on the premise that the capacitance is fixed despite the fact that the capacitance has changed in this way, an unexpected completely wrong solution may be obtained. They found it.
- FIG. 4 is a diagram showing an example of the code sequence.
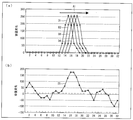
- FIG. 5A is a graph showing a change in the distribution of capacitance that the touch panel system 51 tries to estimate
- FIG. 5B is a graph showing the estimation result of the capacitance distribution by the touch panel system 51.
- FIG. 4 shows a Hadamard matrix M1 of 32 rows ⁇ 32 columns by Sylvester as an example of an orthogonal code sequence. Elements shown in black indicate “-1", and elements shown in white indicate "1".
- FIG. 5 (a) drive lines are sequentially driven according to the first to 32nd lines of the Hadamard matrix M1 to obtain a linear sum, but 32 times of driving are performed on the first to 32nd lines.
- the distribution of capacitance may be shifted little by little.
- the horizontal axis of the graph of FIG. 5A represents 32 positions along the sense line of the capacitance, and the vertical axis represents the change of the capacitance.
- a line D1 indicates the average value of the distribution of capacitance change when driven in the first to eighth rows of the Hadamard matrix M1.
- Line D2 shows the average value of the distribution of change in capacitance when driven in the ninth to sixteenth lines
- line D3 is the average value of distribution when driven in the seventeenth to 24th lines Is shown.
- the line D4 indicates the average value of the distribution when driven on the 25th to 32nd lines.
- the matrix F is multiplied by the linear sum after the 32 drives and the electrostatic
- the capacitance distribution of the capacitances C1 to C32 can be accurately determined. However, this is based on the premise that the capacitance distribution does not change while driving the drive line 32 times, and there is a problem that when the capacitance distribution changes during driving, a considerably large error occurs.
- FIG. 6 is a schematic view showing the configuration of the touch panel system 1 according to the first embodiment.
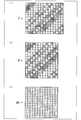
- FIG. 7 (a) is a diagram showing a 32-row ⁇ 32-column Hadamard matrix M1 generated by the Sylvester method according to the first embodiment, and
- FIG. 7 (b) is a Hadamard-Walsh transform matrix M2 according to the first embodiment.
- FIG. 7 (a) is a diagram showing a 32-row ⁇ 32-column Hadamard matrix M1 generated by the Sylvester method according to the first embodiment
- FIG. 7 (b) is a Hadamard-Walsh transform matrix M2 according to the first embodiment.
- the touch panel system 1 includes the touch panel 2 and the touch panel controller 3.
- the touch panel 2 has M drive lines DL1 to DLM and a plurality of sense lines. In order to simplify the description, only one sense line SL is shown and described in FIG.
- Capacitances C1 to CM target coefficients are disposed at the intersections of the drive lines DL1 to DLM and the sense lines SL.
- the touch panel controller 3 is provided with a drive unit 4.
- the drive unit 4 drives the drive lines DL1 to DLM based on the Hadamard matrix M1 shown in FIG. 7A or based on the Hadamard-Walsh transform matrix M2 shown in FIG. 7B. If the element of the Hadamard matrix M1 or the Hadamard-Walsh transform matrix M2 is “1”, the drive unit 4 applies a voltage V, and if the element is “ ⁇ 1”, a voltage ⁇ V is applied.
- the touch panel controller 3 includes an amplifier 6 disposed at a position corresponding to the sense line SL.
- the touch panel controller 3 is provided with an estimation unit 5.
- the value obtained by adding the number of times of increasing to decreasing and the number of changing of increasing to decreasing along the horizontal direction in one row by 32 rows ⁇ 32 columns of Hadamard matrix M1 by the Sylvester method shown in FIG. 7A is small.
- a matrix in which rows are rearranged in order is a Hadamard-Walsh transform matrix M2 shown in FIG. 7 (b). That is, the Hadamard-Walsh transform matrix M2 counts the number of times that the number of elements turning from increase to decrease along the horizontal direction and the number of turns from increase to decrease in one row, and the row with the smallest value It is arranged in the first row, and the rows are rearranged so that the added value increases in the vertical direction.
- the added value corresponds to the frequency component (spectrum) of the row.
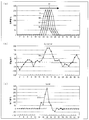
- FIG. 8 (a) is a graph showing a change model of the distribution of capacitance which the touch panel system 1 tries to estimate
- FIG. 8 (b) is a simulation in which the capacitance distribution is estimated based on the Hadamard matrix by the Sylvester method. It is a graph which shows a result
- (c) is a graph which shows the simulation result which estimated the said electrostatic capacitance distribution based on the said Hadamard-Walsh transformation matrix.
- the line D5 indicates the average value of the distribution of capacitance change when driven in the first to eighth rows.
- Line D6 shows the average value of the distribution of capacitance change when driven in the ninth to sixteenth lines, and line D7 is the average value of distribution when driven in the seventeenth to 24th lines Is shown.
- the line D8 indicates the average value of the distribution when driven on the 25th to 32nd lines.
- FIG. 9 (a) is a graph showing another change model of the distribution of capacitances that the touch panel system tries to estimate
- FIG. 9 (b) is an estimate of the capacitance distribution based on the Hadamard matrix by the Sylvester method.
- (C) is a graph which shows the simulation result which estimated the said capacitance distribution based on the said Hadamard-Walsh transformation matrix.
- the capacitance distribution shifts in the direction of the arrow A5 opposite to the arrow A4.
- a line D11 indicates the average value of the distribution of capacitance change when driven in the first to eighth rows.
- the line D12 indicates the average value of the distribution of change in capacitance when driven in the ninth to sixteenth lines
- the line D13 indicates the average value of the distribution when driven in the seventeenth to twenty-fourth lines. Is shown.
- the line D14 indicates the average value of the distribution when driven on the 25th to 32nd lines.
- FIG.10 (a) is a graph which shows the change of distribution of the electrostatic capacitance which the touch panel system 1 tries to estimate, (b) is an experimental result which estimated said electrostatic capacitance distribution based on the Hadamard matrix by said Sylvester method. (C) is a graph which shows the experimental result which estimated said electrostatic capacitance distribution based on said Hadamard-Walsh transformation matrix.
- FIG. 11A is a graph showing another change in the distribution of capacitance that the touch panel system 1 tries to estimate
- FIG. 11B is a graph in which the capacitance distribution is estimated based on the Hadamard matrix according to the Sylvester method. It is a graph which shows an experimental result
- (c) is a graph which shows the experimental result which estimated said electrostatic capacitance distribution based on said Hadamard-Walsh transformation matrix.
- FIG. 10A shows the respective capacity distributions by driving of 32 drive lines by Hadamard matrix of 32 rows ⁇ 32 columns by 32 lines. From the first drive to the 32nd drive, the capacitance distribution moves little by little in the direction of arrow A6.
- the capacitances are in fact discretely arranged, and when the finger is, for example, in a position corresponding to the capacitance, the capacitance distribution is one peak at the position of the capacitance corresponding to that finger Will occur.
- the capacitance distribution is generated by dispersing two peaks at positions corresponding to the adjacent two capacitances. Thus, it experimented by the structure assumed actually.
- FIG. 11 (a) shows the respective capacitance distributions by 32 drive lines driven by 32 rows ⁇ 32 Hadamard matrices by 32 lines, and from the first drive to the 32nd drive, The distribution moves little by little in the direction of arrow A7 opposite to arrow A6.
- driving with the Hadamard matrix M1 according to the Sylvester method shown in FIG. 7A results in FIG. 10, as shown by line D19 in the graph shown in FIG.
- the electrostatic capacitance distribution shown on line D19 which left-right reversed line D17 in the graph of (b) is shown.
- the drive line is driven by the Hadamard-Walsh transform matrix M2 shown in FIG. 7B, as shown by a line D20 in FIG. 11C, the line D18 in the graph of FIG. It shows a volume distribution.
- Fig.12 (a) is a figure which shows the method to reverse and drive the drive order by the orthogonal code series which concerns on Embodiment 1 for the 2nd time, (b) is the electrostatic capacitance estimated based on the drive by the said method It is a graph which shows the presumed result of distribution.
- FIG. 13 is a graph showing temporal variation of the distribution of capacitance which the touch panel system 1 tries to estimate.
- FIG. 12 (a) shows the respective capacitance distributions by 16 drive lines driven by the Hadamard matrix of 16 rows ⁇ 16 columns by 16 lines, and from the first drive to the 16th drive, The capacitance distribution moves little by little in the direction of arrow A8.
- the driving unit 4 starts with the first row of the Hadamard matrix M3 of 16 rows ⁇ 16 columns by Sylvester method and ends with the 16th row (first order) to obtain the capacitance C1.
- Drive lines DL1 to DL16 to which C16 to C16 are coupled are driven in parallel 16 times.
- the amplification unit 6 amplifies the sixteen first linear sum outputs of the capacitances C1 to C16 supplied from the sense line SL.
- the drive unit 4 drives the capacitive elements C1 to C16 based on the Hadamard matrix M3rev, in which the first to sixteenth rows of the Hadamard matrix M3 are rearranged in the reverse order (second order).
- the lines DL1 to DL16 are driven in parallel 16 times.
- the amplification unit 6 amplifies the 16 second linear sum outputs of the capacitances C1 to C16 supplied from the sense line SL.
- the estimation unit 5 calculates a second estimation of the capacitances C1 to C16 by calculating the inner product of the 16 second linear sum outputs amplified by the amplification unit 6 and the Hadamard matrix M3 rev of 16 rows ⁇ 16 columns. Estimate the value.
- the averaging unit 17 averages the first estimated value and the second estimated value to estimate 16 capacitance values.
- FIG. 14 (a) is a diagram showing another driving method by the orthogonal code sequence
- FIG. 14 (b) is a graph showing the estimation result of the capacitance distribution estimated based on the driving by the above method.
- the amplitude P1 of the false peak in the capacitance distribution shown by the line D21 in FIG. 12 (b) is 16 by the Sylvester method as shown in FIG. 14 (a). 14 times smaller than the amplitude P2 of the false peak value in the capacitance distribution shown by the line D22 of FIG. 14 (b) which occurs when driving by the Hadamard matrix M3 of row x 16 columns is repeated twice and averaged .
- Fig.15 (a) is a figure which shows the method of changing the drive order by the orthogonal code series at random which concerns on Embodiment 1 at random, and driving, (b) is the capacitance distribution estimated based on the drive by the said method It is a graph which shows the presumed result of.
- the driving unit 4 (FIG. 6) is based on the matrix M4ram1 in which the first to sixteenth rows of the 16-row ⁇ 16-column Hadamard matrix M3 according to the Sylvester method are rearranged in random order (first order).
- the drive lines DL1 to DL16 to which the capacitances C1 to C16 are coupled are driven in parallel 16 times.
- the amplification unit 6 amplifies the sixteen first linear sum outputs of the capacitances C1 to C16 supplied from the sense line SL.
- the estimation unit 5 calculates a first estimated value of the capacitances C1 to C16 by the inner product calculation of the 16 first linear sum outputs amplified by the amplification unit 6 and the matrix M4ram1 of 16 rows ⁇ 16 columns.
- the driving unit 4 combines the capacitances C1 to C16 based on another matrix M4ram2 in which the first to sixteenth rows of the Hadamard matrix M3 are rearranged in another random order (second order).
- the drive lines DL1 to DL16 are driven in parallel 16 times.
- the amplification unit 6 amplifies the 16 second linear sum outputs of the capacitances C1 to C16 supplied from the sense line SL.
- the estimation unit 5 calculates a second estimation of the capacitances C1 to C16 by calculating the inner product of the 16 second linear sum outputs amplified by the amplification unit 6 and the Hadamard matrix M4ram2 of 16 rows ⁇ 16 columns. Estimate the value.
- the averaging unit 17 averages the first estimated value and the second estimated value to estimate 16 capacitance values.
- the amplitude P3 of the false peak in the capacitance distribution indicated by the line D23 in FIG. 14 (b) is smaller than the amplitude P2 of the false peak value in the capacitance distribution indicated by line D22 in FIG. 14 (b).
- the positions of the noise are dispersed, and when averaged, the amplitude of the false peak value can be reduced.
- FIG. 16 is a diagram for describing the property of the orthogonal code sequence according to the second embodiment.
- FIG. 17 is a diagram for explaining a driving method using a Hadamard-Walsh transform matrix according to the second embodiment, and
- FIG. 17B is a graph showing an estimation result of capacitance distribution estimated based on driving by the above method. It is.
- the touch panel system according to the second embodiment is the same as the touch panel system 1 described above with reference to FIG.
- drive lines are driven by a matrix in which orthogonal code sequences are rearranged in order of spatial frequency.
- the orthogonal code sequence used in the second embodiment has N M-dimensional vectors (N ⁇ M) orthogonal to one another, and each M-dimensional vector has M elements aligned in the lateral direction.
- the N M-dimensional vectors are vertically aligned.
- these N M-dimensional vectors have a value obtained by adding the number of times that the M elements of each M-dimensional vector turn from increase to decrease along the horizontal direction and the number of times from decrease to increase It is lined up to change monotonously along.
- the increase / decrease addition value of the eight-dimensional vector “0, 1, 1, 0, 1, 1, 0, 1” is four.
- a typical example of the orthogonal code sequence used in the second embodiment is a Hadamard-Walsh transform matrix.
- the 16-row ⁇ 16-column Hadamard-Walsh transform matrix M5 shown in FIG. 17A all elements in the first row are “1”, and the increase / decrease addition value is zero.
- the elements in the second row are such that the first eight are “1” and the remaining eight are “ ⁇ 1”, so the increment / decrement value is zero.
- the first four are “1”, the next eight are “ ⁇ 1”, the next four are “1”, and therefore the increment / decrement value is 1. .
- the first four elements of the fourth line are “1”, the next four are “ ⁇ 1”, the next four are “1”, and the remaining four are “ ⁇ 1” Therefore, the increase / decrease addition value is 2.
- the fifth line the first two are “1”, the next four are “-1”, the next four are “1”, and the next four are “-1”. And the remaining two are “1”, so the increment / decrement value is three.
- the increment / decrement value of the elements of each row of the 16-row ⁇ 16 Hadamard-Walsh transform matrix is increased by one for each row from the third row, and the last 16-th row element is an odd number.
- the eighth eight pieces are “1”, the even-numbered eight pieces are “ ⁇ 1”, and the increase / decrease addition value is 14.
- the increase / decrease addition value along the horizontal direction of the 16 elements of each row vector is monotonously along the vertical direction Lined up to increase.
- the touch panel system 1 is driven twice by a 16 row ⁇ 16 column Hadamard-Walsh transform matrix M5.
- the drive unit 4 (FIG. 6) drives the drive lines DL1 to DL16 in which the electrostatic capacitances C1 to C16 are coupled in parallel 16 times based on the Hadamard-Walsh transformation matrix M5 of 16 rows ⁇ 16 columns.
- the amplification unit 6 amplifies the sixteen first linear sum outputs of the capacitances C1 to C16 supplied from the sense line SL.
- the estimation unit 5 performs an inner product operation of the 16 first linear sum outputs amplified by the amplification unit 6 and the Hadamard-Walsh transformation matrix M5 of 16 rows ⁇ 16 columns to obtain capacitances C1 to C16. Estimate the first estimate.
- the drive unit 4 drives in parallel the drive lines DL1 to DL16 to which the capacitances C1 to C16 are coupled.
- the amplification unit 6 amplifies the 16 second linear sum outputs of the capacitances C1 to C16 supplied from the sense line SL.
- the estimation unit 5 estimates the second estimated values of the capacitances C1 to C16 by the inner product calculation of the 16 second linear sum outputs amplified by the amplification unit 6 and the Hadamard-Walsh transform matrix M5. Do.
- the averaging unit 17 averages the first estimated value and the second estimated value to estimate 16 capacitance values (monotonous change estimation step).
- the amplitude P4 of the false peak in the capacitance distribution indicated by the line D24 in FIG. 17B when the drive line is driven by the Hadamard-Walsh transformation matrix M5 is the static line indicated by the line D22 in FIG.
- the amplitude is smaller than the amplitude P2 of the false peak value in the capacitance distribution.
- FIG. 18 is a diagram for explaining a driving method using a DCT matrix M6 of 8 rows ⁇ 8 columns according to the second embodiment. Similar to the Hadamard-Walsh transform matrix, the DCT matrix M6 is also N M-dimensional vectors, and the increase / decrease addition values of M elements of each M-dimensional vector monotonously increase along the vertical direction It corresponds to a lined matrix and can be used as the orthogonal code sequence of the third embodiment.
- the drive unit 4 (FIG. 6) drives the drive lines DL1 to DL8 coupled with the electrostatic capacitances C1 to C8 eight times in parallel based on the 8 rows ⁇ 8 columns of the DCT matrix M6.
- the amplification unit 6 amplifies eight first linear sum outputs of the capacitances C1 to C8 supplied from the sense line SL.
- the estimation unit 5 performs a first estimation of the capacitances C1 to C8 by calculating the inner product of the eight first linear sum outputs amplified by the amplification unit 6 and the DCT matrix M6 of 8 rows ⁇ 8 columns. Estimate the value.
- the drive unit 4 drives the drive lines DL1 to DL8 coupled with the capacitances C1 to C8 in parallel eight times based on the DCT matrix M6.
- the amplification unit 6 amplifies the eight second linear sum outputs of the capacitances C1 to C8 supplied from the sense line SL.
- the estimation unit 5 estimates the second estimated values of the electrostatic capacitances C1 to C8 by the inner product operation of the eight second linear sum outputs amplified by the amplification unit 6 and the DCT matrix M6.
- the averaging unit 17 averages the first estimated value and the second estimated value to estimate eight capacitances C1 to C8.
- DCT matrix M6 of 8 rows x 8 columns was shown, this invention is not limited to this.
- a submatrix of a DCT matrix M6 of 8 rows ⁇ K columns (K ⁇ 8) may be used.
- FIG. 19 (a) is a diagram showing a method of driving by reversing the driving order by the Hadamard-Walsh transformation matrix according to the second embodiment for the second time
- FIG. 19 (b) is a static estimated based on the driving by the above method. It is a graph which shows the presumed result of electric capacity distribution.
- the driving order according to the Hadamard-Walsh transform matrix may be inverted and driven a second time as in the method according to the first embodiment.
- the drive unit 4 (FIG. 6) drives the drive lines DL1 to DL16 in which the electrostatic capacitances C1 to C16 are coupled in parallel 16 times based on the Hadamard-Walsh transformation matrix M5 of 16 rows ⁇ 16 columns.
- the amplification unit 6 amplifies the sixteen first linear sum outputs of the capacitances C1 to C16 supplied from the sense line SL.
- the estimation unit 5 performs an inner product operation of the 16 first linear sum outputs amplified by the amplification unit 6 and the Hadamard-Walsh transformation matrix M5 of 16 rows ⁇ 16 columns to obtain capacitances C1 to C16. Estimate the first estimate.
- the drive unit 4 drives the drive lines DL1 to DL16 to which the electrostatic capacitances C1 to C16 are coupled based on the Hadamard matrix M5rev in which the first to sixteenth rows of the Hadamard-Walsh transform matrix M5 are rearranged. Drive in parallel 16 times.
- the amplification unit 6 amplifies the 16 second linear sum outputs of the capacitances C1 to C16 supplied from the sense line SL.
- the estimation unit 5 calculates a second estimation of the capacitances C1 to C16 by calculating the inner product of the 16 second linear sum outputs amplified by the amplification unit 6 and the Hadamard matrix M5 rev of 16 rows ⁇ 16 columns. Estimate the value.
- the averaging unit 17 averages the first estimated value and the second estimated value to estimate 16 capacitance values.
- the amplitude P5 of the false peak in the capacitance distribution shown by the line D25 in FIG. 19 (b) when the drive line is driven by the Hadamard-Walsh transformation matrix M5 and M5 rev is the drive line according to the Hadamard-Walsh transformation matrix M5.
- the amplitude is further reduced than the false peak amplitude P4 in the capacitance distribution shown by line D24 in FIG. 17 (b) when driven.
- Hadamard-Walsh transformation matrix M5 of 16 rows x 16 columns was shown, the present invention is not limited to this.
- a partial matrix of Hadamard-Walsh transform matrix M5 of 16 rows ⁇ K columns (K ⁇ 16) may be used.
- FIG. 20 is a functional block diagram showing the configuration of the mobile telephone 7 according to the third embodiment.
- the mobile phone 7 includes a CPU 10, a RAM 12, a ROM 11, a camera 13, a microphone 14, a speaker 15, an operation key 16, a display panel 18, a display control circuit 9, and a touch panel system 1. .
- Each component is connected to each other by a data bus.
- the CPU 10 controls the operation of the mobile phone 7.
- the CPU 10 executes, for example, a program stored in the ROM 11.
- Operation key 16 receives an input of an instruction from the user of mobile phone 7.
- the RAM 12 volatileally stores data generated by execution of a program by the CPU 10 or data input through the operation key 16.
- the ROM 11 stores data in a non-volatile manner.
- the ROM 11 is a ROM that can be written and erased, such as an erasable programmable read-only memory (EPROM) and a flash memory.
- EPROM erasable programmable read-only memory
- the mobile telephone 7 may be configured to include an interface (IF) for connecting to another electronic device by wire.
- IF interface
- the camera 13 shoots an object in accordance with the operation of the operation key 16 by the user.
- the image data of the photographed subject is stored in the RAM 12 or an external memory (for example, a memory card).
- the microphone 14 receives an input of the user's voice.
- the mobile phone 7 digitizes the input voice (analog data). Then, the mobile phone 7 sends the digitized voice to the other party of communication (for example, another mobile phone).
- the speaker 15 outputs, for example, a sound based on music data or the like stored in the RAM 12.
- the touch panel system 1 includes the touch panel 2 and the touch panel controller 3.
- the CPU 10 controls the operation of the touch panel system 1.
- the CPU 10 executes, for example, a program stored in the ROM 11.
- the RAM 12 stores data generated by the execution of a program by the CPU 10 in a volatile manner.
- the ROM 11 stores data in a non-volatile manner.
- the display panel 8 causes the display control circuit 9 to display the images stored in the ROM 11 and the RAM 12.
- the display panel 8 is superimposed on the touch panel 2 or incorporates the touch panel 2.
- the second order is preferably an order in which the first order is arranged in reverse.
- the second order is preferably an order obtained by randomly changing the first order.
- the N M-dimensional vectors constitute a Hadamard-Walsh transform matrix.
- the Hadamard-Walsh transform matrix is obtained by rearranging Hadamard matrices generated by the sylvester method in the order of frequencies in which each element increases and decreases in the horizontal direction. Therefore, with a simple configuration, it is possible to reduce a false peak different from the peak of the original capacity distribution that occurs when the value of the target coefficient changes during the period for obtaining the N linear sums of the target coefficient. it can.
- the N M-dimensional vectors constitute a discrete cosine transform (DCT).
- DCT discrete cosine transform
- the discrete cosine transform is essentially a matrix in which the elements are arranged in the order of frequencies that increase and decrease along the lateral direction. Therefore, with a simple configuration, it is possible to reduce a false peak different from the peak of the original capacity distribution that occurs when the value of the target coefficient changes during the period for obtaining the N linear sums of the target coefficient. it can.
- the N M-dimensional vectors constitute a partial matrix of a Hadamard-Walsh transform matrix.
- the N M-dimensional vectors constitute a partial matrix of discrete cosine transform.
- the monotonous change estimation step drives the M target coefficients in parallel according to a first order of the N M-dimensional vectors to generate the M targets.
- the M target coefficients are driven in parallel according to a first estimation step of estimating a first estimated value of coefficients, and a second order in which the first order of the N M-dimensional vectors is arranged in reverse.
- a second estimation step of estimating a second estimated value of the M target coefficients, and an averaging step of estimating the values of the M target coefficients by averaging the first estimated value and the second estimated value And is preferably included.
- the estimation result of the capacitance is averaged every time the scanning direction is changed. Therefore, it is possible to further reduce the false peak different from the peak of the original volume distribution.
- the present invention is applied to a linear system coefficient estimation method, an integrated circuit, and an electronic apparatus which drives drive lines based on a plurality of code sequences to estimate or detect capacitance values of capacitances configured in a matrix. be able to.
Landscapes
- Engineering & Computer Science (AREA)
- General Engineering & Computer Science (AREA)
- Theoretical Computer Science (AREA)
- Human Computer Interaction (AREA)
- Physics & Mathematics (AREA)
- General Physics & Mathematics (AREA)
- Position Input By Displaying (AREA)
Abstract
静電容量の容量変化を正しく検出することができるタッチパネルコントローラ(3)は、N個のM次元ベクトルにより静電容量C1~CMを並列駆動する駆動部(4)と、この並列駆動に基づいて静電容量C1~CMの線形和を得て、この線形和とN個のM次元ベクトルとの内積演算により静電容量C1~CMを推定する推定部(5)とを備え、駆動部(4)は、N個のM次元ベクトルの第1の順番に従って、容量C1~CMを並列駆動し、推定部(5)は、この並列駆動に基づいて静電容量C1~CMの第1推定値を推定し、駆動部(4)は、N個のM次元ベクトルの第2の順番に従って、静電容量C1~CMを並列駆動し、推定部(5)は、この並列駆動に基づいて静電容量C1~CMの第2推定値を推定し、第1推定値と第2推定値とを平均して静電容量C1~CMの値を推定する平均化部(17)を設けた。
Description
本発明は、複数の符号系列に基づいてドライブラインを駆動して、マトリックス状に構成された静電容量の容量値を推定または検出する線形系係数推定方法、集積回路、及び電子機器に関する。
マトリックス状に分布した静電容量値を検出する装置、例えば、M本のドライブラインとL本のセンスラインとの間に形成される静電容量行列の静電容量値の分布を検出する容量検出装置が、特許文献1に開示されている。この容量検出装置は、指やペンでタッチパネルに触れると、触れられた静電容量の容量値が小さくなるので、容量値が小さくなった変化を検出して、指やペンのタッチを検出する。
図21は、従来のタッチパネルシステム91の構成を示す模式図である。図22は、タッチパネルシステム91の駆動方法を説明するための図である。タッチパネルシステム91は、タッチパネル92を備えている。タッチパネル92は、ドライブラインDL1~DL4と、センスラインSL1~SL4と、ドライブラインDL1~DL4とセンスラインSL1~SL4とが交差する位置に配置された静電容量C11~C44とを有している。
タッチパネルシステム91には、駆動部94が設けられている。駆動部94は、図22の式3に示される4行4列の符号系列に基づいてドライブラインDL1~DL4を駆動する。符号系列の要素が「1」であれば、駆動部94は電源電圧VDDを印加し、要素が「0」であれば、ゼロボルトを印加する。
タッチパネルシステム91は、センスラインSL1~SL4にそれぞれ対応する位置に配置された4個の増幅器98を有している。増幅器98は、駆動部94により駆動されたセンスラインに沿った静電容量の線形和Y1、Y2、Y3、Y4を受け取って増幅する。
例えば、上記4行×4列の符号系列による4回の駆動のうちの最初の駆動では、駆動部94はドライブラインDL1に電源電圧VDDを印加し、残りのドライブラインDL2~DL4にゼロボルトを印加する。すると、例えばセンスラインSL3からは、図22の式1で示される静電容量C31に対応する出力が測定値Y1として増幅器98に供給される。
そして、2回目の駆動では、ドライブラインDL2に電源電圧VDDを印加し、残りのドライブラインDL1、DL3、DL4にゼロボルトを印加する。すると、センスラインSL3からは、図22の式2で示される静電容量C32に対応する出力が測定値Y2として増幅器98に供給される。
次に、3回目の駆動では、ドライブラインDL3に電源電圧VDDを印加し、残りのドライブラインにゼロボルトを印加する。その後、4回目の駆動では、ドライブラインDL4に電源電圧VDDを印加し、残りのドライブラインにゼロボルトを印加する。
そうすると、図22の式3及び式4に示すように、測定値Y1、Y2、Y3、Y4そのものが、それぞれ静電容量値C1、C2、C3、C4と関連付けられる。
しかしながら、上述した図21及び図22に示す構成では、1回の測定で1本のドライブラインと交差する容量データしか取得できず、ノイズ成分が小さくならず、静電容量の容量変化を正しく検出することが困難であるという問題がある。
本発明の目的は、静電容量の容量変化を正しく検出することができる線形系係数推定方法、集積回路、及び電子機器を提供することにある。
上記の課題を解決するために、本発明に係る線形系係数推定方法は、N個のM次元ベクトルにより、M個の対象係数を並列駆動して前記対象係数のN個の線形和を得て、前記対象係数のN個の線形和とM個のN次元ベクトルとの内積演算により前記M個の対象係数の値を推定する線形系係数推定方法であって、前記N個のM次元ベクトルの第1の順番に従って、前記M個の対象係数を並列駆動して前記M個の対象係数の第1推定値を推定する第1推定工程と、前記N個のM次元ベクトルの前記第1の順番と異なる第2の順番に従って、前記M個の対象係数を並列駆動して前記M個の対象係数の第2推定値を推定する第2推定工程と、前記第1推定値と前記第2推定値とを平均して前記M個の対象係数の値を推定する平均化工程とを包含することを特徴とする。
この特徴によれば、N個のM次元ベクトルの第1の順番に従って、M個の対象係数を並列駆動してM個の対象係数の第1推定値を推定し、第1の順番と異なる第2の順番に従って、M個の対象係数を並列駆動してM個の対象係数の第2推定値を推定し、第1推定値と第2推定値とを平均してM個の対象係数の値を推定する。このため、静電容量の推定結果は、毎回走査順番を変えて加算平均される。従って、対象係数のN個の線形和を求めるための期間の間に対象係数の値が変化したときに生じる本来の容量分布のピークとは異なる偽のピークを低減することができる。
また、上記の課題を解決するために、本発明に係る線形系係数推定方法は、N個のM次元ベクトルにより、M個の対象係数を並列駆動して前記対象係数のN個の線形和を得て、前記対象係数のN個の線形和とN個のM次元ベクトルとの内積演算により前記M個の対象係数の値を推定する線形系係数推定方法であって、各M次元ベクトルは、横方向に並ぶM個の要素を有しており、前記N個のM次元ベクトルは、縦方向に並んでおり、前記N個のM次元ベクトルは、各M次元ベクトルのM個の要素が前記横方向に沿って増加から減少に転ずる回数と、減少から増加に転ずる回数とを加算した値が、前記縦方向に沿って単調に変化するように並んでおり、前記N個のM次元ベクトルの前記縦方向に沿った並びの順番に前記M個の対象係数を並列駆動して前記M個の対象係数の値を推定する単調変化推定工程を包含することを特徴とする。
この特徴によれば、各M次元ベクトルは、横方向に並ぶM個の要素を有しており、前記N個のM次元ベクトルは、縦方向に並んでおり、前記N個のM次元ベクトルは、各M次元ベクトルのM個の要素が前記横方向に沿って増減する回数が、前記縦方向に沿って単調に変化するように並んでおり、前記N個のM次元ベクトルの前記縦方向に沿った並びの順番に前記M個の対象係数を並列駆動して前記M個の対象係数の値を推定する。N個のM次元ベクトルは、各M次元ベクトルのM個の要素が前記横方向に沿って増加から減少に、及び減少から増加に転ずる回数が、前記縦方向に沿って単調に変化するように並んでおり、各要素が横方向に沿って増減する周波数の順番に並んでいる。このように周波数の順番に並んだN個のM次元ベクトルにより駆動して対象係数を推定すると、対象係数のN個の線形和を求めるための期間の間に対象係数の値が変化したときに生じる本来の容量分布のピークとは異なる偽のピークを低減することができる。
また、上記の課題を解決するために、本発明に係る集積回路は、N個のM次元ベクトルにより、M個の対象係数を並列駆動する駆動部と、前記駆動部による並列駆動に基づいて、前記対象係数のN個の線形和を得て、前記対象係数のN個の線形和とN個のM次元ベクトルとの内積演算により前記M個の対象係数の値を推定する推定部とを備えた集積回路であって、前記駆動部は、前記N個のM次元ベクトルの第1の順番に従って、前記M個の対象係数を並列駆動し、前記推定部は、前記第1の順番による並列駆動に基づいて前記M個の対象係数の第1推定値を推定し、前記駆動部は、前記N個のM次元ベクトルの前記第1の順番と異なる第2の順番に従って、前記M個の対象係数を並列駆動し、前記推定部は、前記第2の順番による並列駆動に基づいて前記M個の対象係数の第2推定値を推定し、前記第1推定値と前記第2推定値とを平均して前記M個の対象係数の値を推定する平均化部を設けたことを特徴とする。
この特徴により、駆動部は、N個のM次元ベクトルの第1の順番に従って、M個の対象係数を並列駆動し、推定部は、第1の順番による並列駆動に基づいてM個の対象係数の第1推定値を推定し、駆動部は、N個のM次元ベクトルの第1の順番と異なる第2の順番に従って、M個の対象係数を並列駆動し、推定部は、第2の順番による並列駆動に基づいてM個の対象係数の第2推定値を推定し、第1推定値と第2推定値とを平均してM個の対象係数の値を推定する。このため、静電容量の推定結果は、毎回走査順番を変えて加算平均される。従って、対象係数のN個の線形和を求めるための期間の間に対象係数の値が変化したときに生じる本来の容量分布のピークとは異なる偽のピークを低減することができる。
また、上記の課題を解決するために、本発明に係る他の集積回路は、N個のM次元ベクトルにより、M個の対象係数を並列駆動する駆動部と、前記駆動部による並列駆動に基づいて、前記対象係数のN個の線形和を得て、前記対象係数のN個の線形和とN個のM次元ベクトルとの内積演算により前記M個の対象係数の値を推定する推定部とを備えた集積回路であって、各M次元ベクトルは、横方向に並ぶM個の要素を有しており、前記N個のM次元ベクトルは、縦方向に並んでおり、前記N個のM次元ベクトルは、各M次元ベクトルのM個の要素が前記横方向に沿って増加から減少に、及び減少から増加に転ずる回数が、前記縦方向に沿って単調に変化するように並んでおり、前記推定部は、前記N個のM次元ベクトルの前記縦方向に沿った並びの順番に前記M個の対象係数を並列駆動して前記M個の対象係数の値を推定することを特徴とする。
この特徴により、各M次元ベクトルは、横方向に並ぶM個の要素を有しており、N個のM次元ベクトルは、縦方向に並んでおり、N個のM次元ベクトルは、各M次元ベクトルのM個の要素が前記横方向に沿って増減する回数が、縦方向に沿って単調に変化するように並んでおり、推定部は、N個のM次元ベクトルの前記縦方向に沿った並びの順番にM個の対象係数を並列駆動してM個の対象係数の値を推定する。N個のM次元ベクトルは、各M次元ベクトルのM個の要素が前記横方向に沿って増減する回数が、前記縦方向に沿って単調に変化するように並んでおり、各要素が横方向に沿って増減する周波数の順番に並んでいる。このように周波数の順番に並んだN個のM次元ベクトルにより駆動して対象係数を推定すると、対象係数のN個の線形和を求めるための期間の間に対象係数の値が変化したときに生じる本来の容量分布のピークとは異なる偽のピークを低減することができる。
また、上記の課題を解決するために、本発明に係る電子機器は、本発明に係る集積回路と、前記集積回路により制御されるタッチパネルと、前記タッチパネルに重ねられているか、前記タッチパネルを内蔵した表示パネルとを備えたことを特徴とする。
この特徴によれば、対象係数のN個の線形和を求めるための期間の間に対象係数の値が変化したときに生じる本来の容量分布のピークとは異なる偽のピークを低減することができる。
以上のように、本発明に係る線形系係数推定方法は、前記N個のM次元ベクトルの第1の順番に従って、前記M個の対象係数を並列駆動して前記M個の対象係数の第1推定値を推定する第1推定工程と、前記N個のM次元ベクトルの前記第1の順番と異なる第2の順番に従って、前記M個の対象係数を並列駆動して前記M個の対象係数の第2推定値を推定する第2推定工程と、前記第1推定値と前記第2推定値とを平均して前記M個の対象係数の値を推定する平均化工程とを包含するので、対象係数のN個の線形和を求めるための期間の間に対象係数の値が変化したときに生じる本来の容量分布のピークとは異なる偽のピークを低減することができる。
本発明の他の目的、特徴、および優れた点は、以下に示す記載によって十分分かるであろう。また、本発明の利点は、添付図面を参照した次の説明で明白になるであろう。
本発明者らは、先願の日本国特許出願(特願2011-022022号、出願日:2011年2月9日、優先日:2010年11月12日)において、直交符号系列に基づいてドライブラインを駆動して容量を推定するタッチパネルシステムを提案しており、本実施の形態は、この提案されたタッチパネルシステムを前提としている。よって、まず、本実施の形態の前提として上記先願で提案したタッチパネルシステムを中心に説明し、その後、本実施の形態に係る種々のタッチパネルシステムを説明することとする。
(本実施の形態の前提)
(複数の符号系列による駆動)
図1(a)は実施の形態の前提となるタッチパネルシステム51の構成を示す模式図であり、(b)はタッチパネルシステム51を駆動するための符号系列Hの構成を示す図である。図2(a)はM行×N列の行列Fの具体例を示す図であり、(b)はN行×M列の行列Hの具体例を示す図であり、(c)は行列Ebの具体例を示す図である。
図3(a)(b)は、上記直交符号系列による駆動により静電容量の値を推定する方法を説明するための図である。
(複数の符号系列による駆動)
図1(a)は実施の形態の前提となるタッチパネルシステム51の構成を示す模式図であり、(b)はタッチパネルシステム51を駆動するための符号系列Hの構成を示す図である。図2(a)はM行×N列の行列Fの具体例を示す図であり、(b)はN行×M列の行列Hの具体例を示す図であり、(c)は行列Ebの具体例を示す図である。
図3(a)(b)は、上記直交符号系列による駆動により静電容量の値を推定する方法を説明するための図である。
タッチパネルシステム51は、タッチパネル2とタッチパネルコントローラ53とを備えている。タッチパネル2は、M本のドライブラインDL1~DLMと、複数のセンスラインとを有している。但し、説明の簡潔化のために、センスラインは1本のセンスラインSLのみが設けられているものとして説明する。ドライブラインDL1~DLMとセンスラインSLとが交差する位置には、静電容量C1~CMが配置されている。
タッチパネルコントローラ53には、駆動部54が設けられている。駆動部54は、図1(b)の式8に示されるN行×M列(M≦N)の符号系列Hに基づいてドライブラインDL1~DLMを並列に駆動する。符号系列Hの要素が「1」であれば、駆動部54は電圧Vを印加し、要素が「-1」であれば、電圧-Vを印加する。
図1(b)の式7により表されるM行×N列の符号系列Fは、符号系列Hとの内積演算の結果、M行×M列の正方行列であって、対角成分の絶対値が、非対角成分の絶対値と比較して相対的に大きい行列Ebが得られる符号系列とする。図2(a)~(c)は、符号系列H、符号系列F、行列Ebの具体例であり、15周期のM系列から13個を切り出した場合(M=13≦N=15)の例である。図2(b)は、15行×13列の符号系列Hの具体例であり、図2(a)は、13行×15列の符号系列Fの具体例を示し、図2(c)は、13行×13列の正方行列Ebの具体例を示す。
本実施の形態では、符号系列Hとして、直交符号系列を使用することができるが、直交符号系列でない符号系列を使用することもできる。
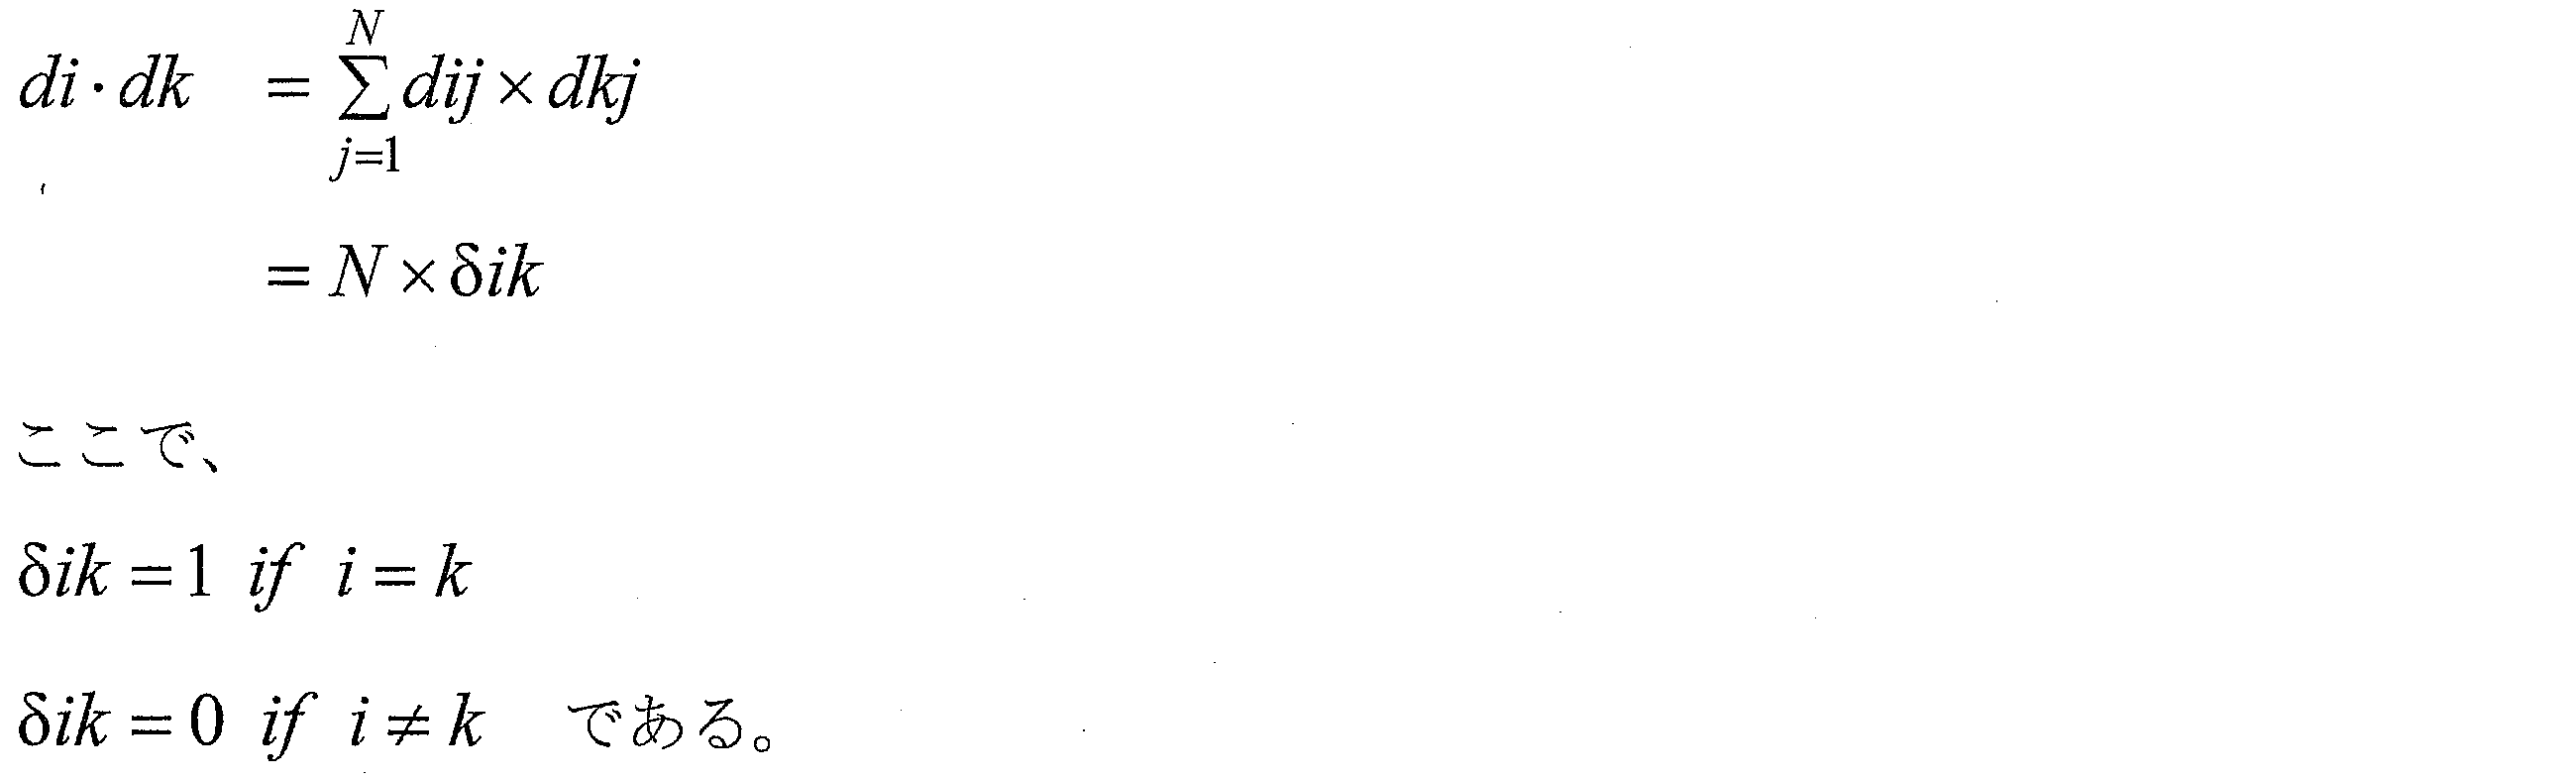
本明細書において、「直交符号系列」とは、符号長Nの符合系列di=(di1、di2、…、diN)(i=1、…、M)が、下記に示す条件を満足することをいうものとする。
「直交符号系列」の例としては、シルベスター(sylvester)法によって生成されるアダマール(Hadamard)行列、アダマール・ウォルシュ(Hadamard-Walsh)変換行列、及び離散コサイン変換(DCT、Discrete Cosine Transform)行列が挙げられる。
シルベスター法によるアダマール行列は、基本的な構造として、2行×2列の基本単位を作る。この基本単位の右上、左上、及び左下のビットは同一であり、右下はこれらのビット反転となっている。
次に、前述した2×2の基本要素を、右上、左上、右下、及び左下にブロックとして4つ合成して、4行×4列のビット配列の符号を作る。ここで、2×2の基本単位の作成と同様に、右下のブロックはビット反転となる。同様な手順で、8行×8列、16行×16列のビット配列の符号を生成する。これらの行列は、前述した本発明の「直交符号系列」の定義を満足する。図2に示される4行×4列の直交符号系列は、シルベスター法による4行×4列のアダマール行列である。
ここで、アダマール(Hadamard)行列とは、要素が1または-1のいずれかであり、かつ各行が互いに直交であるような正方行列をいう。すなわち、アダマール行列の任意の2つの行は、互いに垂直なベクトルを表す。
本発明に係る「直交符号系列」は、M次のアダマール行列から任意にN行取り出した行列を使用することができる(ここで、N≦Mである)。以下に述べるように、シルベスター法以外の方法によるアダマール行列も本発明に適用することができる。
シルベスター法によるN次のアダマール行列は、M=2のべき乗になるが、Mが4の倍数であれば、アダマール行列は存在するという予想が存在し、例えば、M=12のとき、及び、M=20のときにアダマール行列が存在する。これらのシルベスター法以外の方法によるアダマール行列も、本実施の形態に係る直交符号系列として使用することができる。
タッチパネルコントローラ53は、センスラインSLに対応する位置に配置された増幅器6を有している。増幅器6は、駆動部54により駆動された静電容量のセンスラインSLに沿った下記の式5により示される線形和Vi(i=1、2、…、M)を受け取って増幅する。

図3(a)の式9及び(b)の式10に示すように、測定値(線形和)V1、V2、…、VM、…、VNと符号系列Fとの行列演算を行うことにより、静電容量C1、C2、…、CMを近似推定することができる。
(直交符号系列による駆動における課題)
前述したように、センスラインSLに結合された複数個の静電容量C1、C2、…、CMを推定するためには、例えば図3に示すシルベスター法によるアダマール行列M1によりドライブラインを駆動して得られる複数個の線形和V1、V2、…、VMが必要になる。この複数個の線形和V1、V2、…、VMを求めている間に、推定対象の静電容量の値が変化してしまうという課題を本発明者らは見出した。
前述したように、センスラインSLに結合された複数個の静電容量C1、C2、…、CMを推定するためには、例えば図3に示すシルベスター法によるアダマール行列M1によりドライブラインを駆動して得られる複数個の線形和V1、V2、…、VMが必要になる。この複数個の線形和V1、V2、…、VMを求めている間に、推定対象の静電容量の値が変化してしまうという課題を本発明者らは見出した。
タッチパネルにタッチする指がタッチパネル上で移動すると、推定対象の静電容量の値が変化する。ドライブラインDL1~DLMは、タッチパネル上での指の移動が無視できる程度に高速にドライブしようとしているが、それでも、指の移動速度が速い場合は、ドライブラインをドライブして複数個の線形和V1、V2、…、VMを求めている間に、指の移動により静電容量が多少変化してしまう場合が生じる。そうすると、本来は、固定的な1つの静電容量の解が存在するという前提で、ドライブラインDL1~DLMを複数回ドライブしているが、解となるべき静電容量が少しずつ変化してゆく。このため、静電容量がそのように変化しているにもかかわらず、固定されているという前提で静電容量を推定すると、予期しない全く誤った解が得られるおそれがあるという課題を本発明者らは見出した。
この課題を解決するために、タッチパネル上での指の動きが無視できる程度により一層高速にドライブラインを駆動する方法が考えられる。しかしながら、より一層高速にドライブラインを駆動することは困難であり、ドライブラインの高速駆動の負担を軽減する方法が要望されている。本発明は、係る課題を解決するためになされたものである。
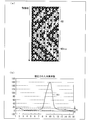
図4は、上記符号系列の一例を示す図である。図5(a)はタッチパネルシステム51が推定しようとする静電容量の分布の変化を示すグラフであり、(b)はタッチパネルシステム51による静電容量分布の推定結果を示すグラフである。
図4は、直交符号系列の一例としてシルベスター法による32行×32列のアダマール行列M1を示している。黒抜きにより示す要素は「-1」を示しており、白抜きにより示す要素は「1」を示している。
図5(a)は、アダマール行列M1の1行目から32行目までにより順番にドライブラインをドライブして線形和を求めていくが、この1行目から32行目までで32回ドライブしている間に、図5(a)のグラフに示すように、静電容量の分布が少しずつずれていく場合がある。図5(a)のグラフの横軸は静電容量のセンスラインに沿った32個の位置を表しており、縦軸は静電容量の変化を表している。線D1は、アダマール行列M1の1行目から8行目までで駆動したときの静電容量変化の分布の平均値を示している。線D2は、9行目~16行目で駆動したときの静電容量変化の分布の平均値を示しており、線D3は、17行目~24行目で駆動したときの分布の平均値を示している。線D4は、25行目~32行目で駆動したときの分布の平均値を示している。32行のアダマール行列M1を8行ずつ4つの組に分けて、それぞれの組でドライブしたときの容量分布の平均値を求めると、線D1~D4に示すように、矢印A1の方向にずれていった。
図5(a)に示すように、ドライブラインをドライブして複数個の線形和V1、V2、…、VMを求めている間に、指の移動により静電容量が変化してしまう場合に、線形和V1、V2、…、VMに逆行列Fを掛けて静電容量を推定すると、図5(b)のグラフの線D5に示すように、線D1~D4の4つの容量分布を平均した位置に大きなピークが現れるが、両端側にもいくつかの乱れ(偽のピーク)が現れるという問題がある。
もし、ドライブラインを32回ドライブする間に静電容量分布がずれず、時間的に固定された静電容量分布であるとすると、32回ドライブした後、線形和に行列Fを掛けると静電容量C1~C32の容量分布が正確に求められる。しかしながら、これは、ドライブラインを32回ドライブする間に静電容量分布が変化しないことが前提であり、ドライブする間に静電容量分布が変化すると、相当大きな誤差が生じるという課題がある。
(実施の形態1)
図6は、実施の形態1に係るタッチパネルシステム1の構成を示す模式図である。図7(a)は実施の形態1に係るシルベスター法によって生成される32行×32列のアダマール行列M1を示す図であり、(b)は実施の形態1に係るアダマール・ウォルシュ変換行列M2を示す図である。
図6は、実施の形態1に係るタッチパネルシステム1の構成を示す模式図である。図7(a)は実施の形態1に係るシルベスター法によって生成される32行×32列のアダマール行列M1を示す図であり、(b)は実施の形態1に係るアダマール・ウォルシュ変換行列M2を示す図である。
タッチパネルシステム1は、タッチパネル2とタッチパネルコントローラ3とを備えている。タッチパネル2は、M本のドライブラインDL1~DLMと、複数のセンスラインとを有している。説明の簡潔化のために、センスラインは1本のセンスラインSLのみを図6に示して説明する。ドライブラインDL1~DLMとセンスラインSLとが交差する位置には、静電容量C1~CM(対象係数)が配置されている。
タッチパネルコントローラ3には、駆動部4が設けられている。駆動部4は、図7(a)に示されるアダマール行列M1に基づいて、または、図7(b)のアダマール・ウォルシュ変換行列M2に基づいてドライブラインDL1~DLMを駆動する。アダマール行列M1またはアダマール・ウォルシュ変換行列M2の要素が「1」であれば、駆動部4は電圧Vを印加し、要素が「-1」であれば、電圧-Vを印加する。
タッチパネルコントローラ3は、センスラインSLに対応する位置に配置された増幅器6を有している。増幅器6は、その非反転入力端子と出力端子との間に設けられた積分容量Cfを有しており、駆動部4により駆動された静電容量のセンスラインSLに沿った線形和Vi(i=1、2、…、M)を受け取って増幅する。
タッチパネルコントローラ3には、推定部5が設けられている。推定部5は、増幅器6により増幅された線形和Vi(i=1、2、…、M)と、アダマール行列M1またはアダマール・ウォルシュ変換行列M2との内積演算に基づいて静電容量C1、C2、…、CMを推定する。
図7(a)に示すシルベスター法による32行×32列のアダマール行列M1を、1行の中で横方向に沿って増加から減少に転じる回数及び減少から増加に転じる回数を加算した値が少ない順番に行を並べ変えた行列が、図7(b)に示すアダマール・ウォルシュ変換行列M2である。即ち、アダマール・ウォルシュ変換行列M2は、1行の中で要素が横方向に沿って増加から減少に転じる回数及び減少から増加に転じる回数を加算した値を数え、その値が一番少ない行を1行目に配置し、その加算した値が縦方向に向かって増えるように行を並べ替えた行列である。この加算した値は、行の周波数成分(スペクトル)に対応している。
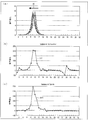
図8(a)はタッチパネルシステム1が推定しようとする静電容量の分布の変化モデルを示すグラフであり、(b)は上記静電容量分布を上記シルベスター法によるアダマール行列に基づいて推定したシミュレーション結果を示すグラフであり、(c)は上記静電容量分布を上記アダマール・ウォルシュ変換行列に基づいて推定したシミュレーション結果を示すグラフである。
アダマール行列M1またはアダマール・ウォルシュ変換行列M2の1行目から32行目までにより順番にドライブラインをドライブしている間に、図8(a)のグラフに示すように、静電容量の分布が少しずつずれていく。線D5は、1行目から8行目までで駆動したときの静電容量変化の分布の平均値を示している。線D6は、9行目~16行目で駆動したときの静電容量変化の分布の平均値を示しており、線D7は、17行目~24行目で駆動したときの分布の平均値を示している。線D8は、25行目~32行目で駆動したときの分布の平均値を示している。
図8(a)に示すように、1行目から32行目までで順番にドライブラインをドライブしている間に、静電容量分布が矢印A4に示す方向に変化していく場合に、図7(a)に示すシルベスター法によるアダマール行列で駆動すると、図8(b)に示すグラフにおける線D9に示すように、線D5~D8の4つの容量分布を平均した位置に大きなピークが現れるが、両端側にもいくつかの乱れ(偽のピーク)が現れる。
図7(b)に示すアダマール・ウォルシュ変換行列M2によりドライブラインを駆動すると、図8(c)の線D10に示すように、図8(a)の線D5~D8の4つの容量分布を平均した位置に大きなピークが現れ、その近くに小さな乱れは現れるが、大きな乱れ(偽のピーク)は現れない。
図9(a)は上記タッチパネルシステムが推定しようとする静電容量の分布の他の変化モデルを示すグラフであり、(b)は上記静電容量分布を上記シルベスター法によるアダマール行列に基づいて推定したシミュレーション結果を示すグラフであり、(c)は上記静電容量分布を上記アダマール・ウォルシュ変換行列に基づいて推定したシミュレーション結果を示すグラフである。図9(a)に示す場合は、静電容量分布は、矢印A4とは逆の矢印A5の方向にずれていく。線D11は、1行目から8行目までで駆動したときの静電容量変化の分布の平均値を示している。線D12は、9行目~16行目で駆動したときの静電容量変化の分布の平均値を示しており、線D13は、17行目~24行目で駆動したときの分布の平均値を示している。線D14は、25行目~32行目で駆動したときの分布の平均値を示している。
このように容量分布が変化する場合に、図7(a)に示すシルベスター法によるアダマール行列で駆動すると、図9(b)に示すグラフにおける線D15に示すように、図8(b)のグラフにおける線9を左右反転した線D15に示す静電容量分布を示す。
また、図7(b)に示すアダマール・ウォルシュ変換行列M2によりドライブラインを駆動すると、図9(c)の線D16に示すように、図8(c)のグラフにおける線D10を左右反転させた容量分布を示す。
また、図7(b)に示すアダマール・ウォルシュ変換行列M2によりドライブラインを駆動すると、図9(c)の線D16に示すように、図8(c)のグラフにおける線D10を左右反転させた容量分布を示す。
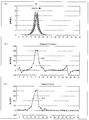
図10(a)はタッチパネルシステム1が推定しようとする静電容量の分布の変化を示すグラフであり、(b)は上記静電容量分布を上記シルベスター法によるアダマール行列に基づいて推定した実験結果を示すグラフであり、(c)は上記静電容量分布を上記アダマール・ウォルシュ変換行列に基づいて推定した実験結果を示すグラフである。図11(a)はタッチパネルシステム1が推定しようとする静電容量の分布の他の変化を示すグラフであり、(b)は上記静電容量分布を上記シルベスター法によるアダマール行列に基づいて推定した実験結果を示すグラフであり、(c)は上記静電容量分布を上記アダマール・ウォルシュ変換行列に基づいて推定した実験結果を示すグラフである。
図10(a)は、32行×32列のアダマール行列による32回のドライブラインの駆動によるそれぞれの容量分布を32本の線によって表している。1回目の駆動から32回目の駆動まで、容量分布は矢印A6の方向に少しずつ移動している。静電容量は、実際には離散的に配置されており、指が、例えば、容量に対応する位置にあるときは、静電容量分布は、その指に対応する容量の位置に1個のピークが生じる。指が、離散的に配置されて隣接する2つの容量の間に位置するときは、静電容量分布は、その隣接する2つの容量に対応する位置に2つのピークが分散して生じる。このように、実際に想定される構成により実験した。
図7(a)に示すシルベスター法によるアダマール行列M1で駆動すると、図10(b)に示すグラフにおける線D17に示すように、図10(a)に示す容量分布を平均した位置に大きなピークが現れるが、両端側にもいくつかの乱れ(偽のピーク)が現れる。
図7(b)に示すアダマール・ウォルシュ変換行列M2によりドライブラインを駆動すると、図10(c)の線D18に示すように、図10(a)に示す容量分布を平均した位置に大きなピークが現れ、その近くに小さな乱れは現れるが、大きな乱れ(偽のピーク)は現れない。
タッチパネルに細いペンで入力するような場合に、ペンによる小さな静電容量変化が、図10(b)に示されるシルベスター法アダマール行列M1による容量分布の両端の偽のピークに埋もれてしまうという問題がある。
図11(a)は、32行×32列のアダマール行列による32回のドライブラインの駆動によるそれぞれの容量分布を32本の線によって表しており、1回目の駆動から32回目の駆動まで、容量分布は矢印A6とは逆の矢印A7の方向に少しずつ移動している。
このように容量分布が逆の方向に変化する場合に、図7(a)に示すシルベスター法によるアダマール行列M1で駆動すると、図11(b)に示すグラフにおける線D19に示すように、図10(b)のグラフにおける線D17を左右反転した線D19に示す静電容量分布を示す。
このように容量分布が逆の方向に変化する場合に、図7(a)に示すシルベスター法によるアダマール行列M1で駆動すると、図11(b)に示すグラフにおける線D19に示すように、図10(b)のグラフにおける線D17を左右反転した線D19に示す静電容量分布を示す。
また、図7(b)に示すアダマール・ウォルシュ変換行列M2によりドライブラインを駆動すると、図11(c)の線D20に示すように、図10(c)のグラフにおける線D18を左右反転させた容量分布を示す。
図10(a)及び図11(a)に示すように、静電容量分布が変化する方向が逆になると、図10(b)及び図11(b)に示すように、偽のノイズが生じる処が逆になることに本発明者らは着目し、さらに、静電容量分布が変化する方向が同じであるときに、直交符号系列により駆動する順番を逆にすれば、静電容量分布の変化方向を逆にすることと同じ効果が得られるはずであるとする知見を本発明者らは獲得した。例えば、図7(a)に示すシルベスター法のアダマール行列M1により矢印A3の方向からドライブラインを駆動すれば、矢印A2の方向から駆動した場合に比べて、偽のノイズが生じる位置が左右逆になるなずであると考えられる。
図12(a)は実施の形態1に係る直交符号系列による駆動順番を2回目に反転させて駆動する方法を示す図であり、(b)は上記方法による駆動に基づいて推定した静電容量分布の推定結果を示すグラフである。図13は、タッチパネルシステム1が推定しようとする静電容量の分布の時間的変動を示すグラフである。
図12(a)は、16行×16列のアダマール行列による16回のドライブラインの駆動によるそれぞれの容量分布を16本の線によって表しており、1回目の駆動から16回目の駆動まで、静電容量分布は矢印A8の方向に少しずつ移動している。
まず、駆動部4(図6)は、シルベスター法による16行×16列のアダマール行列M3の1行目から始まり16行目で終了する順番(第1の順番)に基づいて、静電容量C1~C16が結合されたドライブラインDL1~DL16を16回並列駆動する。そして、増幅部6は、センスラインSLから供給される静電容量C1~C16の16個の第1線形和出力を増幅する。次に、推定部5は、増幅部6により増幅された16個の第1線形和出力と、16行×16列のアダマール行列M3との内積演算により、静電容量C1~C16の第1推定値を推定する。なお、これは、図6に示す構成において、M=16の場合に相当する。
その後、駆動部4は、アダマール行列M3の第1行~第16行を逆の順番(第2の順番)に並べなおしたアダマール行列M3revに基づいて、静電容量C1~C16が結合されたドライブラインDL1~DL16を16回並列駆動する。そして、増幅部6は、センスラインSLから供給される静電容量C1~C16の16個の第2線形和出力を増幅する。次に、推定部5は、増幅部6により増幅された16個の第2線形和出力と、16行×16列のアダマール行列M3revとの内積演算により、静電容量C1~C16の第2推定値を推定する。その後、平均化部17は、第1推定値と前記第2推定値とを平均して16個の静電容量の値を推定する。
図14(a)は直交符号系列による他の駆動方法を示す図であり、(b)は上記方法による駆動に基づいて推定した静電容量分布の推定結果を示すグラフである。アダマール行列M3及びM3revによりドライブラインを駆動したときの図12(b)の線D21により示される静電容量分布における偽のピークの振幅P1は、図14(a)に示すようにシルベスター法による16行×16列のアダマール行列M3による駆動を2回繰り返してそれを平均化したときに生じる図14(b)の線D22により示される静電容量分布における偽のピーク値の振幅P2よりも縮小する。
このように、直交符号系列によるドライブの順番を逆にすることにより、静電容量分布における偽のピークの位置は、ほぼ左右反転する。このため、毎回、ドライブの順番を逆にして得られた推定値を加算平均することにより、静電容量分布における偽のピークを相殺して低減することができる。
図15(a)は実施の形態1に係る直交符号系列による駆動順番をランダムに変更して駆動する方法を示す図であり、(b)は上記方法による駆動に基づいて推定した静電容量分布の推定結果を示すグラフである。
まず、駆動部4(図6)は、シルベスター法による16行×16列のアダマール行列M3の1行目から16行目をランダムな順番(第1の順番)に並べ替えた行列M4ram1に基づいて、静電容量C1~C16が結合されたドライブラインDL1~DL16を16回並列駆動する。そして、増幅部6は、センスラインSLから供給される静電容量C1~C16の16個の第1線形和出力を増幅する。次に、推定部5は、増幅部6により増幅された16個の第1線形和出力と、16行×16列の行列M4ram1との内積演算により、静電容量C1~C16の第1推定値を推定する。
その後、駆動部4は、アダマール行列M3の1行目から16行目を他のランダムな順番(第2の順番)に並べ替えた他の行列M4ram2に基づいて、静電容量C1~C16が結合されたドライブラインDL1~DL16を16回並列駆動する。そして、増幅部6は、センスラインSLから供給される静電容量C1~C16の16個の第2線形和出力を増幅する。次に、推定部5は、増幅部6により増幅された16個の第2線形和出力と、16行×16列のアダマール行列M4ram2との内積演算により、静電容量C1~C16の第2推定値を推定する。その後、平均化部17は、第1推定値と前記第2推定値とを平均して16個の静電容量の値を推定する。
図15(b)に示すように、ランダムに並べ替えた行列M4ram1及びM4ram2によりドライブラインを駆動したときの図15(b)の線D23により示される静電容量分布における偽のピークの振幅P3は、図14(b)の線D22により示される静電容量分布における偽のピーク値の振幅P2よりも縮小する。
このように、駆動順番をランダムに変更して駆動すると、ノイズの位置が分散し、平均化すると、偽のピーク値の振幅を低減することができる。
(実施の形態2)
図16は、実施の形態2に係る直交符号系列の性質を説明するための図である。図17は、実施の形態2に係るアダマール・ウォルシュ変換行列による駆動方法を説明するための図であり、(b)は上記方法による駆動に基づいて推定した静電容量分布の推定結果を示すグラフである。実施の形態2に係るタッチパネルシステムは、図6で前述したタッチパネルシステム1と同様である。
図16は、実施の形態2に係る直交符号系列の性質を説明するための図である。図17は、実施の形態2に係るアダマール・ウォルシュ変換行列による駆動方法を説明するための図であり、(b)は上記方法による駆動に基づいて推定した静電容量分布の推定結果を示すグラフである。実施の形態2に係るタッチパネルシステムは、図6で前述したタッチパネルシステム1と同様である。
実施の形態2では、直交符号系列を空間周波数の順番に並べ替えた行列によりドライブラインを駆動する。実施の形態2で使用する直交符号系列は、互いに直交するN個のM次元ベクトル(N≦M)を有しており、各M次元ベクトルは、横方向に並ぶM個の要素を有しており、N個のM次元ベクトルは、縦方向に並んでいる。
そして、これらのN個のM次元ベクトルは、各M次元ベクトルのM個の要素が前記横方向に沿って増加から減少に転じる回数、及び減少から増加に転ずる回数を加算した値が、縦方向に沿って単調に変化するように並んでいる。
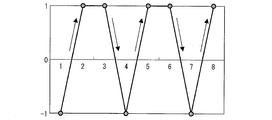
「各M次元ベクトルのM個の要素が前記横方向に沿って増加から減少に転じる回数、及び減少から増加に転ずる回数を加算した値」(以下、「増減加算値」という)の意義を説明する。例えば、「0、1、1、0、1、1、0、1」という8次元ベクトルを考えると、図16に示すように、この8次元ベクトルは、最初の「0」から2番目の「1」に増大し、3番目の「1」から4番目の「0」に減少しているので、この1番目から4番目の「0、1、1、0」において増大から減少に転じている。そして、3番目の「1」から4番目の「0」に減少し、4番目の「0」から5番目の「1」に増大しているので、この3番目から5番目の「1、0、1」において減少から増大に転じている。次に、4番目の「0」から5番目の「1」に増大し、6番目の「1」から7番目の「0」に減少しているので、4番目から7番目の「0、1、1、0」において増大から減少に転じている。そして、6番目の「1」から7番目の「0」に減少し、7番目の「0」から8番目の「1」に増大しているので、6番目から8番目の「1、0、1」において減少から増大に転じている。
従って、この「0、1、1、0、1、1、0、1」という8次元ベクトルの増減加算値は、4である。
実施の形態2で使用する直交符号系列の典型的な例は、アダマール・ウォルシュ変換行列である。図17(a)に示す16行×16列のアダマール・ウォルシュ変換行列M5は、1行目の要素はすべて「1」であり、増減加算値はゼロである。2行目の要素は、最初の8個が「1」であり、残りの8個が「-1」であり、従って、増減加算値はゼロである。
3行目の要素は、最初の4個が「1」であり、次の8個が「-1」であり、次の4個が「1」であり、従って、増減加算値は1である。
4行目の要素は、最初の4個が「1」であり、次の4個が「-1」であり、次の4個が「1」であり、残りの4個が「-1」であり、従って、増減加算値は2である。5行目の要素は、最初の2個が「1」であり、次の4個が「-1」であり、次の4個が「1」であり、次の4個が「-1」であり、残りの2個が「1」であり、従って、増減加算値は3である。
このように、16行×16列のアダマール・ウォルシュ変換行列の各行の要素の増減加算値は、3行目から1行ごとに1ずつ増大してゆき、最終の16行目の要素は、奇数番目の8個が「1」であり、偶数番目の8個が「-1」であり、増減加算値は14である。
以上のように、図17(a)に示す16行×16列のアダマール・ウォルシュ変換行列M5は、各行ベクトルの16個の要素の横方向に沿った増減加算値が、縦方向に沿って単調に増加するように並んでいる。
タッチパネルシステム1は、16行×16列のアダマール・ウォルシュ変換行列M5により2回駆動する。まず、駆動部4(図6)は、16行×16列のアダマール・ウォルシュ変換行列M5に基づいて、静電容量C1~C16が結合されたドライブラインDL1~DL16を16回並列駆動する。そして、増幅部6は、センスラインSLから供給される静電容量C1~C16の16個の第1線形和出力を増幅する。次に、推定部5は、増幅部6により増幅された16個の第1線形和出力と、16行×16列のアダマール・ウォルシュ変換行列M5との内積演算により、静電容量C1~C16の第1推定値を推定する。
その後、駆動部4は、アダマール・ウォルシュ変換行列M5に基づいて、静電容量C1~C16が結合されたドライブラインDL1~DL16を16回並列駆動する。そして、増幅部6は、センスラインSLから供給される静電容量C1~C16の16個の第2線形和出力を増幅する。次に、推定部5は、増幅部6により増幅された16個の第2線形和出力と、アダマール・ウォルシュ変換行列M5との内積演算により、静電容量C1~C16の第2推定値を推定する。その後、平均化部17は、第1推定値と前記第2推定値とを平均して16個の静電容量の値を推定する(単調変化推定工程)。
アダマール・ウォルシュ変換行列M5によりドライブラインを駆動したときの図17(b)の線D24により示される静電容量分布における偽のピークの振幅P4は、図14(b)の線D22により示される静電容量分布における偽のピーク値の振幅P2よりも縮小する。
図18は、実施の形態2に係る8行×8列のDCT行列M6による駆動方法を説明するための図である。DCT行列M6も、アダマール・ウォルシュ変換行列と同様に、N個のM次元ベクトルであって、各M次元ベクトルのM個の要素の増減加算値が、縦方向に沿って単調に増加するように並んでいる行列に相当し、実施の形態3の直交符号系列として使用することができる。
まず、駆動部4(図6)は、8行×8列のDCT行列M6に基づいて、静電容量C1~C8が結合されたドライブラインDL1~DL8を8回並列駆動する。そして、増幅部6は、センスラインSLから供給される静電容量C1~C8の8個の第1線形和出力を増幅する。次に、推定部5は、増幅部6により増幅された8個の第1線形和出力と、8行×8列のDCT行列M6との内積演算により、静電容量C1~C8の第1推定値を推定する。
その後、駆動部4は、DCT行列M6に基づいて、静電容量C1~C8が結合されたドライブラインDL1~DL8を8回並列駆動する。そして、増幅部6は、センスラインSLから供給される静電容量C1~C8の8個の第2線形和出力を増幅する。次に、推定部5は、増幅部6により増幅された8個の第2線形和出力と、DCT行列M6との内積演算により、静電容量C1~C8の第2推定値を推定する。その後、平均化部17は、第1推定値と前記第2推定値とを平均して8個の静電容量C1~C8の値を推定する。
なお、8行×8列のDCT行列M6の例を示したが、本発明はこれに限定されない。例えば、8行×K列(K<8)のDCT行列M6の部分行列を使用するように構成しても良い。
図19(a)は実施の形態2に係るアダマール・ウォルシュ変換行列による駆動順番を2回目に反転させて駆動する方法を示す図であり、(b)は上記方法による駆動に基づいて推定した静電容量分布の推定結果を示すグラフである。
アダマール・ウォルシュ変換行列による駆動順番を、実施の形態1に係る方法のように2回目に反転させて駆動してもよい。
まず、駆動部4(図6)は、16行×16列のアダマール・ウォルシュ変換行列M5に基づいて、静電容量C1~C16が結合されたドライブラインDL1~DL16を16回並列駆動する。そして、増幅部6は、センスラインSLから供給される静電容量C1~C16の16個の第1線形和出力を増幅する。次に、推定部5は、増幅部6により増幅された16個の第1線形和出力と、16行×16列のアダマール・ウォルシュ変換行列M5との内積演算により、静電容量C1~C16の第1推定値を推定する。
その後、駆動部4は、アダマール・ウォルシュ変換行列M5の第1行~第16行を逆に並べなおしたアダマール行列M5revに基づいて、静電容量C1~C16が結合されたドライブラインDL1~DL16を16回並列駆動する。そして、増幅部6は、センスラインSLから供給される静電容量C1~C16の16個の第2線形和出力を増幅する。次に、推定部5は、増幅部6により増幅された16個の第2線形和出力と、16行×16列のアダマール行列M5revとの内積演算により、静電容量C1~C16の第2推定値を推定する。その後、平均化部17は、第1推定値と前記第2推定値とを平均して16個の静電容量の値を推定する。
アダマール・ウォルシュ変換行列M5及びM5revによりドライブラインを駆動したときの図19(b)の線D25により示される静電容量分布における偽のピークの振幅P5は、アダマール・ウォルシュ変換行列M5によりドライブラインを駆動したときの図17(b)の線D24により示される静電容量分布における偽のピークの振幅P4よりもさらに縮小する。
なお、16行×16列のアダマール・ウォルシュ変換行列M5の例を示したが、本発明はこれに限定されない。例えば、16行×K列(K<16)のアダマール・ウォルシュ変換行列M5の部分行列を使用するように構成しても良い。
(実施の形態3)
図20は、実施の形態3に係る携帯電話機7の構成を示す機能ブロック図である。携帯電話機7は、CPU10と、RAM12と、ROM11と、カメラ13と、マイクロフォン14と、スピーカ15と、操作キー16と、表示パネル18と、表示制御回路9と、タッチパネルシステム1とを備えている。各構成要素は、相互にデータバスによって接続されている。
図20は、実施の形態3に係る携帯電話機7の構成を示す機能ブロック図である。携帯電話機7は、CPU10と、RAM12と、ROM11と、カメラ13と、マイクロフォン14と、スピーカ15と、操作キー16と、表示パネル18と、表示制御回路9と、タッチパネルシステム1とを備えている。各構成要素は、相互にデータバスによって接続されている。
CPU10は、携帯電話機7の動作を制御する。CPU10は、たとえばROM11に格納されたプログラムを実行する。操作キー16は、携帯電話機7のユーザによる指示の入力を受ける。RAM12は、CPU10によるプログラムの実行により生成されたデータ、または操作キー16を介して入力されたデータを揮発的に格納する。ROM11は、データを不揮発的に格納する。
また、ROM11は、EPROM(Erasable Programmable Read-Only Memory)やフラッシュメモリなどの書込みおよび消去が可能なROMである。なお、図20には示していないが、携帯電話機7が、他の電子機器に有線により接続するためのインターフェイス(IF)を備える構成としてもよい。
カメラ13は、ユーザの操作キー16の操作に応じて、被写体を撮影する。なお、撮影された被写体の画像データは、RAM12や外部メモリ(たとえば、メモリカード)に格納される。マイクロフォン14は、ユーザの音声の入力を受付ける。携帯電話機7は、当該入力された音声(アナログデータ)をデジタル化する。そして、携帯電話機7は、通信相手(たとえば、他の携帯電話機)にデジタル化した音声を送る。スピーカ15は、たとえば、RAM12に記憶された音楽データなどに基づく音を出力する。
タッチパネルシステム1は、タッチパネル2とタッチパネルコントローラ3とを有している。CPU10は、タッチパネルシステム1の動作を制御する。CPU10は、例えばROM11に記憶されたプログラムを実行する。RAM12は、CPU10によるプログラムの実行により生成されたデータを揮発的に格納する。ROM11は、データを不揮発的に格納する。
表示パネル8は、表示制御回路9により、ROM11、RAM12に格納されている画像を表示する。表示パネル8は、タッチパネル2に重ねられているか、タッチパネル2を内蔵している。
また、本発明は、以下のように記載することができる。
本実施の形態に係る線形系係数推定方法では、前記第2の順番は、前記第1の順番を逆に並べた順番であることが好ましい。
上記構成によれば、第1の順番による推定値と第1の順番を逆に並べた第2の順番による推定値とを加算平均するので、対象係数のN個の線形和を求めるための期間の間に対象係数の値が変化したときに生じる本来の容量分布のピークとは異なる偽のピークを低減することができる。
本実施の形態に係る線形系係数推定方法では、前記第2の順番は、前記第1の順番をランダムに変更した順番であることが好ましい。
上記構成によれば、第1の順番による推定値と第1の順番をランダムに変更した第2の順番による推定値とを加算平均するので、対象係数のN個の線形和を求めるための期間の間に対象係数の値が変化したときに生じる本来の容量分布のピークとは異なる偽のピークを分散させることができ、加算平均することで偽のピーク値を低減することができる。
本実施の形態に係る線形系係数推定方法では、前記N個のM次元ベクトルは、アダマール・ウォルシュ(Hadamard-Walsh)変換行列を構成することが好ましい。
上記構成によれば、アダマール・ウォルシュ変換行列は、シルベスター(sylvester)法によって生成されるアダマール(Hadamard)行列を、各要素が横方向に沿って増減する周波数の順番に並べ替えることにより得られる。従って、簡単な構成により、対象係数のN個の線形和を求めるための期間の間に対象係数の値が変化したときに生じる本来の容量分布のピークとは異なる偽のピークを低減することができる。
本実施の形態に係る線形系係数推定方法では、前記N個のM次元ベクトルは、離散コサイン変換(DCT、Discrete Cosine Transform)を構成することが好ましい。
離散コサイン変換は、本来、各要素が横方向に沿って増減する周波数の順番に並べられた行列である。従って、簡単な構成により、対象係数のN個の線形和を求めるための期間の間に対象係数の値が変化したときに生じる本来の容量分布のピークとは異なる偽のピークを低減することができる。
本実施の形態に係る線形系係数推定方法では、前記N個のM次元ベクトルは、アダマール・ウォルシュ変換行列の部分行列を構成することが好ましい。
アダマール・ウォルシュ変換行列は、正方行列であるため、N個のM次元ベクトル(N=M)に適用されるが、アダマール・ウォルシュ変換行列の部分行列を構成することにより、N個のM次元ベクトル(N≠M)に適用することができる。
本実施の形態に係る線形系係数推定方法では、前記N個のM次元ベクトルは、離散コサイン変換の部分行列を構成することが好ましい。
離散コサイン変換の部分行列を構成することにより、N個のM次元ベクトル(N≠M)に適用することができる。
本実施の形態に係る線形系係数推定方法では、前記単調変化推定工程は、前記N個のM次元ベクトルの第1の順番に従って、前記M個の対象係数を並列駆動して前記M個の対象係数の第1推定値を推定する第1推定工程と、前記N個のM次元ベクトルの前記第1の順番を逆に並べた第2の順番に従って、前記M個の対象係数を並列駆動して前記M個の対象係数の第2推定値を推定する第2推定工程と、前記第1推定値と前記第2推定値とを平均化して前記M個の対象係数の値を推定する平均化工程とを包含することが好ましい。
上記構成により、静電容量の推定結果は、毎回走査方向を変えて加算平均される。従って、本来の容量分布のピークとは異なる偽のピークをより一層低減することができる。
本発明は上述した各実施形態に限定されるものではなく、請求項に示した範囲で種々の変更が可能であり、異なる実施形態にそれぞれ開示された技術的手段を適宜組み合わせて得られる実施形態についても本発明の技術的範囲に含まれる。
発明の詳細な説明の項においてなされた具体的な実施形態または実施例は、あくまでも、本発明の技術内容を明らかにするものであって、そのような具体例にのみ限定して狭義に解釈されるべきものではなく、本発明の精神と次に記載する特許請求事項の範囲内で、いろいろと変更して実施することができるものである。
本発明は、複数の符号系列に基づいてドライブラインを駆動して、マトリックス状に構成された静電容量の容量値を推定または検出する線形系係数推定方法、集積回路、及び電子機器に利用することができる。
1 タッチパネルシステム
2 タッチパネル
3 タッチパネルコントローラ
4 駆動部
5 推定部
6 増幅器
7 携帯電話機
C1、C2、C3、…、CM 静電容量(対象係数)
2 タッチパネル
3 タッチパネルコントローラ
4 駆動部
5 推定部
6 増幅器
7 携帯電話機
C1、C2、C3、…、CM 静電容量(対象係数)
Claims (12)
- N個のM次元ベクトルにより、M個の対象係数を並列駆動して前記対象係数のN個の線形和を得て、前記対象係数のN個の線形和とM個のN次元ベクトルとの内積演算により前記M個の対象係数の値を推定する線形系係数推定方法であって、
前記N個のM次元ベクトルの第1の順番に従って、前記M個の対象係数を並列駆動して前記M個の対象係数の第1推定値を推定する第1推定工程と、
前記N個のM次元ベクトルの前記第1の順番と異なる第2の順番に従って、前記M個の対象係数を並列駆動して前記M個の対象係数の第2推定値を推定する第2推定工程と、
前記第1推定値と前記第2推定値とを平均して前記M個の対象係数の値を推定する平均化工程とを包含することを特徴とする線形系係数推定方法。 - 前記第2の順番は、前記第1の順番を逆に並べた順番である請求項1記載の線形系係数推定方法。
- 前記第2の順番は、前記第1の順番をランダムに変更した順番である請求項1記載の線形系係数推定方法。
- N個のM次元ベクトルにより、M個の対象係数を並列駆動して前記対象係数のN個の線形和を得て、前記対象係数のN個の線形和とN個のM次元ベクトルとの内積演算により前記M個の対象係数の値を推定する線形系係数推定方法であって、
各M次元ベクトルは、横方向に並ぶM個の要素を有しており、
前記N個のM次元ベクトルは、縦方向に並んでおり、
前記N個のM次元ベクトルは、各M次元ベクトルのM個の要素が前記横方向に沿って増加から減少に転ずる回数と、減少から増加に転ずる回数とを加算した値が、前記縦方向に沿って単調に変化するように並んでおり、
前記N個のM次元ベクトルの前記縦方向に沿った並びの順番に前記M個の対象係数を並列駆動して前記M個の対象係数の値を推定する単調変化推定工程を包含することを特徴とする線形系係数推定方法。 - 前記N個のM次元ベクトルは、アダマール・ウォルシュ(Hadamard-Walsh)変換行列を構成する請求項4記載の線形系係数推定方法。
- 前記N個のM次元ベクトルは、離散コサイン変換(DCT、Discrete Cosine Transform)を構成する請求項4記載の線形系係数推定方法。
- 前記N個のM次元ベクトルは、アダマール・ウォルシュ変換行列の部分行列を構成する請求項4記載の線形系係数推定方法。
- 前記N個のM次元ベクトルは、離散コサイン変換の部分行列を構成する請求項4記載の線形系係数推定方法。
- 前記単調変化推定工程は、前記N個のM次元ベクトルの第1の順番に従って、前記M個の対象係数を並列駆動して前記M個の対象係数の第1推定値を推定する第1推定工程と、
前記N個のM次元ベクトルの前記第1の順番を逆に並べた第2の順番に従って、前記M個の対象係数を並列駆動して前記M個の対象係数の第2推定値を推定する第2推定工程と、
前記第1推定値と前記第2推定値とを平均化して前記M個の対象係数の値を推定する平均化工程とを包含する請求項4記載の線形系係数推定方法。 - N個のM次元ベクトルにより、M個の対象係数を並列駆動する駆動部と、前記駆動部による並列駆動に基づいて、前記対象係数のN個の線形和を得て、前記対象係数のN個の線形和とN個のM次元ベクトルとの内積演算により前記M個の対象係数の値を推定する推定部とを備えた集積回路であって、
前記駆動部は、前記N個のM次元ベクトルの第1の順番に従って、前記M個の対象係数を並列駆動し、
前記推定部は、前記第1の順番による並列駆動に基づいて前記M個の対象係数の第1推定値を推定し、
前記駆動部は、前記N個のM次元ベクトルの前記第1の順番と異なる第2の順番に従って、前記M個の対象係数を並列駆動し、
前記推定部は、前記第2の順番による並列駆動に基づいて前記M個の対象係数の第2推定値を推定し、
前記第1推定値と前記第2推定値とを平均して前記M個の対象係数の値を推定する平均化部を設けたことを特徴とする集積回路。 - N個のM次元ベクトルにより、M個の対象係数を並列駆動する駆動部と、前記駆動部による並列駆動に基づいて、前記対象係数のN個の線形和を得て、前記対象係数のN個の線形和とN個のM次元ベクトルとの内積演算により前記M個の対象係数の値を推定する推定部とを備えた集積回路であって、
各M次元ベクトルは、横方向に並ぶM個の要素を有しており、
前記N個のM次元ベクトルは、縦方向に並んでおり、
前記N個のM次元ベクトルは、各M次元ベクトルのM個の要素が前記横方向に沿って増加から減少に、及び減少から増加に転ずる回数が、前記縦方向に沿って単調に変化するように並んでおり、
前記推定部は、前記N個のM次元ベクトルの前記縦方向に沿った並びの順番に前記M個の対象係数を並列駆動して前記M個の対象係数の値を推定することを特徴とする集積回路。 - 請求項10または請求項11記載の集積回路と、
前記集積回路により制御されるタッチパネルと、
前記タッチパネルに重ねられているか、前記タッチパネルを内蔵した表示パネルとを備えたことを特徴とする電子機器。
Priority Applications (1)
| Application Number | Priority Date | Filing Date | Title |
|---|---|---|---|
| US14/112,844 US9395856B2 (en) | 2011-05-25 | 2012-01-18 | Linear system coefficient estimating method, integrated circuit, and electronic device |
Applications Claiming Priority (2)
| Application Number | Priority Date | Filing Date | Title |
|---|---|---|---|
| JP2011117385A JP5079903B1 (ja) | 2011-05-25 | 2011-05-25 | 静電容量推定方法、集積回路、及び電子機器 |
| JP2011-117385 | 2011-05-25 |
Publications (1)
| Publication Number | Publication Date |
|---|---|
| WO2012160839A1 true WO2012160839A1 (ja) | 2012-11-29 |
Family
ID=47216928
Family Applications (1)
| Application Number | Title | Priority Date | Filing Date |
|---|---|---|---|
| PCT/JP2012/050918 Ceased WO2012160839A1 (ja) | 2011-05-25 | 2012-01-18 | 線形系係数推定方法、集積回路、及び電子機器 |
Country Status (3)
| Country | Link |
|---|---|
| US (1) | US9395856B2 (ja) |
| JP (1) | JP5079903B1 (ja) |
| WO (1) | WO2012160839A1 (ja) |
Cited By (1)
| Publication number | Priority date | Publication date | Assignee | Title |
|---|---|---|---|---|
| US9727187B2 (en) | 2015-04-16 | 2017-08-08 | Sharp Kabushiki Kaisha | Capacitive touch panel with balanced parallel driving |
Families Citing this family (20)
| Publication number | Priority date | Publication date | Assignee | Title |
|---|---|---|---|---|
| JP5231605B2 (ja) * | 2011-06-10 | 2013-07-10 | シャープ株式会社 | タッチパネルコントローラ、及びこれを用いた電子機器 |
| WO2014129091A1 (ja) * | 2013-02-25 | 2014-08-28 | シャープ株式会社 | タッチパネルコントローラ、集積回路、タッチパネル装置、及び、電子機器 |
| US20140267143A1 (en) * | 2013-03-15 | 2014-09-18 | Synaptics Incorporated | System and method for a transcapacitive proximity sensing device |
| JP5973072B2 (ja) * | 2013-06-20 | 2016-08-23 | シャープ株式会社 | タッチパネルコントローラ、集積回路、タッチパネル装置、および電子機器 |
| WO2014208174A1 (ja) * | 2013-06-25 | 2014-12-31 | シャープ株式会社 | タッチパネルコントローラ、タッチパネルシステム、および電子機器 |
| KR20150017123A (ko) * | 2013-08-06 | 2015-02-16 | 삼성디스플레이 주식회사 | 터치 센서 및 그의 구동방법 |
| US10013113B2 (en) | 2013-08-19 | 2018-07-03 | Touchsensor Technologies, Llc | Capacitive sensor filtering apparatus, method, and system |
| US9569054B2 (en) | 2013-08-19 | 2017-02-14 | Touchsensor Technologies, Llc | Capacitive sensor filtering apparatus, method, and system |
| BR112015032365A2 (pt) | 2013-08-19 | 2017-07-25 | Touchsensor Tech Llc | método de filtração de sensor capacitivo |
| KR20150086953A (ko) * | 2014-01-21 | 2015-07-29 | 삼성디스플레이 주식회사 | 터치 센서 및 이를 포함하는 표시 장치 |
| AU2015303987A1 (en) * | 2014-08-19 | 2017-02-16 | Touchsensor Technologies, Llc | Capacitive sensor filtering apparatus, method, and system |
| JP2016081486A (ja) * | 2014-10-22 | 2016-05-16 | アルプス電気株式会社 | 静電容量式検知装置 |
| CN107111412B (zh) * | 2015-01-16 | 2020-04-21 | 上海思立微电子科技有限公司 | 用于电容式感测的系统和方法 |
| JP6430331B2 (ja) | 2015-05-18 | 2018-11-28 | アルプス電気株式会社 | 入力装置、入力装置の制御方法および入力装置の制御方法をコンピュータに実行させるプログラム |
| KR101728086B1 (ko) * | 2016-01-20 | 2017-04-18 | 성균관대학교산학협력단 | 정전 용량 터치센서 장치 및 감지 방법 |
| TWI613636B (zh) * | 2016-12-28 | 2018-02-01 | 財團法人工業技術研究院 | 驅動裝置以及驅動方法 |
| US10877608B2 (en) | 2018-06-21 | 2020-12-29 | Microchip Technology Incorporated | Parallel acquisition and measurement of capacitive sensor channels, and related systems, methods, and devices |
| JP7195443B2 (ja) * | 2019-08-05 | 2022-12-23 | アルプスアルパイン株式会社 | 演算装置、入力装置、演算方法、およびプログラム |
| CN116935450A (zh) * | 2022-03-29 | 2023-10-24 | 上海思立微电子科技有限公司 | 一种指纹检测方法及指纹模组 |
| CN116882355B (zh) * | 2023-09-05 | 2023-11-07 | 吉林大学 | 基于多维驱动器阵列的opa驱动电路、电子设备 |
Citations (4)
| Publication number | Priority date | Publication date | Assignee | Title |
|---|---|---|---|---|
| JP2009181570A (ja) * | 2007-12-21 | 2009-08-13 | Sensitive Object | 少なくとも2個のインパクトの位置を決定するための方法 |
| WO2009107415A1 (ja) * | 2008-02-27 | 2009-09-03 | セイコーインスツル株式会社 | 近接検出装置と近接検出方法 |
| JP2011003036A (ja) * | 2009-06-18 | 2011-01-06 | Wacom Co Ltd | 指示体検出装置及び指示体検出方法 |
| JP2011047774A (ja) * | 2009-08-26 | 2011-03-10 | Seiko Instruments Inc | 近接検出装置と近接検出方法 |
Family Cites Families (2)
| Publication number | Priority date | Publication date | Assignee | Title |
|---|---|---|---|---|
| JP3517449B2 (ja) * | 1994-07-27 | 2004-04-12 | 株式会社ワコム | 位置検出方法及びその装置 |
| JP4364609B2 (ja) | 2003-11-25 | 2009-11-18 | アルプス電気株式会社 | 容量検出回路及びそれを用いた指紋センサ |
-
2011
- 2011-05-25 JP JP2011117385A patent/JP5079903B1/ja active Active
-
2012
- 2012-01-18 WO PCT/JP2012/050918 patent/WO2012160839A1/ja not_active Ceased
- 2012-01-18 US US14/112,844 patent/US9395856B2/en active Active
Patent Citations (4)
| Publication number | Priority date | Publication date | Assignee | Title |
|---|---|---|---|---|
| JP2009181570A (ja) * | 2007-12-21 | 2009-08-13 | Sensitive Object | 少なくとも2個のインパクトの位置を決定するための方法 |
| WO2009107415A1 (ja) * | 2008-02-27 | 2009-09-03 | セイコーインスツル株式会社 | 近接検出装置と近接検出方法 |
| JP2011003036A (ja) * | 2009-06-18 | 2011-01-06 | Wacom Co Ltd | 指示体検出装置及び指示体検出方法 |
| JP2011047774A (ja) * | 2009-08-26 | 2011-03-10 | Seiko Instruments Inc | 近接検出装置と近接検出方法 |
Cited By (1)
| Publication number | Priority date | Publication date | Assignee | Title |
|---|---|---|---|---|
| US9727187B2 (en) | 2015-04-16 | 2017-08-08 | Sharp Kabushiki Kaisha | Capacitive touch panel with balanced parallel driving |
Also Published As
| Publication number | Publication date |
|---|---|
| JP5079903B1 (ja) | 2012-11-21 |
| JP2012247870A (ja) | 2012-12-13 |
| US9395856B2 (en) | 2016-07-19 |
| US20140035874A1 (en) | 2014-02-06 |
Similar Documents
| Publication | Publication Date | Title |
|---|---|---|
| WO2012160839A1 (ja) | 線形系係数推定方法、集積回路、及び電子機器 | |
| JP7841054B2 (ja) | 畳み込みニューラルネットワークのためのスーパーピクセル法 | |
| JP6998699B2 (ja) | ゼロ係数スキップ畳み込みニューラルネットワークエンジン | |
| JP5231605B2 (ja) | タッチパネルコントローラ、及びこれを用いた電子機器 | |
| CN114239797B (zh) | 用于在硬件中执行平均池化的方法和硬件电路 | |
| US8346004B2 (en) | Apparatus and method for removing motion blur of image | |
| CN103390275B (zh) | 动态图像拼接的方法 | |
| KR101499373B1 (ko) | 고속 반복된 적분 이미지들 | |
| WO2013087003A1 (zh) | 一种基于非局部性的超分辨率重建方法和设备 | |
| JP6528349B1 (ja) | 情報処理装置及び情報処理方法 | |
| Xu | Deterministic sampling of sparse trigonometric polynomials | |
| JP5973072B2 (ja) | タッチパネルコントローラ、集積回路、タッチパネル装置、および電子機器 | |
| Vandebril | Chasing bulges or rotations? A metamorphosis of the QR-algorithm | |
| Shi et al. | A sequential multiple change-point detection procedure via VIF regression | |
| CN111865324B (zh) | 数据的压缩和解压方法、装置、系统和存储装置 | |
| JP2013008316A (ja) | 線形系係数推定方法、集積回路、及び電子機器 | |
| Frederix et al. | An algorithm for computing the eigenvalues of block companion matrices | |
| CN111429334A (zh) | 一种数据处理方法、装置、存储介质及电子设备 | |
| CN110264401A (zh) | 基于径向基函数的连续型图像放大方法、装置及存储介质 | |
| WO2016002020A1 (ja) | 行列生成装置及び行列生成方法及び行列生成プログラム | |
| JP2016103089A (ja) | 情報処理装置、信号処理方法、プログラム | |
| JP2006313518A (ja) | 多次元高速フーリエ変換 | |
| Chan | Constructing a sparse convolution matrix for shift varying image restoration problems | |
| CN116524325B (zh) | 基于局部二元卷积的图像处理方法、系统和存储介质 | |
| WO2014129091A1 (ja) | タッチパネルコントローラ、集積回路、タッチパネル装置、及び、電子機器 |
Legal Events
| Date | Code | Title | Description |
|---|---|---|---|
| 121 | Ep: the epo has been informed by wipo that ep was designated in this application |
Ref document number: 12789806 Country of ref document: EP Kind code of ref document: A1 |
|
| WWE | Wipo information: entry into national phase |
Ref document number: 14112844 Country of ref document: US |
|
| NENP | Non-entry into the national phase |
Ref country code: DE |
|
| 122 | Ep: pct application non-entry in european phase |
Ref document number: 12789806 Country of ref document: EP Kind code of ref document: A1 |