WO2012111402A1 - 水処理システム及びその凝集剤注入方法 - Google Patents
水処理システム及びその凝集剤注入方法 Download PDFInfo
- Publication number
- WO2012111402A1 WO2012111402A1 PCT/JP2012/051671 JP2012051671W WO2012111402A1 WO 2012111402 A1 WO2012111402 A1 WO 2012111402A1 JP 2012051671 W JP2012051671 W JP 2012051671W WO 2012111402 A1 WO2012111402 A1 WO 2012111402A1
- Authority
- WO
- WIPO (PCT)
- Prior art keywords
- water quality
- water
- injection rate
- flocculant
- flocculant injection
- Prior art date
Links
Images


Classifications
-
- C—CHEMISTRY; METALLURGY
- C02—TREATMENT OF WATER, WASTE WATER, SEWAGE, OR SLUDGE
- C02F—TREATMENT OF WATER, WASTE WATER, SEWAGE, OR SLUDGE
- C02F1/00—Treatment of water, waste water, or sewage
- C02F1/44—Treatment of water, waste water, or sewage by dialysis, osmosis or reverse osmosis
- C02F1/441—Treatment of water, waste water, or sewage by dialysis, osmosis or reverse osmosis by reverse osmosis
-
- B—PERFORMING OPERATIONS; TRANSPORTING
- B01—PHYSICAL OR CHEMICAL PROCESSES OR APPARATUS IN GENERAL
- B01D—SEPARATION
- B01D61/00—Processes of separation using semi-permeable membranes, e.g. dialysis, osmosis or ultrafiltration; Apparatus, accessories or auxiliary operations specially adapted therefor
- B01D61/02—Reverse osmosis; Hyperfiltration ; Nanofiltration
- B01D61/025—Reverse osmosis; Hyperfiltration
-
- B—PERFORMING OPERATIONS; TRANSPORTING
- B01—PHYSICAL OR CHEMICAL PROCESSES OR APPARATUS IN GENERAL
- B01D—SEPARATION
- B01D61/00—Processes of separation using semi-permeable membranes, e.g. dialysis, osmosis or ultrafiltration; Apparatus, accessories or auxiliary operations specially adapted therefor
- B01D61/02—Reverse osmosis; Hyperfiltration ; Nanofiltration
- B01D61/04—Feed pretreatment
-
- C—CHEMISTRY; METALLURGY
- C02—TREATMENT OF WATER, WASTE WATER, SEWAGE, OR SLUDGE
- C02F—TREATMENT OF WATER, WASTE WATER, SEWAGE, OR SLUDGE
- C02F1/00—Treatment of water, waste water, or sewage
- C02F1/52—Treatment of water, waste water, or sewage by flocculation or precipitation of suspended impurities
-
- B—PERFORMING OPERATIONS; TRANSPORTING
- B01—PHYSICAL OR CHEMICAL PROCESSES OR APPARATUS IN GENERAL
- B01D—SEPARATION
- B01D2311/00—Details relating to membrane separation process operations and control
- B01D2311/04—Specific process operations in the feed stream; Feed pretreatment
-
- B—PERFORMING OPERATIONS; TRANSPORTING
- B01—PHYSICAL OR CHEMICAL PROCESSES OR APPARATUS IN GENERAL
- B01D—SEPARATION
- B01D2311/00—Details relating to membrane separation process operations and control
- B01D2311/12—Addition of chemical agents
-
- B—PERFORMING OPERATIONS; TRANSPORTING
- B01—PHYSICAL OR CHEMICAL PROCESSES OR APPARATUS IN GENERAL
- B01D—SEPARATION
- B01D2311/00—Details relating to membrane separation process operations and control
- B01D2311/26—Further operations combined with membrane separation processes
- B01D2311/2642—Aggregation, sedimentation, flocculation, precipitation or coagulation
Definitions
- the present invention relates to a water treatment system for filtering brackish water containing seawater solutes such as ions and salts, seawater, groundwater or landfill leachate, industrial wastewater, and the like with a reverse osmosis membrane module and a coagulant injection method thereof.
- Membrane filtration is known as a method for obtaining domestic water, industrial water, and agricultural water from brackish water, seawater, groundwater or landfill leachate, industrial wastewater and the like containing solutes such as ions and salts.
- a reverse osmosis membrane (RO membrane) is a membrane that does not allow impurities other than water, such as ions and salts, to pass through water. Water and solutes are separated by applying a pressure higher than the osmotic pressure according to the solute concentration. To separate.
- a flocculant is injected to form a floc and facilitate removal.
- pretreatment such as sand filtration and membrane filtration is performed.
- membrane filtration such as microfiltration (MF: Microfiltration) membrane and ultrafiltration (UF: Ultrafiltration) membrane, which are membrane modules, is used.
- a controller of a water treatment system calculates a flocculant injection rate from a physical and chemical viewpoint.
- biological dirt and fouling are caused on the membrane surface due to dissolved organic matter in the seawater, microorganisms, particularly viscous organic matter released by microorganisms, and inorganic ions.
- microorganisms particularly viscous organic matter released by microorganisms, and inorganic ions.
- inorganic ions There is also a problem from the biological point of view.
- the quality of the water to be treated is subject to time and seasonal variations, as well as geographical differences, and the fouling factors are also affected by these factors, so the appropriate flocculant injection rate varies accordingly.
- those that significantly reduce the filterability are irreversible dirt, and it is important to suppress the generation.
- Patent Document 1 proposes a method of installing an aggregation monitoring device, measuring the turbidity or chromaticity of a collected sample, and controlling the injection amount of the flocculant according to the measured value.
- Patent Document 2 proposes a method of obtaining a flocculant injection rate from the correlation between the turbidity of raw water and the flocculant injection rate and controlling the amount of the flocculant injected based on the obtained injection rate.
- the coagulant injection rate is corrected according to the deviation from the set value of the residual coagulant main component concentration from the residual coagulant main component concentration in the treated water containing flocs after the flocculant injection.
- a method has been proposed.
- An object of the present invention is to provide a water treatment system capable of controlling the flocculant injection rate with high accuracy and effectively preventing the occurrence of fouling, and a flocculant injection method thereof.
- the water treatment system includes a pretreatment device, a reverse osmosis membrane module, a flocculant injection device, a first water quality analysis device, and a controller.
- the pretreatment device performs pretreatment for filtering out the solute-containing water to remove foreign substances.
- the reverse osmosis membrane module separates and removes the solute from the pretreated solute-containing water.
- the flocculant injection device injects the flocculant into the solute-containing water supplied to the pretreatment device.
- the first water quality analyzer is disposed on the downstream side of the pretreatment device, and performs water quality measurement of a plurality of water quality measurement items on the pretreated solute-containing water.
- the controller controls the flocculant injection of the flocculant injection device based on a water quality analysis measurement result obtained by combining a plurality of water quality measurement items obtained from the first water quality analysis device. That is, the controller calculates an optimum coagulant injection rate based on a relational expression indicating a correlation between the water quality analysis measurement result and the coagulant injection rate, and the coagulant injection device is calculated based on the coagulant injection rate. To control.
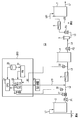
- FIG. 1 is a block diagram illustrating a configuration of a water treatment system according to the first embodiment.
- FIG. 2 is a block diagram showing a configuration of a water treatment system according to the second embodiment.
- FIG. 3 is a block diagram illustrating a configuration of a water treatment system according to the third embodiment.
- FIG. 4 is a block diagram showing a configuration of a water treatment system according to the fourth embodiment.
- FIG. 5 is a block diagram showing a configuration of a water treatment system according to the fifth embodiment.
- FIG. 6 is a block diagram showing a configuration of a water treatment system according to the sixth embodiment.
- FIG. 7 is a block diagram showing a configuration of a water treatment system according to the seventh embodiment.
- FIG. 1 is a block diagram illustrating a configuration of a water treatment system according to the first embodiment.
- FIG. 2 is a block diagram showing a configuration of a water treatment system according to the second embodiment.
- FIG. 3 is a block diagram illustrating a configuration of a water
- FIG. 8 is a block diagram showing a configuration of a water treatment system according to the eighth embodiment.
- FIG. 9 is a characteristic diagram for explaining a method for selecting a flocculant injection rate according to each embodiment.
- FIG. 10 is a characteristic diagram for explaining a method for selecting a flocculant injection rate according to each embodiment.
- FIG. 11 is a characteristic diagram for explaining a method for selecting a flocculant injection rate according to each embodiment.
- FIG. 12 is a flowchart for explaining the flocculant injection method according to the second embodiment.
- FIG. 13 is a characteristic diagram for explaining a method for selecting a flocculant injection rate according to the second and third embodiments.
- FIG. 14 is a characteristic diagram for explaining a method for selecting a flocculant injection rate according to the second and third embodiments.
- Solute-containing water refers to brackish water, seawater, groundwater, landfill leachate, industrial wastewater, etc. containing solutes such as ions and salts.
- solutes such as ions and salts.
- seawater, brackish water and the like that contain a large amount of inorganic components such as ions and salts as solutes.
- Transparent extracellular polymer particles are transparent exopolymer particles (Transparent Exopolymer Particles: abbreviated as TEP), which is a substance that causes a sticky, slimy substance on the surface of an object.
- TEP is one of the causative agents of fouling that not only adheres to the surface of the membrane, but also clogs the micropores, significantly reducing the filterability of the membrane and causing irreversible clogging.
- TEP is a substance generated for various reasons. From the biological viewpoint, TEP is composed of transparent extracellular polymer particles emitted from living cells and transparent extracellular polymer particles emitted from dead cells. Inclusive.
- SMI Silt Density Index
- MFI Modified Fouling Index
- Total organic carbon is Total Organic Carbon (abbreviated as TOC), and is a water quality index that indicates the total amount of organic matter that can be oxidized in water in terms of the amount of carbon.
- TOC is one of the water quality indicators that replaces traditional BOD (Biochemical Oxygen Demand) and COD (Chemical Oxygen Demand).
- UV absorbance is one of the water quality indicators that indicate the degree of light absorption when water is irradiated with ultraviolet light having a wavelength of 260 nm, and is expressed as E260.
- E260 is an index indicating how much organic matter having a double bond is contained in water.
- the water treatment system 1 of the present embodiment includes a raw water tank 2, a supply pump P1, a flow meter 31, a sand filtration device 3 as a pretreatment device, a first treatment tank arranged in series in order from the upstream side along a piping line.
- the water quality analyzer 32, the adjustment water tank 4, the water pump P2, the security filter 5, the high pressure pump P3, the reverse osmosis membrane module 6, and the treated water tank 7 are provided.
- the water treatment system 1 has a controller 20 and a flocculant injection device 10.
- the flocculant injection device 10 injects the flocculant into the upstream line L2 immediately before the entrance of the sand filtration device 3 under the control of the controller 20.
- the controller 20 is a computer system installed in the control room of the management building that is remote from the site of the water treatment system 1. That is, the controller 20 constantly monitors equipment and devices at the site site, and comprehensively controls the overall process in the water treatment system 1.
- the controller 20 has a CPU 21, an input / output interface 22, and a database 23.
- the CPU 21 is a main element of the controller 20, calculates a flocculant injection rate, and executes flocculant injection control.
- the database 23 includes a storage device that accumulates various data.
- the raw water tank 2 is a tank that stores seawater pumped up by a pump (not shown) through the piping line L1 drawn into the sea.
- the sand filtration device 3 is connected to the raw water tank 2 via a supply line L2 to which a pump P1 and a flow meter 31 are attached.
- the sand filtration device 3 has a sand filtration layer for filtering and removing foreign matters (solid matter and the like) contained in seawater sent from the raw water tank 2.
- the sand filtration device 3 functions as a pretreatment device for reducing the burden on the downstream devices 4, 5, and 6.
- the flow meter 31 measures the flow rate of the seawater flowing through the line L2, and sends a flow rate detection signal S1 to the input / output interface 22 of the controller 20.
- a line L ⁇ b> 10 from the flocculant injection device 10 is connected to the line L ⁇ b> 2 between the raw water tank 2 and the sand filtration device 3.
- the flocculant injection device 10 injects the flocculant into the seawater immediately before being supplied to the sand filtration device 3 via the line L10. The injection control of the flocculant will be described later.
- the first water quality analyzer 32 has a function of measuring and analyzing the quality of seawater.
- the first water quality analyzer 32 performs measurement related to two water quality measurement items, TEP and turbidity, and sends a signal S2 that is a result of the water quality measurement to the input / output interface 22 of the controller 20.
- the adjustment water tank 4 temporarily stores the pretreatment water sent from the sand filtration device 3 via the line L3.
- the adjusted water tank 4 has a function of precipitating the suspended substance by the action of the flocculant.
- the outlet of the adjustment water tank 4 is connected to the security filter 5 via the line L4.
- the water pump P ⁇ b> 2 sends the supernatant water from the adjustment water tank 4 to the safety filter 5.
- the security filter 5 is installed between the water pump P2 and the high pressure pump P3.
- the safety filter 5 has a function of removing turbidity and the like having a certain particle size in order to suppress clogging of the membrane of the reverse osmosis membrane module 6.
- the outlet of the safety filter 5 is connected to the reverse osmosis membrane module 6 via the high pressure line L5.
- the high pressure pump P3 applies high pressure seawater of about 6 MPa from the safety filter 5 to the RO membrane in the reverse osmosis membrane module 6.
- the reverse osmosis membrane module 6 communicates with the pressure recovery line L62 on the primary side, and discharges high-pressure concentrated seawater (brine) through the line L62. The discharged seawater is sent to a pressure recovery device (not shown). Further, the reverse osmosis membrane module 6 has a secondary side communicating with the treated water discharge line L61 and sends treated water (fresh water) to the treated water tank 7 through the line L61.
- the treated water tank 7 is a tank that temporarily stores treated water (fresh water) that has passed through the RO membrane. Water is fed from the outlet of the treated water tank 7 to a device or apparatus in a post process (not shown) via a water supply line L7.
- the seawater is supplied to the sand filtration device 3 by the supply pump P1 to perform pretreatment, and temporarily stored in the adjustment water tank 4. Thereafter, the seawater in the adjusted water tank 4 is fed to the high-pressure pump P3 by the water pump P2.
- the high pressure pump P3 increases the pressure of seawater to a high pressure state (about 6 MPa) and feeds the water to the reverse osmosis membrane module 6.
- the safety filter 5 removes turbidity having a large particle size to some extent in order to suppress clogging of the membrane of the reverse osmosis membrane module 6.
- the reverse osmosis membrane module 6 removes solutes such as ions and salts contained in the raw water.
- solutes such as ions and salts contained in the raw water.
- a configuration in which water is fed to the treated water tank 7 via another unshown reverse osmosis membrane module may be used.
- the solute removed by the reverse osmosis membrane module 6 is drained as concentrated water. Since this concentrated water is high-pressure, it may be sent to a power recovery device and used from the viewpoint of energy recovery (not shown).
- the first water quality analysis device 32 is installed in a line between the sand filtration device 3 as a pretreatment device and the adjustment tank 4.
- the first water quality analyzer 32 performs a water quality analysis of the seawater after the pretreatment by the sand filter 3.
- the first water quality analyzer 32 is composed of a plurality of water quality analyzers according to the application.
- the first water quality analyzer 32 measures regularly at a predetermined cycle, and also performs measurement when a certain event occurs.
- the controller 20 controls the flocculant injection rate from the water quality result S2 of the pretreated water from the first water quality analyzer 32.
- the controller 20 optimizes the flocculant injection rate by combining two or more water quality analysis results (TEP and turbidity). Specifically, for example, when the optimal flocculant injection rate K is obtained from the two results of the water quality item x and the water quality item y, the controller 20 first extracts the optimum value of each water quality item.
- an appropriate flocculant injection rate is set as the initial value of the control target value based on the characteristics shown in FIG.
- the controller 20 controls the flocculant injection device 10 based on the set initial value, and injects the flocculant into the seawater immediately before being supplied to the sand filtration device 3. Thereafter, the injection rate is automatically increased by n times at regular intervals, a characteristic curve f (Kx) of the water quality item x is created and stored in the database 23.
- the optimum value is set when the set threshold value is reached.
- the optimal flocculant injection rate in the water quality item y is obtained by the above procedure.
- Kz a ⁇ Kx + b ⁇ Ky (1)
- a is a weighting factor of the water quality item x
- b is a weighting factor of the water quality item y
- a + b 1.
- equation (2) instead of equation (1) to select an arbitrary n and determine the optimal flocculant injection rate considering the results of n water quality items Extract.
- the first water quality analysis device 32 performs water quality analysis of the water to be treated on the downstream side of the pretreatment device 3, and as a result, sends S 2 to the controller 20.
- the controller 20 calculates the optimum coagulant injection rate (corresponding to the control target value) by the above procedure, and controls the coagulant injection device 10 according to the flow rate S1 measured by the flow meter 31.
- the flocculant injection device 10 incorporates a flow rate adjustment valve controlled by the controller 20 and injects an amount of flocculant according to the control of the controller 20.
- the water treatment system 1 before desalting from seawater by the reverse osmosis membrane module 6, in order to remove suspended substances such as turbidity, algae, and microorganisms contained in the taken seawater, aggregation is performed. After injecting the agent, pretreatment is performed using the sand filtration device 3. In the present embodiment, it is possible to perform the flocculant injection control with the optimum flocculant injection rate.
- more reliable coagulant injection control can be realized by controlling the water treatment system 1 by combining at least two water quality analysis results of seawater as solute-containing water.
- water quality of seawater it is not limited to a specific water quality, so it can be applied widely and can be adapted to water quality fluctuations due to weather and geographical differences, etc., so optimize the flocculant injection rate Is possible.
- the appropriateness of the injected flocculant injection rate by calculating the flocculant injection rate by water quality analysis of the pretreated water. If the injected flocculant injection rate is not appropriate, a more exact flocculant injection rate can be calculated by deriving a relational expression between the water quality item being measured and the injection rate and extracting a new optimum injection rate. And cost reduction is possible.
- FIG. 11 shows a case where the flocculant injection rate is selected based on one water quality analysis result.
- the present embodiment employs water quality analysis results of at least two items, assigns a weighting factor to each water quality result, and calculates from the previously set relationship as described above. By doing this, the optimum flocculant injection rate is obtained. Therefore, more serious problems such as drug overdosing, cost increase, and biological growth can be prevented.
- the coagulant injection rate is the optimal value X of the water quality item A.
- an optimum flocculant injection rate Z is calculated from a preset relationship.
- the flocculant injection rate increases, but by taking into account the value of water quality item B, which is a more serious problem, in order to suppress other problems in the water treatment facility, overall, cost reduction, etc. Connected.
- the flocculant injection rate can be reduced.
- the flocculant injection rate is also controlled from a biological viewpoint such as TEP, phytoplankton, and chlorophyll a, which is considered to be one of the factors of fouling. Costs can be reduced because problems such as loss are taken into consideration.
- a second water quality analyzer 33 is newly installed in the line L2 between the sand filtration system 3 and the flow meter 31. Similar to the first water quality analyzer 32, the second water quality analyzer 33 performs measurement related to two water quality measurement items of TEP and turbidity.
- the controller 20A performs the flocculant injection of the flocculant injection device 10 based on the water quality results S3 and S2 of the treated water from the second water quality analyzer 33 on the upstream side and the first water quality analyzer 32 on the downstream side. Execute control. Specifically, as described above, for example, when the optimal coagulant injection rate K is obtained from the two results of the water quality item x and the water quality item y, the controller 20A first extracts the optimal value of each water quality item. . That is, for example, for the water quality item x, a characteristic curve f (Kx) is created and stored in the database 23. For the water quality item y, the optimum coagulant injection rate for the water quality item y is obtained in the same procedure.
- the first water quality analyzer 32 performs the water quality analysis of the water to be treated on the downstream side of the pretreatment device 3, and as a result, sends S2 to the controller 20A.
- the second water quality analyzer 33 performs the water quality analysis of the solute-containing water on the upstream side of the pretreatment device 3, and as a result, sends S3 to the controller 20A.
- the controller 20A calculates the coagulant injection rate by the above procedure based on the water quality analysis result S3 from the second water quality analyzer 33.
- the controller 20 ⁇ / b> A controls the coagulant injection amount of the coagulant injection device 10 according to the flow rate measured by the flow meter 31.
- the water quality analysis of the seawater upstream and downstream of the pretreatment apparatus is performed, and the result is controlled by combining at least two of the results, thereby providing a more reliable flocculant. Injection control can be realized.
- the water quality of the water before pretreatment it is not limited to a specific water quality, so it can be applied to a wide range and can be adapted to water quality fluctuations due to weather and geographical differences. It is possible to optimize the rate.
- the appropriateness of the injected flocculant injection rate by performing a water quality analysis of seawater downstream of the pretreatment device 3 by the first water quality analyzer 32. If the injected flocculant injection rate is not appropriate, a relational expression between the water quality item being measured and the injection rate can be derived, and a new optimum injection rate can be extracted, thereby reducing the cost.
- the controller 20A can set the coagulant injection rate calculated based on the analysis result S3 as an initial value to a value closer to the optimum coagulant injection rate at that time. Therefore, it is possible to shorten the time required to extract the optimum value of the flocculant injection rate. Further, the waste of the injection amount of the flocculant can be eliminated and the cost can be reduced. That is, also in this embodiment, as shown in FIG. 9 and FIG. 10, at least two items of water quality analysis results are adopted, weighting coefficients are assigned to the respective water quality results, and are set in advance as described above. By calculating from the relationship, the optimum coagulant injection rate is obtained. Therefore, more serious problems such as drug overdosing, cost increase, and biological growth can be prevented.
- the control room of the management building is always under monitoring by a monitoring device regardless of whether it is manned or unmanned.
- the controller 20A determines whether any event has occurred in the system (step K1).
- controller 20A determines whether there is a second water quality analyzer 33 (step K2).
- the event that occurs in the water treatment system 1A is that, for example, the temperature of the seawater taken in due to the warm current flows rapidly rises, and a sudden change occurs in the process conditions.
- Step K3 the controller 20A determines that the second water quality analyzer 33 is present. That is, the flocculant injection device 10 performs the flocculant injection to the seawater before being pretreated by the pretreatment device 3 under the control of the controller 20A.
- the controller 20A determines that there is no second water quality analyzer 33, the controller 20A searches the past actual data in the database 23 for the optimum flocculant injection rate for the same month, and sets this as the initial value. The injection of the flocculant is started (step K4).
- the controller 20A records the analysis result after injecting the flocculant in the database 23 (step K5). Furthermore, the controller 20A changes the flocculant injection rate to a value different from the initial value and executes the flocculant injection (step K6). For example, the flocculant injection rate is changed in the direction of decreasing the flocculant injection amount from the initial value. The controller 20A records the analysis result of the water quality measurement item of the seawater in the database 23 after injecting the flocculant (step K7).
- the controller 20A determines whether or not the rate of change of the characteristic curve f (k) corresponding to the correlation equation between the water quality measurement item and the flocculant injection rate increases (step K8). If the controller 20A determines that the change rate of the characteristic curve f (k) is increased, the controller 20A changes the flocculant injection rate in a direction to increase from the initial value, and executes the flocculant injection (step K9). The controller 20A records the analysis result after injecting the flocculant in the database 23 (step K10).
- controller 20A further changes the coagulant injection rate in the same direction as the previous change of the coagulant injection rate (step K11). That is, the flocculant is injected into seawater by further changing the flocculant injection rate from the initial value.
- the controller 20A determines whether or not the rate of change of the characteristic curve f (k) has reached the threshold shown in FIG. K14).
- This threshold value serves as a criterion for determining the control target value, and is a value set with reference to past performance data.
- the controller 20A determines the threshold value as the optimum flocculant injection rate of the water quality item X (step K16). Thereafter, the respective flocculant injection rates for at least two water quality items are determined, and an optimum flocculant injection rate is newly determined from them.
- the controller 20A records the analysis result of the water quality measurement item of the seawater after the injection of the flocculant in the database 23 (step K17).
- the flocculant injection rate is also controlled from a biochemical point of view such as TEP, phytoplankton, and chlorophyll a, which are considered to be one of the factors of fouling, clogging of membranes and in piping Costs can be reduced because problems such as pressure loss are taken into consideration.
- the controller 20B has a feedback control device (FB) 24 that feeds back the optimum coagulant injection rate (control target value) S4 from the database 23.
- FB feedback control device
- the first water quality analyzer 32 has a function of measuring and analyzing the quality of seawater, and measures, for example, two water quality measurement items, TEP and ultraviolet absorbance (E260).
- the controller 20B calculates the coagulant injection rate from the seawater water quality analysis result S2 from the first water quality analysis device 32, and controls the coagulant injection amount of the coagulant injection device 10 using this as a control target value.
- the first water quality analyzer 32 analyzes the water quality of seawater downstream from the pretreatment device 3.
- the controller 20B first extracts the optimum values of the respective water quality items. . That is, for example, when a certain event occurs in the water quality item x (see FIG. 12), an appropriate flocculant injection rate is set as an initial value of the control target value based on the characteristics shown in FIG.
- the optimal flocculant injection rate in the water quality item y is obtained by the above procedure.
- optimum coagulant injection rates are determined as Kx (water quality item x) and Ky (water quality item y), for example, a new Kz is obtained from the relationship such as the equation (1).
- the controller 20B stores the optimum flocculant injection rate Kz in the database 23. Next, when acquiring the water quality analysis result S2 from the first water quality analyzer 32, the controller 20B feeds back the optimum coagulant injection rate Kz from the database 23 as the control target value S4 in the water quality items x and y. The controller 20B controls the coagulant injection amount of the coagulant injection device 10 based on the feedback control target value S4.
- the water treatment system 1 before desalting from seawater by the reverse osmosis membrane module 6, in order to remove suspended substances such as turbidity, algae, and microorganisms contained in the taken seawater, aggregation is performed. After injecting the agent, pretreatment is performed using the sand filtration device 3. In the present embodiment, it is possible to perform the flocculant injection control with the optimum flocculant injection rate.
- more reliable flocculant injection control can be realized by analyzing the water quality of the seawater on the downstream side of the pretreatment device and controlling by combining at least two of the results. Further, the controller 20B stores the calculated optimal flocculant injection rate in the database 23, and controls the flocculant injection of the flocculant injection device 10 by feeding back this optimal flocculant injection rate as the control target value S4. . Therefore, the optimum flocculant injection rate can be kept constant.
- the appropriateness of the injected flocculant injection rate by calculating the flocculant injection rate by analyzing the quality of seawater downstream of the pretreatment device, and the injected flocculant injection rate is If it is not appropriate, a more precise coagulant injection rate can be calculated by deriving a relational expression between the water quality item being measured and the injection rate, and extracting a new optimal injection rate, enabling cost reduction. Become. Also, as shown in FIG. 9 and FIG. 10, at least two items of water quality analysis results are adopted, each water quality result is given a weighting factor, and calculation is performed from the previously set relationship as described above. Therefore, the optimum flocculant injection rate is obtained. Therefore, more serious problems such as drug overdosing, cost increase, and biological growth can be prevented.
- the flocculant injection rate is controlled also from a biological viewpoint such as TEP, E260, phytoplankton, chlorophyll a, which is considered to be one of the factors of fouling. Costs can be reduced because problems such as clogging and pressure loss in piping are taken into consideration.
- a second water quality analyzer 33 is connected to a line L2 between the sand filter 3 and the flow meter 31. Furthermore, the controller 20 ⁇ / b> C has a feedback control device (FB) 24 that feeds back an optimal coagulant injection rate (control target value) S ⁇ b> 4 from the database 23.
- FB feedback control device
- the second water quality analyzer 33 has a function of measuring and analyzing the quality of seawater.
- the second water quality analyzer 33 measures two water quality measurement items such as TEP and modified fouling index (MFI).
- MFI modified fouling index
- the first water quality analyzer 32 measures two water quality measurement items TEP and MFI.
- This embodiment is different from the second embodiment in that the calculated optimum flocculant injection rate is feedback controlled by the FB 24.
- the water quality analysis of the seawater is performed on the upstream side and the downstream side of the pretreatment device 3, respectively, and the results are more reliable by combining and controlling at least two of the results. Flocculant injection control can be realized. Moreover, by analyzing the water quality of the seawater upstream of the pretreatment device 3, it is not limited to a specific water quality and can be applied widely, and can be adapted to water quality fluctuations due to weather or geographical differences. It is possible to optimize the agent injection rate.
- the initial value can be set closer to the optimum coagulant injection rate at that time. Therefore, it is possible to shorten the time required to extract the optimum injection rate. Moreover, since the useless amount of flocculant injection can be reduced, the cost can be reduced.
- the controller 20C accumulates in the database 23 the optimum coagulant injection rate based on the analysis result of the second water quality analyzer 33.
- the controller 20B feeds back the optimum coagulant injection rate from the database 23 as the control target value S4.
- the controller 20B controls the coagulant injection amount of the coagulant injection device 10 based on the feedback control target value S4.
- the water quality analysis result of at least 2 or more items is employ
- adopted a weighting coefficient is given to each water quality result, and the said Formula (1) preset as mentioned above, for example
- the optimal flocculant injection rate is obtained by performing calculations based on the relationship as described above. Therefore, more serious problems such as drug overdosing, cost increase, and biological growth can be prevented.
- the coagulant injection rate is the optimum value X of the water quality item A1 and the optimum of the water quality item B1.
- the optimum coagulant injection rate Z is calculated from a preset relationship.
- the flocculant injection rate increases, but by taking into account the value of the water quality item B1, which is a more serious problem, in order to suppress other problems in the water treatment facility, overall, cost reduction, etc. Connected. Furthermore, in the case shown in FIG. 10, the flocculant injection rate can be reduced.
- the flocculant injection rate is controlled also from a biological viewpoint such as TEP, MFI, phytoplankton, chlorophyll a, which is considered to be one of the factors of fouling. Costs can be reduced because problems such as clogging and pressure loss in piping are taken into consideration.
- a membrane filtration device 11 is installed as a pretreatment device instead of the sand filtration device 3 of the first embodiment.
- the membrane filtration device 11 uses a microfiltration membrane (MF membrane) or an ultrafiltration membrane (UF membrane) as a filtration membrane.
- the membrane filtration device 11 is used for pretreatment.
- more reliable coagulant injection control can be realized by analyzing the water quality of seawater and controlling the result by combining at least two of the results.
- analyzing the water quality of the treated water it is not limited to specific water quality, so it can be applied widely and can adapt to water quality fluctuations due to weather and geographical differences, so the coagulant injection rate can be optimized. Can be achieved.
- the appropriateness of the injected flocculant injection rate by calculating the flocculant injection rate by analyzing the quality of seawater downstream of the pretreatment device, and the injected flocculant injection rate is If it is not appropriate, a more precise coagulant injection rate can be calculated by deriving a relational expression between the water quality item being measured and the injection rate, and extracting a new optimal injection rate, enabling cost reduction. Become.
- the water quality analysis result of at least 2 or more items is employ
- adopted a weighting coefficient is given to each water quality result, and the said Formula (1) preset as mentioned above, for example
- the optimal flocculant injection rate is obtained by performing calculations based on the relationship as described above. Therefore, more serious problems such as drug overdosing, cost increase, and biological growth can be prevented.
- the coagulant injection rate is the optimum value X of the water quality item A1 and the optimum of the water quality item B1.
- the optimum coagulant injection rate Z is calculated from a preset relationship.
- the flocculant injection rate increases, but by taking into account the value of the water quality item B1, which is a more serious problem, in order to suppress other problems in the water treatment facility, overall, cost reduction, etc. Connected. Furthermore, in the case shown in FIG. 10, the flocculant injection rate can be reduced.
- the present invention controls the flocculant injection rate from the biological viewpoint such as TEP, phytoplankton, and chlorophyll a, which is considered to be one of the factors of fouling, membrane clogging and pressure loss in piping Therefore, cost reduction can be realized.
- a membrane filtration device 11 is installed as a pretreatment device instead of the sand filtration device 3, and a second water quality analysis is performed on a line L2 between the membrane filtration device 11 and the flow meter 31.
- the difference is that the device 33 is newly installed.
- the water quality analysis of the upstream and downstream seawater of the pretreatment device is performed, and the results are controlled in combination with at least two, thereby more reliable aggregation.
- Agent injection control can be realized.
- the appropriateness of the injected flocculant injection rate by performing a water quality analysis of the seawater downstream of the pretreatment device 11. Moreover, when the injected flocculant injection rate is not appropriate, a relational expression between the water quality item being measured and the injection rate can be derived, and a new optimum injection rate can be extracted, so that the cost can be reduced. Further, the water quality analysis of the seawater upstream of the pretreatment device 11 is performed, and the initial value is set by the analysis result and the storage means recorded in advance, so that the initial value is closer to the optimum coagulant injection rate at that time. Therefore, the time required to extract the optimum injection rate can be shortened. Moreover, since the useless amount of flocculant injection can be reduced, the cost can be reduced.
- the water quality analysis result of at least 2 or more items is employ
- adopted a weighting coefficient is given to each water quality result, and the said Formula (1) preset as mentioned above, for example
- the optimal flocculant injection rate is obtained by performing calculations based on the relationship as described above. Therefore, more serious problems such as drug overdosing, cost increase, and biological growth can be prevented.
- the coagulant injection rate is the optimum value X of the water quality item A1 and the optimum of the water quality item B1.
- the optimum coagulant injection rate Z is calculated from a preset relationship.
- the flocculant injection rate increases, but by taking into account the value of the water quality item B1, which is a more serious problem, in order to suppress other problems in the water treatment facility, overall, cost reduction, etc. Connected. Furthermore, in the case shown in FIG. 10, the flocculant injection rate can be reduced.
- the flocculant injection rate is also controlled from a biochemical viewpoint such as TEP, phytoplankton, and chlorophyll a, which is considered to be one of the factors of fouling. Costs can be reduced because problems such as loss are taken into consideration.
- a membrane filtration device 11 is installed as a pretreatment device instead of the sand filtration device 3.
- the controller 20F includes a feedback control device (FB) 24 that feeds back an optimum coagulant injection rate (control target value) S4 from the database 23.
- FB feedback control device
- the seventh embodiment is different from the third embodiment in that the sand filtration system 3 is changed to a membrane filtration device 11.
- the reverse osmosis membrane and the upstream The water quality index can also be corrected in consideration of the increase in the differential pressure of the membrane of the membrane filtration device 11 which is a treatment device.
- the controller 20F stores the calculated optimal flocculant injection rate in the database 23, and feeds back the optimal flocculant injection rate as the control target value S4, thereby injecting the flocculant injection of the flocculant injection device 10. Control. Therefore, the optimum flocculant injection rate can be kept constant.
- the appropriateness of the injected flocculant injection rate by calculating the flocculant injection rate by analyzing the quality of seawater downstream of the pretreatment device 11.
- a more precise flocculant injection rate is calculated by deriving a relational expression between the water quality item being measured and the injection rate and extracting a new optimum injection rate. And cost reduction is possible.
- the water quality analysis result of at least 2 or more items is employ
- adopted a weighting coefficient is given to each water quality result, and the said Formula (1) preset as mentioned above, for example
- the optimal flocculant injection rate is obtained by performing calculations based on the relationship as described above. Therefore, more serious problems such as drug overdosing, cost increase, and biological growth can be prevented.
- the coagulant injection rate is the optimum value X of the water quality item A1 and the optimum of the water quality item B1.
- the optimum coagulant injection rate Z is calculated from a preset relationship.
- the flocculant injection rate increases, but by taking into account the value of the water quality item B1, which is a more serious problem, in order to suppress other problems in the water treatment facility, overall, cost reduction, etc. Connected. Furthermore, in the case shown in FIG. 10, the flocculant injection rate can be reduced.
- the flocculant injection rate is also controlled from a biological viewpoint such as TEP, phytoplankton, and chlorophyll a, which is considered to be one of the factors of fouling. Costs can be reduced because problems such as loss are taken into consideration.
- a membrane filtration device 11 is installed as a pretreatment device instead of the sand filtration device 3.
- a second water quality analyzer 33 is installed in the line L ⁇ b> 2 between the membrane filtration device 11 and the flow meter 31.
- the controller 20G has a feedback control device (FB) 24 that feeds back an optimum coagulant injection rate (control target value) S4 from the database 23.
- FB feedback control device
- the eighth embodiment is different from the fifth embodiment in that the sand filtration device 3 is changed to a membrane filtration device 11.
- the water quality analysis of the upstream and downstream seawater of the pretreatment device 11 is performed, and the results are more reliable by combining and controlling at least two of the results. Flocculant injection control can be realized.
- the water quality of the seawater upstream of the pretreatment device 11 it is not limited to a specific water quality and can be applied widely, and can be adapted to water quality fluctuations due to weather and geographical differences. It is possible to optimize the agent injection rate.
- the appropriateness of the injected flocculant injection rate by performing a water quality analysis of the seawater downstream of the pretreatment device 11. Moreover, when the injected flocculant injection rate is not appropriate, a relational expression between the water quality item being measured and the injection rate can be derived, and a new optimum injection rate can be extracted, so that the cost can be reduced. Further, the water quality analysis of the seawater upstream of the pretreatment device 11 is performed, and the initial value is set closer to the optimum coagulant injection rate at that time by setting the initial value based on the analysis result and the storage means recorded in advance. Therefore, the time required to extract the optimum injection rate can be shortened.
- the controller 20G stores the calculated optimum flocculant injection rate in the database 23, and controls the flocculant injection of the flocculant injection device 10 by feeding back the optimum flocculant injection rate as the control target value S4. Therefore, the optimum flocculant injection rate can be kept constant.
- the water quality analysis result of at least 2 or more items is employ
- adopted a weighting coefficient is given to each water quality result, and the said Formula (1) preset as mentioned above, for example
- the optimal flocculant injection rate is obtained by performing calculations based on the relationship as described above. Therefore, more serious problems such as drug overdosing, cost increase, and biological growth can be prevented.
- the coagulant injection rate is the optimum value X of the water quality item A1 and the optimum of the water quality item B1.
- the optimum coagulant injection rate Z is calculated from a preset relationship.
- the flocculant injection rate increases, but by taking into account the value of the water quality item B1, which is a more serious problem, in order to suppress other problems in the water treatment facility, overall, cost reduction, etc. Connected. Furthermore, in the case shown in FIG. 10, the flocculant injection rate can be reduced.
- the flocculant injection rate is also controlled from a biochemical viewpoint such as TEP, phytoplankton, and chlorophyll a, which is considered to be one of the factors of fouling. Costs can be reduced because problems such as loss are taken into consideration.
- an optimal flocculant injection is performed by analyzing a plurality of water quality measurement items related to biological factors of solute-containing water and combining at least two water quality analysis results among them.
- the rate can be calculated.
- Water quality measurement items include TEP (Transparent Exopolymer Particle), turbidity, Silt Density Index (SDI), Modified Fouling Index (MFI), Total Organic Carbon (TOC), Ultraviolet Absorbance (E260), Chlorophyll a Amount, phytoplankton number, and fluorescence intensity are included.
- TEP Transparent Exopolymer Particle
- SDI Silt Density Index
- MFI Modified Fouling Index
- TOC Total Organic Carbon
- E260 Ultraviolet Absorbance
- Chlorophyll a Amount Chlorophyll a Amount
- phytoplankton number and fluorescence intensity
Landscapes
- Engineering & Computer Science (AREA)
- Water Supply & Treatment (AREA)
- Chemical & Material Sciences (AREA)
- Life Sciences & Earth Sciences (AREA)
- Hydrology & Water Resources (AREA)
- Environmental & Geological Engineering (AREA)
- Organic Chemistry (AREA)
- Nanotechnology (AREA)
- Chemical Kinetics & Catalysis (AREA)
- Separation Using Semi-Permeable Membranes (AREA)
- Separation Of Suspended Particles By Flocculating Agents (AREA)
Abstract
実施形態によれば、水処理システムは、前処理装置と、逆浸透膜モジュールと、凝集剤注入装置と、第1の水質分析装置と、コントローラとを具備する。前処理装置は、溶質含有水をろ過して異物を除去する前処理を行なう。逆浸透膜モジュールは、前処理された溶質含有水から溶質を分離除去する。凝集剤注入装置は、前記前処理装置に供給される溶質含有水に対して凝集剤を注入する。コントローラは、前処理装置よりも下流側に配置された前記第1の水質分析装置から複数の水質測定項目を組み合わせた水質分析測定結果を取得し、この水質分析測定結果に基づいて最適な凝集剤注入率を算出し、当該凝集剤注入率に基づいて前記凝集剤注入装置を制御する。
Description
本発明は、イオンや塩類などの溶質を含む汽水(brackish water)、海水、地下水又は埋立地浸出水、産業廃水などを逆浸透膜モジュールによりろ過を行う水処理システム及びその凝集剤注入方法に関する。
イオンや塩類などの溶質を含む汽水、海水、地下水又は埋立地浸出水、産業廃水などから生活用水、工業用水、農業用水を得る方法として膜ろ過法が知られている。膜ろ過法の1つとして逆浸透(RO : reverse osmosis)膜を利用する方法がある。逆浸透膜(RO膜)は、水を通しイオンや塩類など水以外の不純物は透過しない性質を持つ膜のことで、溶質の濃度に応じた浸透圧以上の圧力をかけることにより水と溶質を分離する。
こうした逆浸透膜モジュールを利用する水処理システムとして、例えば海水淡水化システムでは、海水を逆浸透膜モジュールに通して脱塩する前に、取水した海水中に含まれる濁度、藻類、微生物などの懸濁物質を除去するために凝集剤を注入し、フロック(floc)を形成させて除去しやすくする処理が行われる。この処理後に、砂ろ過や膜ろ過などの前処理が行われる。近年、前処理には、砂ろ過が用いられる他、膜モジュールである精密ろ過(MF : Microfiltration)膜および限外ろ過(UF : Ultrafiltration)膜などの膜ろ過が用いられる。
従来、水処理システムのコントローラは、物理学的、化学的観点から凝集剤注入率を算出している。しかし、例えば海水の膜ろ過処理においては、海水中の溶存有機物、微生物、特に微生物が放出する粘性の高い有機物、無機イオンなどが原因で、膜表面に生物的な汚れ、ファウリング(fouling)が発生するという生物学的観点における課題もある。
被処理水の水質は時間や季節変動、さらには地理的差異があり、またファウリング要因物質もこれらの影響を受けるため、これらに応じて適切な凝集剤注入率も変動する。ファウリングのうち、ろ過性を著しく低下させるものは不可逆的な汚れであり、生成を抑制することが重要となる。
ファウリングを抑制する方法としては、対象とする被処理水中にファウリングの要因となる物質がどの程度存在するかを把握し、ファウリング生成の危険性に応じて膜ろ過の運転条件やろ過膜の洗浄条件を制御するなどの各種の方法が提案されている。
例えば特許文献1では、凝集監視装置を設置し、採取試料の濁度又は色度を測定し、その測定値に応じて凝集剤の注入量を制御する方法が提案されている。また、特許文献2では、原水の濁度と凝集剤注入率との相関から凝集剤注入率を求め、求めた注入率に基づいて凝集剤の注入量を制御する方法が提案されている。さらに、特許文献3では、凝集剤注入後のフロックを含有した状態の処理水中の残留凝集剤主成分濃度から、残留凝集剤主成分濃度の設定値との偏差に応じて凝集剤注入率を補正する方法が提案されている。
しかしながら、上述した従来技術のいずれも、凝集剤注入率を決定するためのプロセス条件項目が絶対的に少なく、特に従来技術ではプロセス条件項目として生物学的要因をまったく考慮していないため、凝集剤の注入率を高精度に制御するには不十分である。水処理プロセスにおいて生物学的要因の影響力は大きく、被処理水の水質が日間変動あるいは季節変動した場合に、安定した処理水質を得ることが困難となる。特に、過酷な条件で運転を続けると前段の前処理システムや後段の逆浸透膜モジュールが目詰まりするファウリングが発生し、運転を続けることが困難になり、稼働率の低下を招くことがある。
本発明の目的は、凝集剤注入率を高精度に制御でき、ファウリングの発生を有効に防止することができる水処理システム及びその凝集剤注入方法を提供することにある。
実施形態によれば、水処理システムは、前処理装置と、逆浸透膜モジュールと、凝集剤注入装置と、第1の水質分析装置と、コントローラとを具備する。前処理装置は、溶質含有水をろ過して異物を除去する前処理を行なう。逆浸透膜モジュールは、前処理された溶質含有水から溶質を分離除去する。凝集剤注入装置は、前記前処理装置に供給される溶質含有水に対して凝集剤を注入する。第1の水質分析装置は、前記前処理装置よりも下流側に配置されて、前処理された溶質含有水に対して複数の水質測定項目の水質測定を実行する。コントローラは、前記第1の水質分析装置から得られた複数の水質測定項目を組み合わせた水質分析測定結果に基づいて前記凝集剤注入装置の凝集剤注入を制御する。即ち、コントローラは、前記水質分析測定結果と凝集剤注入率との間の相関を示す関係式に基づいて最適な凝集剤注入率を算出し、当該凝集剤注入率に基づいて前記凝集剤注入装置を制御する。
先ず、実施形態を説明する上での重要な用語の定義を記述する。
溶質含有水とは、イオンや塩類などの溶質を含む汽水、海水、地下水、埋立地浸出水、産業排水などをいう。特に、溶質としてイオンや塩類などの無機質の成分を多く含む海水や汽水などをいう。
透明細胞外高分子粒子とは、トランスパレント・エキソポリマー・パーティクル(Transparent Exopolymer Particle : 略称TEP)であり、物体の表面に粘り気のあるヌルヌルした所謂ぬめりを生じさせる物質をいう。TEPは、膜の表面に単に付着するばかりでなく、微細孔を塞いで膜のろ過性を著しく低下させ、不可逆的な目詰まりを生じさせるファウリングの原因物質の1つである。TEPは、種々の原因で発生する物質であるが、生物学的視点からみた場合に生きた細胞から出される透明細胞外高分子粒子と死んだ細胞から出てきた透明細胞外高分子粒子とが包括的に含まれる。
シルト・デンシティ指数(Silt Density Index : 略称SDI)は、ASTM(American Society for Testing and Materials)で規定された水質指標(D4189)の1つをいう。
モディファイド・ファウリング指数(Modified Fouling Index : 略称MFI)とは、膜ろ過を行おうとする液が膜にどの程度ファウリングを起こさせるかを示す半定量的な水質指標をいう。ファウリング指数は、JIS規格(K3802)で規定されている。
全有機炭素とは、トータル・オーガニック・カーボン(Total Organic Carbon : 略称TOC)であり、水中の酸化されうる有機物の全量を炭素の量で示した水質指標をいう。TOCは従前のBOD(Biochemical Oxygen Demand)やCOD(Chemical Oxygen Demand)にとって代わる水質指標の1つである。
紫外線吸光度とは、水に波長260nmの紫外光を照射したときの光の吸収の程度を示す水質指標の1つをいい、E260で表記される。E260は、2重結合を有する有機物が水中にどのくらい含まれているかを示す指標になる。
以下、図面を参照して本実施形態を、海水淡水化プラントシステムを具体例として説明する。
[第1の実施形態]
図1を参照して、第1の実施形態に係る水処理システム1を説明する。
図1を参照して、第1の実施形態に係る水処理システム1を説明する。
本実施形態の水処理システム1は、配管ラインに沿って上流側から順に直列に配設された原水槽2、供給ポンプP1、流量計31、前処理装置としての砂ろ過装置3、第1の水質分析装置32、調整水槽4、送水ポンプP2、保安フィルタ5、高圧ポンプP3、逆浸透膜モジュール6、および処理水槽7を備えている。
さらに、水処理システム1は、コントローラ20及び凝集剤注入装置10を有する。凝集剤注入装置10は、コントローラ20の制御により、砂ろ過装置3の入口直前の上流側ラインL2に凝集剤を注入する。コントローラ20は、水処理システム1の現場サイトから離れた管理棟のコントロール室内に設置されているコンピュータシステムである。即ち、コントローラ20は、現場サイトの機器や装置を常時監視し、水処理システム1における全体的プロセスを統括的に制御する。
コントローラ20は、CPU21と、入出力インターフェース22と、データベース23とを有する。CPU21はコントローラ20の主要素であり、凝集剤注入率を算出し、凝集剤注入制御を実行する。データベース23は、各種データを蓄積する記憶装置からなる。
原水槽2は、海中に引き込まれた配管ラインL1を通って、図示しないポンプによって汲み上げられた海水を貯留するタンクである。砂ろ過装置3は、ポンプP1および流量計31が取り付けられた供給ラインL2を介して原水槽2に接続されている。砂ろ過装置3は、原水槽2から送られてくる海水に含まれる異物(固形物など)をろ過して除去するための砂ろ過層を有する。砂ろ過装置3は、下流側の機器4,5,6の負担を軽減するための前処理装置として機能する。
流量計31は、ラインL2を通流する海水の流量を計測し、コントローラ20の入出力インターフェース22に流量検出信号S1を送る。原水槽2から砂ろ過装置3までの間のラインL2には、凝集剤注入装置10からのラインL10が接続されている。凝集剤注入装置10は、ラインL10を介して、砂ろ過装置3に供給される直前の海水に凝集剤を注入する。凝集剤の注入制御については後述する。
第1の水質分析装置32は、海水の水質を測定して分析する機能を有する。本実施形態では、第1の水質分析装置32は、TEPおよび濁度の2つの水質測定項目に関する計測を実行し、その水質測定結果である信号S2をコントローラ20の入出力インターフェース22に送る。
調整水槽4は、ラインL3を介して砂ろ過装置3から送られてくる前処理水を一時的に貯留する。調整水槽4は、凝集剤の作用により懸濁物質を沈殿させる機能を有する。調整水槽4の出口は、ラインL4を介して保安フィルタ5に接続されている。水ポンプP2は、調整水槽4から上澄み水を保安フィルタ5に送る。
保安フィルタ5は、送水ポンプP2と高圧ポンプP3の間に設置されている。保安フィルタ5は、逆浸透膜モジュール6の膜の目詰まりを抑制するために、ある程度粒径の大きな濁質等を取り除く機能を有する。保安フィルタ5の出口は、高圧ラインL5を介して逆浸透膜モジュール6に接続されている。高圧ポンプP3は、保安フィルタ5から逆浸透膜モジュール6内のRO膜に約6MPaの高圧海水を印加する。
逆浸透膜モジュール6は、一次側が圧力回収ラインL62に連通し、ラインL62を通って高圧の濃縮海水(ブライイン)を排出する。排出される海水は、図示しない圧力回収装置に送られる。また、逆浸透膜モジュール6は、二次側が処理水排出ラインL61に連通し、ラインL61を通って処理水(淡水)を処理水槽7に送る。処理水槽7は、RO膜を透過してきた処理水(淡水)を一時的に貯留するタンクである。処理水槽7の出口からは送水ラインL7を介して、図示しない後工程の機器や装置に送水される。
次に本実施形態の作用を説明する。
供給ポンプP1により、砂ろ過装置3へ海水を供給して前処理を行い、一旦、調整水槽4に貯留する。その後、調整水槽4の海水は、送水ポンプP2により高圧ポンプP3へ送水される。高圧ポンプP3は、海水を高圧な状態(6MPa程度)まで昇圧して逆浸透膜モジュール6へ送水する。保安フィルタ5は、逆浸透膜モジュール6の膜の目詰まりを抑制するために、ある程度粒径の大きな濁質等を取り除く。
逆浸透膜モジュール6は、原水に含まれるイオンや塩類などの溶質を除去する。なお、さらに良好な水質を得るために、図示しないもう一段逆浸透膜モジュールを介して、処理水槽7に送水する構成でもよい。また、逆浸透膜モジュール6で除去した溶質は、濃縮水として排水される。この濃縮水は高圧であるので、エネルギー回収の観点から、動力回収装置へ送水されて利用される場合がある(図示せず)。
第1の水質分析装置32は、前処理装置としての砂ろ過装置3と調整槽4との間のラインに設置されている。第1の水質分析装置32は、砂ろ過装置3による前処理後の海水の水質分析を行う。第1の水質分析装置32は、その用途に応じて複数の水質分析器から構成されている。第1の水質分析装置32は、決められた周期で定期的に計測し、また、あるイベントが生じた際にも測定を行うようになっている。
コントローラ20は、第1の水質分析装置32から前処理後の被処理水の水質結果S2から凝集剤注入率を制御する。この場合、コントローラ20は、2つ以上の水質分析結果(TEPおよび濁度)を組み合わせることで、凝集剤注入率の最適化を行なう。具体的には、コントローラ20は、例えば、水質項目xと水質項目yの2つの結果から最適な凝集剤注入率Kを求める場合、まずそれぞれの水質項目の最適値を抽出する。
例えば水質項目xにおいて、あるイベントが発生した際に(図12を参照)、図13に示すような特性に基づいて、適切な凝集剤注入率を制御目標値の初期値として設定する。コントローラ20は、設定した初期値に基づいて凝集剤注入装置10を制御し、砂ろ過装置3に供給される直前の海水に凝集剤を注入する。その後、自動で一定間隔n倍ずつ注入率を上げていき、水質項目xの特性曲線f(Kx)を作成してデータベース23に蓄積する。
その際のf(Kx)において、dX / dKx = 0となる凝集剤注入率を抽出し、これを水質項目xの最適凝集剤注入率とする。ただし、図14に示すように、凝集剤注入率が減少し続けた場合は、設定閾値に到達した時点で最適値とする。さらに、水質項目yにおいても前記手順で水質項目yにおける最適な凝集剤注入率を求める。このようにそれぞれの最適凝集剤注入率がKx(水質項目x)、Ky(水質項目y)と設定されると、例えば下式(1)のような関係から新たなKzを求める。
Kz= a・Kx+ b・Ky ……(1)
ただし、aは水質項目xの重み係数、bは水質項目yの重み係数、a + b = 1である。
ただし、aは水質項目xの重み係数、bは水質項目yの重み係数、a + b = 1である。
水質項目が2つより多い場合は、式(1)の代わりに下式(2)を用いて、任意のn個を選別し、n個の水質項目結果を考慮した最適な凝集剤注入率を抽出する。
K=w1・K1 + w2・K2 + ・・・+ wn・Kn ・・・・・・(2)
以上のように、第1の水質分析装置32は前処理装置3より下流側で被処理水の水質分析を実行し、その結果S2をコントローラ20に送る。コントローラ20は、前記手順により最適な凝集剤注入率(制御目標値に相当する)を演算し、流量計31で測定した流量S1に応じて凝集剤注入装置10を制御する。凝集剤注入装置10は、コントローラ20により制御される流量調整弁を内蔵し、コントローラ20の制御に応じた注入量の凝集剤を注入する。
以上のように、第1の水質分析装置32は前処理装置3より下流側で被処理水の水質分析を実行し、その結果S2をコントローラ20に送る。コントローラ20は、前記手順により最適な凝集剤注入率(制御目標値に相当する)を演算し、流量計31で測定した流量S1に応じて凝集剤注入装置10を制御する。凝集剤注入装置10は、コントローラ20により制御される流量調整弁を内蔵し、コントローラ20の制御に応じた注入量の凝集剤を注入する。
前述したように、水処理システム1では、逆浸透膜モジュール6により海水から脱塩する前に、取水した海水中に含まれる濁度、藻類、微生物などの懸濁物質を除去するために、凝集剤を注入した後、砂ろ過装置3を用いて前処理が実行される。本実施形態は、最適な凝集剤注入率による凝集剤注入制御を行なうことが可能となる。
さらに本実施形態の効果を具体的に説明する。
本実施形態によれば、水処理システム1において、溶質含有水としての海水の水質分析結果を少なくとも2つ以上組み合わせて制御することで、より信頼性のある凝集剤注入制御を実現できる。また海水の水質分析を行うことにより、特定の水質に限定されることがないので幅広く応用でき、天候や地理的差異などによる水質変動にも適応できることから、凝集剤注入率の最適化を図ることが可能となる。
本実施形態は、前処理後の被処理水の水質分析により凝集剤注入率を算出することで、注入した凝集剤注入率の適正を見極めることが可能となる。注入した凝集剤注入率が適当でない場合は、測定している水質項目と注入率の関係式を導き、新たな最適注入率を抽出することで、より厳密な凝集剤注入率を算出することができ、コスト低減が可能となる。
ここで、図11は、1つの水質分析結果を基に凝集剤注入率を選定した場合を示す。本実施形態は、図9及び図10に示すように、少なくとも2項目以上の水質分析結果を採用し、それぞれの水質結果に重み係数をつけ、前記のように予め設定しておいた関係から演算を行うことで、最適な凝集剤注入率を求めている。従って、薬品の過剰投与、コストの増加、生物増殖などのより重大な問題を防止することができる。
具体的には、図9に示すように、2つの水質分析項目AとB(問題の重大度、優先度:B>A)がある時、凝集剤注入率は水質項目Aの最適値Xと水質項目Bの最適値Yとから、予め設定しておいた関係より最適な凝集剤注入率Zを算出する。この例では、凝集剤注入率は増加するが、より重大な問題である水質項目Bの値を考慮して定めることで、水処理設備における他の問題を抑制するため、総合するとコスト低減などにつながる。また、図10に示すような場合には、凝集剤注入率を削減することができる。
本実施形態では、ファウリングの要因の一つと考えられる例えばTEPや植物プランクトン、クロロフィルaなどの生物学的視点からも凝集剤注入率を制御していることから、膜の目詰まりや配管における圧力損失などの問題も考慮しているので、コスト低減化を実現することができる。
[第2の実施形態]
図2を参照して第2の実施形態に係る水処理システムを説明する。
図2を参照して第2の実施形態に係る水処理システムを説明する。
なお、第1の実施形態と重複する部分については説明を省略する。
本実施形態の水処理システム1Aでは、砂ろ過システム3と流量計31との間のラインL2には、第2の水質分析装置33が新たに設置されている。第2の水質分析装置33は、第1の水質分析装置32と同様に、TEPおよび濁度の2つの水質測定項目に関する計測を実行する。
本実施形態の作用を説明する。
コントローラ20Aは、上流側の第2の水質分析装置33及び下流側の第1の水質分析装置32からの被処理水の各水質結果S3,S2に基づいて、凝集剤注入装置10の凝集剤注入制御を実行する。具体的には、コントローラ20Aは、前述したように、例えば、水質項目xと水質項目yの2つの結果から最適な凝集剤注入率Kを求める場合、まずそれぞれの水質項目の最適値を抽出する。即ち、例えば水質項目xにおいて、特性曲線f(Kx)を作成してデータベース23に蓄積する。また、水質項目yにおいても、同様の手順で水質項目yにおける最適な凝集剤注入率を求める。このようにそれぞれの最適凝集剤注入率がKx(水質項目x)、Ky(水質項目y)と設定されると、前記式(1)のような関係から新たなKzを求める。水質項目が2つより多い場合は、前記式(2)を用いて、任意のn個を選別し、n個の水質項目結果を考慮した最適な凝集剤注入率を抽出する。
以上のように、第1の水質分析装置32は前処理装置3より下流側で被処理水の水質分析を実行し、その結果S2をコントローラ20Aに送る。
次に、本実施形態では、第2の水質分析装置33は、前処理装置3よりも上流側で溶質含有水の水質分析を実行し、その結果S3をコントローラ20Aに送る。コントローラ20Aは、第2の水質分析装置33からの水質分析結果S3に基づいて、前記手順により凝集剤注入率を演算する。コントローラ20Aは、流量計31で測定した流量に応じて、凝集剤注入装置10の凝集剤注入量を制御する。
本実施形態の効果を説明する。
本実施形態の水処理システム1Aでは、前処理装置の上流側および下流側の海水の水質分析を行い、その結果を少なくても2つ以上組み合わせて制御することで、より信頼性のある凝集剤注入制御を実現できる。また、前処理前の被処理水の水質分析を行うことにより、特定の水質に限定されることがないので幅広く応用でき、天候や地理的差異などによる水質変動にも適応できることから、凝集剤注入率の最適化を図ることが可能となる。
本実施形態では、第1の水質分析装置32により前処理装置3の下流側の海水の水質分析を行うことで、注入した凝集剤注入率の適正を見極めることが可能である。注入した凝集剤注入率が適当でない場合は、測定している水質項目と注入率の関係式を導き、新たな最適注入率を抽出することができるので、コスト低減が可能となる。
また、第2の水質分析装置33により、前処理装置3より上流側の海水の水質分析を行い、その分析結果S3をデータベース23に記憶する。これにより、コントローラ20Aは、当該分析結果S3に基づいて算出した凝集剤注入率を初期値として、その時の最適な凝集剤注入率により近い値に設定できる。従って、凝集剤注入率の最適値を抽出するまでに要する時間の短縮化を図ることができる。また、凝集剤の注入量の無駄を無くし、コスト低減化を図ることができる。即ち、本実施形態においても、図9及び図10に示すように、少なくとも2項目以上の水質分析結果を採用し、それぞれの水質結果に重み係数をつけ、前記のように予め設定しておいた関係から演算を行うことで、最適な凝集剤注入率を求めている。従って、薬品の過剰投与、コストの増加、生物増殖などのより重大な問題を防止することができる。
次に、図12のフローチャートを参照して、本実施形態の水処理システム1Aでの凝集剤注入制御方法について説明する。
水処理システム1Aは管理棟の制御室が有人、無人にかかわらずモニタリング装置により常時監視下におかれている。このような常時監視下の水処理システム1Aにおいて、コントローラ20Aは、システム内に何らかのイベントが発生しているか否かを判定する(工程K1)。コントローラ20Aは、システム内に何らかのイベントが発生したと判定すると、第2の水質分析装置33があるか否かを判定する(工程K2)。ここで、水処理システム1Aにおいて発生するイベントとは、例えば暖流の流れ込みにより取水される海水の温度が急上昇し、プロセス条件に急激な変化が発生することである。
コントローラ20Aは、第2の水質分析装置33が有ると判定した場合は、海水の水質分析結果に基づいて制御目標値の初期値を設定し、その初期値に従う凝集剤注入率で海水に凝集剤の注入を開始する(工程K3)。即ち、凝集剤注入装置10は、コントローラ20Aの制御により、前処理装置3により前処理される前の海水に凝集剤注入を実行する。一方、コントローラ20Aは、第2の水質分析装置33が無いと判定した場合は、データベース23の過去の実績データから同月の最適な凝集剤注入率を検索し、これを初期値として設定することで凝集剤の注入を開始する(工程K4)。
次に、コントローラ20Aは、凝集剤注入後の分析結果をデータベース23に記録する(工程K5)。さらに、コントローラ20Aは、凝集剤注入率を初期値とは異なる数値に変化させて凝集剤注入を実行する(工程K6)。例えば、初期値よりも凝集剤の注入量を減少させる方向へ凝集剤注入率を変化させる。コントローラ20Aは、凝集剤注入後において海水の水質測定項目の分析結果をデータベース23に記録する(工程K7)。
次に、コントローラ20Aは、その水質測定項目と凝集剤注入率との相関関係式に対応する特性曲線f(k)の変化率が増加するか否かを判定する(工程K8)。コントローラ20Aは、特性曲線f(k)の変化率が増加すると判定した場合は、凝集剤注入率を初期値より増加させる方向へ変化させて、凝集剤注入を実行する(工程K9)。コントローラ20Aは、凝集剤注入後の分析結果をデータベース23に記録する(工程K10)。
さらに、コントローラ20Aは、前回に凝集剤注入率を変化させたのと同じ方向に凝集剤注入率をさらに変化させる(工程K11)。すなわち、凝集剤注入率を初期値より増加させる方向へ、さらに変化させて海水に凝集剤を注入する。
次に、コントローラ20Aは、水質測定項目と凝集剤注入率との相関関係式に対応する特性曲線f(k)の変化率が増加するか否かを判定する(工程K12)。コントローラ20Aは、特性曲線f(k)の変化率が増加すると判定した場合は、dX/dK=0となる凝集剤注入率を水質項目Xの最適凝集剤注入率と決定する(工程K13)。その後に、少なくとも2つの水質項目に対するそれぞれの凝集剤注入率が決定し、それらより新たに最適な凝集剤注入率をそれぞれ決定する。コントローラ20Aは、凝集剤注入後における海水の水質測定項目の分析結果をデータベース23に記録する(工程K15)。
一方、コントローラ20Aは、特性曲線f(k)の変化率が増加しないと判定した場合は、特性曲線f(k)の変化率が図14に示す閾値に到達したか否かを判定する(工程K14)。この閾値は、制御目標値を決めるための判定基準となるものであり、過去の実績データを参照して設定される値である。コントローラ20Aは、特性曲線f(k)の変化率が閾値に到達したと判定した場合は、閾値を水質項目Xの最適凝集剤注入率と決定する(工程K16)。その後に少なくとも2つの水質項目に対するそれぞれの凝集剤注入率が決定し、それらより新たに最適な凝集剤注入率をそれぞれ決定する。コントローラ20Aは、凝集剤注入後における海水の水質測定項目の分析結果をデータベース23に記録する(工程K17)。
本実施形態によれば、ファウリングの要因の一つと考えられるTEPや植物プランクトン、クロロフィルaなどの生物化学的視点からも凝集剤注入率を制御していることから、膜の目詰まりや配管における圧力損失などの問題も考慮しているので、コスト低減化を実現することができる。
[第3の実施形態]
図3を参照して第3の実施形態に係る水処理システムを説明する。
図3を参照して第3の実施形態に係る水処理システムを説明する。
なお、第1及び第2の実施形態と重複する部分については説明を省略する。
本実施形態の水処理システム1Bでは、コントローラ20Bは、データベース23から最適な凝集剤注入率(制御目標値)S4をフィードバックするフィードバック制御装置(FB)24を有する。
本実施形態では、第1の水質分析装置32は、海水の水質を測定して分析する機能を有しており、例えばTEPおよび紫外線吸光度(E260)の2つの水質測定項目を計測する。
本実施形態の作用を説明する。
コントローラ20Bは、第1の水質分析装置32からの海水の水質分析結果S2から凝集剤注入率を算出し、これを制御目標値として凝集剤注入装置10の凝集剤注入量を制御する。第1の水質分析装置32は、前述したように、前処理装置3より下流側の海水の水質を分析する。
具体的には、コントローラ20Bは、前述したように、例えば、水質項目xと水質項目yの2つの結果から最適な凝集剤注入率Kを求める場合、まずそれぞれの水質項目の最適値を抽出する。即ち、例えば水質項目xにおいて、あるイベントが発生した際に(図12を参照)、図13に示すような特性に基づいて、適切な凝集剤注入率を制御目標値の初期値として設定する。
一方、図13に示すような特性ではない場合は、前回の制御目標値などの適切な凝集剤注入率を初期値として設定して注入する。その後、自動で一定間隔n倍ずつ注入率を上げていき、水質項目xの特性曲線f(Kx)を作成してデータベース23に蓄積する。その際のf(Kx)において、dX / dKx = 0となる凝集剤注入率を抽出し、これを水質項目xの最適凝集剤注入率とする。ただし、図14に示すように凝集剤注入率が減少し続けた場合は、設けてある閾値に到達した時点で最適値とする。さらに、水質項目yにおいても前記手順で水質項目yにおける最適な凝集剤注入率を求める。このようにそれぞれの最適凝集剤注入率がKx(水質項目x)、Ky(水質項目y)と定まったうえで、例えば前記式(1)のような関係から新たなKzを求める。
コントローラ20Bは、当該最適な凝集剤注入率Kzをデータベース23に蓄積する。次に、コントローラ20Bは、第1の水質分析装置32から水質分析結果S2を取得すると、水質項目x及びyにおいてデータベース23から最適な凝集剤注入率Kzを制御目標値S4としてフィードバックする。コントローラ20Bは、フィードバックされた制御目標値S4に基づいて凝集剤注入装置10の凝集剤注入量を制御する。
前述したように、水処理システム1では、逆浸透膜モジュール6により海水から脱塩する前に、取水した海水中に含まれる濁度、藻類、微生物などの懸濁物質を除去するために、凝集剤を注入した後、砂ろ過装置3を用いて前処理が実行される。本実施形態は、最適な凝集剤注入率による凝集剤注入制御を行なうことが可能となる。
本実施形態の効果を説明する。
本実施形態の水処理システム1Bでは、前処理装置の下流側の海水の水質分析を行いその結果を少なくとも2つ以上組み合わせて制御することで、より信頼性のある凝集剤注入制御を実現できる。また、コントローラ20Bは、算出した最適な凝集剤注入率をデータベース23に保存し、この最適な凝集剤注入率を制御目標値S4としてフィードバックすることで凝集剤注入装置10の凝集剤注入を制御する。従って、最適な凝集剤注入率を一定に保つことができる。
本実施形態では、前処理装置の下流側の海水の水質分析により凝集剤注入率を算出することで、注入した凝集剤注入率の適正を見極めることが可能であり、注入した凝集剤注入率が適当でない場合は、測定している水質項目と注入率の関係式を導き、新たな最適注入率を抽出することで、より厳密な凝集剤注入率を算出することができ、コスト低減が可能となる。また、図9及び図10に示すように、少なくとも2項目以上の水質分析結果を採用し、それぞれの水質結果に重み係数をつけ、前記のように予め設定しておいた関係から演算を行うことで、最適な凝集剤注入率を求めている。従って、薬品の過剰投与、コストの増加、生物増殖などのより重大な問題を防止することができる。
本実施形態によれば、ファウリングの要因の一つと考えられる例えばTEPやE260、あるいは植物プランクトン、クロロフィルaなどの生物学的視点からも凝集剤注入率を制御していることから、膜の目詰まりや配管における圧力損失などの問題も考慮しているので、コスト低減化を実現することができる。
[第4の実施形態]
図4を参照して第4の実施形態に係る水処理システムを説明する。
図4を参照して第4の実施形態に係る水処理システムを説明する。
なお、第1から第3の実施形態と重複する部分については説明を省略する。
本実施形態の水処理システム1Cでは、砂ろ過装置3と流量計31との間のラインL2に第2の水質分析装置33が接続されている。さらに、コントローラ20Cは、データベース23から最適な凝集剤注入率(制御目標値)S4をフィードバックするフィードバック制御装置(FB)24を有する。
第2の水質分析装置33は、海水の水質を測定して分析する機能を有し、本実施形態ではTEPおよびモディファイド・ファウリング指数(MFI)の2つの水質測定項目を計測する。また、第1の水質分析装置32も同様に、TEPおよびMFIの2つの水質測定項目を計測する。
本実施形態の作用を説明する。
本実施形態は第2の実施形態と比べて、算出した最適な凝集剤注入率をFB24によりフィードバック制御する点が異なる。
本実施形態の効果を説明する。
本実施形態の水処理システム1Cでは、前処理装置3の上流側および下流側で海水の水質分析をそれぞれ行い、その結果を少なくても2つ以上組み合わせて制御することで、より信頼性のある凝集剤注入制御を実現できる。また、前処理装置3の上流側の海水の水質分析を行うことにより、特定の水質に限定されることがないので幅広く応用でき、天候や地理的差異などによる水質変動にも適応できることから、凝集剤注入率の最適化を図ることが可能となる。
本実施形態では、前処理装置3の下流側で海水の水質分析を行うことで、注入した凝集剤注入率の適正を見極めることが可能であり、注入した凝集剤注入率が適当でない場合は、測定している水質項目と注入率の関係式を導き、新たな最適注入率を抽出することができるので、コスト低減が可能となる。
また、前処理装置3の上流側の海水の水質分析を行い、その分析結果と予めデータベース23に記録された凝集剤注入後の分析結果に基づいて初期値(制御目標値)を設定することにより、初期値をその時の最適な凝集剤注入率により近い値に設定できる。従って、注入率の最適値を抽出するまでに要する時間の短縮化を図ることができる。また、無駄な凝集剤注入量を少なくできるため、コスト低減化を図ることができる。
さらに、コントローラ20Cは、第2の水質分析装置33の分析結果に基づいた最適な凝集剤注入率をデータベース23に蓄積する。次に、コントローラ20Bは、第2の水質分析装置33から水質分析結果S3を取得すると、データベース23から最適な凝集剤注入率を制御目標値S4としてフィードバックする。コントローラ20Bは、フィードバックされた制御目標値S4に基づいて凝集剤注入装置10の凝集剤注入量を制御する。
また、図9及び図10に示すように、少なくとも2項目以上の水質分析結果を採用し、それぞれの水質結果に重み係数をつけ、前記のように予め設定しておいた例えば前記式(1)のような関係から演算を行うことで、最適な凝集剤注入率を求めている。従って、薬品の過剰投与、コストの増加、生物増殖などのより重大な問題を防止することができる。例えば図9のように、2つの水質分析項目A1とB1(問題の重大度、優先度:B1>A1)がある時、凝集剤注入率は水質項目A1の最適値Xと水質項目B1の最適値Yとから、予め設定しておいた関係より最適な凝集剤注入率Zを算出する。この例によると凝集剤注入率は増加するが、より重大な問題である水質項目B1の値を考慮して定めることで、水処理設備における他の問題を抑制するため、総合するとコスト低減などにつながる。さらに、図10のような場合には、凝集剤注入率を削減することができる。
本実施形態によれば、ファウリングの要因の一つと考えられる例えばTEPやMFI、あるいは植物プランクトン、クロロフィルaなどの生物学的視点からも凝集剤注入率を制御していることから、膜の目詰まりや配管における圧力損失などの問題も考慮しているので、コスト低減化を実現することができる。
[第5の実施形態]
図5を参照して第5の実施形態に係る水処理システムを説明する。
図5を参照して第5の実施形態に係る水処理システムを説明する。
なお、第1から第4の実施形態と重複する部分については説明を省略する。
本実施形態の水処理システム1Dでは、第1の実施形態の砂ろ過装置3の代わりに前処理装置として膜ろ過装置11が設置されている。膜ろ過装置11は、ろ過膜として精密ろ過膜(MF膜)または限外ろ過膜(UF膜)を用いる。
本実施形態の作用を説明する。
逆浸透膜モジュール6を用いた水処理システム1Dでは、例えば、海水を逆浸透膜モジュール6に通して脱塩する前に、取水した海水中に含まれる濁度、藻類、微生物などの懸濁物質を除去するために、凝集剤を注入した後、膜ろ過装置11を用いて前処理を行う。
海水の水質は時間や季節変動、さらには地理的差異があり、これに応じて適切な凝集剤注入率も変動するため、必要に応じて前述した水質項目以外に、後段の逆浸透膜及び前処理である膜ろ過装置11の膜の差圧上昇を考慮して水質指標の補正を行うこともできる。
本実施形態の効果を説明する。
本実施形態の水処理システム1Dでは、海水の水質分析を行いその結果を少なくとも2つ以上組み合わせて制御することで、より信頼性のある凝集剤注入制御を実現できる。また、被処理水の水質分析を行うことにより、特定の水質に限定されることがないので幅広く応用でき、天候や地理的差異などによる水質変動にも適応できることから、凝集剤注入率の最適化を図ることが可能となる。
本実施形態では、前処理装置の下流側の海水の水質分析により凝集剤注入率を算出することで、注入した凝集剤注入率の適正を見極めることが可能であり、注入した凝集剤注入率が適当でない場合は、測定している水質項目と注入率の関係式を導き、新たな最適注入率を抽出することで、より厳密な凝集剤注入率を算出することができ、コスト低減が可能となる。
また、図9及び図10に示すように、少なくとも2項目以上の水質分析結果を採用し、それぞれの水質結果に重み係数をつけ、前記のように予め設定しておいた例えば前記式(1)のような関係から演算を行うことで、最適な凝集剤注入率を求めている。従って、薬品の過剰投与、コストの増加、生物増殖などのより重大な問題を防止することができる。例えば図9のように、2つの水質分析項目A1とB1(問題の重大度、優先度:B1>A1)がある時、凝集剤注入率は水質項目A1の最適値Xと水質項目B1の最適値Yとから、予め設定しておいた関係より最適な凝集剤注入率Zを算出する。この例によると凝集剤注入率は増加するが、より重大な問題である水質項目B1の値を考慮して定めることで、水処理設備における他の問題を抑制するため、総合するとコスト低減などにつながる。さらに、図10のような場合には、凝集剤注入率を削減することができる。
本発明は、ファウリングの要因の一つと考えられる例えばTEPや植物プランクトン、クロロフィルaなどの生物学的視点からも凝集剤注入率を制御していることから、膜の目詰まりや配管における圧力損失などの問題も考慮しているので、コスト低減化を実現することができる。
[第6の実施形態]
図6を参照して第6の実施形態に係る水処理システムを説明する。
図6を参照して第6の実施形態に係る水処理システムを説明する。
なお、第1から第5の実施形態と重複する部分については説明を省略する。
本実施形態の水処理システム1Eでは、砂ろ過装置3の代わりに前処理装置として膜ろ過装置11を設置し、かつ膜ろ過装置11と流量計31との間のラインL2に第2の水質分析装置33を新たに設置した点が異なる。
本実施形態の作用を説明する。
海水の水質は時間や季節変動、さらには地理的差異があり、これに応じて適切な凝集剤注入率も変動するため、必要に応じて前述した水質項目以外に、後段の逆浸透膜及び前処理である膜ろ過システムの膜の差圧上昇を考慮して水質指標の補正を行うこともできる。
本実施形態の効果を説明する。
本実施形態の水処理システム1Eでは、前処理装置の上流側および下流側の海水の水質分析をそれぞれ行い、その結果を少なくても2つ以上組み合わせて制御することで、より信頼性のある凝集剤注入制御を実現できる。また、前処理装置11の上流側の海水の水質分析を行うことにより、特定の水質に限定されることがないので幅広く応用でき、天候や地理的差異などによる水質変動にも適応できることから、凝集剤注入率の最適化を図ることが可能となる。
本実施形態では、前処理装置11の下流側の海水の水質分析を行うことで、注入した凝集剤注入率の適正を見極めることが可能となる。また、注入した凝集剤注入率が適当でない場合は、測定している水質項目と注入率の関係式を導き、新たな最適注入率を抽出することができるので、コスト低減が可能となる。また、前処理装置11の上流側の海水の水質分析を行い、その分析結果と予め記録された記憶手段により初期値を設定することにより、初期値をその時の最適な凝集剤注入率により近い値に設定できるので、注入率の最適値を抽出するまでに要する時間の短縮化を図ることができる。また、無駄な凝集剤注入量を少なくできるため、コスト低減化を図ることができる。
また、図9及び図10に示すように、少なくとも2項目以上の水質分析結果を採用し、それぞれの水質結果に重み係数をつけ、前記のように予め設定しておいた例えば前記式(1)のような関係から演算を行うことで、最適な凝集剤注入率を求めている。従って、薬品の過剰投与、コストの増加、生物増殖などのより重大な問題を防止することができる。例えば図9のように、2つの水質分析項目A1とB1(問題の重大度、優先度:B1>A1)がある時、凝集剤注入率は水質項目A1の最適値Xと水質項目B1の最適値Yとから、予め設定しておいた関係より最適な凝集剤注入率Zを算出する。この例によると凝集剤注入率は増加するが、より重大な問題である水質項目B1の値を考慮して定めることで、水処理設備における他の問題を抑制するため、総合するとコスト低減などにつながる。さらに、図10のような場合には、凝集剤注入率を削減することができる。
本実施形態では、ファウリングの要因の一つと考えられる例えばTEPや植物プランクトン、クロロフィルaなどの生物化学的視点からも凝集剤注入率を制御していることから、膜の目詰まりや配管における圧力損失などの問題も考慮しているので、コスト低減化を実現することができる。
[第7の実施形態]
図7を参照して第7の実施形態に係る水処理システムを説明する。
図7を参照して第7の実施形態に係る水処理システムを説明する。
なお、第1から第6の実施形態と重複する部分については説明を省略する。
本実施形態の水処理システム1Fでは、砂ろ過装置3の代わりに前処理装置として膜ろ過装置11が設置されている。コントローラ20Fは、データベース23から最適な凝集剤注入率(制御目標値)S4をフィードバックするフィードバック制御装置(FB)24を有する。
本実施形態の作用を説明する。
第7の実施形態は第3の実施形態と比べて、砂ろ過システム3を膜ろ過装置11に変えた点において異なる。
海水の水質は時間や季節変動、さらには地理的差異があり、これに応じて適切な凝集剤注入率も変動するため、必要に応じて前述した水質項目以外に、後段の逆浸透膜及び前処理装置である膜ろ過装置11の膜の差圧上昇を考慮して水質指標の補正を行うこともできる。
本実施形態の効果を説明する。
本実施形態の水処理システム1Fでは、前処理装置11の下流側の海水の水質分析を行い、その結果を少なくとも2つ以上組み合わせて制御することで、より信頼性のある凝集剤注入制御を実現できる。また、また、コントローラ20Fは、算出した最適な凝集剤注入率をデータベース23に保存し、この最適な凝集剤注入率を制御目標値S4としてフィードバックすることで凝集剤注入装置10の凝集剤注入を制御する。従って、最適な凝集剤注入率を一定に保つことができる。
本実施形態によれば、前処理装置11の下流側の海水の水質分析により凝集剤注入率を算出することで、注入した凝集剤注入率の適正を見極めることが可能となる。また、注入した凝集剤注入率が適当でない場合は、測定している水質項目と注入率の関係式を導き、新たな最適注入率を抽出することで、より厳密な凝集剤注入率を算出することができ、コスト低減が可能となる。
また、図9及び図10に示すように、少なくとも2項目以上の水質分析結果を採用し、それぞれの水質結果に重み係数をつけ、前記のように予め設定しておいた例えば前記式(1)のような関係から演算を行うことで、最適な凝集剤注入率を求めている。従って、薬品の過剰投与、コストの増加、生物増殖などのより重大な問題を防止することができる。例えば図9のように、2つの水質分析項目A1とB1(問題の重大度、優先度:B1>A1)がある時、凝集剤注入率は水質項目A1の最適値Xと水質項目B1の最適値Yとから、予め設定しておいた関係より最適な凝集剤注入率Zを算出する。この例によると凝集剤注入率は増加するが、より重大な問題である水質項目B1の値を考慮して定めることで、水処理設備における他の問題を抑制するため、総合するとコスト低減などにつながる。さらに、図10のような場合には、凝集剤注入率を削減することができる。
本実施形態では、ファウリングの要因の一つと考えられる例えばTEPや植物プランクトン、クロロフィルaなどの生物学的視点からも凝集剤注入率を制御していることから、膜の目詰まりや配管における圧力損失などの問題も考慮しているので、コスト低減化を実現することができる。
[第8の実施形態]
図8を参照して第8の実施形態に係る水処理システムを説明する。
図8を参照して第8の実施形態に係る水処理システムを説明する。
なお、第1から第7の実施形態と重複する部分については説明を省略する。
本実施形態の水処理システム1Gでは、砂ろ過装置3の代わりに前処理装置として膜ろ過装置11が設置されている。また、膜ろ過装置11と流量計31との間のラインL2には、第2の水質分析装置33が設置されている。さらに、コントローラ20Gは、データベース23から最適な凝集剤注入率(制御目標値)S4をフィードバックするフィードバック制御装置(FB)24を有する。
本実施形態の作用を説明する。
第8の実施形態は第5の実施形態に比べて、砂ろ過装置3を膜ろ過装置11に変えた点において異なる。
海水の水質は時間や季節変動、さらには地理的差異があり、これに応じて適切な凝集剤注入率も変動するため、必要に応じて前述した水質項目以外に、後段の逆浸透膜及び前処理である膜ろ過システムの膜の差圧上昇を考慮して水質指標の補正を行うこともできる。
本実施形態の効果を説明する。
本実施形態の水処理システム1Gでは、前処理装置11の上流側および下流側の海水の水質分析をそれぞれ行い、その結果を少なくても2つ以上組み合わせて制御することで、より信頼性のある凝集剤注入制御を実現できる。また、前処理装置11の上流側の海水の水質分析を行うことにより、特定の水質に限定されることがないので幅広く応用でき、天候や地理的差異などによる水質変動にも適応できることから、凝集剤注入率の最適化を図ることが可能となる。
本実施形態では、前処理装置11の下流側の海水の水質分析を行うことで、注入した凝集剤注入率の適正を見極めることが可能となる。また、注入した凝集剤注入率が適当でない場合は、測定している水質項目と注入率の関係式を導き、新たな最適注入率を抽出することができるので、コスト低減が可能となる。さらに、前処理装置11の上流側の海水の水質分析を行い、その分析結果と予め記録された記憶手段により初期値を設定することにより、初期値をその時の最適な凝集剤注入率により近い値に設定できるので、注入率の最適値を抽出するまでに要する時間の短縮化を図ることができる。また、無駄な凝集剤注入量を少なくできるため、コスト低減化を図ることができる。また、コントローラ20Gは算出した最適な凝集剤注入率をデータベース23に保存し、この最適な凝集剤注入率を制御目標値S4としてフィードバックすることで凝集剤注入装置10の凝集剤注入を制御する。従って、最適な凝集剤注入率を一定に保つことができる。
また、図9及び図10に示すように、少なくとも2項目以上の水質分析結果を採用し、それぞれの水質結果に重み係数をつけ、前記のように予め設定しておいた例えば前記式(1)のような関係から演算を行うことで、最適な凝集剤注入率を求めている。従って、薬品の過剰投与、コストの増加、生物増殖などのより重大な問題を防止することができる。例えば図9のように、2つの水質分析項目A1とB1(問題の重大度、優先度:B1>A1)がある時、凝集剤注入率は水質項目A1の最適値Xと水質項目B1の最適値Yとから、予め設定しておいた関係より最適な凝集剤注入率Zを算出する。この例によると凝集剤注入率は増加するが、より重大な問題である水質項目B1の値を考慮して定めることで、水処理設備における他の問題を抑制するため、総合するとコスト低減などにつながる。さらに、図10のような場合には、凝集剤注入率を削減することができる。
本実施形態では、ファウリングの要因の一つと考えられる例えばTEPや植物プランクトン、クロロフィルaなどの生物化学的視点からも凝集剤注入率を制御していることから、膜の目詰まりや配管における圧力損失などの問題も考慮しているので、コスト低減化を実現することができる。
以上のように各実施形態によれば、溶質含有水の生物学的要因に関する複数の水質測定項目を分析し、これらのうち少なくとも2つ以上の水質分析結果を組み合わせることで、最適な凝集剤注入率を算出することができる。水質測定項目には、TEP(Transparent Exopolymer Particle)量、濁度、シルト・デンシティ指数(SDI)、モディファイド・ファウリング指数(MFI)、全有機炭素(TOC)量、紫外線吸光度(E260)、クロロフィルa量、植物プランクトン数、および蛍光強度が含まれる。水質測定項目の組合せとしては、TEP量と濁度の組合せが最も好ましい。次に好ましいものは、TEPとE260の組合せである。さらに次に好ましいものは、TEPとMFIの組合せである。
各実施形態を水処理システムに適用することにより、結果として溶質含有水中に含まれる異物、例えば砂粒子や繊維などの不溶性固形物を迅速かつ確実に除去することができる。また、下流側の機器や装置の負荷が軽減されると共に、逆浸透膜モジュール6のRO膜の寿命延長を図ることができる。
本発明のいくつかの実施形態を説明したが、これらの実施形態は、例として提示したものであり、発明の範囲を限定することは意図していない。これら新規な実施形態は、その他の様々な形態で実施されることが可能であり、発明の要旨を逸脱しない範囲で、種々の省略、置き換え、変更を行うことができる。これら実施形態やその変形は、発明の範囲や要旨に含まれるとともに、特許請求の範囲に記載された発明とその均等の範囲に含まれる。
1,1A~1G…水処理システム、2…原水槽、3…前処理装置(砂ろ過槽)、
4…調整水槽、5…保安フィルタ、6…逆浸透膜モジュール(RO膜モジュール)、
7…処理水槽、10…凝集剤注入装置、
11…前処理装置(ろ過膜モジュール、MF膜モジュールまたはUF膜モジュール)、
20,20A,20B,20C,20D,20E,20F,20G…コントローラ、
21…CPU、22…入出力インターフェース、23…データベース(記録装置)、
24…フィードバック制御回路、31…流量計、
32…第1の水質分析装置(下流側の水質分析装置)、
33…第2の水質分析装置(上流側の水質分析装置)、
P1,P2…ポンプ、P3…ポンプ、L1~L7,L10…ライン、
S1~S4…信号。
4…調整水槽、5…保安フィルタ、6…逆浸透膜モジュール(RO膜モジュール)、
7…処理水槽、10…凝集剤注入装置、
11…前処理装置(ろ過膜モジュール、MF膜モジュールまたはUF膜モジュール)、
20,20A,20B,20C,20D,20E,20F,20G…コントローラ、
21…CPU、22…入出力インターフェース、23…データベース(記録装置)、
24…フィードバック制御回路、31…流量計、
32…第1の水質分析装置(下流側の水質分析装置)、
33…第2の水質分析装置(上流側の水質分析装置)、
P1,P2…ポンプ、P3…ポンプ、L1~L7,L10…ライン、
S1~S4…信号。
Claims (11)
- 溶質含有水をろ過して異物を除去する前処理を行なう前処理装置と、
前処理された溶質含有水から溶質を分離除去する逆浸透膜モジュールと、
前記前処理装置に供給される溶質含有水に対して凝集剤を注入する凝集剤注入装置と、
前記前処理装置よりも下流側に配置されて、前処理された溶質含有水に対して複数の水質測定項目の水質測定を実行する第1の水質分析装置と、
前記第1の水質分析装置から得られた複数の水質測定項目を組み合わせた水質分析測定結果に基づいて、前記凝集剤注入装置の凝集剤注入を制御するコントローラとを具備し、
前記コントローラは、
前記水質分析測定結果と凝集剤注入率との間の相関を示す関係式に基づいて最適な凝集剤注入率を算出し、当該凝集剤注入率に基づいて前記凝集剤注入装置を制御するように構成されている水処理システム。 - 前記前処理装置よりも上流側に配置されて、水質測定項目として前記溶質含有水の透明細胞外高分子粒子量(TEP量)と他の水質測定項目の少なくとも1つとをそれぞれ測定する第2の水質分析装置をさらに有し、
前記コントローラは、
前記第2の水質分析装置から得られた複数の水質測定項目を組み合わせた水質分析測定結果を取得し、
前記第2の水質分析装置からの水質分析測定結果と凝集剤注入率との間の相関を示す関係式に基づいて最適な凝集剤注入率を算出し、当該凝集剤注入率に基づいて前記凝集剤注入装置を制御する請求項1に記載の水処理システム。 - 前記第1の水質分析装置は、
水質測定項目として前記溶質含有水の透明細胞外高分子粒子量(TEP量)と他の水質測定項目の少なくとも1つとをそれぞれ測定する請求項1に記載の水処理システム。 - 前記第1の水質分析装置により測定された水質分析結果を記録する記憶装置をさらに有する請求項1に記載の水処理システム。
- 前記コントローラは、
前記凝集剤注入の制御を開始する場合に、過去の実績データから凝集剤注入率の初期値を選択し、当該初期値に基づいてから前記凝集剤注入装置から凝集剤注入を開始させる請求項1に記載の水処理システム。 - 前記前処理装置は、
ろ過膜を有する膜ろ過装置である請求項1に記載の水処理システム。 - 前記コントローラにより算出された最適な凝集剤注入率を記憶する記憶装置を有し、
前記コントローラは、
前記第1の水質分析装置から得られた水質分析測定結果に基づいて前記記憶装置から前記最適な凝集剤注入率を制御目標値としてフィードバックし、当該制御目標値に基づいて前記凝集剤注入装置の凝集剤注入を制御する請求項1に記載の水処理システム。 - 前記コントローラにより前記第2の水質分析装置からの水質分析測定結果に基づいて算出された最適な凝集剤注入率を記憶する記憶装置を有し、
前記コントローラは、
前記第2の水質分析装置から得られた水質分析測定結果に基づいて前記記憶装置から前記最適な凝集剤注入率を制御目標値としてフィードバックし、当該制御目標値に基づいて前記凝集剤注入装置の凝集剤注入を制御する請求項2に記載の水処理システム。 - 前記コントローラは、
前記凝集剤注入装置の注入開始時または水質変動時に、前記最適な凝集剤注入率を算出する請求項1から8のいずれか1項に記載の水処理システム。 - 前記他の水質測定項目は、濁度、シルト・デンシティ指数、モディファイド・ファウリング指数、全有機炭素量、紫外線吸光度、クロロフィル量、植物プランクトン数、および蛍光強度から選択される1つ又は2つ以上である請求項2または3のいずれか1項に記載の水処理システム。
- 溶質含有水をろ過して異物を除去する前処理を実行し、
前処理された溶質含有水から溶質を分離除去し、
前処理前の溶質含有水に対して凝集剤を注入し、
前処理された溶質含有水に対して複数の水質測定項目の水質測定を実行し、
前記水質測定の水質分析測定結果に基づいて、前記凝集剤注入を制御する水処理システムの凝集剤注入方法において、
前記水質分析測定結果と凝集剤注入率との間の相関を示す関係式に基づいて最適な凝集剤注入率を算出し、
前記凝集剤注入率に基づいて前記凝集剤注入を制御する水処理システムの凝集剤注入方法。
Applications Claiming Priority (2)
| Application Number | Priority Date | Filing Date | Title |
|---|---|---|---|
| JP2011033440A JP2012170848A (ja) | 2011-02-18 | 2011-02-18 | 水処理システム及びその凝集剤注入方法 |
| JP2011-033440 | 2011-02-18 |
Publications (1)
| Publication Number | Publication Date |
|---|---|
| WO2012111402A1 true WO2012111402A1 (ja) | 2012-08-23 |
Family
ID=46672339
Family Applications (1)
| Application Number | Title | Priority Date | Filing Date |
|---|---|---|---|
| PCT/JP2012/051671 WO2012111402A1 (ja) | 2011-02-18 | 2012-01-26 | 水処理システム及びその凝集剤注入方法 |
Country Status (2)
| Country | Link |
|---|---|
| JP (1) | JP2012170848A (ja) |
| WO (1) | WO2012111402A1 (ja) |
Cited By (2)
| Publication number | Priority date | Publication date | Assignee | Title |
|---|---|---|---|---|
| CN107073369A (zh) * | 2014-09-11 | 2017-08-18 | 三菱重工业株式会社 | 水处理装置以及水处理方法 |
| WO2018065674A1 (en) | 2016-10-07 | 2018-04-12 | Kemira Oyj | A method and system for controlling hydrophobic conditions and fouling in water intensive processes |
Families Citing this family (8)
| Publication number | Priority date | Publication date | Assignee | Title |
|---|---|---|---|---|
| JP5729077B2 (ja) * | 2011-03-28 | 2015-06-03 | 東京電力株式会社 | 浮遊性微細藻類の回収方法および浮遊性微細藻類の培養システム |
| JP2014176810A (ja) * | 2013-03-14 | 2014-09-25 | Toshiba Corp | 設計支援装置及び設計支援方法 |
| JP6394084B2 (ja) * | 2014-06-10 | 2018-09-26 | 三浦工業株式会社 | 河川水濾過装置の遠隔管理制御システム |
| JP6531416B2 (ja) * | 2015-02-10 | 2019-06-19 | 栗田工業株式会社 | 水中の高分子濃度の測定方法及び水処理方法 |
| JP2016128170A (ja) * | 2016-03-07 | 2016-07-14 | 株式会社東芝 | 設計支援装置及び設計支援方法 |
| JP6561082B2 (ja) * | 2017-02-21 | 2019-08-14 | 株式会社神鋼環境ソリューション | 水処理設備および水処理方法 |
| JP6630689B2 (ja) * | 2017-02-21 | 2020-01-15 | 株式会社神鋼環境ソリューション | 水処理設備および水処理方法 |
| KR102545236B1 (ko) | 2021-10-21 | 2023-06-19 | 두산에너빌리티 주식회사 | 역삼투막 해수담수화 플랜트를 제어하기 위한 장치 및 이를 위한 방법 |
Citations (4)
| Publication number | Priority date | Publication date | Assignee | Title |
|---|---|---|---|---|
| JPH04305206A (ja) * | 1991-04-01 | 1992-10-28 | Toyota Motor Corp | 水処理用凝集濾過装置 |
| JP2002239307A (ja) * | 2001-02-21 | 2002-08-27 | Nishihara Watertech Corp Ltd | 流動電流値による浄水用凝集剤自動注入装置 |
| JP2005125152A (ja) * | 2003-10-21 | 2005-05-19 | Kurita Water Ind Ltd | 水処理方法及び水処理装置 |
| JP2008194559A (ja) * | 2007-02-08 | 2008-08-28 | Toshiba Corp | 凝集剤注入制御装置 |
Family Cites Families (1)
| Publication number | Priority date | Publication date | Assignee | Title |
|---|---|---|---|---|
| JP5208061B2 (ja) * | 2009-06-29 | 2013-06-12 | 株式会社日立製作所 | 凝集剤注入制御システム |
-
2011
- 2011-02-18 JP JP2011033440A patent/JP2012170848A/ja active Pending
-
2012
- 2012-01-26 WO PCT/JP2012/051671 patent/WO2012111402A1/ja active Application Filing
Patent Citations (4)
| Publication number | Priority date | Publication date | Assignee | Title |
|---|---|---|---|---|
| JPH04305206A (ja) * | 1991-04-01 | 1992-10-28 | Toyota Motor Corp | 水処理用凝集濾過装置 |
| JP2002239307A (ja) * | 2001-02-21 | 2002-08-27 | Nishihara Watertech Corp Ltd | 流動電流値による浄水用凝集剤自動注入装置 |
| JP2005125152A (ja) * | 2003-10-21 | 2005-05-19 | Kurita Water Ind Ltd | 水処理方法及び水処理装置 |
| JP2008194559A (ja) * | 2007-02-08 | 2008-08-28 | Toshiba Corp | 凝集剤注入制御装置 |
Cited By (4)
| Publication number | Priority date | Publication date | Assignee | Title |
|---|---|---|---|---|
| CN107073369A (zh) * | 2014-09-11 | 2017-08-18 | 三菱重工业株式会社 | 水处理装置以及水处理方法 |
| EP3192577A4 (en) * | 2014-09-11 | 2018-05-09 | Mitsubishi Heavy Industries, Ltd. | Water treatment apparatus and water treatment method |
| WO2018065674A1 (en) | 2016-10-07 | 2018-04-12 | Kemira Oyj | A method and system for controlling hydrophobic conditions and fouling in water intensive processes |
| US11866356B2 (en) | 2016-10-07 | 2024-01-09 | Kemira Oyj | Method and system for controlling hydrophobic conditions and fouling in water intensive processes |
Also Published As
| Publication number | Publication date |
|---|---|
| JP2012170848A (ja) | 2012-09-10 |
Similar Documents
| Publication | Publication Date | Title |
|---|---|---|
| WO2012111402A1 (ja) | 水処理システム及びその凝集剤注入方法 | |
| US8685249B2 (en) | Multi-stage seawater desalination apparatus and operation control method of multi-stage seawater desalination apparatus | |
| Kim et al. | Overview of systems engineering approaches for a large-scale seawater desalination plant with a reverse osmosis network | |
| AU2010274473B2 (en) | Water producing system | |
| US20170209834A1 (en) | Self-adaptive control and optimization of membrane filtration | |
| Song et al. | Evaluation of scaling potential in a pilot-scale NF–SWRO integrated seawater desalination system | |
| JP2015042385A (ja) | 淡水化システム | |
| Jin et al. | Application of multiple modified fouling index (MFI) measurements at full-scale SWRO plant | |
| SG192894A1 (en) | Seawater desalination system and seawater desalination method | |
| McMordie Stoughton et al. | Reverse osmosis optimization | |
| Tabatabai | Coagulation and ultrafiltration in seawater reverse osmosis pretreatment | |
| JP2010029757A (ja) | 膜ろ過システム、及び膜ろ過システムの運転方法 | |
| Kim et al. | Evaluation of new compact pretreatment system for high turbidity seawater: Fiber filter and ultrafiltration | |
| Poerio et al. | Identification of fouling mechanisms in cross-flow microfiltration of olive-mills wastewater | |
| Monclús et al. | Knowledge-based control module for start-up of flat sheet MBRs | |
| Jeong et al. | Pre-treatment of SWRO pilot plant for desalination using submerged MF membrane process: Trouble shooting and optimization | |
| JP5377553B2 (ja) | 膜ろ過システムとその運転方法 | |
| KR101277199B1 (ko) | 해수담수화 전처리 장치 및 방법 | |
| Boulahfa et al. | Impact of the Raw Water Seasonal Variations on the Reverse Osmosis Performance: Khenifra Plant, Morocco | |
| KR101294599B1 (ko) | 분산분석 공정을 이용한 해수담수화용 역삼투막의 성능분석 방법 및 이를 수행하는 분석장치 | |
| Chang et al. | Comparison of SAR (sodium adsorption ratio) between RO and NF processes for the reclamation of secondary effluent | |
| CN105314708A (zh) | 海水淡化工艺控制方法和海水淡化系统 | |
| CN103304091A (zh) | 超滤系统 | |
| Wise et al. | Ceramic Ultrafiltration Membranes with Improved Economics, Operability, and Process Design Flexibility | |
| JP2018012061A (ja) | 逆浸透膜供給水の膜閉塞性評価方法及びその膜閉塞性評価方法を用いた水処理装置の運転管理方法 |
Legal Events
| Date | Code | Title | Description |
|---|---|---|---|
| 121 | Ep: the epo has been informed by wipo that ep was designated in this application |
Ref document number: 12746658 Country of ref document: EP Kind code of ref document: A1 |
|
| NENP | Non-entry into the national phase |
Ref country code: DE |
|
| 122 | Ep: pct application non-entry in european phase |
Ref document number: 12746658 Country of ref document: EP Kind code of ref document: A1 |