WO2012050170A1 - 磁気共鳴イメージング装置、磁気共鳴イメージング方法及び画像表示装置 - Google Patents
磁気共鳴イメージング装置、磁気共鳴イメージング方法及び画像表示装置 Download PDFInfo
- Publication number
- WO2012050170A1 WO2012050170A1 PCT/JP2011/073570 JP2011073570W WO2012050170A1 WO 2012050170 A1 WO2012050170 A1 WO 2012050170A1 JP 2011073570 W JP2011073570 W JP 2011073570W WO 2012050170 A1 WO2012050170 A1 WO 2012050170A1
- Authority
- WO
- WIPO (PCT)
- Prior art keywords
- value
- color
- pixel
- image
- magnetic resonance
- Prior art date
Links
Images


Classifications
-
- G—PHYSICS
- G01—MEASURING; TESTING
- G01R—MEASURING ELECTRIC VARIABLES; MEASURING MAGNETIC VARIABLES
- G01R33/00—Arrangements or instruments for measuring magnetic variables
- G01R33/20—Arrangements or instruments for measuring magnetic variables involving magnetic resonance
- G01R33/44—Arrangements or instruments for measuring magnetic variables involving magnetic resonance using nuclear magnetic resonance [NMR]
- G01R33/48—NMR imaging systems
- G01R33/54—Signal processing systems, e.g. using pulse sequences ; Generation or control of pulse sequences; Operator console
- G01R33/56—Image enhancement or correction, e.g. subtraction or averaging techniques, e.g. improvement of signal-to-noise ratio and resolution
- G01R33/5608—Data processing and visualization specially adapted for MR, e.g. for feature analysis and pattern recognition on the basis of measured MR data, segmentation of measured MR data, edge contour detection on the basis of measured MR data, for enhancing measured MR data in terms of signal-to-noise ratio by means of noise filtering or apodization, for enhancing measured MR data in terms of resolution by means for deblurring, windowing, zero filling, or generation of gray-scaled images, colour-coded images or images displaying vectors instead of pixels
-
- A—HUMAN NECESSITIES
- A61—MEDICAL OR VETERINARY SCIENCE; HYGIENE
- A61B—DIAGNOSIS; SURGERY; IDENTIFICATION
- A61B5/00—Measuring for diagnostic purposes; Identification of persons
- A61B5/05—Detecting, measuring or recording for diagnosis by means of electric currents or magnetic fields; Measuring using microwaves or radio waves
- A61B5/055—Detecting, measuring or recording for diagnosis by means of electric currents or magnetic fields; Measuring using microwaves or radio waves involving electronic [EMR] or nuclear [NMR] magnetic resonance, e.g. magnetic resonance imaging
-
- G—PHYSICS
- G01—MEASURING; TESTING
- G01R—MEASURING ELECTRIC VARIABLES; MEASURING MAGNETIC VARIABLES
- G01R33/00—Arrangements or instruments for measuring magnetic variables
- G01R33/20—Arrangements or instruments for measuring magnetic variables involving magnetic resonance
- G01R33/44—Arrangements or instruments for measuring magnetic variables involving magnetic resonance using nuclear magnetic resonance [NMR]
- G01R33/48—NMR imaging systems
- G01R33/50—NMR imaging systems based on the determination of relaxation times, e.g. T1 measurement by IR sequences; T2 measurement by multiple-echo sequences
Definitions
- Embodiments described herein relate generally to a magnetic resonance imaging apparatus, a magnetic resonance imaging method, and an image display apparatus.
- MRI Magnetic Resonance Imaging
- the problem to be solved by the present invention is to appropriately display an MR (Magnetic Resonance) image.
- the magnetic resonance imaging apparatus includes a storage unit, a specifying unit, and a display control unit.
- the storage unit stores a correspondence color table indicating a correspondence relationship between a T1 value whose numerical range for each tissue is known and a color assigned to a pixel having the T1 value.
- the specifying unit analyzes an image having a T1 value and specifies a color to be assigned to each pixel based on the T1 value converted from the pixel value of each pixel and the corresponding color table.
- the display control unit displays the image color-coded according to the specified color on the display unit.
- FIG. 1 is a schematic block diagram of an MRI system according to an embodiment.
- FIG. 2 is a schematic flowchart of an exemplary computer program code structure that can be used to execute the embodiments.
- FIG. 3 is a diagram illustrating a screen display example of a T1-weighted image indicating an organ displayed in two identifiable colors.
- FIG. 4 is a diagram illustrating a screen display example of the synthesized T1 weighted image.
- An MRI (Magnetic Resonance Imaging) system 100 shown in FIG. 1 includes a gantry 10 (shown in cross section) and various related system components 20 connected to each other. At least the gantry 10 is usually installed in a shield room.
- One MRI system 100 shown in FIG. 1 includes a substantially coaxial cylinder of a static magnetic field B 0 magnet 12, G x , G y and G z gradient magnetic field coil sets 14, and an RF (Radio Frequency) coil assembly 16. Including an arrangement of shapes.
- the MRI system control unit 22 includes an input / output port connected to the display unit 24, the keyboard / mouse 26, and the printer 28.
- the display unit 24 may be a diverse touch screen that also includes control inputs.
- the MRI system control unit 22 interfaces with the MRI sequence control unit 30.
- the MRI sequence control unit 30 includes the G x , G y , and G z gradient magnetic field coil drivers 32 and the RF transmission unit 34 and the transmission / reception switch 36 (when the same RF coil is used for both transmission and reception). Are controlled in order.
- the MRI sequence control unit 30 is already possible in the MRI sequence control unit 30 to collect images having T1 values (for example, by collecting multiple MR images collected at different TR (Repetition Times)).
- a suitable program code structure 38 for executing the MRI data acquisition sequence.
- the MRI system 100 includes an RF receiving unit 40 that supplies an input to the MRI data processing unit 42 so that processed image data to be output to the display unit 24 can be created. Further, the MRI data processing unit 42 may be configured to be able to access the image reconstruction program code structure 44 and the MR image storage unit 46 (for example, in the processing according to the embodiment and the image reconstruction program code structure 44). To store MR images with the obtained T1 values).
- FIG. 1 shows a generalized representation of the MRI system program / data storage unit 50.
- the program code structure stored in the MRI system program / data storage unit 50 (for example, for generating a color-coded T1-weighted image, operator input for generation, etc.) is used for various data processing of the MRI system 100.
- the MRI system program / data store 50 may be implemented in a variety of processing computers of the system 20 that have an immediate need for the program code structure so stored during normal operation.
- the computer may be divided and at least a part thereof may be directly connected (that is, instead of being normally stored in the MRI system control unit 22 or directly connected).
- FIG. 1 is a very highly simplified version of a typical MRI system 100 with some modifications to allow implementation of the embodiments described later herein.
- FIG. System components can be divided into various logic collection “boxes”, usually with a large number of digital signal processors (DSPs), ultra-compact processors, special purpose processing circuits (eg, high-speed A / D conversion, fast Fourier transform, array processing, etc.).
- DSPs digital signal processors
- ultra-compact processors special purpose processing circuits (eg, high-speed A / D conversion, fast Fourier transform, array processing, etc.).
- Each of these processors is typically a clocked “state machine” that progresses from one physical state to another when each clock cycle (or a predetermined number of clock cycles) occurs. is there.
- the physical state of the processing circuit eg, CPU (Central Processing Unit), registers, buffers, computing units, etc.
- the physical state of a data storage medium eg, the bit storage portion of a magnetic storage medium
- the array of computer readable accessible data value storage locations on the physical storage medium may have several pre-states (eg, all uniform “zero” values or all “1”). Value) to a new state.
- such an array of stored data values represents and also constitutes a physical structure. That is, when sequentially read into the instruction register and executed by one or more CPUs of the MRI system 100, a specific sequence of operating states is generated and the computer control program code transferred into the MRI system 100 A specific structure is constructed.
- the following embodiments provide an improved method for performing data acquisition processing and / or MR image generation and / or display.
- the MRI system 100 analyzes an image having a T1 value, assigns a color to each pixel in the image, and displays the color-coded image on the display unit.
- T1 is a relaxation time related to the recovery of magnetization on the z-axis.
- the “image having T1 value” includes “T1 image” and “T1 weighted image”.
- the “T1 image” is an image as an ideal value that is collected using TR (Repetition Time) that is, for example, 5 times T1 and is not affected by T2.
- the “T1-weighted image” is an image in which the signal intensity of the T1 value is collected using a TR shorter than 5 times TR.
- the “T1-weighted image” usually has a short TR (for example, about 500 msec or less) and a short TE (Echo Time).
- the MRI system 100 according to the embodiment is described as using a “T1-weighted image” as an “image having a T1 value”, but is not limited thereto, and similarly when using a “T1 image”. Can be applied. Regarding other points as well, the embodiment is not limited to the following.
- tissues are 1 It can be inferred that it has different T1 value ranges in both the imaging parameters of .5 Tesla and 3.0 Tesla.
- Table 2 average T2 relaxation time using 1.5 Tesla and 3.0 Tesla
- the T2 values are relatively similar and have a partially overlapping range. It is difficult to do.
- the MRI system 100 adopts a method of assigning colors according to the range of the T1 value, but the embodiment is not limited to this, and for example, collects T2-weighted images.
- a method of assigning colors according to the range of the T2 value may be employed.
- the MRI system 100 uses a T1-weighted image in order to obtain an improved CAD (Computer Aided Diagnostic) image.
- CAD Computer Aided Diagnostic
- the present invention is not limited to this, and the obtained image is used for any purpose (for purposes other than CAD). May be.
- the MRI system 100 according to the embodiment is effective when applied to a body region other than intracranial MRA (Magnetic Resonance Angiography) and breast tissue, for example.
- pattern A there is a method of obtaining a T1 value by conversion from the pixel value of each pixel included in the T1-weighted image and specifying a color to be assigned to each pixel based on the obtained T1 value.
- this method is referred to as “pattern A”.
- the pixel value is converted to the T1 value.
- pattern A1 a method for realizing this conversion by analyzing a plurality of T1 weighted images having different imaging conditions.
- pattern A2 A method for realizing this conversion using a correspondence value table indicating the correspondence between pixel values and T1 values.
- the embodiment there is a method of specifying a color to be assigned to each pixel based on the pixel value itself of each pixel included in the T1-weighted image.
- this method is referred to as “pattern B”.
- the T1-weighted image may be collected by the MRI system 100, or may be collected in advance and input to the MRI system 100. Below, the case where it collects by the MRI system 100 is demonstrated.
- the MRI system 100 includes a storage unit, a specifying unit, and a display control unit.
- the storage unit stores a correspondence color table indicating a correspondence relationship between a T1 value for which a numerical range for each tissue is known and a color assigned to a pixel having the T1 value.
- the specifying unit analyzes the T1-weighted image and specifies a color to be assigned to each pixel based on the T1 value converted from the pixel value of each pixel and the corresponding color table.
- the display control unit displays a T1-weighted image (hereinafter, referred to as “color coded T1-weighted image” as appropriate) color-coded by the specified color on the display unit 24.
- the storage unit is provided in the MRI system program / data storage unit 50, and the specifying unit and the display control unit are provided in the MRI system control unit 22 (not shown).
- the storage unit of the MRI system 100 stores a corresponding color table indicating the correspondence between T1 values and colors.
- the storage unit stores the correspondence between the T1 value (for example, 586 ⁇ 39) corresponding to the liver tissue and “brown”, the T1 value (for example, 966 ⁇ 58) corresponding to the kidney cortex, and “white”.
- a correspondence color table indicating the correspondence relationship is stored.
- the T1 value and the color assignment are only examples.
- the T1 value of the corresponding color table is a T1 value that is known as a numerical range for each tissue, and is a T1 value that is an empirical value measured for each tissue.
- the MRI system 100 can measure and store the numerical range of the T1 value by performing various imaging under different imaging conditions and different coils. For example, the MRI system 100 accumulates as an experience value how much the numerical range is in the case of liver tissue. Therefore, the storage unit stores a corresponding color table indicating the correspondence between the T1 value as an experience value and the color.
- the storage unit may store a corresponding color table in advance, or may receive and store an input of a correspondence relationship from the operator each time.
- the MRI system 100 collects T1-weighted images.
- the MRI system 100 collects a plurality of T1-weighted images while changing imaging conditions (for example, TR, TE, pulse sequence type, etc.).
- imaging conditions for example, TR, TE, pulse sequence type, etc.
- multiple T1-weighted images can be obtained at various TRs so that the T1 value is determined by a process that fits an exponential function.
- Various TIs Inversion Time
- IR Inversion Recovery
- each tissue of the subject has a different T1 relaxation time. Therefore, in some T1-weighted images collected under certain imaging conditions, there are tissues where the signal intensity is high, and the signal intensity is low. Some organizations. Therefore, for example, the MRI system 100 collects a plurality of T1-weighted images while changing the imaging conditions so that the signal intensity of each target tissue increases.
- the MRI system 100 collects the T1-weighted image I1 after adjusting the imaging conditions (TR, TE, etc.) so that the signal intensity of the pixel corresponding to the liver tissue is enhanced, for example. .
- the MRI system 100 collects the T1-weighted image I2 after adjusting the imaging conditions (TR, TE, etc.) so that the signal intensity of the pixel corresponding to the cortex of the kidney is enhanced.
- the MRI system 100 collects the T1-weighted image I3 after adjusting the imaging conditions (TR, TE, etc.) so that the signal intensity of the pixel corresponding to the medulla of the kidney is enhanced, for example.
- the MRI system 100 collects the T1-weighted image I4 after adjusting the imaging conditions (TR, TE, etc.) so that the signal intensity of the pixel corresponding to the spleen is enhanced.
- the MRI system 100 may further collect other T1-weighted images.
- T1-weighted images there are two purposes in collecting a plurality of T1-weighted images in the pattern A1. One is to convert the T1 value from the pixel value, and the other is to increase the signal intensity of each tissue as described above.
- the specific unit of the MRI system 100 analyzes the plurality of T1-weighted images, and converts the T1 value from the pixel value of each pixel by calculation using the plurality of imaging conditions and the pixel values of the plurality of T1-weighted images.
- the pixel value of the T1-weighted image is defined by a mathematical expression having the T1 value, the T2 value, and the imaging conditions (TR, TE, etc.) as variables. Therefore, when the T1 value and the T2 value are unknown, the specifying unit can calculate the T1 value of each pixel of each T1-weighted image by solving simultaneous equations using pixel values of two or more T1-weighted images. it can.
- the specifying unit refers to the corresponding color table using the converted T1 value, and specifies the “color” stored in association with the T1 value as the color to be assigned to this pixel. For example, when the converted T1 value is within the range of 586 ⁇ 39, the specifying unit refers to the corresponding color table and specifies that “brown” is assigned to this pixel. In this way, the specifying unit specifies the color assigned to each pixel of each T1-weighted image.
- the display control unit synthesizes the color-coded T1 weighted images and displays them on the display unit 24.
- the display control unit generates and displays a color coded T1-weighted image I5 by combining the T1-weighted images I1 to I4 to which colors are assigned.
- the color-coded T1-weighted image I5 is displayed as if it is a schematic diagram.
- the color may be assigned within the range so as to change from “light brown” to “dark brown”, for example, centering on the center value of the T1 value.
- the MRI system 100 includes a storage unit, a specifying unit, and a display control unit, similar to the pattern A1, but the storage unit includes pixel values whose numerical ranges for each tissue are known. Further, a correspondence value table showing a correspondence relationship with a T1 value whose numerical range for each tissue is known is further provided. Further, in the pattern A2, the specifying unit converts the T1 value from the pixel value of each pixel based on the pixel value of each pixel and the corresponding value table.
- the storage unit of the MRI system 100 further stores a correspondence value table indicating a correspondence relationship between pixel values and T1 values.
- the storage unit stores a correspondence value table indicating a correspondence relationship between a pixel value and a T1 value corresponding to the pixel value for each imaging condition.
- the MRI system 100 can measure and store the correspondence between the pixel value and the T1 value by performing various imaging under different imaging conditions and different coils. Therefore, the storage unit stores a correspondence value table indicating the correspondence between the pixel value as the experience value and the T1 value.
- the storage unit may store the corresponding value table in advance, or may receive and store the input of the corresponding relationship from the operator each time.
- the specifying unit performs conversion using the corresponding value table. For example, using the pixel value of each pixel of each T1-weighted image, the specifying unit refers to a corresponding value table that matches the imaging conditions, and stores this pixel value in association with this pixel value “T1 Convert to "value”. After that, it is the same as the pattern A1, and the specifying unit refers to the corresponding color table using the converted T1 value, and specifies the “color” stored in association with the T1 value as the color to be assigned to this pixel. . Further, the display control unit synthesizes the color-coded T1 weighted images and displays them on the display unit 24.
- a plurality of T1-weighted images are used for the purpose of converting the T1 value from the pixel value and for the purpose of increasing the signal intensity of each tissue. Since the conversion to the T1 value is realized by using the correspondence value table, it is not always necessary to use a plurality of T1 weighted images. That is, in the case of the pattern A2, a color coded T1 weighted image may be generated and displayed by analyzing one T1 weighted image.
- the above-described correspondence value table is a correspondence relationship between a “sample image group for each tissue” collected in advance for a plurality of patients and a “T1 value as an experience value” converted in advance as a T1 value of each sample image. May be shown.
- the specifying unit collates the T1-weighted image collected so that the signal intensity of the pixel corresponding to a certain tissue is emphasized with the sample image group corresponding to the tissue, The degree of correlation with the sample image is obtained.
- the specifying unit specifies the sample image having the highest degree of correlation from the sample image group, and refers to the correspondence value table to obtain the “T1 value” stored in association with the sample image. To do.
- the specifying unit converts the pixel value into the acquired “T1 value” only for the pixel having a signal intensity equal to or higher than a predetermined threshold among the pixels included in the T1-weighted image to be color-coded.
- the specifying unit does not assign a color to a pixel whose signal intensity is lower than the predetermined threshold. That is, since this T1-weighted image is collected so that the signal intensity of the pixel corresponding to a certain tissue is emphasized, only the target tissue is extracted from the T1-weighted image by sorting by this threshold value. Can do.
- the specifying unit refers to the corresponding color table using the converted T1 value, and specifies the “color” stored in association with the T1 value as the color to be assigned to this pixel. Note that the specifying unit performs such conversion processing and specifying processing for each T1-weighted image corresponding to each tissue.
- the display control unit synthesizes the color-coded T1-weighted images and displays them on the display unit 24.
- the T1 value in the corresponding color table or the corresponding value table may be a “T1 value as an ideal value” regarding each tissue of the subject.
- the MRI system 100 needs to further have a function of converting the pixel value of each pixel into a “T1 value as an ideal value”.
- the MRI system 100 can measure and store the correspondence between the “pixel value” and the “T1 value” by performing various imaging under different imaging conditions and different coils. Therefore, the MRI system 100 associates the T1 value accumulated as the empirical value with the T1 value as the ideal value, thereby creating a table indicating the correspondence between the “pixel value” and the “T1 value as the ideal value”. What is necessary is just to create and memorize
- the MRI system 100 includes a storage unit, a specifying unit, and a display control unit.
- the storage unit stores a correspondence color table indicating a correspondence relationship between a pixel value corresponding to a T1 value whose numerical range for each tissue is known and a color assigned to a pixel having this pixel value.
- the specifying unit analyzes the T1-weighted image and specifies a color to be assigned to each pixel based on the pixel value of each pixel and the corresponding color table.
- the specifying unit refers to the corresponding color table using the pixel value of each pixel in each T1-weighted image, and specifies the “color” stored in association with this pixel value as the color to be assigned to this pixel.
- the display control unit displays the T1-weighted image color-coded by the specified color on the display unit 24.
- the storage unit is provided in the MRI system program / data storage unit 50, and the specifying unit and the display control unit are provided in the MRI system control unit 22 (not shown).
- the color assigned to each pixel is specified based on the pixel value itself of each pixel included in the T1-weighted image.
- a corresponding color table is prepared for each imaging condition. This is because the pixel value of each pixel varies depending on the imaging conditions.
- the above is the description of the pattern A1, the pattern A2, and the pattern B.
- various embodiments described below can be applied to the pattern A1, the pattern A2, and the pattern B.
- the color-coded display of the T1 value in the T1-weighted image may cause the display of normal and abnormal tissue signals to be more easily distinguished by the human eye during diagnosis, for example.
- regions of coarse T1 values estimated using IR pulses are accumulated over time that allows better tissue characterization (eg, to distinguish cancerous tumor cells from other tissues). Is possible.
- the signal intensity of the pixel corresponding to each tissue is considered to change along a different curve. That is, the peak time varies depending on the T1 relaxation time, and whether the curve is steep or gentle varies.
- a curve in which the signal intensity of a normal tissue including the cancerous tumor tissue changes and a curve in which the signal intensity of the cancerous tumor tissue changes are usually different.
- the MRI system 100 may collect a plurality of T1-weighted images while changing the imaging conditions, accumulate them, color-code each of them, and continuously display them on the display unit 24, for example.
- the MRI system 100 allows for distinction between the various organizations.
- the threshold range of the T1 value is determined.
- it is proposed to color code such a range of T1 values eg, by a color assigned to a certain range of T1 values or to a specific range of T1 values).
- T1 weighted image By displaying such a color coded T1 weighted image, better visual recognition of the target tissue can be realized without using a contrast agent.
- contrast agents eg, it can be assumed that the T1 value of cancerous tumor tissue as well as normal tissue is further altered).
- the plurality of T1-weighted images include a color-coded T1-weighted image and a reference image (as will be described later, for example, a T1-weighted image that has not been color-coded, the collected T1-weighted image itself, and other morphological images). You can get all or any.
- One or more colors are assigned to the range of the T1 value related to the target tissue and can be used as a threshold range.
- the first color spectrum A may be assigned to the spectrum of the first T1 value.
- the second different color spectrum B may be assigned to a spectrum with a different T1 value (since it may correspond to cancerous tissue that may be present in the tissue or body region of interest). Good.
- both before and after contrast agent injection to facilitate detection of abnormal tissue compared between images before and after contrast agent injection.
- the image display can be obtained.
- the MRI system 100 may collect a T1-weighted image without injecting a contrast agent into the subject, may collect a T1-weighted image with a contrast agent injected into the subject,
- the T1-weighted images may be collected before and after the injection of the contrast agent.
- the specifying unit specifies the color using the T1-weighted images collected before and after the injection of the contrast agent, and the display control unit A color-coded T1-weighted image created from the T1-weighted image may be displayed on the display unit 24.
- the display control unit may generate a color-coded T1 weighted image from each of the T1 weighted images collected before and after the injection of the contrast agent, and display both of them on the display unit 24.
- the display control unit synthesizes while partially extracting pixels in which the contrast of each tissue is well drawn from both T1-weighted images collected before and after the injection of the contrast agent, and performs color coding after the synthesis
- a T1-weighted image may be displayed on the display unit 24.
- regions with such abnormal T1 values will have a noticeable color or color spectrum (eg, a red spectrum or a single red value). Can be highlighted).
- An MRI system 100 configured to output such a color coded T1 weighted image display provides a T1 weighted image depicting the same region with conventional display parameters (eg, contrast, gray scale, etc.). be able to.
- the display control unit may superimpose and display the color coded T1-weighted image after color coding on the T1-weighted image before color coding.
- the display control unit may superimpose and display the color coded T1-weighted image after color coding on a morphological image in which the shape such as a bone is known.
- the display control unit may give transparency to the color-coded T1-weighted image.
- the display control unit may perform 2D display or 3D display.
- the observer can obtain information such as the size in the depth direction of the cancerous tumor tissue in the liver tissue, for example.
- the use of color-coded T1-weighted images can provide a diagnostic tool useful for computer-aided diagnosis that more correctly distinguishes abnormal tissue from normal tissue based on different tissues each having a different T1 value.
- the set of color coded T1 weighted images can also be used for CAD with mammography and chest dynamic contrast enhancement (DCE).
- DCE chest dynamic contrast enhancement
- the MRI system 100 can obtain a plurality of T1 weighted images (or T1 with IR pulses) to generate a color coded T1 weighted image and a reference image.
- the MRI system 100 can then utilize different threshold ranges of T1 values to assign colors corresponding to various ranges of T1 values.
- Such a threshold range allows the MRI system 100 to represent tissue within a normal range in one color (or color spectrum) and an abnormal signal in another color (or color spectrum).
- the MRI system 100 analyzes whether or not a pixel having a T1 value not included in the predetermined range is included in an area formed by a pixel group having a T1 value included in the predetermined range. May be further provided.
- the specifying unit when it is analyzed that the pixel having the T1 value not included in the predetermined range is included in the region, the specifying unit assigns the first color to the pixel group having the T1 value included in the predetermined range.
- a second color different from the first color is assigned to a pixel having a T1 value not included in the predetermined range.
- the specifying unit may perform control so as to assign a predetermined color (for example, red) as a color indicating tissue abnormality as the second color.
- T1 ranges with coarse T1 values can be imaging sequences, non-uniformity of BO and / or B1, etc. It can be estimated by the measurement method.
- an image having T1 value includes “T1 image” and “T1 weighted image”, and “T1 image” is an image as an ideal value, and “T1 weighted image” is a signal strength of T1 value. As described above, it is an image in which is emphasized.
- the data listed in Tables 1 and 2 are considered to be in the range of T1 values as ideal values for each tissue of the subject.
- the MRI system 100 can actually measure and store the range of the T1 value by performing various imaging with different pulse sequences, different coils, and the like. For example, in the case of liver tissue, the extent of the T1 value is accumulated as an experience value.
- the color coded T1 weighted image display rendered before the contrast agent injection with the color coded T1 weighted image representation rendered after the contrast agent injection, It can be displayed in various colors.
- the range of T1 values for various abnormal tissues can be stored in a database and used as reference data to identify a particular type of tumor or cancerous tissue.
- the color coded T1 imaging CAD module can be implemented in any suitable operator input or system input mode.
- the operator may perform operations using icons that can be selected with a mouse, touch-sensitive icons, keyboard commands, and the like.
- the system can actually select the input to this module based on some other criteria.
- an MR image having a T1 value of the region of interest (ROI (Region Of Interest)) of the subject is acquired.
- An image having such a T1 value may be acquired by retrieval from the storage unit, or may be acquired from the beginning in real time by suitable MRI data acquisition using suitable MRI sequences, calculations, etc.
- an MR image of the subject ROI having a pixel with a T1 value or at least a T1 enhancement value can be generated.
- the standby loop step S02 starts.
- the operator / system can select the target organ / tissue. For example, based on the entries in Table 1, the operator and / or system may estimate pre-stored T1 values for all or any of the many different organs and tissues that are likely to be of interest. Access to the range is possible. These pre-stored guess range values can be used "as is".
- the operator / system also has the option of slightly changing the range (eg, allowing the range to be expanded or reduced and / or weighted according to the desired criteria) .
- the operator / system also has the option of selecting “Other” as shown in box a. In box a, complete freedom is given to identify any desired specific range of T1 values that may be of interest to a particular target anatomy.
- the operator / system has an option to approve the range to be color-coded or the range of the changed T1 value, as shown in the optional waiting loop S03 of FIG.
- the operator / system may use FIG. 2 to approve and / or change the color values, spectrum, etc. used for various T1 values and / or ranges of values. It can have any waiting loop S04 as shown.
- a specific color value is assigned to a pixel having a specific T1 value.
- Step S06 of FIG. 2 for pixels having abnormal T1 values outside the range eg, may be surrounded by pixels having values in the normal range
- step S07 Tests as shown in If such an abnormal set of pixels having a T1 value is found (Yes at step S06), such abnormal pixels are assigned different color (or color spectrum) codes, as shown in step S07. .
- the color-coded T1-weighted image is displayed for the purpose of CAD, for example.
- This color coded T1 weighted image can also be stored and / or output (eg, to a printer or remote location) as shown in step S09 of FIG. 2 before the module is terminated. .
- FIG. 3 a diagram as schematically shown in FIG. 3 can be displayed.
- the organ 302 is depicted as a pixel having a T1 value assigned with the color spectrum A and estimated to be normal.
- pixels with unexpected abnormal values are found in the region 304 and assigned a color spectrum B with a different contrast ratio.
- the system may be configured so that the operator / system can be assigned different color spectra to pixels having different ranges of T1 values so as to optimize the CAD display for a particular application. it can.
- the embodiment is not limited thereto, and the image display device A storage unit, a specifying unit, and a display control unit may be provided.
- the image display device is, for example, a personal computer or a workstation.
- the storage unit of the image display device stores a correspondence color table indicating a correspondence relationship between a T1 value whose numerical range for each tissue is known and a color assigned to a pixel having the T1 value.
- the specifying unit analyzes an image having a T1 value and specifies a color to be assigned to each pixel based on the T1 value converted from the pixel value of each pixel and the corresponding color table.
- the display control unit displays an image color-coded according to the specified color on the display unit.
- storage part of an image display apparatus memorize
- the specifying unit analyzes an image having a T1 value and specifies a color to be assigned to each pixel based on the pixel value of each pixel and the corresponding color table.
- the display control unit displays an image color-coded according to the specified color on the display unit.
- the storage unit is, for example, a memory, and the specifying unit and the display control unit are, for example, a processor.
- the MRI system 100 may use only the real part without using the imaginary part of the complex number when reconstructing the T1-weighted image.
- the MRI system 100 can obtain an accurate T1 value from the inclination by analyzing using only the real part.
- magnetic resonance imaging apparatus magnetic resonance imaging method, and image display apparatus of at least one embodiment described above, it is possible to appropriately display MR images.
Abstract
実施形態に係る磁気共鳴イメージング装置(100)は、記憶部(50)と、特定部(22)と、表示制御部(22)とを備える。前記記憶部(50)は、組織毎の数値範囲が既知であるT1値と、該T1値を有する画素に割り当てる色との対応関係を示す対応色テーブルを記憶する。前記特定部(22)は、T1値を有する画像を解析し、各画素の画素値から換算されるT1値と前記対応色テーブルとに基づいて、各画素に割り当てる色を特定する。前記表示制御部(22)は、特定された色により色分けされた前記画像を表示部(24)に表示する。
Description
本発明の実施形態は、磁気共鳴イメージング装置、磁気共鳴イメージング方法及び画像表示装置に関する。
従来、磁気共鳴イメージング装置(以下、MRI(Magnetic Resonance Imaging)システム)による撮像においては、パルスシーケンスの撮像条件を変更することで、縦緩和時間であるT1を強調したT1強調画像や、横緩和時間であるT2を強調したT2強調画像を収集する。
Kuhl, et al., "Dynamic Breast MR Imaging:Are Signal Intensity Time Course Data Useful for Differential Diagnosis ofEnhancing Lesions?," Radiology, Vol211, No.1, pages 101-110(April 1999)
Kuhl, "The Current Status of Breast MRImaging, Part I, Choice of Technique, Image Interpretation, DiagnosticAccuracy, and Transfer toClinical Practice," Radiology, Vol.244, No.2, pages 356-378(August 2007)
Kuhl, "Current Status of Breast MR Imaging,Part 2, Clinical Applications," Radiology, Vol.244, No.3, pages672-691(September 2007)
Breger, et al., "T1 and T2 Measurements on a1.5-T Commercial MR Imager," Radiology, Vol.171, No.1, pages 273-276(April1989)
De Bazelaire, etal., "MR Imaging Relaxation Times of Abdominal andPelvic Tissues Measured in Vivo at 3.0T:Preliminary Results," Radiology,Vol.230, No.3, pages 652-659(March 2004)
Stanisz, et al., "T1,T2 Relaxation andMagnetization Transfer in Tissue at 3T," Magnetic Resonance in Medicine,Vol.54, pages 507-512(2005)
本発明が解決しようとする課題は、MR(Magnetic Resonance)画像を適切に表示することである。
実施形態に係る磁気共鳴イメージング装置は、記憶部と、特定部と、表示制御部とを備える。前記記憶部は、組織毎の数値範囲が既知であるT1値と、該T1値を有する画素に割り当てる色との対応関係を示す対応色テーブルを記憶する。前記特定部は、T1値を有する画像を解析し、各画素の画素値から換算されるT1値と前記対応色テーブルとに基づいて、各画素に割り当てる色を特定する。前記表示制御部は、特定された色により色分けされた前記画像を表示部に表示する。
図1に示すMRI(Magnetic Resonance Imaging)システム100は、架台部10(断面図で示す)と、互いに接続される様々な関連のシステム構成要素20とを含む。少なくとも架台部10は、通常シールドルーム内に設置される。図1に示す1つのMRIシステム100は、静磁場B0磁石12と、Gx、Gy、及びGz傾斜磁場コイルセット14と、RF(Radio Frequency)コイルアセンブリ16との実質的に同軸円筒状の配置を含む。この円筒状に配置された要素の水平軸線に沿って、被検体テーブル11によって支持された被検体9の頭部を取り囲むように示された撮像ボリューム18がある。
MRIシステム制御部22は、表示部24、キーボード/マウス26、及びプリンタ28に接続される入力/出力ポートを備える。言うまでもなく、表示部24は、制御入力もまた備えるような多様性のあるタッチスクリーンであってもよい。
MRIシステム制御部22は、MRIシーケンス制御部30とインタフェース接続する。MRIシーケンス制御部30は、Gx、Gy、Gz傾斜磁場コイルドライバ32、並びに、RF送信部34及び送信/受信スイッチ36(同じRFコイルが送信及び受信の両方に使用されている場合)を順に制御する。MRIシーケンス制御部30は、(例えば、異なるTR(Repetition Time)で収集された複数のMR画像を収集することによって)T1値を有する画像を収集するために、既にMRIシーケンス制御部30にて可能な、MRIデータ取得シーケンスを実行するための適切なプログラムコード構造38を含む。
MRIシステム100は、表示部24に出力する処理された画像データを作成できるように、MRIデータ処理部42に入力を供給するRF受信部40を含む。また、MRIデータ処理部42を、画像再構成プログラムコード構造44及びMR画像記憶部46にアクセスできるように構成してもよい(例えば、実施形態及び画像再構成プログラムコード構造44に従った処理で得られたT1値を有するMR画像を格納するために)。
また、図1は、MRIシステムプログラム/データ格納部50を一般化した描写を示す。MRIシステムプログラム/データ格納部50に格納されるプログラムコード構造(例えば、カラーコード化されたT1強調画像の生成、生成のための操作者入力等のため)は、MRIシステム100の様々なデータ処理構成要素にアクセス可能なコンピュータ読み取り可能な記憶媒体に格納される。当業者には自明であるが、MRIシステムプログラム/データ格納部50は、正常運転時にそのように格納されたプログラムコード構造に対して直近の必要性を有するシステム20の処理コンピュータのうちの様々なコンピュータに分割し、且つ少なくとも一部を直結してもよい(すなわち、MRIシステム制御部22に普通に格納したり、直結したりする代わりに)。
実際、当業者には自明であるが、図1の描写は、本明細書で後述する実施形態を実行できるように若干の変更を加えた一般的なMRIシステム100の非常に高度に簡素化した図である。システム構成要素は、様々な論理収集の「ボックス」に分割でき、通常、多数のデジタル信号処理装置(DSP(Digital Signal Processors))、超小型演算処理装置、特殊用途向け処理回路(例えば、高速A/D変換、高速フーリエ変換、アレイ処理用等)を含む。これら処理装置のそれぞれは、通常、各クロックサイクル(又は所定数のクロックサイクル)が発生すると、物理データ処理回路がある物理的状態から別の物理的状態へ進むクロック動作型の「状態機械」である。
動作中に、処理回路(例えば、CPU(Central Processing Unit)、レジスタ、バッファ、計算ユニット等)の物理的状態が、あるクロックサイクルから別のクロックサイクルへ漸進的に変化するだけでなく、連結されているデータ格納媒体(例えば、磁気記憶媒体のビット格納部)の物理的状態も、そのようなシステムの動作中に、ある状態から別の状態へ変わる。例えば、MRI再構成プロセスの終了時、物理的記憶媒体のコンピュータ読み取り可能なアクセス可能データ値格納場所のアレイは、いくつかの事前の状態(例えば、全部一律の「ゼロ」値又は全部「1」値)から新しい状態に変わる。その新しい状態では、そのようなアレイの物理的場所の物理的状態は、最小値と最大値との間で変動し、現実世界の物理的事象及び状況(例えば、撮像ボリューム空間内の被検体の組織)を表現する。当業者には自明であるが、格納されたデータ値のそのようなアレイは、物理的構造を表し且つ構成もする。つまり、命令レジスタの中に順次読み込まれてMRIシステム100の1つ以上のCPUによって実行されたとき、動作状態の特定シーケンスが発生して、MRIシステム100内中に移行されるコンピュータ制御プログラムコードの特定構造が構成される。
下記の実施形態は、データ取得の処理と、MR画像の生成及び表示の両方又は一方を行うための改良された方法を提供する。
実施形態に係るMRIシステム100は、T1値を有する画像を解析することで、画像内の各画素に色を割り当て、色分けされた画像を表示部に表示する。なお、「T1」は、z軸上の磁化の回復に関する緩和時間である。また、「T1値を有する画像」には、「T1画像」及び「T1強調画像」が含まれる。「T1画像」は、T1の例えば5倍のTR(Repetition Time)を用いて収集された、T2の影響を受けない理想値としての画像である。これに対し、「T1強調画像」とは、5倍のTRよりも短いTRを用いて収集された、T1値の信号強度を強調した画像である。例えば、通常、「T1強調画像」は、TRが短く(例えば、500msec程度以下)、TE(Echo Time)も短い。実施形態に係るMRIシステム100は、「T1値を有する画像」として「T1強調画像」を用いるものとして説明するが、これに限られるものではなく、「T1画像」を用いた場合にも同様に適用することができる。他の点についても、実施形態は以下に限定されるものではない。
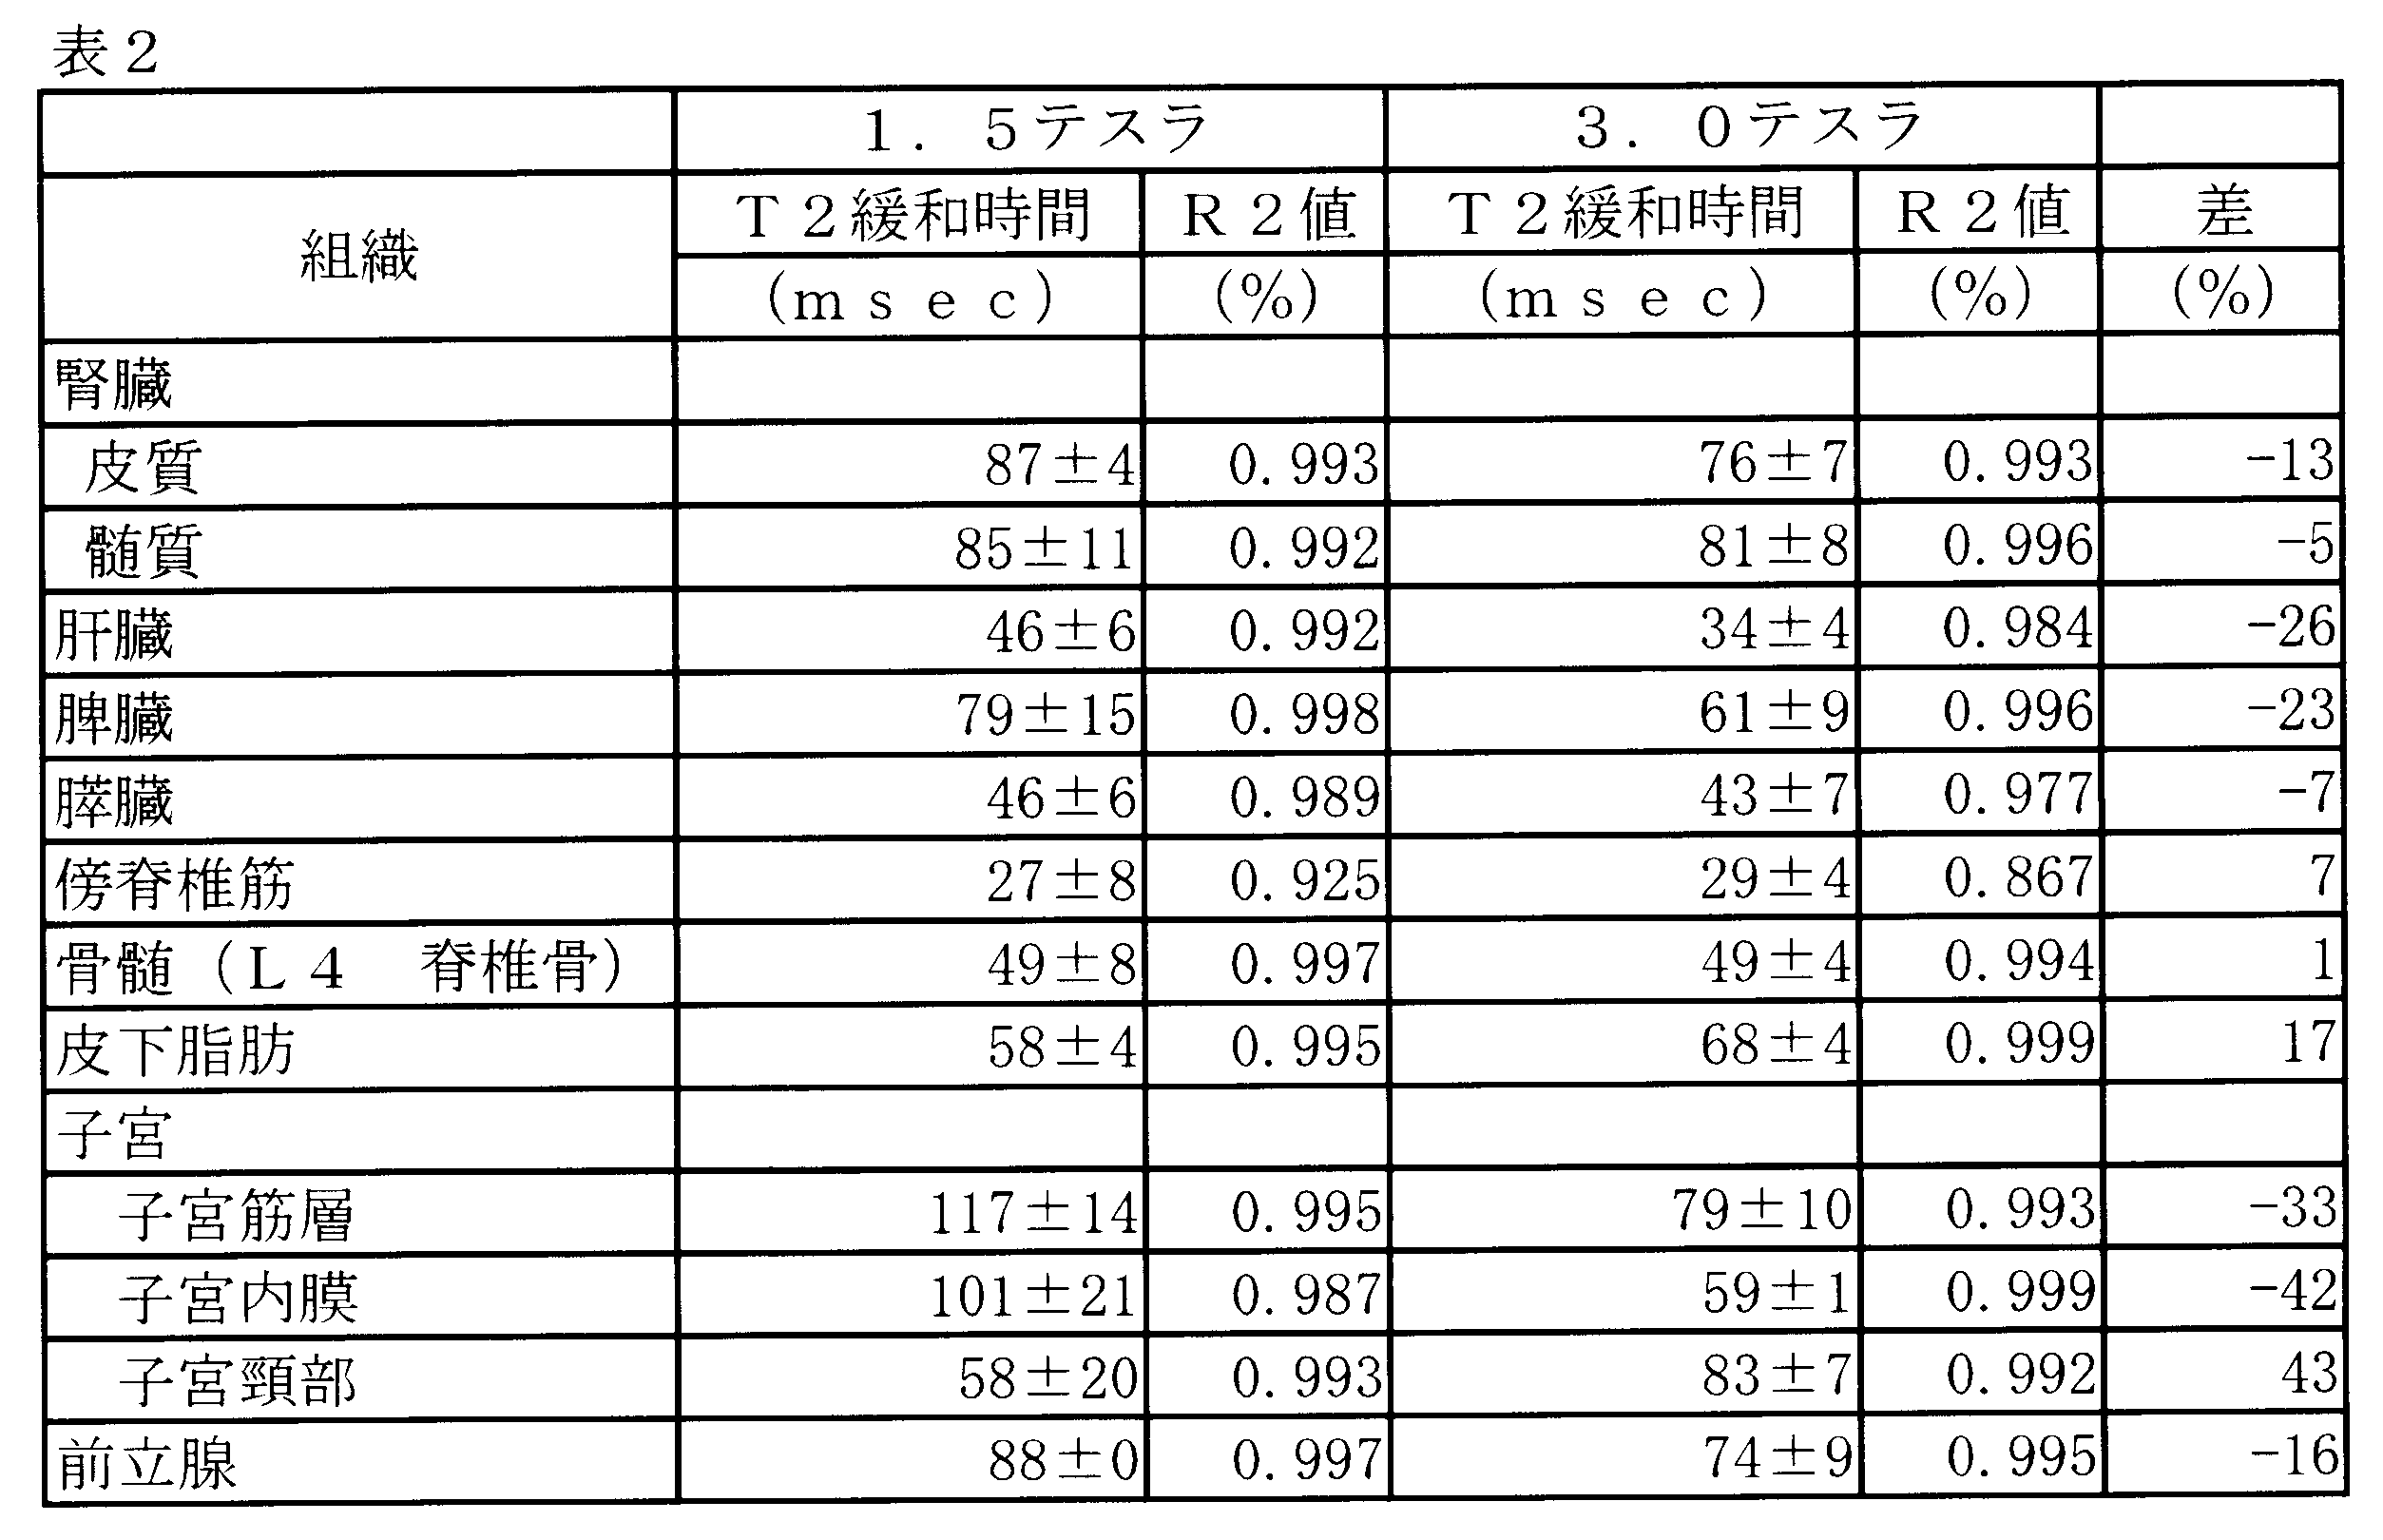
以下、具体例を挙げつつ、実施形態を説明する。被検体の解剖学的組織の中に造影剤を注入しても、画像を診断目的で使用するとき、強調されたMR信号をなお見落とす場合がある。しかし、表1(1.5テスラ及び3.0テスラを用いた平均T1緩和時間)からわかるように、様々な組織(以下、組織及び臓器の両方又は一方を適宜「組織」という)は、1.5テスラ及び3.0テスラの撮像パラメータの両方において異なるT1値の範囲を有することが推測できる。一方、表2(1.5テスラ及び3.0テスラを用いた平均T2緩和時間)からわかるように、T2値は、比較的類似していて、一部重複している範囲を有し、区別するのが難しいものである。このようなことから、以下の実施形態に係るMRIシステム100は、T1値の範囲に応じて色を割り当てる手法を採るが、実施形態はこれに限られるものではなく、例えば、T2強調画像を収集し、T2値の範囲に応じて色を割り当てる手法を採用してもよい。あるいは、例えば、T1値及びT2値の両方を、例えば選択的に用いて色を割り当てる手法を採用してもよい。
以下の表は、デ・バゼライル(de Bazelaire)共著「3Tを用いて生体内で測定された腹部及び骨盤の組織のMRイメージング緩和時間(MR Imaging Relaxation Times of Abdominal and Pelvic Tissues Measured in Vivo at 3.0T)」、放射線学 230:3、652~659頁、2004年3月から転載した。当業者には自明であるが、他にも簡単に入手可能な類似のデータの出版物がある。例えば、スタニズ(Stanisz)共著「3Tを用いた組織内のT1、T2緩和及び磁化移動(T1、T2 Relaxation and Magnetization Transfer in Tissue at 3T)」、MRIM 54:507~512(2005)参照。

実施形態に係るMRIシステム100は、改良されたCAD(Computer Aided Diagnostic)画像を得るために、T1強調画像を用いる。なお、得られた画像が診断に用いられるという意味で「CAD画像」と表現したが、これに限られるものではなく、得られた画像は、どのような目的で(CAD以外の目的で)用いられてもよい。また、実施形態に係るMRIシステム100は、例えば、頭蓋内MRA(Magnetic Resonance Angiography)及び胸部組織以外の身体領域に適用された場合に有効である。
ここで、以下に説明する実施形態には、T1強調画像に含まれる各画素の画素値からT1値を換算により求め、求めたT1値に基づいて各画素に割り当てる色を特定する手法がある。以下、この手法を「パターンA」と呼ぶ。また、この「パターンA」においては、画素値からT1値への換算を行うが、以下、撮像条件が異なる複数のT1強調画像を解析することでこの換算を実現する手法を「パターンA1」と呼び、画素値とT1値との対応関係を示す対応値テーブルを用いてこの換算を実現する手法を「パターンA2」と呼ぶ。一方、実施形態には、T1強調画像に含まれる各画素の画素値そのものに基づいて各画素に割り当てる色を特定する手法がある。以下、この手法を「パターンB」と呼ぶ。なお、T1強調画像は、MRIシステム100によって収集されたものでもよいし、あるいは、予め収集され、MRIシステム100に入力されたものでもよい。以下では、MRIシステム100によって収集する場合を説明する。
(パターンA1)
パターンA1において、実施形態に係るMRIシステム100は、記憶部と、特定部と、表示制御部とを備える。記憶部は、組織毎の数値範囲が既知であるT1値と、このT1値を有する画素に割り当てる色との対応関係を示す対応色テーブルを記憶する。特定部は、T1強調画像を解析し、各画素の画素値から換算されるT1値と対応色テーブルとに基づいて、各画素に割り当てる色を特定する。表示制御部は、特定された色により色分けされたT1強調画像(以下、適宜「カラーコード化T1強調画像」という)を表示部24に表示する。例えば、記憶部は、MRIシステムプログラム/データ格納部50に備えられ、特定部及び表示制御部は、MRIシステム制御部22内に備えられる(図示を省略)。
パターンA1において、実施形態に係るMRIシステム100は、記憶部と、特定部と、表示制御部とを備える。記憶部は、組織毎の数値範囲が既知であるT1値と、このT1値を有する画素に割り当てる色との対応関係を示す対応色テーブルを記憶する。特定部は、T1強調画像を解析し、各画素の画素値から換算されるT1値と対応色テーブルとに基づいて、各画素に割り当てる色を特定する。表示制御部は、特定された色により色分けされたT1強調画像(以下、適宜「カラーコード化T1強調画像」という)を表示部24に表示する。例えば、記憶部は、MRIシステムプログラム/データ格納部50に備えられ、特定部及び表示制御部は、MRIシステム制御部22内に備えられる(図示を省略)。
具体例を挙げて説明する。MRIシステム100の記憶部は、T1値と色との対応関係を示す対応色テーブルを記憶する。例えば、記憶部は、肝臓組織に対応するT1値(例えば、586±39)と「茶色」との対応関係、腎臓の皮質に対応するT1値(例えば、966±58)と「白色」との対応関係、腎臓の髄質に対応するT1値(例えば、1,412±58)と「桃色」との対応関係、脾臓に対応するT1値(例えば、1,057±42)と「紫色」との対応関係を示す対応色テーブルを記憶する。なお、T1値も色の割当ても一例に過ぎない。
ここで、対応色テーブルのT1値は、組織毎の数値範囲として既知のT1値であって、また、各組織に関して実測された経験値としてのT1値である。例えば、MRIシステム100は、異なる撮像条件や異なるコイルなどで様々な撮像を行うことでT1値の数値範囲を実測し、蓄積することができる。例えば、MRIシステム100は、肝臓組織であれば、どの程度の数値範囲となるかを経験値として蓄積する。そこで、記憶部は、このような経験値としてのT1値と色との対応関係を示す対応色テーブルを記憶する。なお、記憶部は、対応色テーブルを予め記憶してもよいし、あるいは、その都度操作者から対応関係の入力を受け付けて記憶してもよい。
さて、MRIシステム100は、T1強調画像を収集する。なお、以下の実施形態において、MRIシステム100は、撮像条件(例えば、TR、TE、パルスシーケンスの種類など)を変更しながら、複数のT1強調画像を収集する。例えば、複数のT1強調画像は、指数関数にあてはめるプロセスによりT1値が決定されるように、様々なTRで得ることができる。各画素に対するT1値の計算に必要なデータを得る目的で、様々なTE、又は様々なIR(Inversion Recovery)シーケンスを使うことができるように、様々なTI(Inversion Time)を使うことができる。
すなわち、表1からわかるように、被検体の各組織はそれぞれT1緩和時間が異なるので、ある撮像条件で収集されたT1強調画像において、信号強度が高くなる組織もあれば、信号強度が低くなる組織もある。そこで、MRIシステム100は、例えば、対象とする各組織の信号強度がそれぞれ高まるように撮像条件を変更しながら、複数のT1強調画像を収集する。
図4に示すように、MRIシステム100は、例えば、肝臓組織に対応する画素の信号強度が強調されるように撮像条件(TR、TEなど)を調整した上で、T1強調画像I1を収集する。また、MRIシステム100は、例えば、腎臓の皮質に対応する画素の信号強度が強調されるように撮像条件(TR、TEなど)を調整した上で、T1強調画像I2を収集する。また、MRIシステム100は、例えば、腎臓の髄質に対応する画素の信号強度が強調されるように撮像条件(TR、TEなど)を調整した上で、T1強調画像I3を収集する。また、MRIシステム100は、例えば、脾臓に対応する画素の信号強度が強調されるように撮像条件(TR、TEなど)を調整した上で、T1強調画像I4を収集する。MRIシステム100は、その他のT1強調画像を更に収集してもよい。
なお、パターンA1において、複数のT1強調画像を収集することには2つの目的がある。1つは、画素値からT1値を換算する目的であり、もう1つは、上述したように、各組織の信号強度を高める目的である。
続いて、MRIシステム100の特定部は、複数のT1強調画像を解析し、複数の撮像条件と複数のT1強調画像の画素値とを用いた計算によって、各画素の画素値からT1値を換算する。すなわち、T1強調画像の画素値は、T1値、T2値、及び撮像条件(TR、TEなど)を変数とする数式によって定義される。そこで、特定部は、T1値及びT2値が未知の場合、2以上のT1強調画像の画素値を用いて連立方程式を解くことで、各T1強調画像の各画素のT1値を算出することができる。
そして、特定部は、換算したT1値を用いて対応色テーブルを参照し、T1値に対応付けて記憶されている「色」を、この画素に割り当てる色として特定する。例えば、特定部は、換算したT1値が586±39の範囲内である場合には、対応色テーブルを参照し、この画素に「茶色」を割り当てることを特定する。このように、特定部は、各T1強調画像の各画素に割り当てる色を特定する。
続いて、表示制御部は、色分けされた各T1強調画像を合成して、表示部24に表示する。例えば、図4の例において、表示制御部は、色が割り当てられた各T1強調画像I1~I4を合成することでカラーコード化T1強調画像I5を生成し、表示する。図4に示すように、カラーコード化T1強調画像I5は、あたかも模式図のような表示となる。なお、色は、範囲内において、例えばT1値の中心値を中心に、「薄い茶色」から「濃い茶色」に変化するように割り当ててもよい。
(パターンA2)
パターンA2において、実施形態に係るMRIシステム100は、パターンA1と同様、記憶部と、特定部と、表示制御部とを備えるが、記憶部は、組織毎の数値範囲が既知である画素値と、組織毎の数値範囲が既知であるT1値との対応関係を示す対応値テーブルを更に備える。また、パターンA2において、特定部は、各画素の画素値と対応値テーブルとに基づいて、各画素の画素値からT1値を換算する。
パターンA2において、実施形態に係るMRIシステム100は、パターンA1と同様、記憶部と、特定部と、表示制御部とを備えるが、記憶部は、組織毎の数値範囲が既知である画素値と、組織毎の数値範囲が既知であるT1値との対応関係を示す対応値テーブルを更に備える。また、パターンA2において、特定部は、各画素の画素値と対応値テーブルとに基づいて、各画素の画素値からT1値を換算する。
具体例を挙げて説明する。MRIシステム100の記憶部は、画素値とT1値との対応関係を示す対応値テーブルを更に記憶する。例えば、記憶部は、撮像条件毎に、画素値と、かかる画素値に相当するT1値との対応関係を示す対応値テーブルを記憶する。例えば、MRIシステム100は、異なる撮像条件や異なるコイルなどで様々な撮像を行うことで、画素値とT1値との対応関係を実測し、蓄積することができる。そこで、記憶部は、このような経験値としての画素値とT1値との対応関係を示す対応値テーブルを記憶する。なお、記憶部は、対応値テーブルを予め記憶してもよいし、あるいは、その都度操作者から対応関係の入力を受け付けて記憶してもよい。
パターンA2において、特定部は、この対応値テーブルを用いて換算を行う。例えば、特定部は、各T1強調画像の各画素の画素値を用いて、撮像条件が一致する対応値テーブルを参照し、この画素値を、この画素値に対応付けて記憶されている「T1値」に換算する。その後はパターンA1と同様であり、特定部は、換算したT1値を用いて対応色テーブルを参照し、T1値に対応付けて記憶されている「色」を、この画素に割り当てる色として特定する。また、表示制御部は、色分けされた各T1強調画像を合成して、表示部24に表示する。
なお、パターンA1においては、画素値からT1値を換算する目的、及び、各組織の信号強度を高める目的の2つの目的から複数のT1強調画像を用いたが、パターンA2の場合、画素値からT1値への換算は対応値テーブルを用いて実現するので、必ずしも複数のT1強調画像を用いなくてもよい。すなわち、パターンA2の場合、1つのT1強調画像を解析することで、カラーコード化T1強調画像を生成、表示してもよい。
なお、パターンA2の他の例を説明する。例えば、上述した対応値テーブルは、複数の患者について予め収集された「組織毎の標本画像群」と、各標本画像のT1値として予め換算された「経験値としてのT1値」との対応関係を示すものであってもよい。この場合、特定部は、例えば、ある組織に対応する画素の信号強度が強調されるように収集されたT1強調画像と、この組織に対応する標本画像群とを照合し、T1強調画像と各標本画像との相関度合いを求める。次に、特定部は、標本画像群の中から、最も相関度合いが高い標本画像を特定し、対応値テーブルを参照して、この標本画像に対応付けて記憶されている「T1値」を取得する。
続いて、特定部は、カラーコード化の対象とするT1強調画像に含まれる画素のうち、信号強度が所定閾値以上の画素についてのみ、画素値を、取得した「T1値」に換算する。特定部は、信号強度が所定閾値を下回る画素については、色を割り当てる対象としない。すなわち、このT1強調画像は、ある組織に対応する画素の信号強度が強調されるように収集されたものであるので、この閾値による振り分けによって、対象とする組織のみをT1強調画像から抽出することができる。その後、特定部は、換算したT1値を用いて対応色テーブルを参照し、T1値に対応付けて記憶されている「色」を、この画素に割り当てる色として特定する。なお、特定部は、このような換算処理、特定処理を、各組織に対応する各T1強調画像について行う。
その後はパターンA1と同様であり、表示制御部は、色分けされた各T1強調画像を合成して、表示部24に表示する。
なお、上述したパターンA1及びパターンA2においては、対応色テーブルや対応値テーブルのT1値として、実測された経験値としてのT1値を用いる例を説明したが、実施形態はこれに限られるものではない。対応色テーブルや対応値テーブルのT1値は、被検体の各組織に関する「理想値としてのT1値」であってもよい。
この場合、MRIシステム100は、各画素の画素値から「理想値としてのT1値」に換算する機能を更に備える必要がある。例えば、MRIシステム100は、異なる撮像条件や異なるコイルなどで様々な撮像を行うことで、「画素値」と「T1値」との対応関係を実測し、蓄積することができる。そこで、MRIシステム100は、この経験値として蓄積したT1値と、理想値としてのT1値とを対応付けることで、「画素値」と「理想値としてのT1値」との対応関係を示すテーブルを予め作成し、記憶すればよい。そして、特定部は、このテーブルを用いて、画素値から「理想値としてのT1値」に換算すればよい。
(パターンB)
パターンBにおいて、実施形態に係るMRIシステム100は、記憶部と、特定部と、表示制御部とを備える。記憶部は、組織毎の数値範囲が既知であるT1値に相当する画素値と、この画素値を有する画素に割り当てる色との対応関係を示す対応色テーブルを記憶する。特定部は、T1強調画像を解析し、各画素の画素値と対応色テーブルとに基づいて、各画素に割り当てる色を特定する。例えば、特定部は、各T1強調画像内の各画素の画素値を用いて対応色テーブルを参照し、この画素値に対応付けて記憶された「色」を、この画素に割り当てる色として特定する。表示制御部は、特定された色により色分けされたT1強調画像を表示部24に表示する。例えば、記憶部は、MRIシステムプログラム/データ格納部50に備えられ、特定部及び表示制御部は、MRIシステム制御部22内に備えられる(図示を省略)。
パターンBにおいて、実施形態に係るMRIシステム100は、記憶部と、特定部と、表示制御部とを備える。記憶部は、組織毎の数値範囲が既知であるT1値に相当する画素値と、この画素値を有する画素に割り当てる色との対応関係を示す対応色テーブルを記憶する。特定部は、T1強調画像を解析し、各画素の画素値と対応色テーブルとに基づいて、各画素に割り当てる色を特定する。例えば、特定部は、各T1強調画像内の各画素の画素値を用いて対応色テーブルを参照し、この画素値に対応付けて記憶された「色」を、この画素に割り当てる色として特定する。表示制御部は、特定された色により色分けされたT1強調画像を表示部24に表示する。例えば、記憶部は、MRIシステムプログラム/データ格納部50に備えられ、特定部及び表示制御部は、MRIシステム制御部22内に備えられる(図示を省略)。
すなわち、パターンBにおいては、T1強調画像に含まれる各画素の画素値そのものに基づいて、各画素に割り当てる色を特定する。この場合、対応色テーブルは、撮像条件毎に準備される。各画素の画素値は撮像条件に応じて異なるからである。
以上が、パターンA1、パターンA2、及びパターンBの説明である。なお、実施形態に係るMRIシステム100は、パターンA1、パターンA2、及びパターンBにおいて、以下に説明する各種実施形態を適用することもできる。
(その他の実施形態)
上述したように、T1強調画像内のT1値のカラーコード化表示によって、正常及び異常な組織の信号の表示は、例えば診断中、人間の目によって、より容易に区別される状態になると考えられる。更に、IRパルスを使って推測されるT1値の粗い領域は、(例えば、癌性腫瘍細胞を他の組織から区別できるように)より良好な組織の特性解析が可能になる時間にわたって、蓄積が可能である。
上述したように、T1強調画像内のT1値のカラーコード化表示によって、正常及び異常な組織の信号の表示は、例えば診断中、人間の目によって、より容易に区別される状態になると考えられる。更に、IRパルスを使って推測されるT1値の粗い領域は、(例えば、癌性腫瘍細胞を他の組織から区別できるように)より良好な組織の特性解析が可能になる時間にわたって、蓄積が可能である。
この点について補足すると、時間軸を横軸とし、信号強度を縦軸として考えた場合、各組織に対応する画素の信号強度は、それぞれ異なる曲線を推移すると考えられる。すなわち、T1緩和時間に応じてピークとなる時間も異なり、また、曲線が急峻であるかなだらかであるかなども異なる。癌性腫瘍組織についても同様であり、例えば、その癌性腫瘍組織を含む正常組織の信号強度が推移する曲線と、癌性腫瘍組織の信号強度が推移する曲線とは通常異なると考えられる。このため、例えば、肝臓内に癌性腫瘍組織が存在すると仮定した場合、肝臓内の正常組織の信号強度がピークとなるように収集されたT1強調画像において、正常組織と癌性腫瘍組織とのコントラストが良く描出されているとは限らない。そこで、例えば、MRIシステム100は、撮像条件を変更しながら複数のT1強調画像を収集し、これを蓄積してそれぞれをカラーコード化し、これらを例えば連続的に表示部24に表示してもよい。
出版物に掲載された様々な組織(推測変動値の範囲を含む)のT1値を示す表1に示されるように、MRIシステム100は、様々な組織の間で区別が可能になるように、T1値の閾値範囲を決定する。実施形態においては、そのようなT1値の範囲を(例えば、T1値の一定の範囲に対する、又はT1値の特定の範囲に割り当てられる色によって)カラーコード化することを提案する。そのようなカラーコード化T1強調画像の表示によって、造影剤を使用しなくても、対象とする組織のより良好な視覚認識を実現できるようになる。しかし、更に、T1強調画像のそのようなカラーコード化は、(例えば、癌性腫瘍組織並びに正常組織のT1値を更に変えると推測できる)造影剤とともに使用してもよい。
複数のT1強調画像は、カラーコード化T1強調画像及び参照画像(後述するように、例えば、カラーコード化を施していないT1強調画像、収集されたT1強調画像自体、その他の形態画像など)の全て又はいずれかを得るように取得できる。対象とする組織に関するT1値の範囲は、1つ以上の色が割り当てられ、閾値範囲として使用できる。例えば、第1のカラースペクトルAは、第1のT1値のスペクトルに割り当ててもよい。更に、第2の異なるカラースペクトルBは、(対象とする組織又は身体領域内に存在するかも知れないと予想される癌性組織に対応する場合があるので)異なるT1値のスペクトルに割り当ててもよい。
T1強調画像のそのようなカラーコード化とともに造影剤の注入を利用した場合、造影剤注入前後の画像間で比較して異常のありそうな組織を検出しやすくするために、造影剤注入前後両方で画像表示を得ることができるようになる。
すなわち、MRIシステム100は、被検体に造影剤を注入しない状態でT1強調画像を収集してもよく、また、被検体に造影剤を注入した状態でT1強調画像を収集してもよく、更に、造影剤の注入前後でT1強調画像を収集してもよい。造影剤の注入前後でT1強調画像を収集した場合、特定部は、造影剤の注入前後に収集されたT1強調画像を用いて色の特定を行い、表示制御部は、造影剤の注入前後のT1強調画像から作成されたカラーコード化T1強調画像を表示部24に表示すればよい。例えば、表示制御部は、造影剤の注入前後に収集されたT1強調画像それぞれからカラーコード化T1強調画像を生成し、その両方を表示部24に表示してもよい。あるいは、例えば、表示制御部は、造影剤の注入前後に収集されたT1強調画像双方から、各組織のコントラストがよく描出される画素を部分的に抽出しながら合成し、合成後のカラーコード化T1強調画像を表示部24に表示してもよい。
異常な組織を検出した場合(おそらく注入された造影剤の濃度などによって)、そのような異常なT1値をもつ領域は、顕著な目立つ色すなわちカラースペクトル(例えば、赤色スペクトル又は単一の赤色値が考えられる)で強調表示できる。
そのようなカラーコード化T1強調画像表示を出力するように構成されたMRIシステム100は、従来の表示パラメータ(例えば、コントラスト、グレースケールなど)を有する同一の領域を描出するT1強調画像を提供することができる。例えば、表示制御部は、色分け前のT1強調画像に、色分け後のカラーコード化T1強調画像を重畳して表示してもよい。また、表示制御部は、その他、例えば骨などの形態がわかる形態画像に、色分け後のカラーコード化T1強調画像を重畳して表示してもよい。また、これらの場合に、表示制御部は、カラーコード化T1強調画像に透過性を持たせてもよい。また、これらの場合に、表示制御部は、2D表示してもよいし、3D表示してもよい。3D表示することで、観察者は、例えば、肝臓組織内の癌性腫瘍組織について、奥行き方向の大きさなどの情報を得ることが可能になる。カラーコード化T1強調画像を使用すれば、それぞれ異なるT1値を有する異なる組織に基づいて、正常組織から異常組織をより正しく区別するコンピュータ支援診断に有用な診断ツールを提供できると考えられる。
セットになったカラーコード化T1強調画像は、また、乳房X線撮影及び胸部動的造影増強(DCE)とともにCADのために使用できる。
MRIシステム100は、カラーコード化T1強調画像及び参照画像を生成するために、複数のT1強調画像(又はIRパルスを有するT1)を取得することができる。次に、MRIシステム100は、T1値の様々な範囲に対応する色の割当てを行うために、T1値の異なる閾値範囲を利用することができる。そのような閾値の範囲によって、MRIシステム100は、正常範囲内の組織を1つの色(又はカラースペクトル)で、異常な信号を別の色(又はカラースペクトル)で表すことが可能になる。補足すると、MRIシステム100は、所定範囲に含まれるT1値を有する画素群により形成される領域内に、この所定範囲に含まれないT1値を有する画素が含まれるか否かを解析する解析部を更に備えてもよい。この場合、特定部は、領域内にこの所定範囲に含まれないT1値を有する画素が含まれると解析された場合に、所定範囲に含まれるT1値を有する画素群に第1の色を割り当てることを特定するとともに、所定範囲に含まれないT1値を有する画素に、第1の色と異なる第2の色を割り当てる。例えば、このような場合、所定範囲に含まれないT1値を有する画素は、正常組織に囲まれる癌性腫瘍組織であると推測することが可能である。そこで、例えば、特定部は、第2の色として、組織の異常を示す色として予め定められた色(例えば、赤色など)を割り当てるよう制御してもよい。
様々な組織に対して推測されるT1値の範囲を示す出版物に掲載されたデータに加えて、粗いT1値を伴うT1範囲は、イメージングシーケンス、BO及びB1の両方又は一方の不均一性などの測定方法によって推測できる。補足すると、「T1値を有する画像」に「T1画像」及び「T1強調画像」が含まれ、「T1画像」がいわば理想値としての画像であり、「T1強調画像」がT1値の信号強度を強調した画像であることは上述した通りである。この点、表1や表2に掲載されたデータは、被検体の各組織に関する理想値としてのT1値の範囲であると考えられる。そこで、例えば、MRIシステム100は、異なるパルスシーケンスや異なるコイルなどで様々な撮像を行うことでT1値の範囲を実測し、蓄積することができる。例えば、肝臓組織であれば、どの程度のT1値の範囲となるかが、経験値として蓄積される。
また、造影剤の注入前に描出されたカラーコード化T1強調画像表示を、造影剤の注入後に描出されたカラーコード化T1強調画像表示と比較することによって、T1値への注目を強めて、様々な色で表示できるようになる。自明なように、様々な異常組織に対するT1値の範囲は、データベースに格納されて、腫瘍又は癌性組織の特定の種類を識別するために参考データとして使用できる。
図2に示すようにカラーコード化T1撮像CADモジュールは、あらゆる好適な操作者入力又はシステム入力モードによって実行できる。例えば、操作者は、マウスで選択できるアイコン、タッチ感応式アイコン、キーボード指令などで操作してもよい。あるいは、システムは、実際に、いくつかの別の基準に基づいてこのモジュールへの入力を選択可能である。
ステップS01において、被検体の関心領域(ROI(Region Of Interest))のT1値を有するMR画像を取得する。そのようなT1値を有する画像は、記憶部から取り出すことによって取得してもよく、又は好適なMRIシーケンス、計算などを使う好適なMRIデータ取得によってリアルタイムに初めから取得してもよい。それによって、T1値又は少なくともT1強調値を伴う画素を有する被検体ROIのMR画像を生成できるようになる。
図2の決定ボックスaでは、待機ループステップS02が始まる。必要であれば、対象の臓器/組織の操作者/システムによる選択が可能である。例えば、表1の記載項目に基づいて、操作者及びシステムの両方又は一方は、関心領域になりそうな多くの様々な臓器及び組織の全て又はいずれかについて、事前に格納されたT1値の推測範囲へアクセスが可能である。これらの事前に格納された推測範囲の値は、「そのままで」使用できる。しかし、操作者/システムにもまた、範囲を若干変更するという選択肢(例えば、範囲を広げること又は狭めること、及び所望の基準に従って範囲に重み付けをすることの両方又は一方ができるように)がある。操作者/システムにはまた、ボックスaに示すような「その他」を選択する選択肢もある。ボックスaでは、特定の標的の解剖学的組織に対する関心事であろうT1値のあらゆる望ましい特定の範囲を識別するために、完全な自由が与えられる。
既述したように、操作者/システムには、図2の任意の待機ループS03に示すように、カラーコード化する範囲又は変更されたT1値の範囲を承認する選択肢がある。
同じく、操作者/システムは、様々なT1値及び値の範囲の両方又は一方に対して使用する色値、スペクトルなどを、承認すること及び変更することの両方又は一方のために、図2に示すような任意の待機ループS04を有することができる。ステップS05では、特定の色値を、特定のT1値をもつピクセルに割り当てる。ステップS05又は場合によってはステップS05の前後において、範囲外の異常なT1値をもつピクセル(例えば、正常な範囲の値をもつピクセルによって囲まれている場合もある)に対して図2のステップS06に示すようなテストを行うことができる。T1値を有するピクセルのそのような異常な集合が発見された場合(ステップS06肯定)、ステップS07に示すように、そのような異常なピクセルには、異なる色(又はカラースペクトル)コードを割り当てられる。
図2のステップS08に示すように、カラーコード化T1強調画像は、例えばCADの目的で表示される。このカラーコード化T1強調画像はまた、このモジュールが終了される前に、図2のステップS09で示すように、(例えば、プリンタ又は遠隔場所へ)格納及び出力の両方又は一方を行うことができる。
図2のモジュールの結果、図3に概略的に示すような図を表示できる。ここで、被検体300の解剖学的組織内で、臓器302は、カラースペクトルAが割り当てられ、正常と推測されるT1値を有するピクセルとして描出される。しかし、臓器302の範囲内で、予想外の異常な値をもつピクセルが、領域304に発見されて、異なる明暗比をもつカラースペクトルBが割り当てられる。前述のように、システムは、特定用途向けにCAD表示を最適化するように、操作者/システムが、様々なカラースペクトルを様々な範囲のT1値を有するピクセルに割り当てられるように構成することができる。
なお、上記においては、実施形態に係るMRIシステム100が、記憶部と、特定部と、表示制御部とを備える例を説明したが、実施形態はこれに限られるものではなく、画像表示装置が、記憶部と、特定部と、表示制御部とを備えてもよい。画像表示装置は、例えば、パーソナルコンピュータや、ワークステーションなどである。この場合、画像表示装置の記憶部は、組織毎の数値範囲が既知であるT1値と、このT1値を有する画素に割り当てる色との対応関係を示す対応色テーブルを記憶する。特定部は、T1値を有する画像を解析し、各画素の画素値から換算されるT1値と対応色テーブルとに基づいて、各画素に割り当てる色を特定する。表示制御部は、特定された色により色分けされた画像を表示部に表示する。あるいは、画像表示装置の記憶部は、組織毎の数値範囲が既知であるT1値に相当する画素値と、この画素値を有する画素に割り当てる色との対応関係を示す対応色テーブルを記憶する。特定部は、T1値を有する画像を解析し、各画素の画素値と対応色テーブルとに基づいて、各画素に割り当てる色を特定する。表示制御部は、特定された色により色分けされた画像を表示部に表示する。なお、記憶部は、例えばメモリであり、特定部や表示制御部は、例えばプロセッサである。
なお、実施形態に係るMRIシステム100は、T1強調画像を再構成する場合に、複素数の虚部を用いずに実部のみを用いてもよい。MRIシステム100は、実部のみを用いて解析することにより、その傾きから正確なT1値を求めることができる。
以上述べた少なくとも一つの実施形態の磁気共鳴イメージング装置、磁気共鳴イメージング方法及び画像表示装置によれば、MR画像を適切に表示することが可能になる。
本発明のいくつかの実施形態を説明したが、これらの実施形態は、例として提示したものであり、発明の範囲を限定することは意図していない。これら実施形態は、その他の様々な形態で実施されることが可能であり、発明の要旨を逸脱しない範囲で、種々の省略、置き換え、変更を行うことができる。これら実施形態やその変形は、発明の範囲や要旨に含まれると同様に、請求の範囲に記載された発明とその均等の範囲に含まれるものである。
Claims (16)
- 組織毎の数値範囲が既知であるT1値と、該T1値を有する画素に割り当てる色との対応関係を示す対応色テーブルを記憶する記憶部と、
T1値を有する画像を解析し、各画素の画素値から換算されるT1値と前記対応色テーブルとに基づいて、各画素に割り当てる色を特定する特定部と、
特定された色により色分けされた前記画像を表示部に表示する表示制御部と
を備える、磁気共鳴イメージング装置。 - 前記特定部は、撮像条件が異なる複数の画像を解析し、複数の撮像条件と複数の画像の画素値とを用いた計算によって、各画素の画素値からT1値を換算する、請求項1に記載の磁気共鳴イメージング装置。
- 前記記憶部は、組織毎の数値範囲が既知である画素値と、組織毎の数値範囲が既知であるT1値との対応関係を示す対応値テーブルを更に記憶し、
前記特定部は、前記画像を解析し、各画素の画素値と前記対応値テーブルとに基づいて、各画素の画素値からT1値を換算する、請求項1に記載の磁気共鳴イメージング装置。 - 組織毎の数値範囲が既知であるT1値に相当する画素値と、該画素値を有する画素に割り当てる色との対応関係を示す対応色テーブルを記憶する記憶部と、
T1値を有する画像を解析し、各画素の画素値と前記対応色テーブルとに基づいて、各画素に割り当てる色を特定する特定部と、
特定された色により色分けされた前記画像を表示部に表示する表示制御部と
を備える、磁気共鳴イメージング装置。 - 前記特定部は、撮像条件が異なる複数の画像を解析し、各画像の各画素に割り当てる色を特定し、
前記表示制御部は、色分けされた各画像を合成して前記表示部に表示する、請求項1~4のいずれか一つに記載の磁気共鳴イメージング装置。 - 前記T1値を有する画像から、所定範囲に含まれるT1値を有する画素群により形成される領域内に、該所定範囲に含まれないT1値を有する画素が含まれるか否かを解析する解析部を更に備え、
前記特定部は、前記領域内に前記所定範囲に含まれないT1値を有する画素が含まれると解析された場合に、該所定範囲に含まれるT1値を有する画素群に第1の色を割り当てることを特定するとともに、該所定範囲に含まれないT1値を有する画素に前記第1の色と異なる第2の色を割り当てることを特定する、請求項1~4のいずれか一つに記載の磁気共鳴イメージング装置。 - 前記特定部は、前記第2の色として、組織の異常を示す色として予め定められた色を割り当てる、請求項6に記載の磁気共鳴イメージング装置。
- 前記T1値を有する画像は、被検体に造影剤を注入しない状態で収集された画像である、請求項1~4のいずれか一つに記載の磁気共鳴イメージング装置。
- 前記T1値を有する画像は、被検体に造影剤を注入した状態で収集された画像である、請求項1~4のいずれか一つに記載の磁気共鳴イメージング装置。
- 前記T1値を有する画像は、被検体に造影剤を注入する前に収集された第1画像と、造影剤を注入した後に収集された第2画像とであり、
前記表示制御部は、色分けされた前記第1画像及び前記第2画像を前記表示部に表示する、請求項1~4のいずれか一つに記載の磁気共鳴イメージング装置。 - 前記表示制御部は、形態画像に、色分けされた前記画像を重畳して表示する、請求項1~4のいずれか一つに記載の磁気共鳴イメージング装置。
- 前記T1値は、被検体の各組織に関する理想値としてのT1値、又は、被検体の各組織に関して実測された経験値としてのT1値である、請求項1~4のいずれか一つに記載の磁気共鳴イメージング装置。
- 磁気共鳴イメージング装置で実行される磁気共鳴イメージング方法であって、
前記磁気共鳴イメージング装置は、組織毎の数値範囲が既知であるT1値と、該T1値を有する画素に割り当てる色との対応関係を示す対応色テーブルを記憶する記憶部を備え、
T1値を有する画像を解析し、各画素の画素値から換算されるT1値と前記対応色テーブルとに基づいて、各画素に割り当てる色を特定する特定工程と、
特定された色により色分けされた前記画像を表示部に表示する表示制御工程と
を含む、磁気共鳴イメージング方法。 - 磁気共鳴イメージング装置で実行される磁気共鳴イメージング方法であって、
前記磁気共鳴イメージング装置は、組織毎の数値範囲が既知であるT1値に相当する画素値と、該画素値を有する画素に割り当てる色との対応関係を示す対応色テーブルを記憶する記憶部を備え、
T1値を有する画像を解析し、各画素の画素値と前記対応色テーブルとに基づいて、各画素に割り当てる色を特定する特定工程と、
特定された色により色分けされた前記画像を表示部に表示する表示制御工程と
を含む、磁気共鳴イメージング方法。 - 組織毎の数値範囲が既知であるT1値と、該T1値を有する画素に割り当てる色との対応関係を示す対応色テーブルを記憶する記憶部と、
T1値を有する画像を解析し、各画素の画素値から換算されるT1値と前記対応色テーブルとに基づいて、各画素に割り当てる色を特定する特定部と、
特定された色により色分けされた前記画像を表示部に表示する表示制御部と
を備える、画像表示装置。 - 組織毎の数値範囲が既知であるT1値に相当する画素値と、該画素値を有する画素に割り当てる色との対応関係を示す対応色テーブルを記憶する記憶部と、
T1値を有する画像を解析し、各画素の画素値と前記対応色テーブルとに基づいて、各画素に割り当てる色を特定する特定部と、
特定された色により色分けされた前記画像を表示部に表示する表示制御部と
を備える、画像表示装置。
Priority Applications (2)
| Application Number | Priority Date | Filing Date | Title |
|---|---|---|---|
| CN201180003911.4A CN102573625B (zh) | 2010-10-13 | 2011-10-13 | 磁共振成像装置、磁共振成像方法及图像显示装置 |
| EP11832601.6A EP2554114A4 (en) | 2010-10-13 | 2011-10-13 | Magnetic resonance imaging apparatus, magnetic resonance imaging method and image display device |
Applications Claiming Priority (2)
| Application Number | Priority Date | Filing Date | Title |
|---|---|---|---|
| US12/923,891 | 2010-10-13 | ||
| US12/923,891 US10267882B2 (en) | 2010-10-13 | 2010-10-13 | MRI T1 image-guided tissue diagnostics |
Publications (1)
| Publication Number | Publication Date |
|---|---|
| WO2012050170A1 true WO2012050170A1 (ja) | 2012-04-19 |
Family
ID=45934707
Family Applications (1)
| Application Number | Title | Priority Date | Filing Date |
|---|---|---|---|
| PCT/JP2011/073570 WO2012050170A1 (ja) | 2010-10-13 | 2011-10-13 | 磁気共鳴イメージング装置、磁気共鳴イメージング方法及び画像表示装置 |
Country Status (5)
| Country | Link |
|---|---|
| US (2) | US10267882B2 (ja) |
| EP (1) | EP2554114A4 (ja) |
| JP (2) | JP6270303B2 (ja) |
| CN (1) | CN102573625B (ja) |
| WO (1) | WO2012050170A1 (ja) |
Cited By (1)
| Publication number | Priority date | Publication date | Assignee | Title |
|---|---|---|---|---|
| CN105784749A (zh) * | 2016-04-08 | 2016-07-20 | 董印 | 磁共振物质波谱图检查装置 |
Families Citing this family (7)
| Publication number | Priority date | Publication date | Assignee | Title |
|---|---|---|---|---|
| US10267882B2 (en) | 2010-10-13 | 2019-04-23 | Toshiba Medical Systems Corporation | MRI T1 image-guided tissue diagnostics |
| JP6077120B2 (ja) * | 2012-08-27 | 2017-02-08 | コーニンクレッカ フィリップス エヌ ヴェKoninklijke Philips N.V. | ダイナミック造影mri用の適応するキーホール圧縮 |
| KR102067277B1 (ko) * | 2013-08-20 | 2020-01-16 | 삼성전자주식회사 | 의료 영상 디스플레이 방법 및 장치 |
| WO2016059493A1 (en) * | 2014-10-13 | 2016-04-21 | Koninklijke Philips N.V. | Classification of a health state of tissue of interest based on longitudinal features |
| JP6800630B2 (ja) * | 2015-09-10 | 2020-12-16 | キヤノンメディカルシステムズ株式会社 | 磁気共鳴イメージング装置及び画像処理装置 |
| EP3588438A4 (en) | 2017-03-07 | 2020-03-18 | Shanghai United Imaging Healthcare Co., Ltd. | METHOD AND SYSTEM FOR PRODUCING COLORED MEDICAL IMAGES |
| CN112150419A (zh) * | 2020-09-10 | 2020-12-29 | 东软医疗系统股份有限公司 | 图像处理方法、装置及电子设备 |
Citations (5)
| Publication number | Priority date | Publication date | Assignee | Title |
|---|---|---|---|---|
| JP2000166897A (ja) * | 1998-12-11 | 2000-06-20 | Toshiba Corp | Mri装置およびmrイメージング方法 |
| JP2006524084A (ja) * | 2003-04-23 | 2006-10-26 | コーニンクレッカ フィリップス エレクトロニクス エヌ ヴィ | Mr映像方法 |
| JP2007536970A (ja) * | 2004-05-14 | 2007-12-20 | コーニンクレッカ フィリップス エレクトロニクス エヌ ヴィ | k空間中心のオーバーサンプリングを伴う非デカルト軌道を含むコントラスト・プリパレーションされたMRI |
| JP2008534044A (ja) * | 2005-03-23 | 2008-08-28 | コーニンクレッカ フィリップス エレクトロニクス エヌ ヴィ | 緩和パラメータを空間的に分解して決定するための磁気共鳴方法 |
| JP2009512932A (ja) * | 2005-10-21 | 2009-03-26 | コーニンクレッカ フィリップス エレクトロニクス エヌ ヴィ | プロファイルフラグを用いた医療画像のインタラクティブプロービング及び注釈方法及びシステム |
Family Cites Families (19)
| Publication number | Priority date | Publication date | Assignee | Title |
|---|---|---|---|---|
| US3789832A (en) | 1972-03-17 | 1974-02-05 | R Damadian | Apparatus and method for detecting cancer in tissue |
| US4698593A (en) | 1985-09-30 | 1987-10-06 | The Regents Of The University Of California | Apparatus and method for T1 NMR imaging using spin echo NMR responses elicited by initial excitation pulses of differing nutation values |
| NL8502871A (nl) * | 1985-10-22 | 1987-05-18 | Philips Nv | Werkwijze en inrichting voor het fasecorrigeren van mri-beelden. |
| US5332968A (en) * | 1992-04-21 | 1994-07-26 | University Of South Florida | Magnetic resonance imaging color composites |
| US6009342A (en) * | 1997-02-28 | 1999-12-28 | The Regents Of The University Of California | Imaging method for the grading of tumors |
| JP2000342550A (ja) * | 1999-06-02 | 2000-12-12 | Hitachi Medical Corp | 磁気共鳴撮影装置 |
| US6674880B1 (en) * | 1999-11-24 | 2004-01-06 | Confirma, Inc. | Convolution filtering of similarity data for visual display of enhanced image |
| US20020016543A1 (en) | 2000-04-06 | 2002-02-07 | Tyler Jenny A. | Method for diagnosis of and prognosis for damaged tissue |
| US6804384B2 (en) * | 2001-06-12 | 2004-10-12 | Mclean Hospital Corporation | Color magnetic resonance imaging |
| US7155043B2 (en) | 2001-11-21 | 2006-12-26 | Confirma, Incorporated | User interface having analysis status indicators |
| US6956373B1 (en) | 2002-01-02 | 2005-10-18 | Hugh Keith Brown | Opposed orthogonal fusion system and method for generating color segmented MRI voxel matrices |
| JP4032293B2 (ja) | 2002-05-15 | 2008-01-16 | 株式会社日立メディコ | 超音波−磁気共鳴複合医療装置 |
| US20080150532A1 (en) | 2006-12-21 | 2008-06-26 | General Electric Company | Method and apparatus for measuring t1 relaxation |
| US8874189B2 (en) | 2007-01-02 | 2014-10-28 | Syntheticmr Ab | Method of visualizing MR images |
| JP2010075549A (ja) | 2008-09-26 | 2010-04-08 | Toshiba Corp | 画像処理装置 |
| DE102009027448A1 (de) * | 2009-07-03 | 2011-01-05 | Forschungszentrum Jülich GmbH | Wissensbasierte Segmentierung schwächungsrelevanter Regionen des Kopfes |
| US9167988B2 (en) * | 2010-10-13 | 2015-10-27 | Kabushiki Kaisha Toshiba | Magnetic resonance imaging apparatus and method for color-coding tissue based on T1 values |
| US10267882B2 (en) | 2010-10-13 | 2019-04-23 | Toshiba Medical Systems Corporation | MRI T1 image-guided tissue diagnostics |
| US20130322713A1 (en) * | 2012-05-29 | 2013-12-05 | Isis Innovation Ltd. | Color map design method for assessment of the deviation from established normal population statistics and its application to quantitative medical images |
-
2010
- 2010-10-13 US US12/923,891 patent/US10267882B2/en active Active
-
2011
- 2011-10-13 CN CN201180003911.4A patent/CN102573625B/zh active Active
- 2011-10-13 WO PCT/JP2011/073570 patent/WO2012050170A1/ja active Application Filing
- 2011-10-13 JP JP2011226172A patent/JP6270303B2/ja active Active
- 2011-10-13 EP EP11832601.6A patent/EP2554114A4/en active Pending
-
2017
- 2017-09-19 JP JP2017179398A patent/JP6430604B2/ja active Active
-
2019
- 2019-04-22 US US16/390,652 patent/US11698429B2/en active Active
Patent Citations (5)
| Publication number | Priority date | Publication date | Assignee | Title |
|---|---|---|---|---|
| JP2000166897A (ja) * | 1998-12-11 | 2000-06-20 | Toshiba Corp | Mri装置およびmrイメージング方法 |
| JP2006524084A (ja) * | 2003-04-23 | 2006-10-26 | コーニンクレッカ フィリップス エレクトロニクス エヌ ヴィ | Mr映像方法 |
| JP2007536970A (ja) * | 2004-05-14 | 2007-12-20 | コーニンクレッカ フィリップス エレクトロニクス エヌ ヴィ | k空間中心のオーバーサンプリングを伴う非デカルト軌道を含むコントラスト・プリパレーションされたMRI |
| JP2008534044A (ja) * | 2005-03-23 | 2008-08-28 | コーニンクレッカ フィリップス エレクトロニクス エヌ ヴィ | 緩和パラメータを空間的に分解して決定するための磁気共鳴方法 |
| JP2009512932A (ja) * | 2005-10-21 | 2009-03-26 | コーニンクレッカ フィリップス エレクトロニクス エヌ ヴィ | プロファイルフラグを用いた医療画像のインタラクティブプロービング及び注釈方法及びシステム |
Non-Patent Citations (10)
| Title |
|---|
| BAZELAIRE ET AL.: "MR Imaging Relaxation Times of Abdominal and Pelvic Tissues Measured in Vivo at 3.0T", RADIOLOGY, vol. 230, no. 3, March 2004 (2004-03-01), pages 652 - 659 |
| BREGER ET AL.: "Tl and T2 Measurements on al.5-T Commercial MR Imager", RADIOLOGY, vol. 171, no. 1, April 1989 (1989-04-01), pages 273 - 276 |
| DE BAZELAIRE ET AL.: "MR Imaging Relaxation Times of Abnominal and Pelvic Tissues Measured in Vivo at 3.0T: Preliminary Results", RADIOLOGY, vol. 230, no. 3, March 2004 (2004-03-01), pages 652 - 659 |
| KUHL ET AL.: "Dynamic Breast MR Imaging: Are Signal Intensity Time Course Data Useful for Differential Diagnosis of Enhancing Lesions?", RADIOLOGY, vol. 211, no. 1, April 1999 (1999-04-01), pages 101 - 110, XP001187534 |
| KUHL: "Current Status of Breast MR Imaging, Part 2, Clinical Applications", RADIOLOGY, vol. 244, no. 3, September 2007 (2007-09-01), pages 672 - 691 |
| KUHL: "The Current Status of Breast MR Imaging, Part I, Choice of Technique, Image Interpretation, Diagnostic Accuracy, and Transfer to Clinical Practice", RADIOLOGY, vol. 244, no. 2, August 2007 (2007-08-01), pages 356 - 378 |
| R.L.KAMMAN ET AL.: "Unified Multiple-Feature Color Display for MR Images", MAGNETIC RESONANCE IN MEDICINE, vol. 9, no. 2, 1989, pages 240 - 253, XP000008373 * |
| See also references of EP2554114A4 |
| STANIS ET AL.: "T1, T2 Relaxation and Magnetization Transfer in Tissue at 3T", MRIM, vol. 54, 2005, pages 507 - 512 |
| STANISZ ET AL.: "T1, T2 Relaxation and Magnetization Transfer in Tissue at 3T", MAGNETIC RESONANCE IN MEDICINE, vol. 54, 2005, pages 507 - 512 |
Cited By (1)
| Publication number | Priority date | Publication date | Assignee | Title |
|---|---|---|---|---|
| CN105784749A (zh) * | 2016-04-08 | 2016-07-20 | 董印 | 磁共振物质波谱图检查装置 |
Also Published As
| Publication number | Publication date |
|---|---|
| US11698429B2 (en) | 2023-07-11 |
| JP6270303B2 (ja) | 2018-01-31 |
| EP2554114A1 (en) | 2013-02-06 |
| US20120095320A1 (en) | 2012-04-19 |
| US20190250232A1 (en) | 2019-08-15 |
| JP6430604B2 (ja) | 2018-11-28 |
| JP2018008114A (ja) | 2018-01-18 |
| US10267882B2 (en) | 2019-04-23 |
| EP2554114A4 (en) | 2017-04-26 |
| CN102573625A (zh) | 2012-07-11 |
| CN102573625B (zh) | 2016-01-27 |
| JP2012081278A (ja) | 2012-04-26 |
Similar Documents
| Publication | Publication Date | Title |
|---|---|---|
| JP6430604B2 (ja) | 画像処理装置、磁気共鳴イメージング装置及び画像処理方法 | |
| JP5127276B2 (ja) | 画像処理装置および磁気共鳴イメージング装置 | |
| JP7246864B2 (ja) | 画像処理装置、磁気共鳴イメージング装置及び画像処理プログラム | |
| US10672126B2 (en) | Image processing apparatus and magnetic resonance imaging apparatus | |
| JP6055425B2 (ja) | 不均一磁場中におけるmriのための撮像領域の制約 | |
| US10823798B2 (en) | Virtual CT images from magnetic resonance images | |
| US10368777B2 (en) | Non-contrast dynamic MRI myocardial perfusion analysis and visualization | |
| WO2012067123A1 (ja) | 磁気共鳴イメージング装置及び磁気共鳴イメージング方法 | |
| JP2023171516A (ja) | 医用情報処理装置及び医用情報処理方法 | |
| JP2019122623A (ja) | 磁気共鳴イメージング装置および医用画像処理装置 | |
| US9167988B2 (en) | Magnetic resonance imaging apparatus and method for color-coding tissue based on T1 values | |
| JP5984239B2 (ja) | 磁気共鳴イメージング装置及び磁気共鳴イメージング方法 | |
| JP2016140683A (ja) | 医用画像処理装置および磁気共鳴イメージング装置 | |
| US11600378B2 (en) | Image diagnosis support apparatus, image diagnosis support program, and medical image acquisition apparatus including the same | |
| US20190107594A1 (en) | Magnetic resonance imaging apparatus and image processing apparatus | |
| JP7419145B2 (ja) | 医用情報処理装置及び医用情報処理方法 | |
| JP6618786B2 (ja) | 磁気共鳴イメージング装置及び画像処理装置 | |
| USRE47604E1 (en) | Magnetic resonance imaging apparatus and method for color-coding tissue based on T1 values | |
| JPWO2017134830A1 (ja) | 医用画像診断支援装置、および、磁気共鳴イメージング装置 | |
| EP4339879A1 (en) | Anatomy masking for mri | |
| EP3885780A1 (en) | Magnetic resonance imaging of breast micro-calcifications | |
| EP3581090A1 (en) | Electrical properties tomography mapping of conductivity changes | |
| JP2018108124A (ja) | 磁気共鳴イメージング装置 |
Legal Events
| Date | Code | Title | Description |
|---|---|---|---|
| WWE | Wipo information: entry into national phase |
Ref document number: 201180003911.4 Country of ref document: CN |
|
| 121 | Ep: the epo has been informed by wipo that ep was designated in this application |
Ref document number: 11832601 Country of ref document: EP Kind code of ref document: A1 |
|
| WWE | Wipo information: entry into national phase |
Ref document number: 2011832601 Country of ref document: EP |
|
| NENP | Non-entry into the national phase |
Ref country code: DE |