WO2012020456A1 - 時系列データ処理装置及びその方法 - Google Patents
時系列データ処理装置及びその方法 Download PDFInfo
- Publication number
- WO2012020456A1 WO2012020456A1 PCT/JP2010/005045 JP2010005045W WO2012020456A1 WO 2012020456 A1 WO2012020456 A1 WO 2012020456A1 JP 2010005045 W JP2010005045 W JP 2010005045W WO 2012020456 A1 WO2012020456 A1 WO 2012020456A1
- Authority
- WO
- WIPO (PCT)
- Prior art keywords
- time
- series data
- data
- combination
- analysis
- Prior art date
Links
Images


Classifications
-
- G—PHYSICS
- G06—COMPUTING; CALCULATING OR COUNTING
- G06F—ELECTRIC DIGITAL DATA PROCESSING
- G06F16/00—Information retrieval; Database structures therefor; File system structures therefor
- G06F16/20—Information retrieval; Database structures therefor; File system structures therefor of structured data, e.g. relational data
- G06F16/25—Integrating or interfacing systems involving database management systems
-
- G—PHYSICS
- G05—CONTROLLING; REGULATING
- G05B—CONTROL OR REGULATING SYSTEMS IN GENERAL; FUNCTIONAL ELEMENTS OF SUCH SYSTEMS; MONITORING OR TESTING ARRANGEMENTS FOR SUCH SYSTEMS OR ELEMENTS
- G05B23/00—Testing or monitoring of control systems or parts thereof
- G05B23/02—Electric testing or monitoring
- G05B23/0205—Electric testing or monitoring by means of a monitoring system capable of detecting and responding to faults
- G05B23/0218—Electric testing or monitoring by means of a monitoring system capable of detecting and responding to faults characterised by the fault detection method dealing with either existing or incipient faults
- G05B23/0221—Preprocessing measurements, e.g. data collection rate adjustment; Standardization of measurements; Time series or signal analysis, e.g. frequency analysis or wavelets; Trustworthiness of measurements; Indexes therefor; Measurements using easily measured parameters to estimate parameters difficult to measure; Virtual sensor creation; De-noising; Sensor fusion; Unconventional preprocessing inherently present in specific fault detection methods like PCA-based methods
Definitions
- the present invention relates to a time-series data processing apparatus and method for processing time-series data generated from various sensors.
- Patent Document 1 when analyzing a plurality of time-series data, considering that the sampling period of each time-series data is different for each data, missing data is extracted according to the sampling period of the plurality of time-series data.
- a technique for complementing and storing the supplemented data is disclosed. Specifically, when time-series data is sampled at a 1-second or 2-second period, the time-series data of a 2-second period is supplemented with reference to the time-series data of a 1-second period, and each time-series data is Accumulate.
- plant data is fetched at a predetermined data fetching period and written in the plant data table, plant data is fetched at a data recording period longer than the data fetching period, and is collected for each data recording period.
- long-term search history information that includes the maximum, minimum, and average values of plant data for each plant data history information and save it in the long-term search history information table.
- the present invention has been made in view of the problems of the prior art, and an object thereof is a time-series data processing apparatus and method capable of efficiently performing access to a plurality of time-series data to be analyzed. Is to provide.
- the present invention combines a plurality of time-series data to be analyzed at the time of data accumulation, accumulates the combined plurality of time-series data in the storage unit in association with their attributes, and performs data analysis Sometimes, as time-series data used in the analysis, a combination of a plurality of time-series data is extracted from the storage unit based on the attribute.
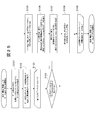
- FIG. 12 is a flowchart for explaining an analysis target ID / search target ID / acquisition target ID / acquisition target aggregated ID list creation process; It is a flowchart for demonstrating a data acquisition process. It is a flowchart for demonstrating the data extraction and analysis process by conditions and attributes. It is a block diagram which shows the whole block diagram of the computer system in 2nd Example. It is a block diagram of period aggregation information. It is a block diagram of a periodic buffer. It is a block diagram of attribute aggregation information. It is a block diagram of an attribute buffer. It is a block diagram of time aggregation information. It is a block diagram of a time buffer. It is a block diagram of an aggregation data table.
- a combination of time series data generated in the same cycle is selected and selected as a combination of a plurality of time series data to be analyzed.
- time series data related to predicted frequency and actual frequency
- the aggregated sets of time-series data are stored in the storage unit in association with attributes (frequency), and used for analysis during data analysis
- a combination of time series data generated in the same cycle is extracted from the storage unit.
- FIG. 1 is a block diagram of a computer system to which the present invention is applied.
- the computer system includes a time series data source 10, a client computer 12, a network 14, a time series data processing device 16, and an external storage device 18.
- the time series data source 10, the client computer 12, and the time series data processing device 16 are connected to each other via a network 14, and the time series data processing device 16 is connected to an external storage device 18.
- the time-series data source 10 is a sensor that detects various sensors, for example, temperature, humidity, voltage, current, power generation amount, power consumption, actual turbine vibration frequency, or a predicted vibration that generates a predicted value of turbine vibration. It is configured as a time series data generation source that outputs output signals from various sensors and predicted frequency generators as time series data to the network 14 according to the time axis.
- the client computer 12 includes a processor, a memory, an input / output device, a storage device, a display device, and the like.
- the client computer 12 issues an analysis query as an analysis request to the network 14 and transmits data from the time-series data processing device 16 to the network 14.
- the received data is stored in the storage device as result data.
- the time-series data processing device 16 includes a memory 20, a communication interface 22, an external storage interface 24, and a processor 26.
- the memory 20, the communication interface 22, the external storage interface 24, and the processor 26 are connected to each other via an internal network 28.
- the communication interface 22 is connected to the network 14, and the external storage interface 24 as a storage unit is connected to the external storage device 18.
- a storage device as a storage unit may be arranged in the time series data processing device 16 and this storage device may be connected to the internal network 28.
- the processor 26 performs overall control of the entire time-series data processing device 16 and executes various processes according to the time-series data processing program 30 stored in the memory 20.
- the processor 26 functions as a data processing unit that sequentially inputs and processes the time-series data output from the time-series data source 10 and accesses the aggregated data table 32 stored in the external storage device 18. It functions as a data acquisition and analysis unit that acquires data from the aggregate data table 32 and analyzes the acquired data.
- the time-series data processing program 30 includes a data storage unit 34, a data analysis unit 36, a data acquisition unit 38, and a setting information storage area 40.
- the data storage unit 34 functions as a data processing unit, and includes a data reception unit 42, a data attribute aggregation unit 44, a data time aggregation unit 46, a feature point extraction unit 48, a data compression unit 50, and an aggregate data writing unit. 52, an attribute buffer 54, and a time buffer 56.
- the data analysis unit 36 includes an analysis reception unit 60 and an analysis execution unit 62.
- the data acquisition unit 38 includes a reading time zone narrowing unit 70, an aggregated data reading unit 72, a data decompressing unit 74, a data time extracting unit 76, a data narrowing unit 78, and a data attribute extracting unit 80.
- the data analysis unit 36 and the data acquisition unit 38 function as a data acquisition analysis unit.
- the setting information storage area 40 stores attribute aggregation information 90 and time aggregation information 92.
- the data reception unit 42 of the data storage unit 34 is input when the time-series data output from the time-series data source 10 is input to the time-series data processing device 16 via the network 14 and the communication interface 22. Time series data is received sequentially along the time axis.
- the data receiving unit 42 aggregates each time-series data with data attributes. To the unit 44.
- the data attribute aggregating unit 44 combines a plurality of time-series data to be analyzed from the input time-series data, that is, a plurality of time-series data generated in the same period, and a plurality of time-series data combined, for example, prediction A combination of time series data related to the frequency and the actual frequency is combined, and a plurality of the combined time series data is aggregated in association with attributes related to each other, for example, the frequency (hereinafter also referred to as attribute aggregation).
- the aggregated time series data is accumulated in the attribute buffer 54 as attribute aggregated data and is output to the data time aggregating unit 46.
- the data time aggregation unit 46 collects and collects the input attribute aggregation data for a set time (set time) and processes it as time aggregation data. For example, the data time aggregating unit 46 aggregates the input attribute aggregated data in units of one hour, accumulates the time aggregated data in the time buffer 56, and outputs it to the feature point extracting unit 48.
- the data attribute aggregation unit 44 combines time series data to be analyzed and a plurality of time series data generated in the same cycle, the combination of the time series data is selected one by one, and each selected A set of time-series data is collected and aggregated in units of one hour of the set time, and the aggregated sets of time-series data are accumulated in the time buffer 56 as time-aggregated data.
- the feature point extraction unit 48 extracts the feature points from the input time aggregated data, and inputs the time aggregated data together with the extracted feature points, for example, the predicted maximum value, the predicted minimum value, the actual maximum value, and the actual minimum value. Is output to the data compression unit 50.
- the data compression unit 50 compresses the time aggregation data output from the feature point extraction unit 48 and outputs the compressed data and the feature points output from the feature point extraction unit 48 to the aggregation data writing unit 52.
- the aggregated data writing unit 52 writes the data output from the data compression unit 50 into the aggregated data table 32 of the external storage device 18 as aggregated data.
- the analysis reception unit 60 of the data analysis unit 36 receives an analysis query from the client computer 12 when an analysis query issued from the client computer 12 is input via the network 14 and the communication interface 22, and receives the received analysis query.
- the query is output to the data acquisition unit 38.
- the analysis execution unit 62 executes the analysis specified by the analysis query based on the processing result of the data acquisition unit 38.
- the read time zone narrowing unit 70 of the data acquisition unit 38 interprets the analysis query from the analysis reception unit 60, acquires the read time zone and search conditions specified in the analysis query, and reads the read time acquired from the aggregate data table 32.
- the reading time zone is narrowed down based on the feature points of the zone and is output to the aggregated data reading unit 72.
- the aggregate data reading unit 72 searches the aggregate data table 32 based on the read time zone narrowed down by the read time zone narrowing unit 70, and data (aggregation ID) belonging to the data aggregate time zone stored in the aggregate data table 32. , Data including feature points, time aggregation data, and the like) are output to the data decompression unit 74.
- the data decompression unit 74 decompresses the time aggregation data output from the aggregate data reading unit 72 and outputs the decompressed time aggregation data to the data time extraction unit 76.
- the data time extraction unit 76 extracts time aggregation data in the reading time zone from the time aggregation data decompressed by the data decompression unit 74, processes the extracted time aggregation data as attribute aggregation data, and narrows down the attribute aggregation data. It outputs to the part 78.
- the data narrowing-down unit 78 narrows down and extracts attribute-aggregated data satisfying the search conditions specified in the analysis query from the attribute-aggregated data processed by the data time extracting unit 76, and extracts the attribute-aggregated data that has been narrowed down as data attributes. To the unit 80.
- the data attribute extraction unit 80 extracts a plurality of time-series data (time-series data related to the predicted frequency and the actual frequency) having the attribute (frequency) to be analyzed from the attribute aggregated data narrowed down by the data narrowing-down unit 78. Extraction is performed at the same period, and a plurality of extracted time-series data is output to the analysis execution unit 62.
- FIG. 2 shows the structure of the time series data management table.
- the time-series data management table 100 is a table stored in the memory 20 of the time-series data processing device 16, for example, and includes a name 102, an attribute 104, a date and time 106, and a value 108. .
- this time-series data management table 100 information about time-series data generated from the time-series data source 10 is sequentially stored.
- the name 102 is “predicted value of turbine vibration”
- the attribute 104 is “predicted vibration frequency”
- the date and time 106 is “2010-05-01 07:00:00”
- the value 108 is “ 24.3 "data”.
- the name 102 is “watt checker”
- the attribute 104 is “power consumption”
- the date and time 106 is “2010-05-01 07:00:00”
- the value 108 is “6.7”.
- the time series data D4 has the name 104 as “power generation meter”, the attribute 104 as “power generation”, the date and time 106 as “2010-05-01 07:00:00”, value 108 is managed as data “240”.
- the time series data D1 and D2 are time series data generated in the same cycle, and are managed as time series data D5 and D6 in the next generation cycle.
- the time series data D3 and D4 are time series data generated at different periods, and the time series data D3 is generated every minute, and is managed as time series data D7 in the next generation period.
- the time series data D4 is time series data generated in one hour cycle, and is managed as time series data D9 in the next generation cycle.
- FIG. 3 shows a configuration of the attribute aggregation information 90 stored in the setting information storage area 40.
- the attribute aggregation information 90 includes an aggregation ID 120 and an attribute 122.
- the attribute 122 stores, for example, an “estimated frequency” as an attribute of time series data related to a predicted value of turbine vibration among a plurality of time series data to be analyzed, and an attribute of an actual value of turbine vibration.
- the “actual frequency” shown is stored.
- “frequency” which is an attribute indicated by the predicted frequency and the actual frequency and is an attribute related to each other is stored.
- FIG. 4 shows the configuration of the attribute buffer 54.
- the attribute buffer 54 includes an information storage area in a table format, and includes a date / time field 130, an attribute field 132, and a value field 134. Each entry in the date / time field 130 stores information on the date / time when a plurality of time-series data to be analyzed is acquired.
- Each entry of the attribute field 132 stores, for example, “predicted frequency” and “actual frequency” as information regarding attributes of a plurality of time-series data to be analyzed.
- Each entry of the value field 134 stores “15.2” as information on the value of each time series data, for example, the value of the time series data on the predicted frequency, and the value of the time series data on the actual frequency. , “24.3” is stored.
- FIG. 5 shows the configuration of the time aggregation information 92 stored in the setting information storage area 40.
- the time aggregation information 92 includes an aggregation ID 140 and a time aggregation data number 42.
- the aggregation ID 140 stores, for example, “frequency” which is an attribute indicated by the predicted frequency and the actual frequency and is an attribute related to each other.
- “3600” information is stored as the number for accumulating time series data for one hour.
- FIG. 6 shows the configuration of the time buffer 56.
- the time buffer 56 includes an information storage area in a table format, and includes an aggregation ID field 150, a data aggregation time zone field 152, and an attribute aggregation data field 154.
- the entry of the data aggregation time zone field 152 stores information related to the time zone in which the time series data is aggregated.
- time series data D1 and time series data D2 are combined, and the combined time series data D1 and D2 are aggregate IDs. Stored in association with “frequency”.
- FIG. 7 shows the configuration of the aggregate data table 32 stored in the external storage device 18.
- the aggregated data table 32 includes an aggregated ID field 160, a feature point field 162, a data aggregation time zone field 164, and a time aggregated data field 166.
- each entry of the aggregation ID field 160 stores information on “frequency” that is an attribute obtained by aggregating the attributes indicated by the predicted frequency and the actual frequency.
- Each entry of the feature point field 162 stores information on feature points of time-series data accumulated over one hour among a plurality of input time-series data. For example, the maximum value of the predicted frequency is stored as “predicted maximum value: 30”, the minimum value of the predicted frequency is stored as “predicted minimum value: 0”, and the maximum value of the actual frequency is "Maximum value: 40" is stored, and "Actual minimum value: 0" is stored as the minimum value of the actual frequency.
- each time-series data is time-aggregated data, and information related to the data aggregation time zone when the data is collected is stored numerically together with information indicating the date.
- each entry of the time aggregation data field 166 data related to time aggregation data aggregated in units of one hour is stored.
- the time series data D1 and D2 are combined, the time series data D5 and D6 are combined, and the combined time series data D1, D2, D5, and D6 are associated with the “frequency” of the aggregation ID.
- Each entry stores the combined time series data for one hour.
- FIG. 8 shows a configuration related to the analysis query.
- the analysis query 170 includes a selection range (select_range) 172, a selection item (select_items) 174, a data acquisition target time zone (from _timerange) 176, and a search condition (where_condition) 178.
- “1 second” is stored in the selection range 172 as the timing of processing by the data analysis unit 36.
- “predicted frequency ⁇ actual frequency AS deviation frequency” is stored as an analysis target ID for the analysis execution unit 62 to perform analysis.
- This process starts when the processor 26 activates the data storage unit 34 of the time-series data processing program 30.
- the data reception unit 42 when the data reception unit 42 receives time-series data from the time-series data source 10 via the communication interface 22, the data reception unit 42 sequentially passes the received time-series data to the data attribute aggregation unit 44. (S11).
- the data attribute aggregation unit 44 sets the attributes of a plurality of time-series data having the same period among the received time-series data, for example, “predicted vibration frequency, actual vibration frequency” and the attribute 122 of the attribute aggregation information 90. If the attribute of each time-series data that is matched and received is “predicted frequency” or “actual frequency”, “frequency” is acquired as an aggregation ID corresponding to the attribute of each received time-series data ( S12) The received time-series data is accumulated in the attribute buffer 54 corresponding to the aggregate ID (frequency) (S13).
- the data attribute aggregation unit 44 determines whether or not all attribute values at the same date and time exist in the attribute buffer 54 corresponding to the aggregation ID (S14). Returning to the processing, when it is determined that all the data exists, the data of all attributes having the same date and time are acquired from the attribute buffer 54 corresponding to the aggregate ID, and thereafter the data on the attribute buffer 54 is deleted (S15). .
- the data attribute aggregation unit 44 performs attribute aggregation for combining all attribute data acquired from the attribute buffer 54 for each of a plurality of time-series data to be analyzed and associating with the aggregation ID.
- a plurality of time-series data is processed as attribute aggregated data, and this attribute aggregated data is output to the data time aggregating unit 46 (S16).
- the data time aggregating unit 46 receives the attribute aggregated data, accumulates this attribute aggregated data in the time buffer 56 (S17), and the number of data in the time buffer 56 is the number of time aggregated data 42 in the time aggregated information 92.
- the number of data in the time buffer 56 is the number of time aggregated data 42 in the time aggregated information 92.
- the process proceeds to the process of step S19, assuming that data for one hour has been collected.
- step S19 the data time aggregating unit 46 acquires all the attribute aggregated data from the time buffer 56 corresponding to the aggregation ID (frequency), and then deletes the data on the time buffer 56.
- the data time aggregation unit 46 aggregates all the collected attribute aggregation data as data for one hour, processes the attribute aggregation data as time aggregation data, and outputs the time aggregation data to the feature point extraction unit 48 (S20).
- the feature point extraction unit 48 extracts “feature points” from the input time-aggregated data as values serving as the features, and outputs the time-aggregated data to the data compression unit 50 together with the extracted feature points (S21). ).
- the data compression unit 50 compresses the input time aggregation data, and outputs the compressed data and feature points to the aggregation data writing unit 52 (S22).
- the aggregated data writing unit 52 receives time aggregated data and feature point data, and receives the received time aggregated data and feature point data in the aggregated data table 32 of the external storage device 18 via the external storage interface 24. Writing (S23), the processing in this routine is terminated.
- time aggregated data in units of one hour is stored in association with aggregated IDs (frequency) together with data of feature points and data aggregated time zones.
- the aggregate data can be accumulated with a smaller amount of data than when the data is not compressed.
- This process is started when the processor 26 activates the data analysis unit 36 and the data acquisition unit 38 of the time-series data processing program 30.
- the analysis reception unit 60 receives the analysis query 170 (S31), and the data acquisition unit 38 executes analysis target ID / search target ID / acquisition target ID / acquisition target aggregation ID list creation processing (S32). Thereafter, the data acquisition unit 38 executes a data acquisition process (S33). Thereafter, the analysis execution unit 62 executes data extraction / analysis processing based on conditions / attributes (S34), and performs processing for transmitting data stored in an analysis result buffer (not shown) to the client computer 12 as result data. This is executed (S35), and the processing in this routine is terminated.
- analysis target ID / search target ID / acquisition target ID / acquisition target aggregate ID list creation processing will be described with reference to the flowchart of FIG.
- This process is a process performed in step S32 of FIG. 10.
- the analysis receiving unit 60 creates an analysis target ID list from the selection items (select_items) 174 of the analysis query 70, and the analysis is performed in this list.
- the predicted frequency and the actual frequency are written as the target ID (S41).
- the analysis receiving unit 60 creates a search target ID list from the search condition (where_condition) 178 of the analysis query 170, and writes the predicted frequency as the search target ID in this list (S42).
- the analysis receiving unit 60 creates an acquisition target ID list by combining the analysis target ID and the search target ID, and writes the predicted frequency and the actual frequency as the acquisition target ID in this list (S43).
- the analysis accepting unit 60 starts loop processing of the acquisition target ID list from step S44 to step S48.
- the data analysis accepting unit 60 matches the acquisition target ID with the attribute 122 of the attribute aggregation information 90, acquires “frequency” as the acquisition ID to be acquired (S45), and acquires the aggregation ID to be acquired. It is determined whether or not the “frequency” exists in the acquisition target aggregation ID list (S46). If it does not exist, the aggregation ID to be acquired is added to the acquisition target aggregation ID list (S47) and becomes the acquisition target. When the aggregation ID already exists in the acquisition target aggregation ID list, the processing in this routine is terminated.
- the reading time zone narrowing unit 70 receives the acquisition target aggregated ID list from the analysis accepting unit 60 (S51), and based on the analysis query 170, the time zone of the data acquisition target time zone (from_timerange) 176 of the analysis query 170 For example, “07:20:00 to 08:40:00” is acquired as the data acquisition target time zone (S52).
- the read time zone narrowing unit 270 uses the feature points of the aggregated data table 32 to narrow down the data acquisition time zone to the time zone where the data satisfying the search condition (where_condition) 178 of the analysis query 170 exists ( S53).
- the read time zone narrowing-down unit 270 refers to the aggregated data table 32 in FIG. 7, and the time-series data having a predicted frequency of 40 or more does not exist in the first entry but exists only in the second entry. When doing so, the data acquisition target time zone is narrowed down from 7:20 to 8:40 to 8: 0 to 8:40.
- the read time zone narrowing unit 70 outputs information on the narrowed data acquisition target time zone to the aggregated data read unit 72.
- steps S54 to S58 a loop process of the acquisition target aggregation ID list is performed.
- the aggregated data reading unit 72 refers to the aggregated data table 32, acquires aggregated data belonging to the narrowed data acquisition target time zone from the aggregated data table 32 as aggregated data related to the acquisition target aggregated ID, and acquires the aggregated data Data is output to the data decompression unit 74 (S55).
- the data decompression unit 74 decompresses the input aggregated data and outputs the decompressed aggregated data to the data time extraction unit 76 (S56).
- the data time extracting unit 76 refers to the time aggregated data number 42 of the time aggregated information 92 and extracts an attribute aggregated data list belonging to the narrowed data acquisition target time zone based on the time aggregated data number ( S57) The process in this routine is terminated on condition that all the processes related to the acquisition target aggregated ID list are completed.
- This process is the process in step S34 of FIG. 10, and first, the data narrowing unit 78 acquires the data narrowing condition (predicted frequency is 40 or more) from the condition 178 of the analysis query 170 (S61). The attribute aggregation data list extracted by the time extraction unit 76 is acquired (S62).
- steps S63 to S68 a loop process of the attribute aggregation data list is performed.
- the data attribute extraction unit 78 analyzes the analysis target ID from the combination of the time series data (attribute aggregation data) narrowed down by the data narrowing unit 78.
- the list data is extracted (S65). That is, one set of time series data relating to the predicted frequency and the actual frequency specified in the selection item 174 of the analysis query 170 is extracted from the attribute aggregated data as a plurality of time series data to be analyzed.
- the data attribute extraction unit 80 outputs a combination of the extracted time series data to the analysis execution unit 62 as a plurality of time series data to be analyzed.
- the analysis execution unit 62 executes the analysis specified by the selection item 174 of the analysis query 170 on the plurality of sets of time series data extracted by the data attribute extraction unit 80 (S66). That is, for a plurality of time-series data to be analyzed and having a predicted frequency of 40 or more, analysis is performed by subtracting the actual frequency from the predicted frequency to obtain the deviation frequency.
- the analysis execution unit 62 accumulates each set of analysis results in an analysis result buffer (not shown) (S67), and ends the processing in this routine.
- time series data generated in the same cycle is aggregated by attribute (frequency) and is aggregated in units of set time, a plurality of data generated in the same cycle is collected. Time series data can be accumulated efficiently.
- the time series data used in the analysis can be obtained by accessing the aggregated data table 32 that stores a plurality of time series data based on the attribute (frequency) based on the attribute. Since the combination of the time series data generated in the same period is extracted from the aggregate data table 32, the time series data used in the analysis can be efficiently accessed and analyzed.
- time series data time series data related to power generation and power consumption
- time series data time series data related to power generation and power consumption
- Multiple time-series data combinations are aggregated in a set time unit, and the aggregated time-series data is stored in the storage unit in association with attributes (power), and used for analysis during data analysis
- a combination of time series data generated at different periods time series data relating to power generation amount and power consumption amount is extracted from the storage unit.
- FIG. 14 shows the overall configuration of the second embodiment according to the present invention.
- a data period aggregation unit 43 is arranged between the data reception unit 42 and the data attribute aggregation unit 44 of the data storage unit 34, and instead of the attribute buffer 54.
- the attribute buffer 53 is arranged, the time buffer 55 is arranged instead of the time buffer 56, the period buffer 57 is arranged as a buffer managed by the data period aggregating unit 43, and the data attribute extracting unit 80 of the data acquiring unit 38 is arranged.
- the attribute aggregation information 91 is arranged instead of the attribute aggregation information 90 in the setting information storage area 40, and the time aggregation information 93 is arranged instead of the time aggregation information 92, Periodic aggregate information 95 is newly arranged, and the aggregate data table 33 is stored in the external storage device 18 instead of the aggregate data table 32.
- time-series data housed and time series data processing device 16 which has to process the time series data generated in different periods, and the other configuration is the same as the first embodiment.
- the data period aggregating unit 43 generates, for example, one hour period in order to collectively process time series data having different generation periods as time series data for one hour among the time series data output from the data receiving unit 42.
- time series data time series data relating to power generation amount
- time series data time series data relating to power consumption
- the series data and the time series data generated at a cycle of 1 minute are output to the data attribute aggregation unit 44, respectively.
- the data attribute aggregating unit 44 combines a plurality of time-series data to be analyzed from the input time-series data, that is, a plurality of time-series data generated at different periods, and a plurality of time-series data combined, for example, power generation
- the time-series data related to the amount and the time-series data related to the power consumption are combined, and a plurality of the combined time-series data are aggregated in association with the attributes related to each other, for example, power (hereinafter also referred to as attribute aggregation).
- the aggregated time series data is accumulated in the attribute buffer 53 as attribute aggregated data and is output to the data time aggregating unit 46.
- the data time aggregation unit 46 collects the input attribute aggregation data for a set time and processes it as time aggregation data. For example, the data time aggregation unit 46 aggregates the input attribute aggregation data in units of 24 hours, accumulates the time aggregation data in the time buffer 55, and outputs it to the feature point extraction unit 48.
- the feature point extraction unit 48 extracts the feature points from the input time aggregation data, and outputs the input time aggregation data to the data compression unit 50 together with the extracted feature points.
- the data compression unit 50 compresses the time aggregation data output from the feature point extraction unit 48 and outputs the compressed data and the feature points output from the feature point extraction unit 48 to the aggregation data writing unit 52.
- the aggregated data writing unit 52 writes the data output from the data compression unit 50 into the aggregated data table 32 of the external storage device 18 as aggregated data.
- the analysis reception unit 60 of the data analysis unit 36 receives an analysis query from the client computer 12 and outputs the received analysis query to the data acquisition unit 38 as in the first embodiment. Similar to the first embodiment, the analysis execution unit 62 executes the analysis defined by the analysis query based on the processing result of the data acquisition unit 38.
- the reading time zone narrowing unit 70, the aggregated data reading unit 72, the data decompressing unit 74, the data time extracting unit 76, the data narrowing unit 78, and the data attribute extracting unit 80 of the data acquisition unit 38 are Perform processing related to series data.
- the data attribute extracting unit 80 is a plurality of time-series data that are analysis target time-series data among the attribute-aggregated data narrowed down by the data narrowing-down unit 78 and whose aggregation ID is associated with power.
- a combination of time-series data related to one power generation amount and time-series data related to 60 power consumptions is extracted for each analysis target, and a plurality of extracted time-series data are analyzed. To 62.
- FIG. 15 shows a configuration of the period aggregation information 95.
- the period aggregation information 95 includes an attribute 200 and a period aggregation data number 202.
- the attribute 200 for example, “power generation amount” and “power consumption” are stored as attributes relating to time-series data to be analyzed.
- the period aggregated data number 202 for example, “1” is stored corresponding to the amount of power generation and “60” corresponding to the power consumption, as the number of data necessary for performing analysis in units of one hour. Is stored. This is because, when analyzing the power difference per hour, one data is used as the power generation amount, and 60 data is used as the power consumption generated per minute.
- FIG. 16 shows the configuration of the periodic buffer 57.
- the periodic buffer 57 has an information storage area configured in a table format, and includes a date / time field 210, an attribute field 212, and an accumulated data field 214.
- each entry of the date / time field 210 information on the date / time when data is accumulated in the cycle buffer 57 is stored numerically together with the date.
- the attribute field 212 for example, “power generation amount” or “power consumption” information is stored as an attribute of the time-series data accumulated in the periodic buffer 57.
- Each entry of the accumulated data field 214 stores the value of time series data (accumulated data) accumulated in the period buffer 57.
- “240” is stored as the value of the time series data D4 in FIG. 2 corresponding to the power generation amount, and as the value of the time series data D3, D7, D8 in FIG. “6.7”, “7.1”, and “12.4” are stored.
- FIG. 17 shows a configuration of the attribute aggregation information 91.
- the attribute aggregation information 91 includes an aggregation ID 220 and an attribute 222.
- the attribute 222 stores, for example, “power generation amount” and “power consumption” as attributes of time-series data generated at different periods.
- the aggregation ID 220 is an attribute indicating the power generation amount and the power consumption amount stored in the attribute 222, and “power” is stored as an attribute related to each other.
- FIG. 18 shows the configuration of the attribute buffer 53.
- the attribute buffer 53 includes an information storage area in a table format, and includes a periodic aggregation time zone field 230, an attribute field 232, and a periodic aggregation data field 234.
- each entry of the periodic aggregation time zone field 230 information related to the periodic aggregation time zone in units of one hour is stored.
- the attribute field 232 for example, “power generation amount” and “power consumption” are stored as attributes of a plurality of time series data to be analyzed.
- Each entry of the periodic aggregated data field 234 stores, for example, one value of the power generation amount corresponding to the power generation amount, and the value of the power consumption collected in one minute cycle corresponding to the power consumption amount. 60 values are stored.
- FIG. 19 shows the structure of the time aggregation information 93.
- the time aggregation information 93 includes an aggregation ID 240 and a time aggregation data number 242.
- aggregation ID 240 for example, “power” is stored as an attribute associated with “power generation” and “power consumption”.
- time aggregation data number 242 for example, “24” is stored in order to aggregate the power data in units of 24 hours.
- FIG. 20 shows the configuration of the time buffer 55.
- the time buffer 55 includes a data aggregation time zone 250 and attribute aggregation data 252.
- data aggregation time zone 250 information related to a time zone in which data is aggregated is stored as information in units of 24 hours.
- the attribute aggregated data 252 collectively stores hourly data. For example, in the case of the time series data of FIG. 2, the time series data D4, D3, D7,..., D8 are stored as data for one hour to be analyzed.
- FIG. 21 shows the configuration of the aggregated data table 33.
- the aggregate data table 33 includes an information storage area in a table format, and is composed of an aggregate ID field 260, a feature point field 262, a data aggregation time zone field 264, and a time aggregate data field 266.
- each entry of the aggregation ID field 260 for example, “power” is stored as an attribute that aggregates the power generation amount and the power consumption amount.
- Each entry of the feature point field 262 stores information on feature points of time-series data collected every 24 hours. For example, “maximum power generation value: 300” is stored as the maximum value of power generation, and “minimum power generation value: 200” is stored as the minimum value of power generation. Further, “maximum power consumption value: 10” is stored as the maximum value of power consumption, and “minimum power consumption value: 5” is stored as the minimum value of power consumption.
- each entry of the data aggregation time zone field 264 for example, information on the data aggregation time zone for acquiring the power generation amount and the power consumption amount for 24 hours is stored.
- time aggregation data field 266 a value related to data periodically aggregated in units of one hour is stored as data for 24 hours.
- FIG. 22 shows the structure of the analysis query 270.
- the analysis query 270 includes a selection range (select_range) 272, a selection item (select_items) 274, a data acquisition target time zone (from_timerange) 276, and a search condition (where_condition) 278.
- selection range (select_range) 272 1 hour is stored as a processing time unit for the data analysis unit 36 to analyze the data.
- selection item (select_items) 274 for example, a power generation amount ⁇ SUM (power consumption) AS power difference is stored as the analysis target ID.
- This process is started when the processor 26 activates the data storage unit 34 of the time-series data processing program 30.
- the data reception unit 42 receives the time-series data output from the time-series data source 10 via the network 14 and the communication interface 22, and passes the received time-series data to the data period aggregation unit 43 (S71).
- the data period aggregation unit 43 sequentially accumulates the input time-series data in the period buffer 57 (S72), and the number of accumulated data in the period buffer 57 is defined by the period aggregation data number 202 of the period aggregation information 95. (S73), and if the number of data stored in the period buffer 57 does not exceed the number defined by the period aggregated data number 202, the process returns to step S71. When the number of data stored in the period buffer 57 exceeds the number defined by the period aggregated data number 202, the process proceeds to step S74.
- step S73 the data cycle aggregating unit 43 determines whether or not one piece of time series data relating to the amount of power generation has been accumulated in the process of sequentially storing the input time series data in the cycle buffer 57, and the power consumption. It is determined whether or not the number of time-series data related to the quantity has reached 60.
- the data cycle aggregation unit 43 acquires from the cycle buffer 57 the accumulated data (data including one time-series data related to power generation and 60 time-series data related to power consumption) accumulated in the cycle buffer 57. Thereafter, the data in the cycle buffer 57 is deleted (S74), the cycle aggregation for collecting the accumulated data acquired from the cycle buffer 57 as one-hour cycle data is executed, and the cycle-aggregated data (related to the power generation amount) The data including the time series data and the time series data regarding the power generation amount) is output to the data attribute aggregation unit 44 (S75).
- the data attribute aggregation unit 44 receives the periodic aggregated data, sequentially accumulates this periodic aggregated data in the attribute buffer 53 corresponding to the aggregate ID (S76), and stores it in the attribute buffer 53 corresponding to the aggregate ID at the same date and time. It is determined whether or not there is periodic aggregated data of all attributes (power generation amount and power consumption amount) (S77), and when it is determined that all the items do not exist, the process returns to step S71 and all are present. If it is determined that the period is aggregated, periodic aggregated data of all attributes (power generation amount and power consumption amount) of the same date and time is acquired from the attribute buffer 53 corresponding to the aggregation ID, and then the data on the attribute buffer 53 is deleted. (S78).
- the data attribute aggregation unit 44 combines the period aggregation data of all the attributes (power generation amount and power consumption amount) acquired from the attribute buffer 53 for each of a plurality of time series data to be analyzed, thereby combining the aggregation ID (power ) Is associated, and a plurality of combined time-series data is processed as attribute aggregated data, and this attribute aggregated data is output to the data time aggregating unit 46 (S79).
- the data time aggregation unit 46 receives the attribute aggregation data, sequentially accumulates the attribute aggregation data in the time buffer 55 (S80), and the number of attribute aggregation data accumulated in the time buffer 55 is the time aggregation information 93. It is determined whether or not the number stored in the time aggregated data number 242 exceeds 24, for example, 24 (S81), and when the number of attribute aggregated data in the time buffer 55 does not exceed the time aggregated data number 24. In order to collect the attribute aggregated data for the time, the process returns to the process of step S71. When the number of attribute aggregated data in the time buffer 55 exceeds the number of time aggregated data, the attribute aggregated data for 24 hours is collected. Then, the process proceeds to step S82.
- step S82 the data time aggregation unit 46 acquires all the attribute aggregation data from the time buffer 55 corresponding to the aggregation ID (power), and then deletes the data (attribute aggregation data) on the time buffer 55. To do.
- the data time aggregation unit 46 executes time aggregation for collecting all the acquired attribute aggregation data as data for 24 hours, processes the time-aggregated attribute aggregation data as time aggregation data, and performs time aggregation. Data is output to the feature point extraction unit 48 (S83).
- the feature point extraction unit 48 extracts “feature points” as the values that are the features from the input time aggregated data, and outputs the time aggregated data together with the extracted feature points to the data compression unit 50 (S84). ).
- the data compression unit 50 compresses the input time aggregated data, and outputs the compressed data and feature points to the aggregated data writing unit 52 (S85).
- the aggregated data writing unit 52 receives time aggregated data and feature point data, and receives the received time aggregated data and feature point data in the aggregated data table 33 of the external storage device 18 via the external storage interface 24.
- Write (S86) the processing in this routine is terminated.
- the time aggregated data in units of 24 hours is stored in association with the aggregated ID (power) together with the feature points and the data aggregated time zone data.
- This process is executed by the data analysis unit 36 and the data acquisition unit 38.
- the analysis reception unit 60 receives the analysis query 270 issued from the client computer 12 (S91), and then the data acquisition unit 38 An acquisition target ID / search condition ID / acquisition target ID / acquisition target aggregate ID list creation process is executed (S92).
- the data acquisition unit 38 executes data acquisition processing (S93), and thereafter, the analysis execution unit 62 executes data extraction / analysis processing based on conditions / attributes / cycles (S94).
- the execution unit 62 transmits the result data accumulated in the analysis result buffer to the client computer 12 (S95), and ends the processing in this routine.
- the acquisition target ID / search condition ID / acquisition target ID / acquisition target aggregate ID list creation process in step S92 is the same as the process in FIG. 11 except that the process is based on the analysis query 270. Since the data acquisition process in step S93 is the same as the process in FIG. 12 except for the process based on the analysis query 270, the description thereof is omitted.
- loop processing based on the attribute aggregation data list is performed in steps S103 to S109.
- the data refinement unit 78 determines whether or not a data refinement condition is satisfied for the acquired attribute aggregated data (S104). That is, it is determined whether there is a power generation amount of 250 or more in the attribute aggregated data. If there is a power generation amount of 250 or more, the process proceeds to step S105, and the power generation amount is 250 or more. If not, the process proceeds to step S109.
- step S105 the data attribute extraction unit 80 extracts attribute aggregation data of the analysis target ID list from the attribute aggregation data. That is, the data attribute extraction unit 80 generates attribute aggregated data defined in the selection item 274 of the analysis query 270, for example, one piece of time series data relating to power generation amount and one piece of time series data relating to power consumption for one hour. Attribute aggregation data including 60 pieces of data is extracted.
- the data cycle extraction unit 82 acquires data of the analysis query 270 based on the number of data (power generation amount: 1, power consumption amount: 60) defined by the cycle aggregated data number 202 of the cycle aggregate information 95.
- Data in the target time zone (from_timerange) 276 (data accumulated between 7: 00: 07: 00 and 17:00:00) is extracted (S106).
- the analysis execution unit 62 performs an analysis on the selection items (select_items) 274 of the analysis query 270 with respect to the data extracted by the data cycle extraction unit 82.
- the selection item (select_items) 274 is “power generation amount ⁇ SUM (power consumption) AS power difference”
- the calculation for calculating the power difference is performed by subtracting the power consumption amount for one hour from the power generation amount. To do.
- the analysis execution unit 62 accumulates the analysis results in an analysis result buffer (not shown) (S108), and terminates the processing in this routine on condition that the processing related to all attribute aggregated data lists has been executed. To do.
- a plurality of time series data generated at different periods are aggregated by attribute (power) and aggregated at a set time unit.
- Series data can be accumulated efficiently.
- the time series data used in the analysis is different by accessing the aggregated data table 33 in which a plurality of time series data is accumulated based on the attribute (power) based on the attribute. Since a combination of time series data generated in a cycle is extracted from the aggregate data table 33, it is possible to efficiently access and analyze a plurality of time series data used in the analysis.
- time series data source 10 time series data source, 12 client computer, 14 network, 16 time series data processing device, 18 external storage device, 20 memory, 26 processor, 30 time series data processing program, 32 aggregated data table, 34 data storage unit, 36 data Analysis unit, 38 data acquisition unit, 40 setting information storage area, 42 data reception unit, 43 data cycle aggregation unit, 44 data attribute aggregation unit, 46 data time aggregation unit, 48 feature point extraction unit, 50 data compression unit, 52 aggregation Data writing part, 60 Analysis receiving part, 62 Analysis execution part, 70 Reading time zone narrowing part, 72 Aggregated data reading part, 74 Data decompression part, 76, Data time extracting part, 78 Data narrowing part, 80 Data attribute extracting part, 82 Data cycle extractor. *
Landscapes
- Engineering & Computer Science (AREA)
- Physics & Mathematics (AREA)
- General Physics & Mathematics (AREA)
- Automation & Control Theory (AREA)
- Databases & Information Systems (AREA)
- Theoretical Computer Science (AREA)
- Data Mining & Analysis (AREA)
- General Engineering & Computer Science (AREA)
- Testing And Monitoring For Control Systems (AREA)
- Information Retrieval, Db Structures And Fs Structures Therefor (AREA)
Abstract
Description
Claims (20)
- 時系列データ発生源から時系列データを順次入力して処理するデータ処理部と、前記データ処理部の処理結果を蓄積する記憶部と、前記記憶部からデータを取得するとともに、前記取得したデータを解析要求に従って解析するデータ取得解析部とを、備え、
前記データ処理部は、
前記入力した時系列データのうち解析対象となる複数の時系列データを組み合わせ、前記組み合わせた複数の時系列データを、互いに関連する属性に対応付けて前記記憶部に蓄積し、
前記データ取得解析部は、
前記解析要求で規定された検索対象が前記属性である場合、前記属性を検索対象として前記記憶部をアクセスし、前記記憶部の中から前記属性に対応した時系列データであって、前記解析対象となる複数の時系列データを抽出し、前記抽出した複数の時系列データを用いて、前記解析要求で規定された解析を実行してなる時系列データ処理装置。 - 請求項1に記載の時系列データ処理装置において、
前記データ処理部は、
前記解析対象となる複数の時系列データの組み合わせとして、同一周期で発生する時系列データの組み合わせを選択し、前記選択した時系列データの組み合わせを複数組纏めて設定時間単位で集約し、前記集約した複数組の時系列データを前記属性に対応付けて前記記憶部に蓄積し、
前記データ取得解析部は、
前記解析で用いる時系列データとして、前記同一周期で発生する時系列データの組み合わせを前記記憶部から抽出してなる時系列データ処理装置。 - 請求項1に記載の時系列データ処理装置において、
前記データ処理部は、
前記解析対象となる複数の時系列データの組み合わせとして、同一周期で発生する時系列データの組み合わせを選択し、前記選択した時系列データの組み合わせを前記属性に対応付けて前記記憶部に蓄積し、
前記データ取得解析部は、
前記解析で用いる時系列データとして、前記同一周期で発生する時系列データの組み合わせを前記記憶部から抽出してなる時系列データ処理装置。 - 請求項1に記載の時系列データ処理装置において、
前記データ処理部は、
前記解析対象となる複数の時系列データの組み合わせとして、異なる周期で発生する時系列データの組み合わせを選択し、前記選択した組み合わせによる時系列データを、前記属性に対応付けて前記記憶部に蓄積し、
前記データ取得解析部は、
前記解析で用いる時系列データとして、前記異なる周期で発生する時系列データの組み合わせを前記記憶部から抽出してなる時系列データ処理装置。 - 請求項3に記載の時系列データ処理装置において、
前記データ処理部は、
前記選択した時系列データの組み合わせを複数組纏めて設定時間単位で集約し、前記集約した複数組の時系列データを前記属性に対応付けて前記記憶部に蓄積し、
前記データ取得解析部は、
前記解析で用いる時系列データとして、前記集約した複数組の時系列データを前記記憶部から抽出してなる時系列データ処理装置。 - 請求項4に記載の時系列データ処理装置において、
前記データ処理部は、
前記選択した時系列データの組み合わせを複数組纏めて設定時間単位で集約し、前記集約した複数組の時系列データを前記属性に対応付けて前記記憶部に蓄積し、
前記データ取得解析部は、
前記解析で用いる時系列データとして、前記集約した複数組の時系列データを前記記憶部から抽出してなる時系列データ処理装置。 - 請求項1に記載の時系列データ処理装置において、
前記データ処理部は、
前記解析対象となる複数の時系列データの組み合わせとして、同一周期で発生する時系列データの組み合わせを選択し、前記選択した時系列データの組み合わせに属する各時系列データの特徴点を抽出し、前記選択した時系列データの組み合わせを前記抽出した特徴点とともに前記属性に対応付けて前記記憶部に蓄積し、
前記データ取得解析部は、
前記同一周期で発生する時系列データの組み合わせに属する時系列データの特徴点についての基準値が、前記検索対象の条件として前記解析クエリに規定されている場合、前記解析で用いる時系列データとして、前記同一周期で発生する時系列データの組み合わせの中から当該時系列データの特徴点が、前記基準値を満たすものを前記記憶部から抽出してなる時系列データ処理装置。 - 請求項1に記載の時系列データ処理装置において、
前記データ処理部は、
前記解析対象となる複数の時系列データの組み合わせとして、異なる周期で発生する時系列データの組み合わせを選択し、前記選択した時系列データの組み合わせに属する各時系列データの特徴点を抽出し、前記選択した時系列データの組み合わせを前記抽出した特徴点とともに、前記属性に対応付けて前記記憶部に蓄積し、
前記データ取得解析部は、
前記異なる周期で発生する時系列データの組み合わせに属する時系列データの特徴点についての基準値が、前記検索対象の条件として前記解析クエリに規定されている場合、前記解析で用いる時系列データとして、前記異なる周期で発生する時系列データの組み合わせの中から当該時系列データの特徴点が、前記基準値を満たすものを前記記憶部から抽出してなる時系列データ処理装置。 - 請求項1に記載の時系列データ処理装置において、
前記データ処理部は、
前記解析対象となる複数の時系列データの組み合わせとして、同一周期で発生する時系列データの組み合わせを選択し、前記選択した時系列データの組み合わせに属する各時系列データを圧縮し、前記圧縮した時系列データの組み合わせを前記属性に対応付けて前記記憶部に蓄積し、
前記データ取得解析部は、
前記解析で用いる時系列データとして、前記同一周期で発生する時系列データの組み合わせの中から前記圧縮された時系列データの組み合わせを前記記憶部から抽出し、前記抽出した各時系列データを解凍してなる時系列データ処理装置。 - 請求項1に記載の時系列データ処理装置において、
前記データ処理部は、
前記解析対象となる複数の時系列データの組み合わせとして、異なる周期で発生する時系列データの組み合わせを選択し、前記選択した時系列データの組み合わせに属する各時系列データを圧縮し、前記圧縮した時系列データの組み合わせを前記属性に対応付けて前記記憶部に蓄積し、
前記データ取得解析部は、
前記解析で用いる時系列データとして、前記異なる周期で発生する時系列データの組み合わせの中から前記圧縮された時系列データの組み合わせを前記記憶部から抽出し、前記抽出した各時系列データを解凍してなる時系列データ処理装置。 - 時系列データ発生源から時系列データを順次入力して処理するデータ処理部と、前記データ処理部の処理結果を蓄積する記憶部と、前記記憶部からデータを取得するとともに、前記取得したデータを解析要求に従って解析するデータ取得解析部と、を有する時系列データ処理方法であって、
前記データ処理部が、前記入力した時系列データのうち解析対象となる複数の時系列データを組み合わせ、前記組み合わせた複数の時系列データを、互いに関連する属性に対応付けて前記記憶部に蓄積するステップと、
前記データ取得解析部が、前記解析要求で規定された検索対象が前記属性である場合、前記属性を検索対象として前記記憶部をアクセスするステップと、
前記データ取得解析部が、前記記憶部の中から前記属性に対応した時系列データであって、前記解析対象となる複数の時系列データを抽出するステップと、
前記データ取得解析部が、前記ステップで抽出した複数の時系列データを用いて、前記解析要求で規定された解析を実行するステップを含むことを特徴とする時系列データ処理方法。 - 請求項11に記載の時系列データ処理方法において、
前記データ処理部が、前記解析対象となる複数の時系列データの組み合わせとして、同一周期で発生する時系列データの組み合わせを選択するステップと、
前記データ処理部が、前記選択した時系列データの組み合わせを複数組纏めて設定時間単位で集約するステップと、
前記データ処理部が、前記ステップで集約した複数組の時系列データを前記属性に対応付けて前記記憶部に蓄積するステップと、
前記データ取得解析部が、前記解析で用いる時系列データとして、前記同一周期で発生する時系列データの組み合わせを前記記憶部から抽出するステップを含むことを特徴とする時系列データ処理方法。 - 請求項11に記載の時系列データ処理方法において、
前記データ処理部が、前記解析対象となる複数の時系列データの組み合わせとして、同一周期で発生する時系列データの組み合わせを選択するステップと、
前記データ処理部が、前記ステップで選択した時系列データの組み合わせを前記属性に対応付けて前記記憶部に蓄積するステップと、
前記データ取得解析部が、前記解析で用いる時系列データとして、前記同一周期で発生する時系列データの組み合わせを前記記憶部から抽出するステップを含むことを特徴とする時系列データ処理方法。 - 請求項11に記載の時系列データ処理方法において、
前記データ処理部が、前記解析対象となる複数の時系列データの組み合わせとして、異なる周期で発生する時系列データの組み合わせを選択するステップと、
前記データ処理部が、前記ステップで選択した組み合わせによる時系列データを、前記属性に対応付けて前記記憶部に蓄積するステップと、
前記データ取得解析部が、前記解析で用いる時系列データとして、前記異なる周期で発生する時系列データの組み合わせを前記記憶部から抽出するステップを含むことを特徴とする時系列データ処理方法。 - 請求項13に記載の時系列データ処理方法において、
前記データ処理部が、前記選択した時系列データの組み合わせを複数組纏めて設定時間単位で集約するステップと、
前記データ処理部が、前記ステップで集約した複数組の時系列データを前記属性に対応付けて前記記憶部に蓄積するステップと、
前記データ取得解析部が、前記解析で用いる時系列データとして、前記ステップで集約した複数組の時系列データを前記記憶部から抽出するステップを含むことを特徴とする時系列データ処理方法。 - 請求項14に記載の時系列データ処理方法において、
前記データ処理部が、前記選択した時系列データの組み合わせを複数組纏めて設定時間単位で集約するステップと、
前記データ処理部が、前記ステップで集約した複数組の時系列データを前記属性に対応付けて前記記憶部に蓄積するステップと、
前記データ取得解析部が、前記解析で用いる時系列データとして、前記ステップで集約した複数組の時系列データを前記記憶部から抽出するステップを含むことを特徴とする時系列データ処理方法。 - 請求項11に記載の時系列データ処理方法において、
前記データ処理部が、前記解析対象となる複数の時系列データの組み合わせとして、同一周期で発生する時系列データの組み合わせを選択するステップと、
前記データ処理部が、前記ステップで選択した時系列データの組み合わせに属する各時系列データの特徴点を抽出するステップと、
前記データ処理部が、前記ステップで選択した時系列データの組み合わせを前記抽出した特徴点とともに前記属性に対応付けて前記記憶部に蓄積するステップと、
前記データ取得解析部が、前記同一周期で発生する時系列データの組み合わせに属する時系列データの特徴点についての基準値が、前記検索対象の条件として前記解析クエリに規定されている場合、前記解析で用いる時系列データとして、前記同一周期で発生する時系列データの組み合わせの中から当該時系列データの特徴点が、前記基準値を満たすものを前記記憶部から抽出するステップを含むことを特徴とする時系列データ処理方法。 - 請求項11に記載の時系列データ処理方法において、
前記データ処理部が、前記解析対象となる複数の時系列データの組み合わせとして、異なる周期で発生する時系列データの組み合わせを選択するステップと、
前記データ処理部が、前記ステップで選択した時系列データの組み合わせに属する各時系列データの特徴点を抽出するステップと、
前記データ処理部が、前記ステップで選択した時系列データの組み合わせを前記抽出した特徴点とともに、前記属性に対応付けて前記記憶部に蓄積するステップと、
前記データ取得解析部が、前記異なる周期で発生する時系列データの組み合わせに属する時系列データの特徴点についての基準値が、前記検索対象の条件として前記解析クエリに規定されている場合、前記解析で用いる時系列データとして、前記異なる周期で発生する時系列データの組み合わせの中から当該時系列データの特徴点が、前記基準値を満たすものを前記記憶部から抽出するステップを含むことを特徴とする時系列データ処理方法。 - 請求項11に記載の時系列データ処理方法において、
前記データ処理部が、前記解析対象となる複数の時系列データの組み合わせとして、同一周期で発生する時系列データの組み合わせを選択するステップと、
前記データ処理部が、前記ステップで選択した時系列データの組み合わせに属する各時系列データを圧縮するステップと、
前記データ処理部が、前記ステップで圧縮した時系列データの組み合わせを前記属性に対応付けて前記記憶部に蓄積するステップと、
前記データ取得解析部が、前記解析で用いる時系列データとして、前記同一周期で発生する時系列データの組み合わせの中から前記圧縮された時系列データの組み合わせを前記記憶部から抽出するステップと、
前記データ取得解析部が、前記ステップで抽出した各時系列データを解凍するステップを含むことを特徴とする時系列データ処理方法。 - 請求項11に記載の時系列データ処理方法において、
前記データ処理部が、前記解析対象となる複数の時系列データの組み合わせとして、異なる周期で発生する時系列データの組み合わせを選択するステップと、
前記データ処理部が、前記ステップで選択した時系列データの組み合わせに属する各時系列データを圧縮するステップと、
前記データ処理部が、前記ステップで圧縮した時系列データの組み合わせを前記属性に対応付けて前記記憶部に蓄積するステップと、
前記データ取得解析部が、前記解析で用いる時系列データとして、前記異なる周期で発生する時系列データの組み合わせの中から前記圧縮された時系列データの組み合わせを前記記憶部から抽出するステップと、
前記データ取得解析部が、前記ステップで抽出した各時系列データを解凍するステップを含むことを特徴とする時系列データ処理方法。
Priority Applications (4)
| Application Number | Priority Date | Filing Date | Title |
|---|---|---|---|
| PCT/JP2010/005045 WO2012020456A1 (ja) | 2010-08-11 | 2010-08-11 | 時系列データ処理装置及びその方法 |
| CN201080068167.1A CN103003803B (zh) | 2010-08-11 | 2010-08-11 | 时序数据处理装置及其方法 |
| US13/813,574 US20130290242A1 (en) | 2010-08-11 | 2010-08-11 | Time series data processing device and method therefor |
| JP2012528518A JPWO2012020456A1 (ja) | 2010-08-11 | 2010-08-11 | 時系列データ処理装置及びその方法 |
Applications Claiming Priority (1)
| Application Number | Priority Date | Filing Date | Title |
|---|---|---|---|
| PCT/JP2010/005045 WO2012020456A1 (ja) | 2010-08-11 | 2010-08-11 | 時系列データ処理装置及びその方法 |
Publications (1)
| Publication Number | Publication Date |
|---|---|
| WO2012020456A1 true WO2012020456A1 (ja) | 2012-02-16 |
Family
ID=45567437
Family Applications (1)
| Application Number | Title | Priority Date | Filing Date |
|---|---|---|---|
| PCT/JP2010/005045 WO2012020456A1 (ja) | 2010-08-11 | 2010-08-11 | 時系列データ処理装置及びその方法 |
Country Status (4)
| Country | Link |
|---|---|
| US (1) | US20130290242A1 (ja) |
| JP (1) | JPWO2012020456A1 (ja) |
| CN (1) | CN103003803B (ja) |
| WO (1) | WO2012020456A1 (ja) |
Cited By (3)
| Publication number | Priority date | Publication date | Assignee | Title |
|---|---|---|---|---|
| WO2014109038A1 (ja) * | 2013-01-10 | 2014-07-17 | 株式会社日立製作所 | 時系列データ処理装置及び方法並びに記憶媒体 |
| WO2016111002A1 (ja) * | 2015-01-09 | 2016-07-14 | 株式会社日立製作所 | データ管理装置及びデータ管理方法 |
| JP6069503B2 (ja) * | 2013-07-01 | 2017-02-01 | 株式会社日立製作所 | 系列データ並列分析基盤およびその並列分散処理方法 |
Families Citing this family (12)
| Publication number | Priority date | Publication date | Assignee | Title |
|---|---|---|---|---|
| US9600523B2 (en) * | 2011-01-19 | 2017-03-21 | Oracle International Corporation | Efficient data collection mechanism in middleware runtime environment |
| JP6211802B2 (ja) * | 2013-05-29 | 2017-10-11 | 日本電産サンキョー株式会社 | データ処理装置およびデータ処理方法 |
| JP6754954B2 (ja) * | 2016-02-18 | 2020-09-16 | パナソニックIpマネジメント株式会社 | 端末機および端末機の制御方法、並びにこの端末機を用いた無線通信システム |
| US10719534B2 (en) | 2017-02-02 | 2020-07-21 | General Electric Company | Rollup engine for internet of things |
| CN107036820A (zh) * | 2017-05-09 | 2017-08-11 | 武汉理工大学 | 基于时序图像处理的发动机轮系横向振动检测方法及系统 |
| CN108052599A (zh) * | 2017-12-12 | 2018-05-18 | 清华大学 | 一种支持特征查询的时序数据存储的方法和装置 |
| CN107871022B (zh) * | 2017-12-20 | 2018-12-11 | 清华大学 | 一种时序数据列式存储、查询方法及系统 |
| CN110109990A (zh) * | 2019-03-18 | 2019-08-09 | 北京奇艺世纪科技有限公司 | 时序数据处理方法、设备、数据处理设备及介质 |
| CN112069424A (zh) * | 2019-06-10 | 2020-12-11 | 北京国双科技有限公司 | 访问行为数据分析方法及装置 |
| CN110689953A (zh) * | 2019-09-03 | 2020-01-14 | 东软医疗系统股份有限公司 | 数据存储方法及装置、数据查找方法及装置、电子设备 |
| CN113486072A (zh) * | 2020-03-17 | 2021-10-08 | 中国移动通信集团福建有限公司 | 数据分析方法、装置、电子设备及计算机可读存储介质 |
| CN116662276B (zh) * | 2023-06-06 | 2024-03-05 | 中科三清科技有限公司 | 数据处理方法、装置、电子设备及存储介质 |
Citations (5)
| Publication number | Priority date | Publication date | Assignee | Title |
|---|---|---|---|---|
| JPH08221113A (ja) * | 1995-02-16 | 1996-08-30 | Hitachi Ltd | 時系列データ記憶装置およびプロセス異常診断装置 |
| JP2003132088A (ja) * | 2001-10-22 | 2003-05-09 | Toshiba Corp | 時系列データ検索システム |
| JP2006031066A (ja) * | 2004-07-12 | 2006-02-02 | Ksl:Kk | 年表検索装置、年表検索方法、プログラム及び記録媒体 |
| JP2006053689A (ja) * | 2004-08-10 | 2006-02-23 | I-N Information Systems Ltd | 時系列データ表示システム及び時系列データ表示用プログラム |
| JP2008040817A (ja) * | 2006-08-07 | 2008-02-21 | Nippon Telegr & Teleph Corp <Ntt> | 属性情報付与方法及び属性情報更新方法及びプログラム |
Family Cites Families (2)
| Publication number | Priority date | Publication date | Assignee | Title |
|---|---|---|---|---|
| US7716194B2 (en) * | 2005-01-12 | 2010-05-11 | Microsoft Corporation | File management system employing time line based representation of data |
| MY151687A (en) * | 2007-03-02 | 2014-06-30 | Manual System Sdn Bhd E | A method of data storage and management |
-
2010
- 2010-08-11 US US13/813,574 patent/US20130290242A1/en not_active Abandoned
- 2010-08-11 CN CN201080068167.1A patent/CN103003803B/zh not_active Expired - Fee Related
- 2010-08-11 JP JP2012528518A patent/JPWO2012020456A1/ja active Pending
- 2010-08-11 WO PCT/JP2010/005045 patent/WO2012020456A1/ja active Application Filing
Patent Citations (5)
| Publication number | Priority date | Publication date | Assignee | Title |
|---|---|---|---|---|
| JPH08221113A (ja) * | 1995-02-16 | 1996-08-30 | Hitachi Ltd | 時系列データ記憶装置およびプロセス異常診断装置 |
| JP2003132088A (ja) * | 2001-10-22 | 2003-05-09 | Toshiba Corp | 時系列データ検索システム |
| JP2006031066A (ja) * | 2004-07-12 | 2006-02-02 | Ksl:Kk | 年表検索装置、年表検索方法、プログラム及び記録媒体 |
| JP2006053689A (ja) * | 2004-08-10 | 2006-02-23 | I-N Information Systems Ltd | 時系列データ表示システム及び時系列データ表示用プログラム |
| JP2008040817A (ja) * | 2006-08-07 | 2008-02-21 | Nippon Telegr & Teleph Corp <Ntt> | 属性情報付与方法及び属性情報更新方法及びプログラム |
Cited By (4)
| Publication number | Priority date | Publication date | Assignee | Title |
|---|---|---|---|---|
| WO2014109038A1 (ja) * | 2013-01-10 | 2014-07-17 | 株式会社日立製作所 | 時系列データ処理装置及び方法並びに記憶媒体 |
| JP6002250B2 (ja) * | 2013-01-10 | 2016-10-05 | 株式会社日立製作所 | 時系列データ処理装置及び方法並びに記憶媒体 |
| JP6069503B2 (ja) * | 2013-07-01 | 2017-02-01 | 株式会社日立製作所 | 系列データ並列分析基盤およびその並列分散処理方法 |
| WO2016111002A1 (ja) * | 2015-01-09 | 2016-07-14 | 株式会社日立製作所 | データ管理装置及びデータ管理方法 |
Also Published As
| Publication number | Publication date |
|---|---|
| CN103003803A (zh) | 2013-03-27 |
| CN103003803B (zh) | 2016-08-03 |
| US20130290242A1 (en) | 2013-10-31 |
| JPWO2012020456A1 (ja) | 2013-10-28 |
Similar Documents
| Publication | Publication Date | Title |
|---|---|---|
| WO2012020456A1 (ja) | 時系列データ処理装置及びその方法 | |
| US10733149B2 (en) | Template based data reduction for security related information flow data | |
| JP5678620B2 (ja) | データ処理方法、データ処理システム、及びデータ処理装置 | |
| CN108197181B (zh) | 一种时序数据的压缩存储方法、电子设备及存储介质 | |
| KR102511271B1 (ko) | 시계열 데이터 저장 및 쿼리 방법 및 장치, 및 그 서버 및 저장 매체 | |
| CN110134723A (zh) | 一种存储数据的方法和数据库 | |
| US9146927B2 (en) | Data processing apparatus, data processing method, and program | |
| JP5373870B2 (ja) | 予測装置、予測方法、及び、プログラム | |
| KR20090046543A (ko) | 전력 계통의 감시데이터 수집 및 운영 시스템과 그 방법 | |
| US20150095334A1 (en) | Data analysis support system | |
| CN109511015A (zh) | 多媒体资源推荐方法、装置、存储介质及设备 | |
| WO2019225125A1 (ja) | データ処理装置およびデータ処理方法 | |
| CN117235586B (zh) | 酒店客户画像构建方法、系统、电子设备及存储介质 | |
| US20130204913A1 (en) | File list generation method, system, and program, and file list generation device | |
| JP2019203759A5 (ja) | ||
| CN111737233A (zh) | 数据监控方法及装置 | |
| US20170160892A1 (en) | Individual customization system and method | |
| CN110580253A (zh) | 时序数据组的加载方法、装置、存储介质及电子设备 | |
| JP6617605B2 (ja) | 需要量予測プログラム、需要量予測方法、及び情報処理装置 | |
| JP5746652B2 (ja) | プラントデータ再生装置およびプラントデータ再生方法 | |
| JPWO2018061136A1 (ja) | 需要予測方法、需要予測システム及びそのプログラム | |
| WO2012172600A1 (ja) | データ検索システム及びデータ検索方法 | |
| WO2018162955A1 (en) | Method, entity, system, computer program, and medium for preparing learning data | |
| CN113177143B (zh) | 时序数据访问方法、装置、存储介质及电子设备 | |
| JP6852002B2 (ja) | データ検索方法、データ検索装置及びプログラム |
Legal Events
| Date | Code | Title | Description |
|---|---|---|---|
| 121 | Ep: the epo has been informed by wipo that ep was designated in this application |
Ref document number: 10855857 Country of ref document: EP Kind code of ref document: A1 |
|
| WWE | Wipo information: entry into national phase |
Ref document number: 2012528518 Country of ref document: JP |
|
| NENP | Non-entry into the national phase |
Ref country code: DE |
|
| WWE | Wipo information: entry into national phase |
Ref document number: 13813574 Country of ref document: US |
|
| 122 | Ep: pct application non-entry in european phase |
Ref document number: 10855857 Country of ref document: EP Kind code of ref document: A1 |