WO2011145614A1 - 核酸標準物質検出用プローブの設計方法、核酸標準物質検出用プローブ及び当該核酸標準物質検出用プローブを有する核酸検出系 - Google Patents
核酸標準物質検出用プローブの設計方法、核酸標準物質検出用プローブ及び当該核酸標準物質検出用プローブを有する核酸検出系 Download PDFInfo
- Publication number
- WO2011145614A1 WO2011145614A1 PCT/JP2011/061310 JP2011061310W WO2011145614A1 WO 2011145614 A1 WO2011145614 A1 WO 2011145614A1 JP 2011061310 W JP2011061310 W JP 2011061310W WO 2011145614 A1 WO2011145614 A1 WO 2011145614A1
- Authority
- WO
- WIPO (PCT)
- Prior art keywords
- nucleic acid
- standard substance
- acid standard
- probe
- detecting
- Prior art date
- Legal status (The legal status is an assumption and is not a legal conclusion. Google has not performed a legal analysis and makes no representation as to the accuracy of the status listed.)
- Ceased
Links
Images


Classifications
-
- C—CHEMISTRY; METALLURGY
- C12—BIOCHEMISTRY; BEER; SPIRITS; WINE; VINEGAR; MICROBIOLOGY; ENZYMOLOGY; MUTATION OR GENETIC ENGINEERING
- C12Q—MEASURING OR TESTING PROCESSES INVOLVING ENZYMES, NUCLEIC ACIDS OR MICROORGANISMS; COMPOSITIONS OR TEST PAPERS THEREFOR; PROCESSES OF PREPARING SUCH COMPOSITIONS; CONDITION-RESPONSIVE CONTROL IN MICROBIOLOGICAL OR ENZYMOLOGICAL PROCESSES
- C12Q1/00—Measuring or testing processes involving enzymes, nucleic acids or microorganisms; Compositions therefor; Processes of preparing such compositions
- C12Q1/68—Measuring or testing processes involving enzymes, nucleic acids or microorganisms; Compositions therefor; Processes of preparing such compositions involving nucleic acids
- C12Q1/6811—Selection methods for production or design of target specific oligonucleotides or binding molecules
Definitions
- the present invention relates to a probe design method for detecting a nucleic acid standard used in a system for detecting and / or quantifying nucleic acid, a nucleic acid standard detection probe designed by the design method, and the nucleic acid standard detection
- the present invention relates to a nucleic acid detection system provided with a probe.
- nucleic acid quantification targeting multiple subjects is indispensable for infectious disease diagnosis by quantitative detection of nucleic acids (genes) derived from pathogenic viruses and bacteria, and prognosis after drug administration.
- nucleic acid quantification techniques for microbial quantitative inspection and varietal contamination evaluation using nucleic acids as an index have begun to be introduced.
- DNA microarray DNA chip
- quantitative PCR PCR is performed using primers for detecting a target nucleic acid, and the amount of the target present is quantitatively evaluated.
- DNA microarrays are designed to relatively quantify gene expression levels by arranging a large number of probes that specifically hybridize with each mRNA as a target.
- nucleic acid standard is used as a reference for determining that there is no problem in the quantification operation itself.
- a nucleic acid having a base sequence different from the test nucleic acid is added as an internal standard substance, and the measurement value is standardized.
- some of the naturally occurring gene sequences have been used as the nucleic acid standard used here, but these conventional nucleic acid standards compare the quantitative results in common among various methods, devices, and kits. Did not have enough performance to do.
- a method for designing a DNA consisting of a non-natural and non-ordered base sequence has been developed.
- DNA sequences that are unlikely to cause mishybridization with each other are efficiently designed.
- a DNA sequence having a predetermined length is represented by a bit string (template) consisting of 0 and 1 for G or C and A or T, these are shifted between templates and between reverse sequences of templates.
- a set of DNA sequences is selected (see Patent Documents 1 and 2).
- Patent Literature a method for designing a DNA consisting of a base sequence that has no bias in the base sequence and that does not have a higher order structure by utilizing these principles.
- a plurality of DNAs designed by combining a plurality of DNAs having a certain length and a certain CG content are excluded from those designed to match an existing base sequence registered in a database, and the DNAs are created in combination.
- a plurality of base sequences having a GC content of 50% and a length of 12 mer are designed, and these sequences are joined together to design a base sequence of about 600 bases.
- a sequence whose nucleic acid base sequence and translation product sequence do not match 60% or more of the existing nucleic acid / protein database record is selected.
- Patent Document 3 is a method developed by the present inventors in order to solve the above-mentioned problems, and the DNA sequence obtained by the method is a non-natural sequence, and is the above 1) to 3 Part of the problem is a nucleic acid standard that can be avoided.
- the DNA sequence still contains a plurality of sequences that match 20 or more bases continuously with the naturally occurring sequence, in order to prepare a nucleic acid probe or primer for detection of the DNA sequence, If a partial sequence in a DNA sequence or its complementary sequence is to be used, there is a high possibility of selecting the similar sequence portion, and as a result, there remains a problem that a naturally occurring sequence is simultaneously detected.
- the DNA sequence is at most 600 bases long, and when a longer sequence is used as a standard substance at the time of measurement using a DNA myloarray or the like, or in a multiplex nucleic acid quantification system, multiple types of nucleic acid standards having the same performance There was also a problem that it was not possible to cope with the case where substances were required at the same time.
- An object of the present invention is to provide a detection probe design method capable of detecting a novel nucleic acid standard sample disclosed in Japanese Patent Application No. 2008-295338 with high accuracy, and detection of a nucleic acid standard substance designed by the design method.
- Another object of the present invention is to provide a nucleic acid detection system including a probe for nucleic acid and a probe for detecting the nucleic acid standard substance.
- the present invention includes the following.
- a probe for detecting a standard substance comprising an oligonucleotide consisting of at least 15 consecutive base sequences of any one of SEQ ID NOS: 1 to 40.
- the oligonucleotide is characterized by comprising at least 15 consecutive bases of a base sequence selected from the group consisting of SEQ ID NOs: 2 to 18, 20 to 22, 24 to 36, 38 and 40. Standard substance detection probe.
- a nucleic acid detection system comprising the nucleic acid standard substance detection probe according to any one of (1) to (3).
- the nucleic acid detection system according to (4) which is a microarray in which the probe for detecting a nucleic acid standard substance is fixed on a substrate.
- a method for designing a probe for detecting a nucleic acid standard substance comprising calculating a Tm value for each of the detection probe candidate sequences not excluded in the above step and selecting a nucleic acid standard substance detection probe based on the calculated Tm value .
- the method further comprises a step of calculating a dimer formation ratio and / or a secondary structure formation ratio in each molecule for each detection probe candidate sequence, and the calculated dimer formation ratio and / or secondary structure formation.
- the binding rate between the oligonucleotide having the detection probe candidate sequence and the off-target is the binding rate at a temperature when the detection probe candidate sequence and the nucleic acid standard substance to be detected are hybridized at a predetermined ratio.
- the nucleic acid standard substance detection probe In the step of selecting a nucleic acid standard substance detection probe based on the Tm value, the nucleic acid standard substance detection probe is regarded as a higher rank as the Tm value is closer to a predetermined value among a plurality of detection probe candidate sequences.
- the method further comprises a step of performing a hybridization experiment between the dilution series of the nucleic acid standard substance to be detected and the selected nucleic acid standard substance detection probe and verifying the detectability of the selected nucleic acid standard substance detection probe.
- the quantification ability between the nucleic acid quantification apparatuses can be compared and evaluated, or the quantitative values obtained by different nucleic acid quantification apparatuses can be objectively evaluated and compared. It becomes possible to detect a novel nucleic acid standard with high accuracy.
- FIG. 10 is a characteristic diagram showing the results of detecting a nucleic acid standard substance 500_1 using six types of DNA microarrays A to F.
- FIG. 10 is a characteristic diagram showing the results of detecting a nucleic acid standard substance 500_1 using six types of DNA microarrays A to F.
- FIG. 11 is a characteristic diagram showing the result of detecting the nucleic acid standard substance 500_1 using the DNA microarray A from the characteristic diagram shown in FIG. 11-1.
- FIG. 11 is a characteristic diagram showing an extracted result of detecting the nucleic acid standard substance 500_1 using the DNA microarray B from the characteristic chart shown in FIG. 11-1.
- FIG. 11 is a characteristic diagram showing an extracted result of detecting the nucleic acid standard substance 500_1 using the DNA microarray C from the characteristic diagram shown in FIG. 11-1.
- FIG. 11 is a characteristic diagram showing an extracted result of detecting a nucleic acid standard substance 500_1 using the DNA microarray D from the characteristic chart shown in FIG. 11-1.
- FIG. 11 is a characteristic diagram showing the result of detecting the nucleic acid standard substance 500_1 using the DNA microarray A from the characteristic diagram shown in FIG. 11-1.
- FIG. 11 is a characteristic diagram showing an extracted result of detecting the nucleic acid standard substance 500_1 using the DNA microarray E from the characteristic chart shown in FIG. 11-1.
- FIG. 11 is a characteristic diagram showing an extracted result of detecting the nucleic acid standard substance 500_1 using the DNA microarray F from the characteristic chart shown in FIG. 11-1. It is a characteristic view showing the result of detecting a nucleic acid standard substance 500_2 using six types of DNA microarrays A to F.
- FIG. 13 is a characteristic diagram showing the result of detecting the nucleic acid standard substance 500_2 using the DNA microarray A from the characteristic chart shown in FIG. 12-1.
- FIG. 12 is a characteristic diagram showing an extracted result of detecting the nucleic acid standard substance 500_1 using the DNA microarray E from the characteristic chart shown in FIG. 11-1.
- FIG. 11 is a characteristic diagram showing an extracted result of detecting the nucleic acid standard substance 500_1 using the DNA microarray F from the characteristic chart shown in FIG
- FIG. 13 is a characteristic diagram showing the result of detecting the nucleic acid standard substance 500_2 using the DNA microarray B from the characteristic chart shown in FIG. 12-1.
- FIG. 13 is a characteristic diagram showing an extracted result of detecting a nucleic acid standard substance 500_2 using the DNA microarray C from the characteristic chart shown in FIG. 12-1.
- FIG. 13 is a characteristic diagram showing an extracted result of detecting the nucleic acid standard substance 500_2 using the DNA microarray D from the characteristic chart shown in FIG. 12-1.
- FIG. 13 is a characteristic diagram showing an extracted result of detecting the nucleic acid standard substance 500_2 using the DNA microarray E from the characteristic chart shown in FIG. 12-1.
- FIG. 13 is a characteristic diagram showing an extracted result of detecting a nucleic acid standard substance 500_2 using the DNA microarray F from the characteristic chart shown in FIG. 12-1. It is a characteristic view showing the result of detecting nucleic acid standard substance 500_3 using six types of DNA microarrays A to F.
- FIG. 14 is a characteristic diagram showing the result of detecting the nucleic acid standard substance 500_3 using the DNA microarray A from the characteristic chart shown in FIG. 13-1.
- FIG. 14 is a characteristic diagram showing an extracted result of detecting the nucleic acid standard substance 500_3 using the DNA microarray B from the characteristic chart shown in FIG. 13-1.
- FIG. 14 is a characteristic diagram showing an extracted result of detecting the nucleic acid standard substance 500_3 using the DNA microarray C from the characteristic chart shown in FIG. 13-1.
- FIG. 14 is a characteristic diagram showing an extracted result of detecting the nucleic acid standard substance 500_3 using the DNA microarray D from the characteristic chart shown in FIG. 13-1.
- FIG. 14 is a characteristic diagram showing an extracted result of detecting the nucleic acid standard substance 500_3 using the DNA microarray E from the characteristic chart shown in FIG. 13-1.
- FIG. 14 is a characteristic diagram showing an extracted result of detecting the nucleic acid standard substance 500_3 using the DNA microarray F from the characteristic chart shown in FIG. 13-1.
- FIG. 14 is a characteristic diagram showing an extracted result of detecting the nucleic acid standard substance 500_4 using the DNA microarray A from the characteristic chart shown in FIG. 14-1.
- FIG. 14 is a characteristic diagram showing an extracted result of detecting the nucleic acid standard substance 500_4 using the DNA microarray B from the characteristic chart shown in FIG. 14-1.
- FIG. 14 is a characteristic diagram showing an extracted result of detecting the nucleic acid standard substance 500_4 using the DNA microarray C from the characteristic chart shown in FIG. 14-1.
- FIG. 14 is a characteristic diagram showing an extracted result of detecting the nucleic acid standard substance 500_4 using the DNA microarray A from the characteristic chart shown in FIG. 14-1.
- FIG. 14 is a characteristic diagram showing an extracted result of detecting the nucleic acid standard substance 500_4 using the DNA microarray D from the characteristic chart shown in FIG. 14-1.
- FIG. 14 is a characteristic diagram showing an extracted result of detecting the nucleic acid standard substance 500_4 using the DNA microarray E from the characteristic chart shown in FIG. 14-1.
- FIG. 14 is a characteristic diagram showing an extracted result of detecting a nucleic acid standard substance 500_4 using the DNA microarray F from the characteristic chart shown in FIG. 14-1. It is a characteristic view showing the result of detecting nucleic acid standard substance 500_5 using six types of DNA microarrays A to F.
- FIG. 14 is a characteristic diagram showing an extracted result of detecting the nucleic acid standard substance 500_4 using the DNA microarray D from the characteristic chart shown in FIG. 14-1.
- FIG. 14 is a characteristic diagram showing an extracted result of detecting the nucleic acid standard substance 500_4 using the DNA microarray E from the characteristic chart shown in FIG
- FIG. 15 is a characteristic diagram showing an extracted result of detecting the nucleic acid standard substance 500_5 using the DNA microarray A from the characteristic diagram shown in FIG. 15-1.
- FIG. 15 is a characteristic diagram showing an extracted result of detecting the nucleic acid standard substance 500_5 using the DNA microarray B from the characteristic diagram shown in FIG. 15-1.
- FIG. 15 is a characteristic diagram showing an extracted result of detecting a nucleic acid standard substance 500_5 using the DNA microarray C from the characteristic chart shown in FIG. 15-1.
- FIG. 15 is a characteristic diagram showing an extracted result of detecting the nucleic acid standard substance 500_5 using the DNA microarray D from the characteristic chart shown in FIG. 15-1.
- FIG. 15 is a characteristic diagram showing an extracted result of detecting the nucleic acid standard substance 500_5 using the DNA microarray A from the characteristic diagram shown in FIG. 15-1.
- FIG. 15 is a characteristic diagram showing an extracted result of detecting a nucleic acid standard substance 500_5 using the DNA microarray E from the characteristic chart shown in FIG. 15-1.
- FIG. 15 is a characteristic diagram showing the result of detecting the nucleic acid standard substance 500_5 using the DNA microarray F from the characteristic chart shown in FIG. 15-1.
- FIG. 6 is a characteristic diagram showing the results of detecting a nucleic acid standard substance 1000_1 using six types of DNA microarrays A to F.
- FIG. 16 is a characteristic diagram showing an extracted result of detecting the nucleic acid standard substance 1000_1 using the DNA microarray A from the characteristic diagram shown in FIG. 16-1.
- FIG. 16 is a characteristic diagram showing an extracted result of detecting the nucleic acid standard substance 1000_1 using the DNA microarray A from the characteristic diagram shown in FIG. 16-1.
- FIG. 16 is a characteristic diagram showing an extracted result of detecting the nucleic acid standard substance 1000_1 using the DNA microarray B from the characteristic diagram shown in FIG. 16-1.
- FIG. 16 is a characteristic diagram showing an extracted result of detecting the nucleic acid standard substance 1000_1 using the DNA microarray C from the characteristic chart shown in FIG. 16-1.
- FIG. 16 is a characteristic diagram showing an extracted result of detecting the nucleic acid standard substance 1000_1 using the DNA microarray D from the characteristic chart shown in FIG. 16-1.
- FIG. 16 is a characteristic diagram showing an extracted result of detecting the nucleic acid standard substance 1000_1 using the DNA microarray E from the characteristic chart shown in FIG. 16-1.
- FIG. 16 is a characteristic diagram showing an extracted result of detecting the nucleic acid standard substance 1000_1 using the DNA microarray F from the characteristic chart shown in FIG. 16-1.
- FIG. 10 is a characteristic diagram showing the results of detecting a nucleic acid standard substance 1000_2 using six types of DNA microarrays A to F.
- FIG. 18 is a characteristic diagram showing an extracted result of detecting the nucleic acid standard substance 1000_2 using the DNA microarray A from the characteristic diagram shown in FIG. 17-1.
- FIG. 18 is a characteristic diagram showing an extracted result of detecting the nucleic acid standard substance 1000_2 using the DNA microarray B from the characteristic diagram shown in FIG. 17-1.
- FIG. 18 is a characteristic diagram showing an extracted result of detecting the nucleic acid standard substance 1000_2 using the DNA microarray C from the characteristic diagram shown in FIG. 17-1.
- FIG. 18 is a characteristic diagram showing an extracted result of detecting the nucleic acid standard substance 1000_2 using the DNA microarray D from the characteristic chart shown in FIG. 17-1.
- FIG. 18 is a characteristic diagram showing an extracted result of detecting the nucleic acid standard substance 1000_2 using the DNA microarray E from the characteristic chart shown in FIG. 17-1.
- FIG. 18 is a characteristic diagram showing an extracted result of detecting the nucleic acid standard substance 1000_2 using the DNA microarray F from the characteristic diagram shown in FIG. 17-1.
- FIG. 19 is a characteristic diagram showing the result of detecting the nucleic acid standard substance 1000_3 using the DNA microarray A from the characteristic chart shown in FIG. 18-1.
- FIG. 19 is a characteristic diagram showing the result of detecting the nucleic acid standard substance 1000_3 using the DNA microarray B from the characteristic diagram shown in FIG. 18-1.
- FIG. 19 is a characteristic diagram showing an extracted result of detecting the nucleic acid standard substance 1000_3 using the DNA microarray C from the characteristic chart shown in FIG. 18-1.
- FIG. 19 is a characteristic diagram showing the result of detecting the nucleic acid standard substance 1000_3 using the DNA microarray A from the characteristic chart shown in FIG. 18-1.
- FIG. 19 is a characteristic diagram showing an extracted result of detecting the nucleic acid standard substance 1000_3 using the DNA microarray D from the characteristic chart shown in FIG. 18-1.
- FIG. 19 is a characteristic diagram showing an extracted result of detecting the nucleic acid standard substance 1000_3 using the DNA microarray E from the characteristic chart shown in FIG. 18-1.
- FIG. 19 is a characteristic diagram showing an extracted result of detecting the nucleic acid standard substance 1000_3 using the DNA microarray F from the characteristic chart shown in FIG. 18-1.
- It is a characteristic view showing the result of detecting nucleic acid standard substance 1000_4 using six types of DNA microarrays A to F.
- FIG. 19 is a characteristic diagram showing an extracted result of detecting the nucleic acid standard substance 1000_3 using the DNA microarray D from the characteristic chart shown in FIG. 18-1.
- FIG. 19 is a characteristic diagram showing an extracted result of detecting the nucleic acid standard substance 1000_3 using the DNA microarray E from the characteristic chart shown in
- FIG. 20 is a characteristic diagram showing the result of detecting the nucleic acid standard substance 1000_4 using the DNA microarray A from the characteristic chart shown in FIG. 19-1.
- FIG. 20 is a characteristic diagram showing an extracted result of detecting the nucleic acid standard substance 1000_4 using the DNA microarray B from the characteristic chart shown in FIG. 19-1.
- FIG. 20 is a characteristic diagram showing an extracted result of detecting the nucleic acid standard substance 1000_4 using the DNA microarray C from the characteristic chart shown in FIG. 19-1.
- FIG. 20 is a characteristic diagram showing the result of detecting the nucleic acid standard substance 1000_4 using the DNA microarray D from the characteristic chart shown in FIG. 19-1.
- FIG. 20 is a characteristic diagram showing the result of detecting the nucleic acid standard substance 1000_4 using the DNA microarray E from the characteristic chart shown in FIG. 19-1.
- FIG. 20 is a characteristic diagram showing the result of detecting the nucleic acid standard substance 1000_4 using the DNA microarray F from the characteristic chart shown in FIG. 19-1.
- FIG. 6 is a characteristic diagram showing the results of detecting a nucleic acid standard substance 1000_5 using six types of DNA microarrays A to F.
- FIG. 21 is a characteristic diagram showing the result of detecting the nucleic acid standard substance 1000_5 using the DNA microarray A from the characteristic chart shown in FIG. 20-1.
- FIG. 20 is a characteristic diagram showing the result of detecting the nucleic acid standard substance 1000_4 using the DNA microarray E from the characteristic chart shown in FIG. 19-1.
- FIG. 20 is a characteristic diagram showing the result of detecting the nucleic acid standard substance 1000_4 using the DNA microarray F from the characteristic chart shown in FIG
- FIG. 21 is a characteristic diagram showing an extracted result of detecting the nucleic acid standard substance 1000_5 using the DNA microarray B from the characteristic diagram shown in FIG. 20-1.
- FIG. 21 is a characteristic diagram showing an extracted result of detecting the nucleic acid standard substance 1000_5 using the DNA microarray C from the characteristic chart shown in FIG. 20-1.
- FIG. 21 is a characteristic diagram showing an extracted result of detecting the nucleic acid standard substance 1000_5 using the DNA microarray D from the characteristic chart shown in FIG. 20-1.
- FIG. 21 is a characteristic diagram showing an extracted result of detecting the nucleic acid standard substance 1000_5 using the DNA microarray E from the characteristic chart shown in FIG. 20-1.
- FIG. 21 is a characteristic diagram showing an extracted result of detecting the nucleic acid standard substance 1000_5 using the DNA microarray F from the characteristic chart shown in FIG. 20-1.
- nucleic acid refers to a nucleotide or polynucleotide in which a plurality of nucleosides are ester-linked in a straight chain via a phosphate group, including a short chain such as an oligonucleotide, in a single-stranded state. In addition, a state in which a double strand is formed with a complementary strand is also included.
- the type of nucleotide is usually DNA or RNA, but when some nucleotides are modified with a methyl group or the like, and oxygen is substituted with sulfur, artificial nucleic acids such as PNA and LNA are also included.
- the base sequence of the nucleic acid of the present invention is indicated by each sequence number
- the base sequence of the single-stranded DNA described is read as the corresponding base sequence.
- thymine (T) is read as uracil (U).
- the “probe” includes an oligonucleotide in which the nucleic acids defined above are arranged in a predetermined order, and may be referred to as a nucleic acid probe.
- the “probe” allows the oligonucleotide to hybridize to a nucleic acid construct having a predetermined sequence by complementary binding of nucleic acids.
- the “probe” can supplement the nucleic acid construct by hybridizing to the target nucleic acid construct. For example, when detecting the presence or absence of the target nucleic acid construct, It can be used in measuring the abundance of the nucleic acid construct.
- the target nucleic acid construct is not particularly limited, and is synthesized from mRNAs expressed in cells such as cells derived from mammals including humans, microorganisms including bacteria and fungi, plant cells, insect cells or the like. CDNA.
- Examples of the target nucleic acid construct include DNA and RNA extracted from foods and environmental samples, or nucleic acid fragments amplified using these DNA or RNA as a template.
- the target nucleic acid construct is meant to include a “nucleic acid standard substance” whose details will be described later.
- the “probe” is particularly referred to as a “nucleic acid standard substance detection probe”.
- the “probe” includes a detection probe for detecting a nucleic acid construct for the purpose described above.
- the “probe” detects hybridization with the linker molecule for fixing one end of the oligonucleotide to the substrate and the target nucleic acid construct. Therefore, it may contain a labeling substance such as a fluorescent substance, a quenching substance, or any other molecule or substance.
- the “probe” does not contain molecules and substances such as the above-described linker molecules, labeling substances, and quenching substances, and may consist of the above-described oligonucleotides.
- oligonucleotide means that the number of nucleotides is not limited at all, and includes molecules consisting of any number of nucleotides. Specifically, the oligonucleotide can be designed as a molecule having a length of 15 to 500 bases, for example.
- the oligonucleotide in the standard substance detection probe is designed to have a predetermined base sequence by a design method described in detail later.
- the oligonucleotide consists of at least 15 consecutive base sequences of any one of SEQ ID NOs: 1 to 40. That is, in the present invention, 40 types of probes for detecting a standard substance containing oligonucleotides comprising at least 15 consecutive base sequences of any one of SEQ ID NOS: 1 to 40 are provided.
- the base length of the oligonucleotide in the probe for detecting a nucleic acid standard substance can be, for example, 15 to 60 bases, preferably 20 to 60 bases, and preferably 40 to 60 bases. More preferably, the length is 50 to 60 bases, still more preferably 60 bases.
- the base length of the oligonucleotide in the nucleic acid standard substance detection probe can be designed together with the base length of the detection probe described above, for example.
- nucleic acid standard refers to the following 2. Means a nucleic acid construct having a base sequence without bias in GC content and having a non-natural base sequence that does not have a higher order structure, obtained according to the design method of In particular, in the prior application (Japanese Patent Application No. 2008-295338), as a “nucleic acid standard substance”, a nucleic acid comprising a base sequence of 10,000 bases or more, and a partial sequence of the nucleic acid having a length of 500 bases or 1000 bases A plurality of nucleic acids consisting of the base sequences are designed.
- nucleic acid standard in particular, a nucleic acid standard consisting of a base sequence of 500 bases shown in any of SEQ ID NOs: 41 to 45 and a base sequence of 1000 bases shown in any of SEQ ID NOs: 46 to 50
- the nucleic acid standard substance which consists of can be mentioned.
- nucleic acid standard substance may be one that has been modified to immobilize the above-described nucleic acid construct on the surface of a substrate, a bead or the like, or a tag for labeling. May be.
- the “nucleic acid standard substance” consisting of the base sequence shown in any of SEQ ID NOs: 41 to 50 is a combination of oligonucleotides having a constant GC content, and the entire nucleic acid base sequence as well as a partial region thereof. Is designed to be different from the base sequence of a naturally occurring nucleic acid so that the GC content remains constant and does not form a higher order structure.
- this nucleic acid standard when used, PCR amplification or the like is not affected by variations in GC content in the sequence or the presence or absence of higher-order structures, and the bases differ from those of natural nucleic acids. Since it has a sequence, even if DNA other than the target existing in nature is unexpectedly mixed in the quantification system of the calibration experiment, it has little influence on PCR amplification and the like. Due to this, when this nucleic acid standard is used, the target nucleic acid construct can be detected and quantified with high accuracy. Furthermore, this nucleic acid standard does not have 20 or more consecutive bases that match the base sequence of a naturally occurring nucleic acid. For this reason, the above-described probe for detecting a nucleic acid standard substance is prevented from simultaneously hybridizing a naturally occurring sequence, even if it hybridizes to any part of these nucleic acid standard substances.
- nucleic acid standard In order to prepare the nucleic acid standard defined in (1), a base sequence is designed according to the procedures of the following steps (1) to (6), and DNA synthesis or RNA synthesis is performed according to the obtained base sequence.
- such a nucleic acid standard design method is similar to an existing base sequence registered in a database from a large number of DNAs designed by combining a plurality of DNAs having a certain length and a certain CG content. After deleting them and combining them, a sequence similar to a known base sequence existing in nature is further deleted from the binding sequence, and the sequence of a certain length selected does not have a higher-order structure. That is, the corresponding sequence that is supposed to promote the formation of the higher order structure is deleted, and it is further confirmed that there is no repetitive sequence in the nucleic acid sequence.
- uracil in the RNA sequence is read as thymine.
- the designed nucleic acid standard substance can be suitably used as a standard DNA sample used in a DNA quantification apparatus and a standard RNA sample used in an RNA quantification apparatus.
- a standard RNA sample between different RNA quantification devices and comparing them, performance comparison such as sensitivity and accuracy can be performed, and calibration of each quantification device is also possible.
- examples of the DNA quantification apparatus include a quantitative PCR apparatus and a DNA microarray apparatus.
- examples of the RNA quantification apparatus include a quantitative PCR apparatus and a DNA microarray apparatus that also target RNA molecules.
- a standard DNA sample and a standard RNA sample it can be used as a solution in which a predetermined amount of a nucleic acid standard substance is dissolved in sterile water or a buffer solution.
- the sample can also be used by mixing a plurality of types of nucleic acid standards.
- nucleic acid standard substance can be used as a reference for determining that there is no problem in the quantification operation itself.
- the above-described nucleic acid standard substance can be added as an internal standard substance to standardize the measurement value.
- the DNA microarray apparatus when the above-mentioned nucleic acid standard substance is immobilized on the same or different substrate or bead surface as the target test nucleic acid sample in a single strand state, various analysis of the test nucleic acid sample is performed. As a control sample. Even if the nucleic acid corresponding to the base sequence at any position of the full length is selected, there is almost no possibility of detecting a naturally occurring sequence even if it is immobilized at a high density on the substrate surface. It can also be used for background correction with a chip immobilized on a substrate or for quality control of a DNA microarray.
- a base sequence is designed according to the following steps 1 to 3, and DNA synthesis or RNA synthesis is performed according to the obtained base sequence.
- a plurality of probe candidate sequences are designed so as to cover the entire nucleic acid standard. Specifically, for example, first, the base length of the probe candidate sequence to be designed is fixed to a predetermined length. Next, the predetermined length is assigned to the base sequence of the nucleic acid standard substance so as to include one end thereof to be the first probe candidate sequence, and then the predetermined sequence is shifted by one base to the other end. Assign the length of to other probe candidate sequences. The predetermined length is assigned so as to include the other end of the base sequence of the nucleic acid standard substance, and this is used as the last probe candidate sequence. That is, when the base sequence of the nucleic acid standard substance to be detected is X base length and the probe candidate sequence to be designed is n base length, (X ⁇ n + 1) probe candidate sequences are designed.
- the nucleic acid standard substance to be detected may be divided into a plurality of regions, and a plurality of probe candidate sequences may be designed according to the above-described method for each divided region.
- the nucleic acid standard substance to be detected can be divided into a 3 ′ terminal region and a 5 ′ terminal region, and probe candidate sequences can be designed for each of the 3 ′ terminal region and the 5 ′ terminal region. .
- Step 2 the plurality of probe candidate sequences designed in step 1 are narrowed down based on the cross-hybridization rate with the off target.
- step 2 first, for each probe candidate sequence, an off-target is searched from a known database by applying a homology search program.
- the homology search program is not particularly limited, but known programs such as SSEARCH, FASTA, BLAST, and PSI-BLAST can be applied.
- publicly known databases are not particularly limited, but databases such as Genbank (NCBI), DDBJ (Japan DNA Data Bank), EMBL (EBI), Unigene, and TIGR Gene Indeces that store nucleic acid sequences may be used. it can.
- the database is searched using the base sequence of the probe candidate sequence as a query sequence.
- an entry including a base sequence having a region having a high homology value with respect to the base sequence of the probe candidate sequence is specified.
- the entry may include mRNAs actually expressed in cells, genes based on genomic analysis, information on splicing variants, RNA information such as snRNA, miRNA, rRNA, Mt_tRNA, etc. Contains sequence information.
- 100 types of entries can be specified as the off target in descending order of homology.
- the information regarding the off target only the base sequence included in the specified entry may be used. Therefore, the base sequence included in the specified entry may be acquired.
- a temperature (denoted as T 99 ) at which the ratio (binding rate) at which each probe candidate sequence hybridizes to the nucleic acid standard substance to be detected reaches a predetermined value (for example, 99%) is calculated.
- a predetermined value for example, 99%
- the left side f is a coupling rate.
- .DELTA.G T is the binding free energy change at a temperature T
- C P is the concentration of probe candidate sequences
- R is the gas constant
- T is the absolute temperature.
- the C P can be assigned, for example, 0.5 [mu] M
- the f can be calculated value of T as 99.
- the above formula, .DELTA.G T is, Nearest Neighbor method for nucleotide sequence of the nucleic acid calibrator to be detected (PNAS, 1998, 95: 1460-1465 ) can be calculated based on.
- hybrid-min can be used as software for calculating ⁇ G by Nearest Neighbor method (Bioinformatics, Volume II. Structure, Functions and Applications (Method in Molecular Biology) 2008, chapter 1, pages 3-31). .
- the temperature (T 99 ) at which each probe candidate sequence identified in Step 1 above and the nucleic acid standard substance hybridize with a binding rate of 99%, for example, can be calculated.
- the binding rate at T 99 calculated as described above is calculated according to the above equation.
- ⁇ G T can be calculated based on the Nearest Neighbor method (PNAS, 1998, 95: 1460-1465) for the off-target base sequence.
- PNAS Nearest Neighbor method
- this step 2 from the plurality of probe candidate sequences designed in step 1 above, those for which an off target whose binding rate exceeds a threshold (for example, 0.1%) are specified are excluded. That is, according to this step 2, the plurality of probe candidate sequences designed in the above step 1 can be narrowed down to only probe candidate sequences that generate cross-hybridization with an off target with a very low probability.
- a threshold for example, 0.15%
- Step 3 Tm values are calculated for the probe candidate sequences narrowed down in Step 2.
- the probe for nucleic acid standard substance detection can hybridize well under the same temperature and salt concentration. It is preferable to approximate.
- probe candidate sequences having Tm values close to each other can be specified.
- the desired Tm value can be appropriately set within a range of 60 ° C. to 90 ° C., for example.
- the dimer formation rate may be calculated for the probe candidate sequences narrowed down in step 2 by a known program such as Hybrid-min.
- the formation ratio of secondary structure in the molecule may be calculated for the probe candidate sequences selected in step 2 by a known program such as Hybrid-ss. Thresholds may be set in advance for the dimer formation ratio and secondary structure formation ratio, and those exceeding the threshold may be excluded from the probe candidate sequences.
- Step 4 the probe candidate sequences narrowed down to the above step 3 are actually synthesized as oligonucleotides and hybridized with a separately synthesized nucleic acid standard, and the performance as a probe is evaluated.
- DNA microarrays include DNA microarray technology provided by Agilent Technologies Inc., Toray Industries, Inc., Mitsubishi Rayon Co., Ltd., DNA Chip Laboratories, Inc., Roche Nimblegen Co., Ltd., and Kurashiki Spinning Co., Ltd. (Kurabo Co., Ltd.). Can be used.
- a protocol can be obtained from each company, and those skilled in the art can implement suitably based on these protocols.
- a sample solution (including a gene serving as a positive control) in which a nucleic acid standard substance to be detected is diluted stepwise is prepared, and an oligonucleotide consisting of a candidate probe sequence to be evaluated.
- the sample solution may contain a nucleic acid fragment amplified by PCR or RT-PCR using a synthesized nucleic acid standard as a template, or may contain a synthesized nucleic acid standard as it is.
- marker at the time of detecting hybridization it may differ with various platforms, and you may use the same label
- the signal value derived from the oligonucleotide consisting of the probe candidate sequence to be evaluated is normalized, and it is verified whether the normalized signal value changes depending on the concentration of the nucleic acid standard.
- the normalization method is not particularly limited, and examples thereof include a process of subtracting the background value from the raw signal value in the same DNA microarray and dividing the result by the median value of a plurality of types of positive control-derived signals.
- the background value is a signal when a region where the oligonucleotide is not fixed is measured.
- the positive control is not particularly limited, and examples thereof include 10 types of genes such as ACTB gene, B2M gene, GAPDH gene, GUSB gene, HPRT1 gene, PGK1 gene, PPIA gene, RPLP0 gene, TBP gene, and YWHAZ gene. be able to.
- this step 4 it is possible to select a plurality of probe candidate sequences further narrowed down in step 3 that can generate a signal depending on the concentration of the nucleic acid standard based on the result of the hybridization experiment. it can.
- this Step 4 it is preferable to select a probe candidate sequence capable of generating a signal depending on the concentration of the nucleic acid standard substance in all of the plurality of platforms related to the DNA microarray.
- a probe for detecting a nucleic acid substance was designed for a nucleic acid standard substance having the base sequence shown in any of SEQ ID NOs: 41 to 50 by executing the above steps 1 to 4.
- these 10 kinds of nucleic acid standards were divided into 5 ′ terminal region and 3 ′ terminal region, respectively, and two probes for detecting nucleic acid standard materials were designed for each of the 5 ′ terminal region and the 3 ′ terminal region.
- the nucleic acid standard substance having a length of 500 bases shown in SEQ ID NOs: 41 to 45 the 5 ′ end region from the 5 ′ end to the 300 th end was the 5 ′ end region, and the 301 th to 3 ′ end was the 3 ′ end region.
- SSARCH was used as a homology search program with default settings, and an Ensemble (rel.49) human cDNA sequence database was used as the database.
- 10 types of nucleic acid standard substances consisting of the base sequences shown in SEQ ID NOs: 41 to 50 are respectively “500_1”, “500_2”, “500_3”, “500_4”, “500_5”, “1000_1”. ”,“ 1000_2 ”,“ 1000_3 ”,“ 1000_4 ”, and“ 1000_5 ”.
- four types of nucleic acid standard substance detection probes (40 types in total) could be designed for each of the 10 types of nucleic acid standard substances having the base sequences shown in SEQ ID NOs: 41 to 50.
- the probe for detecting a nucleic acid standard substance designed in (1) can be widely used in nucleic acid detection systems and nucleic acid quantification systems based on hybridization between probes such as DNA microarrays and DNA bead arrays and nucleic acids to be detected.
- the probe for detecting a nucleic acid standard substance is fixed at a predetermined position on the surface of the substrate.
- a probe for detecting a nucleic acid standard substance is immobilized on a predetermined bead surface.
- nucleic acid standard substance detection probe In such a system, one type of nucleic acid standard substance detection probe may be used, but a plurality of types of nucleic acid standard substance detection probes may be used. All or part of the 40 types of nucleic acid standard substance detection probes (SEQ ID NOs: 1 to 40) designed as described above can be used. In particular, the above-described 40 types of nucleic acid standard substance detection probes are excellent in detection sensitivity on various platforms, and it has been demonstrated that nucleic acid standard substances can be quantified with high accuracy. It is.
- probe names displayed in the oligo_id column in Table 1 are excluded: 500_1_1 (SEQ ID NO: 1), 500_5_3 (SEQ ID NO: 19), 1000_1_3 (SEQ ID NO: 23), 1000_5_1 (SEQ ID NO: 37), and 1000_5_3 (SEQ ID NO: 39). It has been demonstrated that other nucleic acid standard substance detection probes can quantitate nucleic acid standard substances with particularly high sensitivity (see Examples described later).
- the probe for detecting a nucleic acid standard substance can detect with high sensitivity whether the nucleic acid to be detected is DNA or RNA. If the nucleic acid to be detected is a DNA microarray, a nucleic acid standard detection probe may be prepared as a DNA molecule. If the nucleic acid to be detected is RNA, a nucleic acid standard detection probe is prepared as an RNA molecule. do it.
- Example 1 DNA microarray
- Six DNA microarrays of Agilent Technology Co., Ltd., Toray Co., Ltd., Mitsubishi Rayon Co., Ltd., DNA Chip Laboratories Co., Ltd., Roche Nimblegen Co., Ltd. and Kurashiki Spin Co., Ltd. (Kurabo Co., Ltd.) was used for gene expression analysis according to the standard protocol of each company.
- DNA microarrays comprising 40 nucleic acid standard substance detection probes having 40 types of oligonucleotides having the base sequences shown in SEQ ID NOs: 1 to 40 were produced according to the specifications specific to each company.
- a to F six types of DNA microarrays with different specifications manufactured by the above six companies will be denoted as A to F in random order.
- each DNA microarray was provided with a probe that specifically hybridizes to 10 types of genes as a positive control for use in signal normalization.
- the 10 types of positive control genes were ACTB gene, B2M gene, GAPDH gene, GUSB gene, HPRT1 gene, PGK1 gene, PPIA gene, RPLP0 gene, TBP gene and YWHAZ gene.
- Human Reference RNA 50 ng / uL was used to prevent adsorption to the inner surface of the tube.
- Human Reference RNA (50 ng / uL) was prepared from commercially available HURR (pool) (1241.78 ng / uL) (24.2 ⁇ uL HURR mixed with 575.8 uL D.W.).
- a standard amount of 6 types (S-1, S-2, S-3, S-4, S-5, S-6) is obtained by separating and mixing a predetermined amount of these 6 types of liquid mixture.
- a substance stock solution was prepared.
- Table 3 shows the concentrations of 10 kinds of nucleic acid standard substances contained in the standard substance stock solution.
- DNA Microarray Measurement Using the samples prepared as described above, signals in 40 types of nucleic acid standard substance detection probes were measured according to the protocols of each company. The measured signals were normalized and compared by the following method. That is, the signal value in the nucleic acid standard substance detection probe was normalized by subtracting the background value from the signal value in the nucleic acid standard substance detection probe and dividing it by the median value of the signal value in the 10 positive controls.
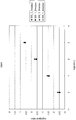
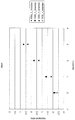
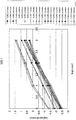
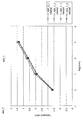
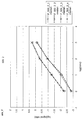
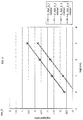
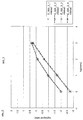
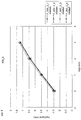
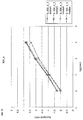
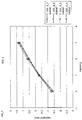
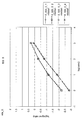
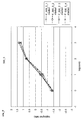
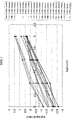
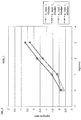
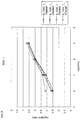
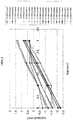
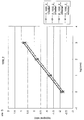
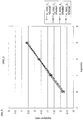
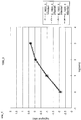
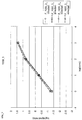
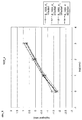
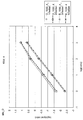
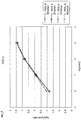
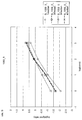
- FIG. 1 is a graph showing the detectability of four types of nucleic acid standard substance detection probes 500_1_1, 500_1_2, 500_1_3, and 500_1_4 prepared for the nucleic acid standard substance 500_1.
- the horizontal axis represents the logarithm of the concentration of the nucleic acid standard substance
- the vertical axis represents the logarithm of the median value of the signal value after normalization.
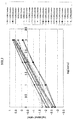
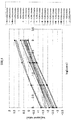
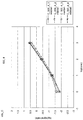
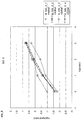
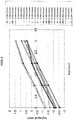
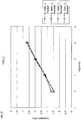
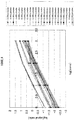
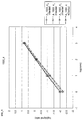
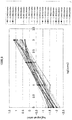
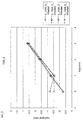
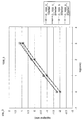
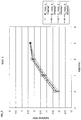
- FIG. 11A is a graph showing the detectability of the four types of nucleic acid standard substance detection probes 500_1_1, 500_1_2, 500_1_3, and 500_1_4 prepared for the nucleic acid standard substance 500_1 in all six types of DNA microarrays A to F.
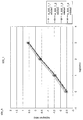
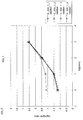
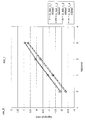
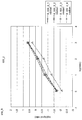
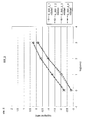
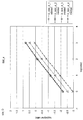
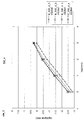
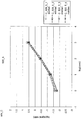
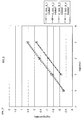
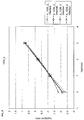
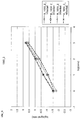
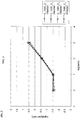
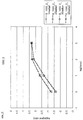
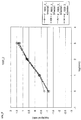
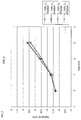
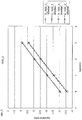
- the results relating to DNA microarrays A to F were extracted from the graph shown in FIG. 11A and divided into FIGS. 11-2 to 11-7.
- the horizontal axis represents the logarithm of the concentration of the nucleic acid standard substance
- the vertical axis represents the logarithm of the median value of the signal value after normalization.
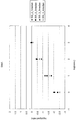
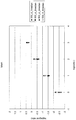
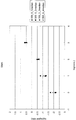
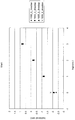
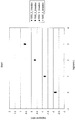
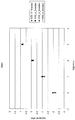
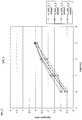
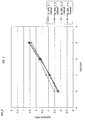
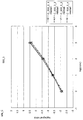
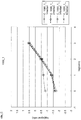
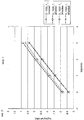
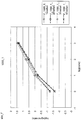
- the detection results of the nucleic acid standard substances “500_2”, “500 — 3”, “500 — 4”, “500 — 5”, “1000 — 1”, “1000 — 2”, “1000 — 3”, “1000 — 4” and “1000 — 5” are shown in FIG. -1, 13-1, 14-1, 15-1, 16-1, 17-1, 18-1, 19-1 and 20-1. Also for these, similarly to FIGS. 11-1 to 11-7, the results regarding the DNA microarrays A to F are extracted and divided.
- each of the 40 types of nucleic acid standard substance detection probes prepared in this example can detect the nucleic acid standard substance to be detected with high accuracy. Also, as shown in FIGS. 1 to 20, the signal values resulting from these 40 types of nucleic acid standard substance detection probes and the concentration of the nucleic acid standard substance show a linear relationship. Therefore, by using these 40 kinds of nucleic acid standard substance detection probes and a dilution series of nucleic acid standard substances, for example, when quantifying mRNA expressed in cells, the nucleic acid to be detected contained in the sample is greatly reduced. Can be accurately quantified.
Landscapes
- Chemical & Material Sciences (AREA)
- Organic Chemistry (AREA)
- Life Sciences & Earth Sciences (AREA)
- Zoology (AREA)
- Wood Science & Technology (AREA)
- Proteomics, Peptides & Aminoacids (AREA)
- Health & Medical Sciences (AREA)
- Engineering & Computer Science (AREA)
- Microbiology (AREA)
- Immunology (AREA)
- Physics & Mathematics (AREA)
- Molecular Biology (AREA)
- Biotechnology (AREA)
- Biophysics (AREA)
- Analytical Chemistry (AREA)
- Biochemistry (AREA)
- Bioinformatics & Cheminformatics (AREA)
- General Engineering & Computer Science (AREA)
- General Health & Medical Sciences (AREA)
- Genetics & Genomics (AREA)
- Measuring Or Testing Involving Enzymes Or Micro-Organisms (AREA)
Applications Claiming Priority (2)
| Application Number | Priority Date | Filing Date | Title |
|---|---|---|---|
| JP2010-113343 | 2010-05-17 | ||
| JP2010113343A JP2011239708A (ja) | 2010-05-17 | 2010-05-17 | 核酸標準物質検出用プローブの設計方法、核酸標準物質検出用プローブ及び当該核酸標準物質検出用プローブを有する核酸検出系 |
Publications (1)
| Publication Number | Publication Date |
|---|---|
| WO2011145614A1 true WO2011145614A1 (ja) | 2011-11-24 |
Family
ID=44991716
Family Applications (1)
| Application Number | Title | Priority Date | Filing Date |
|---|---|---|---|
| PCT/JP2011/061310 Ceased WO2011145614A1 (ja) | 2010-05-17 | 2011-05-17 | 核酸標準物質検出用プローブの設計方法、核酸標準物質検出用プローブ及び当該核酸標準物質検出用プローブを有する核酸検出系 |
Country Status (2)
| Country | Link |
|---|---|
| JP (1) | JP2011239708A (enExample) |
| WO (1) | WO2011145614A1 (enExample) |
Cited By (2)
| Publication number | Priority date | Publication date | Assignee | Title |
|---|---|---|---|---|
| WO2016084848A1 (ja) * | 2014-11-26 | 2016-06-02 | 東レ株式会社 | 小型rnaの発現量の補正方法及び装置 |
| JP2018529371A (ja) * | 2015-10-07 | 2018-10-11 | イラミーナ インコーポレーテッド | シークエンシング技術におけるオフターゲット補足の低減 |
Families Citing this family (1)
| Publication number | Priority date | Publication date | Assignee | Title |
|---|---|---|---|---|
| WO2015066634A2 (en) * | 2013-11-04 | 2015-05-07 | Dow Agrosciences Llc | Optimal soybean loci |
Citations (4)
| Publication number | Priority date | Publication date | Assignee | Title |
|---|---|---|---|---|
| EP1690947A2 (en) * | 2005-02-14 | 2006-08-16 | Canon Kabushiki Kaisha | Base sequence for control probe and method of designing the same |
| JP2007060966A (ja) * | 2005-08-30 | 2007-03-15 | National Institute Of Advanced Industrial & Technology | Dna標準物質 |
| JP2009268390A (ja) * | 2008-05-02 | 2009-11-19 | Mitsubishi Rayon Co Ltd | 高感度核酸マイクロアレイ及びその製造方法 |
| JP2010119331A (ja) * | 2008-11-19 | 2010-06-03 | National Institute Of Advanced Industrial Science & Technology | 核酸標準物質 |
Family Cites Families (1)
| Publication number | Priority date | Publication date | Assignee | Title |
|---|---|---|---|---|
| JP4772816B2 (ja) * | 2008-03-21 | 2011-09-14 | 株式会社東芝 | マイクロアレイおよびネガティブコントロールプローブの設計方法 |
-
2010
- 2010-05-17 JP JP2010113343A patent/JP2011239708A/ja active Pending
-
2011
- 2011-05-17 WO PCT/JP2011/061310 patent/WO2011145614A1/ja not_active Ceased
Patent Citations (4)
| Publication number | Priority date | Publication date | Assignee | Title |
|---|---|---|---|---|
| EP1690947A2 (en) * | 2005-02-14 | 2006-08-16 | Canon Kabushiki Kaisha | Base sequence for control probe and method of designing the same |
| JP2007060966A (ja) * | 2005-08-30 | 2007-03-15 | National Institute Of Advanced Industrial & Technology | Dna標準物質 |
| JP2009268390A (ja) * | 2008-05-02 | 2009-11-19 | Mitsubishi Rayon Co Ltd | 高感度核酸マイクロアレイ及びその製造方法 |
| JP2010119331A (ja) * | 2008-11-19 | 2010-06-03 | National Institute Of Advanced Industrial Science & Technology | 核酸標準物質 |
Non-Patent Citations (1)
| Title |
|---|
| HWANG BH ET AL.: "Quantitative oligonucleotide microarray data analysis with an artificial standard probe strategy.", BIOSENSORS AND BIOELECTRONICS, vol. 23, no. 11, 2008, pages 1738 - 1744, XP022625065, DOI: doi:10.1016/j.bios.2008.01.024 * |
Cited By (3)
| Publication number | Priority date | Publication date | Assignee | Title |
|---|---|---|---|---|
| WO2016084848A1 (ja) * | 2014-11-26 | 2016-06-02 | 東レ株式会社 | 小型rnaの発現量の補正方法及び装置 |
| US10622093B2 (en) | 2014-11-26 | 2020-04-14 | Toray Industries, Inc. | Method and device for correcting level of expression of small RNA |
| JP2018529371A (ja) * | 2015-10-07 | 2018-10-11 | イラミーナ インコーポレーテッド | シークエンシング技術におけるオフターゲット補足の低減 |
Also Published As
| Publication number | Publication date |
|---|---|
| JP2011239708A (ja) | 2011-12-01 |
Similar Documents
| Publication | Publication Date | Title |
|---|---|---|
| San Segundo-Val et al. | Introduction to the gene expression analysis | |
| AU2017200433B2 (en) | Multivariate diagnostic assays and methods for using same | |
| US20150184233A1 (en) | Quantification of nucleic acids and proteins using oligonucleotide mass tags | |
| JP7051677B2 (ja) | 次世代シークエンシングのための高分子量dnaサンプル追跡タグ | |
| US10385476B2 (en) | Methods and compositions for the selection and optimization of oligonucleotide tag sequences | |
| JP2009504153A (ja) | オリゴヌクレオチド設計および/または核酸検出の方法および/または装置 | |
| JP6571526B2 (ja) | 鎖を除外することによりマイクロアレイの性能を向上する方法 | |
| CN106591425A (zh) | 基于连接反应的多重靶向检测核酸指标的方法 | |
| JP5229895B2 (ja) | 核酸標準物質 | |
| WO2011145614A1 (ja) | 核酸標準物質検出用プローブの設計方法、核酸標準物質検出用プローブ及び当該核酸標準物質検出用プローブを有する核酸検出系 | |
| US20040048297A1 (en) | Nucleic acid detection assay control genes | |
| CN101457254B (zh) | 用于肝癌预后的基因芯片和试剂盒 | |
| US20220136043A1 (en) | Systems and methods for separating decoded arrays | |
| US10927405B2 (en) | Molecular tag attachment and transfer | |
| CN115515680A (zh) | 用于评估神经递质转运蛋白抑制剂的功效的组合物和方法 | |
| WO2023021978A1 (ja) | 自己免疫疾患を検査する方法 | |
| EP3455376B1 (en) | Method for producing a plurality of dna probes and method for analyzing genomic dna using the dna probes | |
| Song et al. | Unexpected Mechanism and Inhibition Effect for Nonspecific Amplification Involving Dynamic Binding of Primers with Background DNA | |
| CN107018668B (zh) | 一种针对东亚人群全基因组范围内的非编码区的SNPs的DNA芯片 | |
| JP7444488B2 (ja) | 混入検出法 | |
| US20220356513A1 (en) | Synthetic polynucleotides and method of use thereof in genetic analysis | |
| Wang et al. | Precise and highly sensitive detection of single nucleotide variations with a PfAgo and individualized probe combined fluorescent assay | |
| CN110582577A (zh) | 文库定量和鉴定 | |
| Ogundolie et al. | Microbiome characterization and identification: key emphasis on molecular approaches | |
| WO2021016403A1 (en) | Method, apparatus and system to detect indels and tandem duplications using single cell dna sequencing |
Legal Events
| Date | Code | Title | Description |
|---|---|---|---|
| 121 | Ep: the epo has been informed by wipo that ep was designated in this application |
Ref document number: 11783548 Country of ref document: EP Kind code of ref document: A1 |
|
| NENP | Non-entry into the national phase |
Ref country code: DE |
|
| 122 | Ep: pct application non-entry in european phase |
Ref document number: 11783548 Country of ref document: EP Kind code of ref document: A1 |