WO2011122534A1 - 生体成分分析方法及び生体成分分析装置 - Google Patents
生体成分分析方法及び生体成分分析装置 Download PDFInfo
- Publication number
- WO2011122534A1 WO2011122534A1 PCT/JP2011/057558 JP2011057558W WO2011122534A1 WO 2011122534 A1 WO2011122534 A1 WO 2011122534A1 JP 2011057558 W JP2011057558 W JP 2011057558W WO 2011122534 A1 WO2011122534 A1 WO 2011122534A1
- Authority
- WO
- WIPO (PCT)
- Prior art keywords
- measurement
- component
- value
- collected
- skin
- Prior art date
- Legal status (The legal status is an assumption and is not a legal conclusion. Google has not performed a legal analysis and makes no representation as to the accuracy of the status listed.)
- Ceased
Links
Images











Classifications
-
- A—HUMAN NECESSITIES
- A61—MEDICAL OR VETERINARY SCIENCE; HYGIENE
- A61B—DIAGNOSIS; SURGERY; IDENTIFICATION
- A61B5/00—Measuring for diagnostic purposes; Identification of persons
- A61B5/145—Measuring characteristics of blood in vivo, e.g. gas concentration or pH-value ; Measuring characteristics of body fluids or tissues, e.g. interstitial fluid or cerebral tissue
- A61B5/14532—Measuring characteristics of blood in vivo, e.g. gas concentration or pH-value ; Measuring characteristics of body fluids or tissues, e.g. interstitial fluid or cerebral tissue for measuring glucose, e.g. by tissue impedance measurement
-
- A—HUMAN NECESSITIES
- A61—MEDICAL OR VETERINARY SCIENCE; HYGIENE
- A61B—DIAGNOSIS; SURGERY; IDENTIFICATION
- A61B5/00—Measuring for diagnostic purposes; Identification of persons
- A61B5/145—Measuring characteristics of blood in vivo, e.g. gas concentration or pH-value ; Measuring characteristics of body fluids or tissues, e.g. interstitial fluid or cerebral tissue
- A61B5/14507—Measuring characteristics of blood in vivo, e.g. gas concentration or pH-value ; Measuring characteristics of body fluids or tissues, e.g. interstitial fluid or cerebral tissue specially adapted for measuring characteristics of body fluids other than blood
- A61B5/1451—Measuring characteristics of blood in vivo, e.g. gas concentration or pH-value ; Measuring characteristics of body fluids or tissues, e.g. interstitial fluid or cerebral tissue specially adapted for measuring characteristics of body fluids other than blood for interstitial fluid
- A61B5/14514—Measuring characteristics of blood in vivo, e.g. gas concentration or pH-value ; Measuring characteristics of body fluids or tissues, e.g. interstitial fluid or cerebral tissue specially adapted for measuring characteristics of body fluids other than blood for interstitial fluid using means for aiding extraction of interstitial fluid, e.g. microneedles or suction
-
- A—HUMAN NECESSITIES
- A61—MEDICAL OR VETERINARY SCIENCE; HYGIENE
- A61B—DIAGNOSIS; SURGERY; IDENTIFICATION
- A61B5/00—Measuring for diagnostic purposes; Identification of persons
- A61B5/15—Devices for taking samples of blood
- A61B5/150007—Details
- A61B5/150015—Source of blood
- A61B5/150022—Source of blood for capillary blood or interstitial fluid
-
- A—HUMAN NECESSITIES
- A61—MEDICAL OR VETERINARY SCIENCE; HYGIENE
- A61B—DIAGNOSIS; SURGERY; IDENTIFICATION
- A61B5/00—Measuring for diagnostic purposes; Identification of persons
- A61B5/15—Devices for taking samples of blood
- A61B5/150007—Details
- A61B5/150358—Strips for collecting blood, e.g. absorbent
-
- A—HUMAN NECESSITIES
- A61—MEDICAL OR VETERINARY SCIENCE; HYGIENE
- A61B—DIAGNOSIS; SURGERY; IDENTIFICATION
- A61B5/00—Measuring for diagnostic purposes; Identification of persons
- A61B5/15—Devices for taking samples of blood
- A61B5/150007—Details
- A61B5/150374—Details of piercing elements or protective means for preventing accidental injuries by such piercing elements
- A61B5/150381—Design of piercing elements
- A61B5/150412—Pointed piercing elements, e.g. needles, lancets for piercing the skin
-
- A—HUMAN NECESSITIES
- A61—MEDICAL OR VETERINARY SCIENCE; HYGIENE
- A61B—DIAGNOSIS; SURGERY; IDENTIFICATION
- A61B5/00—Measuring for diagnostic purposes; Identification of persons
- A61B5/15—Devices for taking samples of blood
- A61B5/150007—Details
- A61B5/150374—Details of piercing elements or protective means for preventing accidental injuries by such piercing elements
- A61B5/150381—Design of piercing elements
- A61B5/150503—Single-ended needles
- A61B5/150519—Details of construction of hub, i.e. element used to attach the single-ended needle to a piercing device or sampling device
-
- A—HUMAN NECESSITIES
- A61—MEDICAL OR VETERINARY SCIENCE; HYGIENE
- A61B—DIAGNOSIS; SURGERY; IDENTIFICATION
- A61B5/00—Measuring for diagnostic purposes; Identification of persons
- A61B5/15—Devices for taking samples of blood
- A61B5/150977—Arrays of piercing elements for simultaneous piercing
- A61B5/150984—Microneedles or microblades
-
- A—HUMAN NECESSITIES
- A61—MEDICAL OR VETERINARY SCIENCE; HYGIENE
- A61B—DIAGNOSIS; SURGERY; IDENTIFICATION
- A61B5/00—Measuring for diagnostic purposes; Identification of persons
- A61B5/15—Devices for taking samples of blood
- A61B5/151—Devices specially adapted for taking samples of capillary blood, e.g. by lancets, needles or blades
- A61B5/15101—Details
- A61B5/15103—Piercing procedure
- A61B5/15107—Piercing being assisted by a triggering mechanism
- A61B5/15113—Manually triggered, i.e. the triggering requires a deliberate action by the user such as pressing a drive button
-
- A—HUMAN NECESSITIES
- A61—MEDICAL OR VETERINARY SCIENCE; HYGIENE
- A61B—DIAGNOSIS; SURGERY; IDENTIFICATION
- A61B5/00—Measuring for diagnostic purposes; Identification of persons
- A61B5/15—Devices for taking samples of blood
- A61B5/151—Devices specially adapted for taking samples of capillary blood, e.g. by lancets, needles or blades
- A61B5/15101—Details
- A61B5/15115—Driving means for propelling the piercing element to pierce the skin, e.g. comprising mechanisms based on shape memory alloys, magnetism, solenoids, piezoelectric effect, biased elements, resilient elements, vacuum or compressed fluids
- A61B5/15117—Driving means for propelling the piercing element to pierce the skin, e.g. comprising mechanisms based on shape memory alloys, magnetism, solenoids, piezoelectric effect, biased elements, resilient elements, vacuum or compressed fluids comprising biased elements, resilient elements or a spring, e.g. a helical spring, leaf spring, or elastic strap
-
- A—HUMAN NECESSITIES
- A61—MEDICAL OR VETERINARY SCIENCE; HYGIENE
- A61B—DIAGNOSIS; SURGERY; IDENTIFICATION
- A61B5/00—Measuring for diagnostic purposes; Identification of persons
- A61B5/15—Devices for taking samples of blood
- A61B5/151—Devices specially adapted for taking samples of capillary blood, e.g. by lancets, needles or blades
- A61B5/15186—Devices loaded with a single lancet, i.e. a single lancet with or without a casing is loaded into a reusable drive device and then discarded after use; drive devices reloadable for multiple use
-
- A—HUMAN NECESSITIES
- A61—MEDICAL OR VETERINARY SCIENCE; HYGIENE
- A61B—DIAGNOSIS; SURGERY; IDENTIFICATION
- A61B5/00—Measuring for diagnostic purposes; Identification of persons
- A61B5/15—Devices for taking samples of blood
- A61B5/151—Devices specially adapted for taking samples of capillary blood, e.g. by lancets, needles or blades
- A61B5/15186—Devices loaded with a single lancet, i.e. a single lancet with or without a casing is loaded into a reusable drive device and then discarded after use; drive devices reloadable for multiple use
- A61B5/15188—Constructional features of reusable driving devices
- A61B5/1519—Constructional features of reusable driving devices comprising driving means, e.g. a spring, for propelling the piercing unit
-
- A—HUMAN NECESSITIES
- A61—MEDICAL OR VETERINARY SCIENCE; HYGIENE
- A61B—DIAGNOSIS; SURGERY; IDENTIFICATION
- A61B5/00—Measuring for diagnostic purposes; Identification of persons
- A61B5/42—Detecting, measuring or recording for evaluating the gastrointestinal, the endocrine or the exocrine systems
- A61B5/4261—Evaluating exocrine secretion production
- A61B5/4266—Evaluating exocrine secretion production sweat secretion
-
- A—HUMAN NECESSITIES
- A61—MEDICAL OR VETERINARY SCIENCE; HYGIENE
- A61B—DIAGNOSIS; SURGERY; IDENTIFICATION
- A61B2562/00—Details of sensors; Constructional details of sensor housings or probes; Accessories for sensors
- A61B2562/02—Details of sensors specially adapted for in-vivo measurements
- A61B2562/0295—Strip shaped analyte sensors for apparatus classified in A61B5/145 or A61B5/157
-
- A—HUMAN NECESSITIES
- A61—MEDICAL OR VETERINARY SCIENCE; HYGIENE
- A61B—DIAGNOSIS; SURGERY; IDENTIFICATION
- A61B5/00—Measuring for diagnostic purposes; Identification of persons
- A61B5/145—Measuring characteristics of blood in vivo, e.g. gas concentration or pH-value ; Measuring characteristics of body fluids or tissues, e.g. interstitial fluid or cerebral tissue
- A61B5/14507—Measuring characteristics of blood in vivo, e.g. gas concentration or pH-value ; Measuring characteristics of body fluids or tissues, e.g. interstitial fluid or cerebral tissue specially adapted for measuring characteristics of body fluids other than blood
- A61B5/14517—Measuring characteristics of blood in vivo, e.g. gas concentration or pH-value ; Measuring characteristics of body fluids or tissues, e.g. interstitial fluid or cerebral tissue specially adapted for measuring characteristics of body fluids other than blood for sweat
-
- A—HUMAN NECESSITIES
- A61—MEDICAL OR VETERINARY SCIENCE; HYGIENE
- A61B—DIAGNOSIS; SURGERY; IDENTIFICATION
- A61B5/00—Measuring for diagnostic purposes; Identification of persons
- A61B5/145—Measuring characteristics of blood in vivo, e.g. gas concentration or pH-value ; Measuring characteristics of body fluids or tissues, e.g. interstitial fluid or cerebral tissue
- A61B5/1455—Measuring characteristics of blood in vivo, e.g. gas concentration or pH-value ; Measuring characteristics of body fluids or tissues, e.g. interstitial fluid or cerebral tissue using optical sensors, e.g. spectral photometrical oximeters
-
- A—HUMAN NECESSITIES
- A61—MEDICAL OR VETERINARY SCIENCE; HYGIENE
- A61B—DIAGNOSIS; SURGERY; IDENTIFICATION
- A61B5/00—Measuring for diagnostic purposes; Identification of persons
- A61B5/15—Devices for taking samples of blood
- A61B5/150007—Details
- A61B5/150206—Construction or design features not otherwise provided for; manufacturing or production; packages; sterilisation of piercing element, piercing device or sampling device
- A61B5/150259—Improved gripping, e.g. with high friction pattern or projections on the housing surface or an ergonometric shape
-
- A—HUMAN NECESSITIES
- A61—MEDICAL OR VETERINARY SCIENCE; HYGIENE
- A61B—DIAGNOSIS; SURGERY; IDENTIFICATION
- A61B5/00—Measuring for diagnostic purposes; Identification of persons
- A61B5/68—Arrangements of detecting, measuring or recording means, e.g. sensors, in relation to patient
- A61B5/6801—Arrangements of detecting, measuring or recording means, e.g. sensors, in relation to patient specially adapted to be attached to or worn on the body surface
- A61B5/683—Means for maintaining contact with the body
- A61B5/6832—Means for maintaining contact with the body using adhesives
- A61B5/6833—Adhesive patches
-
- A—HUMAN NECESSITIES
- A61—MEDICAL OR VETERINARY SCIENCE; HYGIENE
- A61M—DEVICES FOR INTRODUCING MEDIA INTO, OR ONTO, THE BODY; DEVICES FOR TRANSDUCING BODY MEDIA OR FOR TAKING MEDIA FROM THE BODY; DEVICES FOR PRODUCING OR ENDING SLEEP OR STUPOR
- A61M37/00—Other apparatus for introducing media into the body; Percutany, i.e. introducing medicines into the body by diffusion through the skin
- A61M37/0015—Other apparatus for introducing media into the body; Percutany, i.e. introducing medicines into the body by diffusion through the skin by using microneedles
Definitions
- the present invention relates to a biological component analysis method and a biological component analysis apparatus. More specifically, the present invention relates to a method and apparatus for analyzing a measurement target component contained in a tissue fluid extracted from the skin of a subject that has been subjected to a process that promotes the extraction of the tissue fluid.
- Patent Document 1 discloses a method of calculating (estimating) an area under a blood glucose-time curve of a subject using tissue fluid extracted from the subject's skin.
- micropores are formed on the skin of a subject using a puncture tool, and a tissue fluid collection sheet having a collection body made of gel is pasted on the skin on which micropores are formed for a predetermined time (for example, 60 minutes or more).
- the amount of glucose and sodium ion contained in the tissue fluid collected in the collected body is measured, and the area under the blood glucose-time curve of the subject is estimated based on the obtained amount of glucose and sodium ion.
- the present invention has been made in view of such circumstances, and an object of the present invention is to provide a biological component analysis method and a biological component analysis apparatus capable of accurately analyzing a measurement target component in a sweated subject. .
- the biological component analysis method of the present invention is a biological component analysis method for analyzing components contained in tissue fluid extracted from the skin of a subject, Applying a treatment that promotes extraction of tissue fluid to a portion of the subject's skin; Collecting the measurement target component from the skin subjected to the acceleration treatment; Collecting the first auxiliary component from the skin subjected to the promotion treatment; Collecting a second auxiliary component contained in sweat from the skin that has not been subjected to a promotion treatment; And a step of analyzing the measurement target component based on the collected measurement target component, the first auxiliary component, and the second auxiliary component.
- the first auxiliary component derived from the tissue fluid and sweat is collected from the surface of the skin subjected to the promotion treatment.
- the tissue fluid hardly springs on the surface of the skin that has not been subjected to the promotion treatment
- the second auxiliary component derived only from sweat is collected. Therefore, by collecting the first auxiliary component and the second auxiliary component and comparing them, it is possible to grasp how much of the auxiliary component derived from sweat is mixed in the first auxiliary component. . Thereby, even if a subject sweats, according to the biological component analysis method of the present invention, an accurate measurement target component based on the collected measurement target component, the first auxiliary component, and the second auxiliary component The analysis result can be generated.
- the first auxiliary component and the second auxiliary component are collected in the same period.
- the first auxiliary component and the second auxiliary component are collected in the same arm.
- the analysis step includes A first measurement step of measuring the collected second auxiliary component to obtain a first measurement value; Comparing the first measured value with a predetermined threshold; A second measurement step of measuring the collected measurement target component and obtaining a second measurement value when the first measurement value is smaller than a predetermined threshold; A third measurement step of measuring the collected first auxiliary component to obtain a third measurement value when the first measurement value is smaller than a predetermined threshold; A step of generating an analysis result including a value related to the amount of the measurement target component based on the second and third measured values may be included.
- the analysis step includes A first measurement step of measuring the collected second auxiliary component to obtain a first measurement value; A second measurement step of measuring the collected measurement target component to obtain a second measurement value; A third measurement step of measuring the collected first auxiliary component to obtain a third measurement value; Generating an analysis result of the measurement target component based on the first to third measurement values; Can be included.
- the step of generating the analysis result includes Comparing the first measured value with a predetermined threshold; When the first measurement value is equal to or greater than a predetermined threshold, an analysis result including a value related to the amount of the measurement target component based on the second and third measurement values and information indicating that the reliability of the value is low. It can include the process of producing
- the step of generating the analysis result includes Comparing the first measured value with a predetermined threshold; When the first measurement value is equal to or greater than a predetermined threshold value, the method may include a step of generating an analysis result including a message indicating that a value related to the amount of the measurement target component is not output.
- the step of generating the analysis result includes Comparing the first measured value with a first threshold and a second threshold greater than the first threshold; When the first measurement value is equal to or greater than the first threshold value and smaller than the second threshold value, the value related to the amount of the measurement target component based on the second and third measurement values and the reliability of this value is low Generating an analysis result including information indicating; Generating an analysis result including a message indicating that a value related to the amount of the measurement target component is not output when the first measurement value is equal to or greater than the second threshold; Can be included.
- the first measured value is a value related to the amount of the second auxiliary component
- the second measurement value can be a value related to the amount of the measurement target component
- the third measurement value can be a value related to the amount of the first auxiliary component.
- the analysis step can generate an analysis result of the measurement target component by correcting the second measurement value with a correction value obtained based on the first measurement value and the third measurement value.
- the correction value can be a value obtained by subtracting the first measurement value from the third measurement value.
- the value related to the amount can be the amount of auxiliary component extracted per unit time.
- the step of generating the analysis result includes Comparing the first measured value with a first threshold and a second threshold greater than the first threshold; When the first measurement value is equal to or greater than the first threshold value and smaller than the second threshold value, the analysis result of the measurement target component is obtained by correcting the second measurement value with the correction value based on the first and third measurement values. Generating Generating an analysis result including a message indicating that a value related to the amount of the measurement target component is not output when the first measurement value is equal to or greater than the second threshold; Can be included.
- the measurement target component can be glucose.
- the first auxiliary component and the second auxiliary component can be inorganic ions.
- the first auxiliary component and the second auxiliary component may be the same type of component.
- the inorganic ion can be a sodium ion.
- the component to be measured and the first auxiliary component can be collected in a collecting body arranged on the sticking surface of a holding sheet having a sticking surface that can be stuck to the skin of the subject.
- the collector is preferably made of a gel.
- the biological component analyzer of the present invention is a biological component analyzer that analyzes components contained in tissue fluid extracted from the skin of a subject, An acquisition unit that acquires information on the measurement target component and the first auxiliary component from a collection member that is disposed for a predetermined period of time on a part of the subject's skin that has been subjected to processing that promotes extraction of the component; The measurement target component is analyzed based on the information on the measurement target component and the first auxiliary component acquired in the acquisition unit, and the information on the second auxiliary component contained in the sweat from the skin that has not been subjected to the promotion process. It is characterized by having an analysis unit.
- the biological component analysis method and biological component analyzer of the present invention it is possible to accurately analyze the component to be measured of the subject who sweats.
- FIG. 8 is a sectional view taken along line AA in FIG. 7.
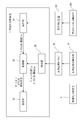
- FIG. 1 is a perspective explanatory view showing an appearance of a biological component analyzer 20 according to an embodiment of the present invention
- FIG. 2 is a block diagram of the biological component analyzer shown in FIG. First, an outline of a biological component analysis method will be described with reference to FIG.
- the biological component analysis method of the present embodiment forms micropores in the skin of the subject, extracts tissue fluid through the micropores, collects glucose and sodium ions contained in the extracted tissue fluid,
- This is a method for analyzing blood glucose (blood glucose) in a subject based on the collected glucose and sodium ion concentrations. More specifically, it is a method of calculating the area under the blood glucose-time curve (blood glucose AUC).
- the area under the blood glucose-time curve of the subject is estimated based on sodium ions collected together with glucose. Therefore, when excessive sodium ions derived from sweat are collected, The reliability of AUC may be reduced.
- the main collection member 10 is attached to the skin S in which the micropores are formed, and the sweating collection member 100 is attached to the skin R in which the micropores are not formed.
- glucose and sodium ions contained in the tissue fluid are collected in the main collection member 10 for measurement.
- sodium ions contained in the sweat from the skin in which the micropores are not formed are collected in the sweat check collecting member 100.
- sodium ions collected in the sweating collecting member 100 are measured (hereinafter also referred to as sweating measurement).
- the sodium ion concentration is higher than the threshold value, the glucose concentration and sodium collected in the main collecting member 10 are measured.
- An error message that prompts not to perform measurement of ion concentration (hereinafter, also referred to as main measurement) and analysis of blood glucose AUC based on the measurement is displayed. Thereby, it is avoided that the analysis result of the blood glucose AUC having low reliability is output.
- the biological component analyzer 20 measures glucose and sodium ions contained in the tissue fluid collected in the collecting body 12 of the main measurement collecting member 10 (to be described later) (hereinafter, may be referred to as main measurement) to obtain glucose.
- the concentration (C Glu ) and sodium ion concentration (C Na1 ) are acquired, and the area under the blood glucose-time curve (hereinafter also referred to as blood glucose AUC) of the subject is calculated based on the acquired C Glu and C Na1.
- the biological component analyzer 20 includes a detection unit 30, a control unit 35 including an analysis unit, a display unit 33 that displays an analysis result, an error message, and the like, and an operation button as an operation unit for performing a measurement start instruction and the like. 34.
- the biological component analyzer 20 includes a thick rectangular parallelepiped casing, and a recess 21 is formed on the top plate on the top surface of the casing.
- the concave portion 21 is provided with a cartridge arrangement portion 22 formed of a concave portion formed deeper than the concave portion 21.
- a movable top plate 23 having a thickness substantially equal to the height of the side wall of the recess 21 is connected to the recess 21.
- the movable top plate 23 is housed in the recess 21 from the state shown in FIG. 1 or is erected from the state housed in the recess 21 as shown in FIG. it can.
- the cartridge placement unit 22 has a size that can accommodate a main measurement cartridge 40 described later.
- the movable top plate 23 is supported by the support shaft 23a so as to be urged in the direction of being accommodated in the recess 21. Therefore, the main measurement cartridge 40 arranged in the cartridge arrangement unit 22 is pressed from above by the movable top plate 23.
- the detection unit 30 acquires information on the components contained in the tissue fluid collected in the collection body 12 of the collection member 10 for measurement, and the glucose detection unit 31 detects the concentration C Glu of glucose as the measurement target component. And a sodium ion detector 32 for detecting the concentration C Na1 of sodium ions as the first auxiliary component.
- the glucose detection unit 31 is provided on the back surface of the movable top plate 23, that is, on the side facing the cartridge placement unit 22 when the movable top plate 23 is stored in the recess 21.
- the glucose detection unit 31 includes a light source 31a for irradiating light and a light receiving unit 31b for receiving reflected light of the light irradiated by the light source 31a. Accordingly, the glucose detection unit 31 is configured to irradiate light to the main measurement cartridge 40 arranged in the cartridge arrangement unit 22 and to receive reflected light from the irradiated main measurement cartridge 40. ing.
- the sodium ion detection unit 32 is provided on the bottom surface of the cartridge position unit 22.
- the sodium ion detection unit 32 includes a plate-like member having a rectangular shape provided on the bottom surface of the cartridge placement unit 22, and a pair of sodium ion concentration measurement electrodes is provided in the approximate center of the plate-like member.
- the electrode for measuring sodium ion concentration includes a sodium ion selective electrode made of silver / silver chloride provided with a sodium ion selective membrane and a silver / silver chloride electrode as a counter electrode.
- the control unit 35 is provided inside the biological component analyzer 20, and includes a CPU as an analysis unit, a ROM and a RAM as storage units.
- the CPU controls the operation of each unit by reading and executing a program stored in the ROM.
- the RAM is used as a program development area when the program stored in the ROM is executed.
- the biological component analyzer 20 includes a supply unit 24 including a pump, a tank 26 for storing a recovery liquid composed of pure water for recovering the tissue fluid collected in the collection body 12 of the main collection member 10 for measurement, and A waste liquid tank 25 for storing the waste liquid is provided.
- the supply unit 24 injects the collected liquid stored in the tank 26 into the main measurement cartridge 40 arranged in the cartridge arrangement unit 22 via the nipple 24 a by sending air into the tank 26.
- the waste liquid tank 25 is a mechanism for discharging pure water sent to the main measurement cartridge 40 by the supply unit 24, and stores the discharged liquid through the nipple 25a.
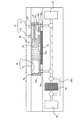
- FIG. 3 is a schematic cross-sectional view showing a state in which the main measurement cartridge 40 is arranged in the cartridge arrangement unit 22. First, the configuration of the main measurement cartridge 40 will be described with reference to FIG.
- the main measurement cartridge 40 includes a gel container 42, a glucose reactant 41, and an optical waveguide member 44 as main components.
- the gel containing portion 42 is formed of a recess formed on the surface of the main measurement cartridge 40.
- An injection hole 42 a that communicates with the nipple 24 a provided in the cartridge placement portion 22 is provided at the bottom of the gel storage portion 42.
- a groove communicating with the gel accommodating portion 42 is formed on the lower surface of the main measurement cartridge 40.
- a flow path 43 a is formed by this groove and the sodium ion detector 32 provided at the bottom of the cartridge placement portion 22.
- a part of the flow path 43 a is a first reservoir 43 in which the sodium ion concentration is detected by the sodium ion detector 32.
- the downstream of the flow path 43 a communicates with the second storage unit 45.
- the second reservoir 45 is formed of a recess provided on the surface of the measurement cartridge 40, and its opening is closed by an optical waveguide member 44 having an optical waveguide.
- a glucose reactant 41 that changes color by reacting with glucose is provided on the lower surface of the optical waveguide member 44.
- a discharge hole 45a that communicates with a nipple 25a provided in the cartridge placement portion 22 is provided at the bottom of the second storage portion.
- the biological component analyzer 20 measures the glucose concentration C Glu and the sodium ion concentration C Na1 contained in the tissue fluid collected in the main collection member 10 as follows. First, as shown by a one-dot chain line in FIG. 1, the main measurement collecting member 10 attached to the subject's skin S for a predetermined time is removed from the skin and attached to the gel container 42 of the main measurement cartridge 40. It is done. The main measurement cartridge 40 is arranged in the cartridge arrangement unit 22 of the biological component analyzer 20, and the movable top plate 23 is closed.
- the operation button 34 When the start of measurement is instructed by the operation button 34, air is supplied from the supply unit 24 toward the tank 26, and the recovered liquid is sent from the tank 26 toward the nipple 24a.
- the recovered liquid is injected into the gel accommodating part 42 from the injection hole 42a, and the gel accommodating part 42 is filled with the recovered liquid.
- the tissue fluid collected in the collection body 12 diffuses into the collected solution.
- the supply unit 24 sends air into the gel storage unit 42 via the bypass path 24a. Thereby, the liquid in the gel accommodating part 42 is sent to the 1st storage part 43 and the 2nd storage part 45 through the flow path 43a.
- the sodium ion detection unit 32 applies a constant voltage to the liquid stored in the first storage unit 43 by the sodium ion concentration measurement electrode to acquire a current value.
- the current value at this time is proportional to the sodium ion concentration contained in the liquid.
- the sodium ion detector 32 outputs the obtained current value to the controller 35 as a detection signal.
- the control unit 35 acquires the sodium ion concentration C Na1 based on the current value included in the detection signal and the calibration curve previously stored in the storage unit of the control unit 35.
- glucose in the collected liquid reacts with the glucose reactant 41, and the glucose reactant 41 changes color.
- the glucose detection unit 31 emits light from the light source 31a toward the optical waveguide member 44, and the light emitted from the optical waveguide member 44 is received by the light receiving unit 31b.
- the light is absorbed by the discolored glucose reactant 41 and repeatedly reflected inside the optical waveguide member 44 to enter the light receiving unit 31b.
- the amount of light received by the light receiving unit 31b is proportional to the degree of discoloration of the glucose reactant 41, and this degree of discoloration is proportional to the amount of glucose in the collected liquid.
- the glucose detection unit 31 outputs the obtained amount of received light as a detection signal to the control unit 35.
- the control unit 35 acquires the glucose concentration C Glu based on the received light amount included in the detection signal and the calibration curve stored in advance in the storage unit of the control unit 35.
- the micropore forming device is a device that promotes extraction of tissue fluid from the skin of the subject by forming a large number of micropores in a part of the subject's skin.
- glucose and sodium ions are collected from the skin S (see FIG. 1) of a subject in which micropores for promoting tissue fluid extraction are formed, and a subject in which micropores are not formed as described later.
- the sodium ions contained in the sweat from the skin R are collected.
- FIG. 4 is a perspective explanatory view of a puncture device P according to an example of a micropore forming apparatus used to form micropores for promoting tissue fluid extraction in the skin of a subject in the biological component analysis method of the present invention.
- FIG. 6 is a perspective view of a fine needle chip 200 attached to the puncture device P shown in FIG. 4, and FIG. 6 is a cross-sectional explanatory view of the skin S in which fine holes are formed by the puncture device P.
- the puncture device P is equipped with a sterilized microneedle chip 200 and the microneedle 201 of the microneedle chip 200 is brought into contact with the epidermis of the living body (subject's skin 300).
- This is a device for forming a tissue fluid extraction hole (micropore 301) in the skin 300 of the subject.
- the microneedle 201 of the microneedle chip 200 has such a size that when the microhole 301 is formed by the puncture tool P, the microhole 301 stays in the epidermis of the skin 300 and does not reach the dermis.
- the puncture tool P includes a housing 101, a release button 102 provided on the surface of the housing 101, an array chuck 103 and a spring member 104 provided inside the housing 101, and It has.
- An opening (not shown) through which the fine needle chip 200 can pass is formed on the lower end surface (the surface in contact with the skin) of the lower portion 101a of the housing 101.
- the spring member 104 has a function of urging the array chuck 103 in the puncturing direction.
- the array chuck 103 can be mounted with the fine needle chip 200 at the lower end.
- a plurality of fine needles 201 are formed on the lower surface of the fine needle chip 200.
- the lower surface of the fine needle chip 200 has a size of 10 mm (long side) ⁇ 5 mm (short side).
- the puncture device P has a fixing mechanism (not shown) that fixes the array chuck 103 in a state where the array chuck 103 is pushed upward (anti-puncture direction) against the urging force of the spring member 104. ) Presses the release button 102 to release the fixation of the array chuck 103 by the fixing mechanism, the array chuck 103 moves in the puncture direction by the urging force of the spring member 104, and the fine needle tip protrudes from the opening.
- 200 fine needles 201 are configured to puncture the skin. In FIG.
- reference numeral 105 denotes a convex portion formed on the lower portion 101 a of the housing 101, and the back surface of the convex portion 105 is brought into contact with a predetermined portion of the subject's skin when the puncture device P is used.
- the collection member 10 for measurement is attached to the skin of the subject in order to collect tissue fluid from the skin of the subject, and is peeled off from the skin after a predetermined time has elapsed.
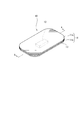
- FIG. 7 is a perspective explanatory view of the main measurement collecting member 10 including the holding sheet 11 and the collecting body 12 held by the holding sheet 11.
- FIG. 8 is a cross-sectional view taken along line AA in FIG. It is.
- the collection body 12 is made of a gel having water retention property capable of holding the tissue fluid extracted from the skin of the subject, and contains pure water as an extraction medium.
- the gel is not particularly limited as long as the tissue fluid can be collected, but a gel formed from at least one hydrophilic polymer selected from the group consisting of polyvinyl alcohol and polyvinyl pyrrolidone is preferable.
- the hydrophilic polymer that forms the gel may be polyvinyl alcohol alone or polyvinyl pyrrolidone alone, or a mixture of both. preferable.
- the gel can be formed by a method of crosslinking a hydrophilic polymer in an aqueous solution.
- the gel can be formed by a method in which an aqueous solution of a hydrophilic polymer is applied onto a substrate to form a coating film, and the hydrophilic polymer contained in the coating film is crosslinked.
- the crosslinking method of the hydrophilic polymer include a chemical crosslinking method and a radiation crosslinking method, but it is desirable to employ the radiation crosslinking method because various chemical substances are hardly mixed as impurities in the gel.
- the collecting body 12 has a rectangular parallelepiped shape in the examples shown in FIGS. 7 to 8, and the size of the surface in contact with the skin is 7 mm ⁇ 12 mm.
- the shape and size of the collection body 12 are not limited to this.
- the holding sheet 11 is composed of an oval sheet body 11a and an adhesive layer 11b formed on one side of the sheet body 11a, and the surface on which the adhesive layer 11b is formed is an adhesive surface.
- the collection body 12 is disposed in the approximate center of the release sheet 13 that also functions as a mount, and the holding sheet 11 is attached to the release sheet 13 so as to cover the collection body 12.
- the collector 12 is held on the holding sheet 11 by a part of the adhesive surface of the holding sheet 11.
- the area of the holding sheet 11 has a size that can cover the collection body 12 in order to prevent the collection body 12 from drying when collecting the tissue fluid. That is, by covering the collection body 12 with the holding sheet 11, the skin and the holding sheet 11 can be kept airtight when collecting the tissue fluid, and the moisture contained in the collection body 12 is prevented from evaporating when collecting the tissue fluid. be able to.
- the sheet main body 11a of the holding sheet 11 is colorless and transparent or colored and transparent, and the collection body 12 held by the holding sheet 11 is visually observed from the surface side (surface opposite to the adhesive layer 11b) of the sheet main body 11a. Can be easily confirmed.
- the sheet body 11a preferably has low moisture permeability to prevent evaporation of tissue fluid and drying of the collected body. Examples of the material of the sheet main body 11a include a polyethylene film, a polypropylene film, a polyester film, and a polyurethane film, and among them, a polyethylene film and a polyester film are preferable.
- the thickness of the sheet body 11a is not particularly limited, but is about 0.025 to 0.5 mm.
- the collection body 12 is disposed in the micropore formation region S of the subject (a region where a plurality of micropores 301 are formed in the skin 300 of the subject by the puncture tool P in order to promote extraction of tissue fluid).
- the adhesive sheet of the holding sheet 11 is attached to the subject's skin 300.
- the component contained in the tissue fluid extracted through the micropores is left by leaving the collector 12 in the micropore formation region for a predetermined time, for example, 60 minutes or more, preferably 180 minutes or more. 12 to collect.
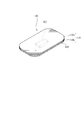
- FIG. 9 is a perspective view showing the configuration of the sweating collecting member 100 in the present embodiment.
- the sweat check collecting member 100 has the same configuration as the main measurement collecting member 10 described above, and includes a holding sheet 110, a collecting body 120 held on the holding sheet 110, and a release sheet 130. Since the configuration of each part of the sweating collecting member 100 is the same as that of the main measuring collecting member 10 shown in FIGS. 7 and 8, detailed description thereof is omitted.
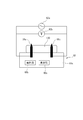
- FIG. 10 is a schematic explanatory diagram of a sweating measurement device used in the biological component analysis method of the present embodiment.
- the sweating measuring device 60 includes a base 60a on which the collecting body 120 of the sweating check collecting member 100 is placed, counter electrodes 61a and 61b provided on the top surface of the base 60a, an AC power supply 62a, and voltages between the counter electrodes 61a and 61b.
- the analysis unit 60b analyzes the sodium ion concentration C Na2 collected in the collection body 12 of the sweat check collection member 100, and displays the sodium ion concentration on the display unit 60c. C Na2 is displayed.
- An electrode for measuring sodium ion concentration may be provided.
- FIG. 12 is a flowchart of the biological component analysis method according to the first embodiment.
- step S1 micropores are formed in the skin of the subject using the puncture tool shown in FIG. Specifically, the subject's skin 300 is wiped with alcohol or the like to remove substances (such as dust) that cause disturbance in the measurement results. Thereafter, the convex portion 105 of the puncture device P on which the above-described fine needle chip 200 is mounted is placed on the subject's skin, and then the release button 102 is pressed to place the fine needle 201 of the fine needle chip 200 on the subject's skin 300. By making contact, micropores 301 are formed in the skin 300. By forming such micropores, extraction of tissue fluid from the skin 300 can be promoted.
- substances such as dust
- step S2 the puncture tool P is separated from the skin 300 of the subject, and then the collection member 10 for main measurement is arranged so that the collection body 12 is disposed in the region S (micropore formation region) where the micropores 301 are formed.
- the holding sheet 11 is affixed to the skin 300 of the subject (see FIG. 1).
- the collecting member 100 for sweat check is affixed to the non-puncture site R, for example, the skin near the micropore formation region of the subject. Micropores are usually formed in the subject's arms.
- the main measurement collection member 10 and the sweat check collection member 100 can be attached to different arms, but from the viewpoint of making the measurement conditions the same as much as possible, the main measurement collection member 10 and the perspiration check
- the check collecting member 100 is preferably attached to the same arm. Even if the amount of sweating is different between the right arm and the left arm by applying to the same arm, the amount of sodium ions derived from sweat collected by the collection member for measurement 10 and the collection member 100 for sweating check The difference can be reduced.
- step S4 tissue fluid from the skin of the subject is extracted into the main measurement collection member 10, and glucose and sodium ions contained in the tissue fluid are collected and accumulated in the collection body 12 of the main measurement collection member 10. .
- the subject sweats sodium ions contained in the sweat are also collected in the main collection member 10 from the skin of the subject together with the tissue fluid.
- the sodium ion contained in the sweat is collected by the collection member 100 for sweat check.
- the collection time is, for example, about 60 minutes to 180 minutes.
- step S5 the main measurement collection member 10 and the sweat check collection member 100 are removed from the skin of the subject.
- Steps S6 to S11 are processes for analyzing each component collected in step S4.
- the collection member 100 for sweat check removed from the skin of the subject is set in the sweat measurement device 60.
- the sweat check collection member 100 is set in the sweat measurement device 60 so that the counter electrodes 61 a and 61 b of the sweat measurement device 60 are embedded in the collection body 120 of the sweat check collection member 100.
- step S7 the sodium ion concentration C Na2 contained in the collection body 120 is measured by measuring the conductivity of the collection body 120 of the collection member 100 for sweat check. It has been confirmed that the amount of sodium ions estimated from the conductivity of the gel has a high correlation with the amount of sodium ions separately measured using an ion chromatogram. Therefore, the amount of sodium ions in the gel can be estimated by a relatively simple method of measuring the conductivity of the gel.
- the sodium ion concentration C Na2 measured by the perspiration measuring device 60 is displayed on the display unit 60c.
- step S8 the sodium ion concentration C Na2 measured in step S7 is input to the biological component analyzer 20 by the operation button 34.
- step S8 the control unit 35 determines whether or not the input sodium ion concentration C Na2 is higher than a predetermined threshold value.
- the control unit 35 displays an error message on the display unit 33 (the accuracy cannot be guaranteed even if this measurement is performed because the amount of sweating is large).
- the main measurement (measurement of glucose concentration C Glu and sodium ion concentration C Na1 and calculation of blood glucose AUC estimation value) is performed using the above-described main measurement cartridge 40.
- the main measurement cartridge 40 is a disposable cartridge containing the glucose reactant 41, the wasteful consumption of the main measurement cartridge 40 can be suppressed by checking the amount of perspiration and prompting the low-precision analysis to be stopped. Can do.
- the threshold value can be obtained in advance as described below, for example, from the blood glucose AUC estimated value described later, blood glucose AUC by blood sampling, and experimental data on the amount of perspiration.
- a highly reliable blood glucose AUC can be obtained based on the glucose concentration C Glu and the sodium ion concentration C Na1 by setting threshold values for these indexes and comparing the threshold values obtained from the subjects with the threshold values. Can be determined. Such a threshold can be obtained in advance by experiments. Hereinafter, examples of threshold values set experimentally will be described.
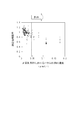
- FIG. 13 is a graph showing the relationship between glucose permeability (vertical axis) and sodium ion extraction rate (horizontal axis) for a plurality of cases.
- FIG. 14 is a graph obtained by dividing the data in FIG. 13 based on a threshold value with respect to the sodium ion extraction rate J Na2 .
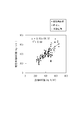
- FIG. 15 is a graph obtained by dividing the data in FIG. 13 based on a threshold value with respect to a relative Na value.
- blood was collected a plurality of times at predetermined time intervals in parallel with the collection of the components contained in the tissue fluid and sweat in this embodiment.
- the blood glucose AUC was calculated based on glucose and sodium ions contained in the tissue fluid and the formula (1) described later (referred to as estimated blood glucose AUC).
- blood glucose AUC was calculated from blood glucose levels at a plurality of time points obtained by multiple blood samplings by a known trapezoidal approximation method (referred to as blood sampling blood glucose AUC).
- the glucose permeability shown on the vertical axis in FIG. 13 is a value obtained by dividing the amount of glucose collected by the main collection member 10 by the collected blood glucose AUC. That is, the glucose permeability indicates the ratio of the amount of glucose extracted outside the body to the blood glucose AUC in the body.
- the sodium ion extraction rate is the amount of sodium ions collected in the main body 10 for measurement per unit time.
- Na relative value ⁇ (J Na2 ) ⁇ (constant ⁇ ) ⁇ ⁇ (J Na1 )
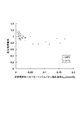
- ⁇ Threshold for sodium ion extraction rate J Na2 As an example of the threshold value for the sodium ion extraction rate J Na2, a value of 0.04 ( ⁇ mol / h) was used. That is, cases in which the amount of sodium ions per unit time collected in the collection for sweat check exceeds 0.04 (umol / h) are excluded. The cases shown in FIG. 13 were classified using this threshold. The results are shown in FIG.
- the vertical axis represents the measured value deviation rate
- the horizontal axis represents the sodium ion extraction rate J Na2 at the non-puncture site.
- the measured value deviation rate is the ratio of the estimated blood glucose AUC and the collected blood glucose AUC measured for each case, and the closer this is to 1, the higher the reliability of the estimated blood glucose AUC.
- the threshold value for the sodium ion extraction rate J Na2 it is possible to eliminate many measurement results with low reliability such that the measurement value deviation rate is less than 0.8. .
- ⁇ Threshold for Na relative value> As an example of the threshold value for the Na relative value, a value of 0.045 was used. The cases shown in FIG. 13 were classified using this threshold. The results are shown in FIG. In FIG. 15, the vertical axis represents the measured value deviation rate, and the horizontal axis represents the Na relative value. As shown in FIG. 15, by setting the threshold value for the Na relative value to 0.045, many measurement results with low reliability such that the measurement value deviation rate is less than 0.8 can be eliminated.
- step S10 when the sodium ion extraction rate J Na2 is equal to or lower than the threshold value (“No” in step S8), in step S10, the main measurement collection member 10 is attached to a predetermined location of the main measurement cartridge 40, The main measurement cartridge 40 is set in the cartridge placement unit 22 of the biological component analyzer 20.
- step S11 the measurement process described above is executed by the biological component analyzer 20, whereby the glucose concentration C Glu and the sodium ion concentration C Na1 are measured.
- the control unit 35 calculates the blood glucose AUC based on the glucose concentration C Glu and the sodium ion concentration C Na1 and the following equation (1).
- AUC C Glu ⁇ V / ⁇ ⁇ (C Na1 ⁇ V / t) + ⁇ (1)
- V is the volume of the collection body 12 of the collection member 10 for this measurement.
- ⁇ and ⁇ are constants obtained by experiments.
- the principle of calculating the blood glucose AUC based on the formula (1) is described in detail in International Publication No. 2010/013808. WO 2010/013808 is incorporated herein by reference.
- step S12 the calculated result is output to the display unit 33 by the control unit 35.
- sodium ions contained in sweat from the skin R that has not been subjected to micropore formation processing are collected, and this measurement (C Glu and C Na1 is performed when the collected sodium ion concentration is higher than a threshold value. Measurement and blood glucose AUC analysis) can be avoided, so that the blood glucose AUC analysis with low reliability can be avoided.
- FIG. 16 is a graph showing a correlation between glucose permeability and sodium ion extraction rate before excluding divergence cases.
- FIG. 17 is a graph showing the correlation between the estimated blood glucose AUC value and the collected blood glucose AUC value (measured blood glucose AUC value).
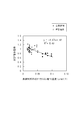
- FIG. 18 is a graph showing the relationship between the measured value deviation rate and the sodium ion extraction rate at the non-puncture site.
- FIG. 19 is a graph corresponding to FIG. 16, and is a graph showing the correlation between the glucose permeability and the sodium ion extraction rate excluding divergence cases.
- FIG. 20 is a graph corresponding to FIG. 17, and is a graph showing the correlation between the estimated blood glucose AUC excluding divergence cases and the collected blood glucose AUC.
- ⁇ is a case of a diabetic patient, and “ ⁇ ” is a case of a healthy person.
- a case surrounded by a circle is a divergence case (a case where the amount of sweating is large and the measurement value divergence rate is far from 1). All divergence cases were found in diabetic patients.
- blood glucose AUC was calculated based on glucose and sodium ions contained in the tissue fluid and the above formula (1) (referred to as estimated blood glucose AUC).
- blood glucose AUC was calculated from blood glucose levels at a plurality of time points obtained by multiple blood samplings by a known trapezoidal approximation method (referred to as blood sampling blood glucose AUC).
- FIG. 16 is a graph with the glucose permeability as the vertical axis and the sodium ion extraction rate as the horizontal axis.
- the glucose permeability is a value obtained by dividing the amount of glucose collected in the main collection member 10 by the blood collection blood glucose AUC. That is, the glucose permeability indicates the ratio of the amount of glucose extracted outside the body to the blood glucose AUC in the body.
- the sodium ion extraction rate is the amount of sodium ions collected in the main collection member 10 per unit time. As described in detail in International Publication No. 2010/013808, the sodium ion extraction rate and the glucose permeability are correlated. As shown in FIG. 16, when the sodium ion extraction rate and the glucose permeability are plotted, the plot converges around a regression line having a certain slope.
- FIG. 17 is a graph with the estimated blood glucose AUC as the vertical axis and the horizontal axis as the blood collection blood glucose AUC as the horizontal axis. As indicated by the circles in FIG. 17, in cases where sweating is high, the difference between the estimated blood glucose AUC and the blood glucose AUC is large due to an increase in the sodium ion concentration. When correlation coefficients were obtained for all cases shown in FIG. 17, the correlation coefficient was 0.68.
- FIG. 18 is a graph with the measured value deviation rate on the vertical axis and the sodium ion extraction rate at the non-puncture site on the horizontal axis.
- the measured value deviation rate shown in FIG. 18 is a value obtained by dividing the estimated blood glucose AUC shown in FIG. 17 by the collected blood glucose AUC. The closer the measured value deviation rate is to 1, the higher the reliability of the estimated blood glucose AUC.
- the measured value deviation rate decreases as the sodium ion extraction rate at the non-puncture site increases. Therefore, in this example, data of 10 sites in 5 cases in which the sodium ion extraction rate at the non-puncture site exceeded 0.06 ( ⁇ mol / h) was excluded from the analysis target, and the analysis was performed again. The results are shown in FIGS.
- the correlation coefficient between the glucose permeability and the sodium ion extraction rate was improved from 0.81 to 0.90 as shown in FIG.
- the correlation coefficient between the estimated blood glucose AUC value and the blood glucose AUC value was improved from 0.68 to 0.82. From this, based on the amount of sodium ions collected in the sweat check collection member 100, avoiding the main measurement for a case with high sweating, the user is provided with an analysis of an unreliable blood glucose AUC estimate. It has been proven that
- FIG. 21 is a flowchart of the biological component analysis method according to the second embodiment.
- the first embodiment an example of determining whether to perform the main measurement (measurement of C Glu and C Na1 ) and the calculation of blood glucose AUC based on the result of sweat measurement (J Na2 ) has been exemplified.
- the second embodiment after the perspiration measurement and the main measurement are executed, information on the reliability of the blood glucose AUC is output together with the analysis result of the blood glucose AUC.
- steps S101 to S105 are the same as steps S1 to S5 in the first embodiment shown in FIG. 12, and therefore detailed description of steps S101 to S105 is omitted, and steps S106 to S105 are performed.
- the analysis process of S111 will be described in detail. Steps S106 to S111 are processes for analyzing the components collected in step S104.
- step S106 the sweating collecting member 100 is set in the sweating measuring device 60, and in step S107, the concentration C Na2 of sodium ions collected in the collector 120 is measured.
- step S ⁇ b> 108 the main measurement collection member 10 is affixed to a predetermined location of the main measurement cartridge 40, and the main measurement cartridge 40 is set in the cartridge placement unit 22 of the biological component analyzer 20.
- step S109 the glucose concentration C Glu and the sodium ion concentration C Na1 collected in the collection body 12 are measured, and a blood glucose AUC estimated value is calculated based on the glucose concentration C Glu and the sodium ion concentration C Na1 .
- step S110 the sodium ion extraction rate J Na2 obtained in step S107 is input to the biological component analyzer 20 by the user.
- step S111 an analysis result is generated by the control unit 35.
- step S112 the generated analysis result is output to the display unit 33.
- FIG. 22 is a flowchart of the process executed by the control unit 35 in step S111.
- the control unit 35 compares the input sodium ion extraction rate J Na2 with a threshold value, and determines whether or not the sodium ion extraction rate J Na2 is equal to or higher than the threshold value. If it is determined that the value is equal to or greater than the threshold (YES in step S121), control unit 35 advances the process to step S122.
- the control unit 35 generates an analysis result including the blood glucose AUC calculated in step S109 and flag information indicating that the reliability of the blood glucose AUC is low.
- step S123 the control unit 35 generates an analysis result including only the blood glucose AUC calculated in step S109.
- the sodium ion extraction rate J Na2 is less than the threshold value, the blood glucose AUC is highly reliable, and therefore the flag information is not included in the analysis result.
- the user when the subject perspires to affect the calculation result of the blood glucose AUC, the user can be notified that the reliability of the blood glucose AUC has decreased. The user can use this flag information to determine whether or not to use the output blood glucose AUC.
- the form in which J Na2 is compared with the threshold is shown, but the Na relative value is obtained based on J Na1 and J Na2 and the Na relative value is compared with the threshold. Good.
- one threshold value is set, and it is determined whether or not the sodium ion extraction rate J Na2 is higher than the threshold value. You can also. For example, two threshold values (a first threshold value and a second threshold value larger than this) may be set, and different analysis results may be generated according to the sodium ion extraction rate J Na2 .
- FIG. 23 is a flowchart showing processing of the control unit in the biological component analysis method according to the third embodiment. Since the third embodiment is the same as steps S101 to S112 in FIG. 21 except for the processing by the control unit 35, the description thereof is omitted here.
- step S131 the control unit 35 determines whether or not the sodium ion extraction rate J Na2 is equal to or higher than a first threshold value.
- a first threshold value a value that affects the analysis of blood glucose AUC is set, although the analysis result of blood glucose AUC is not rejected.
- the control unit 35 proceeds to step S132, and the sodium ion concentration C Na2 is less than the first threshold value. (NO in step S131), the process proceeds to step S136.
- step S136 the control unit 35 generates an analysis result including only the blood glucose AUC calculated in step S109.
- step S132 the control unit 35 determines whether or not the sodium ion extraction rate J Na2 is equal to or higher than the second threshold value.
- the second threshold value is set to a value that is larger than the first threshold value and that requires the analysis result of blood glucose AUC to be rejected.
- the control unit 35 proceeds to step S133, and the sodium ion extraction rate J Na2 is less than the second threshold value. If it is determined that there is (NO in step S132), the process proceeds to step S134.
- step S134 the control unit 35 generates an analysis result including the blood glucose AUC calculated in step S109 and flag information indicating that the reliability of the blood glucose AUC is low.
- step S133 the control unit 35 generates an analysis result including a message with a content such as “The analysis result of the blood glucose AUC cannot be displayed because the reliability of the analysis result cannot be guaranteed. Please remeasure”. In this case, the blood glucose AUC calculated in step S109 is not included in the analysis result.
- different analysis results can be output according to the amount of sweat of the subject. Furthermore, when the subject sweats to the extent that the analysis result of blood glucose AUC needs to be rejected, a message indicating that the analysis result of blood glucose AUC is not output is output, thereby prompting to perform measurement again while suppressing the amount of sweating Can do.
- the form in which J Na2 is compared with the threshold is shown, but the Na relative value is obtained based on J Na1 and J Na2 and the Na relative value is compared with the threshold. Good.
- FIG. 25 is a flowchart of the biological component analysis method according to the fourth embodiment.
- the processing content from step T1 (micropore formation processing) to step T5 (removal of the main measurement collection member and perspiration collection member) is from step S1 to step S5 in the first embodiment shown in FIG. For the sake of simplicity, description thereof will be omitted.
- Steps T6 to T10 are processes for analyzing each component collected in step T4.
- the components collected by the sweat check collection member and the components collected by the measurement collection member are analyzed in parallel.
- step T ⁇ b> 6 the sweating collecting member 100 removed from the subject's skin is set in the sweating measuring device 60.
- the sweat check collection member 100 is set in the sweat measurement device 60 so that the counter electrodes 61 a and 61 b of the sweat measurement device 60 are embedded in the collection body 120 of the sweat check collection member 100.
- step T7 the sodium ion concentration C Na2 contained in the collection body 120 is measured by measuring the conductivity of the collection body 120 of the collection member 100 for sweat check.
- the sodium ion concentration C Na2 measured by the perspiration measuring device 60 is displayed on the display unit 60c.
- the control unit 35 follows the following formula based on the input sodium ion concentration C Na2 , and the non-puncture site
- the sodium ion extraction rate J Na2 is calculated.
- J Na2 C Na2 ⁇ V 2 / t
- V 2 is the volume of the collection body 120 of the collection member 100 for sweat check
- t is the extraction time.
- step T8 the main measurement collection member 10 is affixed to a predetermined location of the main measurement cartridge 40, and the main measurement cartridge 40 is attached to the cartridge placement unit 22 of the biological component analyzer 20. Set.
- step T9 the measurement process described above is executed by the biological component analyzer 20, whereby the glucose concentration C Glu and the sodium ion concentration C Na1 are measured.
- the control unit 35 calculates the extracted glucose amount M Glu and the sodium ion extraction rate J Na1 at the puncture site based on the glucose concentration C Glu and the sodium ion concentration C Na1 and the following formula.
- V 1 is the volume of the collection body 12 of the main collection member 10 for measurement
- t is the extraction time.
- step T10 the control unit 35 calculates the blood glucose AUC estimated value corrected in accordance with the following equation using the M Glu and J Na1 calculated in J Na2 and step T9, which is calculated in step T7 (2) .
- step T11 an analysis result is generated by the control unit 35.
- step T12 the generated analysis result is output to the display unit 33.
- FIG. 26 is a flowchart showing processing of the control unit in the biological component analysis method according to the fourth embodiment.
- step T131 the control unit 35 determines whether or not the sodium ion extraction rate J Na2 is equal to or higher than the first threshold value.
- the first threshold value a value that affects the analysis of blood glucose AUC is set, although the analysis result of blood glucose AUC is not rejected.
- the control unit 35 determines that the sodium ion extraction rate J Na2 is equal to or higher than the first threshold (Yes in Step T131)
- the control unit 35 proceeds to Step T132, and the sodium ion extraction rate J Na2 is less than the first threshold. If it is determined that there is (No in step T131), the process proceeds to step T136.
- step T136 the control unit 35 generates an analysis result including the blood glucose AUC calculated in step T9.
- step T132 the control unit 35 determines whether or not the sodium ion extraction rate J Na2 is equal to or higher than the second threshold value.
- the second threshold value is set to a value that is larger than the first threshold value and that requires the analysis result of blood glucose AUC to be rejected.
- the control unit 35 proceeds to Step T133, and the sodium ion extraction rate J Na2 is less than the second threshold value. If it is determined that there is (No in step T132), the process proceeds to step T134.
- step T134 the control unit 35 generates an analysis result including the corrected blood glucose AUC estimated value calculated in step T10.
- step T133 the control unit 35 generates an analysis result including a message with a content such as “The analysis result of the blood glucose AUC cannot be displayed because the reliability of the analysis result cannot be guaranteed. Please remeasure”. In this case, the blood glucose AUC calculated in steps T9 and T10 is not included in the analysis result.
- different analysis results can be output according to the amount of sweat of the subject.
- the blood glucose AUC estimated value can be output using the correction value.
- a message indicating that the analysis result of blood glucose AUC is not output is output, thereby prompting to perform measurement again while suppressing the amount of sweating Can do.
- FIG. 27 is a graph showing the correlation between glucose permeability (P Glu ) and sodium ion extraction rate (J Na1 ) in a plurality of subjects when the above-described sweating correction was not performed
- FIG. 29 is a graph showing the relationship between the sodium ion extraction rate (J Na2 ) and the measured value deviation rate
- FIG. 29 shows the glucose permeability (P Glu ) and sodium ion extraction when sweating correction is performed according to the above equation (2).
- It is a graph which shows the correlation of speed
- “ ⁇ ” is an experimental example at a room temperature of 24 ° C.
- “+” is an experimental example at a room temperature of 31 ° C.
- FIG. 27 is a graph with the glucose permeability on the vertical axis and the sodium ion extraction rate on the horizontal axis.
- the glucose permeability is a value obtained by dividing the amount of glucose collected in the main collection member 10 by the blood collection blood glucose AUC. That is, the glucose permeability indicates the ratio of the amount of glucose extracted outside the body to the blood glucose AUC in the body.
- the sodium ion extraction rate is the amount of sodium ions collected by the main collection member 100 per unit time. As described in detail in International Publication No. 2010/013808, the sodium ion extraction rate and the glucose permeability are correlated. As shown in FIG. 27, when the sodium ion extraction rate and the glucose permeability are plotted, the plot converges around a regression line having a certain slope.
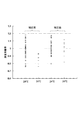
- FIG. 30 is a graph showing the measured value deviation rates before and after correction. Although no significant change was observed at 24 ° C. with little sweating, the average value deviation rate before correction was about 0.87 at 31 ° C. with much sweating, but the average value after correction was about 1 It was confirmed that the measurement accuracy was improved.
- glucose is measured as a component to be measured.
- the present invention is not limited to this, and the amount of a substance other than glucose contained in tissue fluid may be measured.
- substances measured by the present invention include biochemical components and drugs administered to subjects.
- biochemical components include proteins such as albumin, globulin, and enzymes, which are a kind of biochemical components.
- biochemical components other than protein include creatinine, creatine, uric acid, amino acids, fructose, galactose, pentose, glycogen, lactic acid, pyruvic acid, and ketone bodies.
- the drug include digitalis preparations, theophylline, arrhythmic agents, antiepileptic agents, amino acid saccharide antibiotics, glycopeptide antibiotics, antithrombotic agents, and immunosuppressive agents.
- the first auxiliary component and the second auxiliary component may be different components.
- assistant component it is a component contained in the body by a fixed density
- inorganic ions such as potassium ion, calcium ion, magnesium ion, or a water
- moisture content may be sufficient.
- the perspiration measurement device 60 and the biological component analysis device 20 that performs the main measurement are separate from each other, but both devices can be integrated.
- a perspiration check cartridge for attaching the perspiration check collecting member 100 is provided, and this is disposed in the arrangement of the biological component analyzer 20.
- the biological component analyzer 20 may perform sweat measurement and main measurement.
- a common cartridge to which the main collection member 10 for measurement and the collection member 100 for perspiration check can be attached may be provided, and an analyzer that can accept the cartridge may be provided. Thereby, the components collected by the two collecting members can be analyzed simultaneously.
- FIG. 24 is a perspective view showing the configuration of the common collection member 400.
- the common collection member 400 includes a first collection unit 310 for main measurement and a second collection unit 320 for sweat check.
- the first collection unit 310 has the same configuration as the main measurement collection member 10 described above, and includes a main measurement collection body 312.
- the second collecting unit 320 has the same configuration as the above-described sweating check collecting member 100 and includes a sweating check collecting body 322.
- the collection body 312 and the collection body 322 are held by a common holding sheet 330.
- the common holding sheet 330 has the same configuration as the above-described holding sheet.
- the common holding sheet 330 is provided with a perforation 340 for separating the first collection unit 310 and the second collection unit 320.
- the common collection member 400 is used as follows.
- the common holding sheet 330 is affixed to the skin of the subject so that the collection body 312 for main measurement is located in the micropore formation region S and the collection body 322 for sweating check is located at the non-puncture site R.
- the common collection member 400 is removed from the skin and divided into the first collection unit 310 and the second collection unit 320 along the perforation 340.
- the first collection unit 310 performs the main measurement by the biological component analyzer 20, and the second collection unit 320 performs the sweat measurement by the sweat measurement device 60.
- sweat can be collected at a position close to the site from which the tissue fluid is extracted (puncture site S), and the first collection unit 310 and the second collection unit 320 The difference in the amount of sweat collected can be reduced.
- the user inputs the sodium ion extraction rate J Na2 measured by the perspiration measuring device to the biological component analyzer, but the embodiment is not limited thereto.
- the perspiration measuring device and the biological component analyzer can be communicably connected, and the result (data) obtained by the perspiration measuring device can be transmitted to the control unit of the biological component analyzer.
Landscapes
- Health & Medical Sciences (AREA)
- Life Sciences & Earth Sciences (AREA)
- Physics & Mathematics (AREA)
- Surgery (AREA)
- General Health & Medical Sciences (AREA)
- Biophysics (AREA)
- Pathology (AREA)
- Engineering & Computer Science (AREA)
- Biomedical Technology (AREA)
- Heart & Thoracic Surgery (AREA)
- Medical Informatics (AREA)
- Molecular Biology (AREA)
- Veterinary Medicine (AREA)
- Animal Behavior & Ethology (AREA)
- Public Health (AREA)
- Hematology (AREA)
- Optics & Photonics (AREA)
- Emergency Medicine (AREA)
- Dermatology (AREA)
- Endocrinology (AREA)
- Gastroenterology & Hepatology (AREA)
- Physiology (AREA)
- Measurement Of The Respiration, Hearing Ability, Form, And Blood Characteristics Of Living Organisms (AREA)
- Investigating Or Analysing Biological Materials (AREA)
- Measuring And Recording Apparatus For Diagnosis (AREA)
- Sampling And Sample Adjustment (AREA)
Abstract
被験者が発汗した場合でも正確に測定対象成分を分析することができる生体成分分析方法を提供する。被験者の皮膚から抽出された組織液に含まれる成分を分析する生体成分分析方法。組織液の抽出を促進する処理を被験者の皮膚の一部に施す工程と、促進処理が施された皮膚から測定対象成分を収集する工程と、促進処理が施された皮膚から第1補助成分を収集する工程と、促進処理が施されていない皮膚から汗に含まれる第2補助成分を収集する工程と、収集された測定対象成分、第1補助成分及び第2補助成分に基づいて、測定対象成分を分析する工程とを含んでいる。
Description
本発明は生体成分分析方法及び生体成分分析装置に関する。さらに詳しくは、組織液の抽出を促進する処理が施された被験者の皮膚から抽出された組織液に含まれる測定対象成分を分析する方法及び装置に関する。
従来、被験者の皮膚から抽出された組織液に含まれる測定対象成分を測定する方法が知られている(例えば、特許文献1参照)。
特許文献1には、被験者の皮膚から抽出された組織液を用いて当該被験者の血糖―時間曲線下面積を算出(推定)する方法が開示されている。この方法は、被験者の皮膚に穿刺具を用いて微細孔を形成し、微細孔が形成された皮膚にゲルからなる収集体を有する組織液収集シートを所定時間(例えば、60分以上の時間)貼り付けることにより、当該皮膚から滲み出る組織液を収集する。ついで、収集体に収集された組織液に含まれるグルコース量及びナトリウムイオン量を測定し、得られるグルコース量及びナトリウムイオン量に基づいて、被験者の血糖―時間曲線下面積を推定する。
特許文献1には、被験者の皮膚から抽出された組織液を用いて当該被験者の血糖―時間曲線下面積を算出(推定)する方法が開示されている。この方法は、被験者の皮膚に穿刺具を用いて微細孔を形成し、微細孔が形成された皮膚にゲルからなる収集体を有する組織液収集シートを所定時間(例えば、60分以上の時間)貼り付けることにより、当該皮膚から滲み出る組織液を収集する。ついで、収集体に収集された組織液に含まれるグルコース量及びナトリウムイオン量を測定し、得られるグルコース量及びナトリウムイオン量に基づいて、被験者の血糖―時間曲線下面積を推定する。
特許文献1記載の方法において、被験者が発汗しないことを前提としている。しかしながら、実際には、組織液の収集中に発汗する被験者も存在する。
本発明は、このような事情に鑑みてなされたものであり、発汗した被験者における測定対象成分を正確に分析することが可能な生体成分分析方法及び生体成分分析装置を提供することを目的としている。
本発明の生体成分分析方法は、被験者の皮膚から抽出された組織液に含まれる成分を分析する生体成分分析方法であって、
組織液の抽出を促進する処理を被験者の皮膚の一部に施す工程と、
促進処理が施された皮膚から測定対象成分を収集する工程と、
促進処理が施された皮膚から第1補助成分を収集する工程と、
促進処理が施されていない皮膚から汗に含まれる第2補助成分を収集する工程と、
収集された測定対象成分、第1補助成分及び第2補助成分に基づいて、測定対象成分を分析する工程と
を含むことを特徴としている。
組織液の抽出を促進する処理を被験者の皮膚の一部に施す工程と、
促進処理が施された皮膚から測定対象成分を収集する工程と、
促進処理が施された皮膚から第1補助成分を収集する工程と、
促進処理が施されていない皮膚から汗に含まれる第2補助成分を収集する工程と、
収集された測定対象成分、第1補助成分及び第2補助成分に基づいて、測定対象成分を分析する工程と
を含むことを特徴としている。
本発明の生体成分分析方法において、促進処理が施された皮膚の表面からは組織液と汗に由来する第1補助成分が収集される。一方、促進処理が施されていない皮膚の表面では、組織液がほとんど湧き出ないため、汗にのみ由来する第2補助成分が収集される。したがって、このような第1補助成分と第2補助成分を収集し、両者を比較することで、第1補助成分にどの程度の汗由来の補助成分が混在しているのかを把握することができる。これにより、仮に被験者が発汗した場合であっても、本発明の生体成分分析方法によれば、収集された測定対象成分、第1補助成分及び第2補助成分に基づいて、正確な測定対象成分の解析結果を生成することができる。
前記第1補助成分と第2補助成分は、同じ期間に収集されることが好ましい。
前記第1補助成分と第2補助成分は、同じ腕において収集されることが好ましい。
前記第1補助成分と第2補助成分は、同じ腕において収集されることが好ましい。
前記分析工程は、
収集された第2補助成分を測定して第1測定値を取得する第1測定工程と、
第1測定値と所定の閾値とを比較する工程と、
第1測定値が所定の閾値より小さい場合に、収集された測定対象成分を測定して第2測定値を取得する第2測定工程と、
第1測定値が所定の閾値より小さい場合に、収集された第1補助成分を測定して第3測定値を取得する第3測定工程と、
第2及び第3測定値に基づいて、測定対象成分の量に関する値を含む解析結果を生成する工程を含むものとすることができる。
収集された第2補助成分を測定して第1測定値を取得する第1測定工程と、
第1測定値と所定の閾値とを比較する工程と、
第1測定値が所定の閾値より小さい場合に、収集された測定対象成分を測定して第2測定値を取得する第2測定工程と、
第1測定値が所定の閾値より小さい場合に、収集された第1補助成分を測定して第3測定値を取得する第3測定工程と、
第2及び第3測定値に基づいて、測定対象成分の量に関する値を含む解析結果を生成する工程を含むものとすることができる。
前記分析工程は、
収集された第2補助成分を測定して第1測定値を取得する第1測定工程と、
収集された測定対象成分を測定して第2測定値を取得する第2測定工程と、
収集された第1補助成分を測定して第3測定値を取得する第3測定工程と、
第1乃至第3測定値に基づいて、測定対象成分の解析結果を生成する工程と、
を含むものとすることができる。
収集された第2補助成分を測定して第1測定値を取得する第1測定工程と、
収集された測定対象成分を測定して第2測定値を取得する第2測定工程と、
収集された第1補助成分を測定して第3測定値を取得する第3測定工程と、
第1乃至第3測定値に基づいて、測定対象成分の解析結果を生成する工程と、
を含むものとすることができる。
前記解析結果を生成する工程は、
第1測定値と所定の閾値とを比較する工程と、
第1測定値が所定の閾値以上である場合に、第2及び第3の測定値に基づく測定対象成分の量に関する値と、この値の信頼性が低いことを示す情報とを含む解析結果を生成する工程を含むものとすることができる。
第1測定値と所定の閾値とを比較する工程と、
第1測定値が所定の閾値以上である場合に、第2及び第3の測定値に基づく測定対象成分の量に関する値と、この値の信頼性が低いことを示す情報とを含む解析結果を生成する工程を含むものとすることができる。
前記解析結果を生成する工程は、
第1測定値と所定の閾値とを比較する工程と、
第1測定値が所定の閾値以上である場合に、測定対象成分の量に関する値を出力しない旨のメッセージを含む解析結果を生成する工程を含むものとすることができる。
第1測定値と所定の閾値とを比較する工程と、
第1測定値が所定の閾値以上である場合に、測定対象成分の量に関する値を出力しない旨のメッセージを含む解析結果を生成する工程を含むものとすることができる。
前記解析結果を生成する工程は、
第1測定値と、第1の閾値及び第1の閾値より大きい第2の閾値とを比較する工程と、
第1測定値が第1の閾値以上であり且つ第2の閾値より小さい場合に、第2及び第3の測定値に基づく測定対象成分の量に関する値と、この値の信頼性が低いことを示す情報とを含む解析結果を生成する工程と、
第1測定値が第2の閾値以上である場合に、測定対象成分の量に関する値を出力しない旨のメッセージを含む解析結果を生成する工程と、
を含むものとすることができる。
第1測定値と、第1の閾値及び第1の閾値より大きい第2の閾値とを比較する工程と、
第1測定値が第1の閾値以上であり且つ第2の閾値より小さい場合に、第2及び第3の測定値に基づく測定対象成分の量に関する値と、この値の信頼性が低いことを示す情報とを含む解析結果を生成する工程と、
第1測定値が第2の閾値以上である場合に、測定対象成分の量に関する値を出力しない旨のメッセージを含む解析結果を生成する工程と、
を含むものとすることができる。
第1測定値を、第2補助成分の量に関する値とし、
第2測定値を、測定対象成分の量に関する値とし、且つ
第3測定値を、第1補助成分の量に関する値とすることができる。
第2測定値を、測定対象成分の量に関する値とし、且つ
第3測定値を、第1補助成分の量に関する値とすることができる。
分析工程は、第1測定値及び第3測定値に基づいて得られる補正値で第2測定値を補正することにより測定対象成分の解析結果を生成するものとすることができる。
補正値は、第3測定値から第1測定値を減ずることにより得られた値とすることができる。
量に関する値は、単位時間あたりの補助成分の抽出量とすることができる。
前記解析結果を生成する工程は、
第1測定値と、第1の閾値及び第1の閾値より大きい第2の閾値とを比較する工程と、
第1測定値が第1の閾値以上であり且つ第2の閾値より小さい場合に、第1及び第3の測定値に基づく補正値で第2測定値を補正することにより測定対象成分の解析結果を生成する工程と、
第1測定値が第2の閾値以上である場合に、測定対象成分の量に関する値を出力しない旨のメッセージを含む解析結果を生成する工程と、
を含むことができる。
量に関する値は、単位時間あたりの補助成分の抽出量とすることができる。
前記解析結果を生成する工程は、
第1測定値と、第1の閾値及び第1の閾値より大きい第2の閾値とを比較する工程と、
第1測定値が第1の閾値以上であり且つ第2の閾値より小さい場合に、第1及び第3の測定値に基づく補正値で第2測定値を補正することにより測定対象成分の解析結果を生成する工程と、
第1測定値が第2の閾値以上である場合に、測定対象成分の量に関する値を出力しない旨のメッセージを含む解析結果を生成する工程と、
を含むことができる。
前記測定対象成分をグルコースとすることができる。
前記第1補助成分及び第2補助成分を無機イオンとすることができる。
前記第1補助成分と第2補助成分を同一種類の成分とすることができる。
前記無機イオンをナトリウムイオンとすることができる。
前記第1補助成分及び第2補助成分を無機イオンとすることができる。
前記第1補助成分と第2補助成分を同一種類の成分とすることができる。
前記無機イオンをナトリウムイオンとすることができる。
前記測定対象成分及び第1補助成分を、被験者の皮膚に貼付可能な貼付面を有する保持シートの当該貼付面に配置された収集体に収集することができる。
前記収集体がゲルからなることが好ましい。
前記収集体がゲルからなることが好ましい。
本発明の生体成分分析装置は、被験者の皮膚から抽出される組織液に含まれる成分を分析する生体成分分析装置であって、
前記成分の抽出を促進する処理が施された被験者の皮膚の一部に所定時間配置された収集部材から測定対象成分及び第1補助成分に関する情報を取得する取得部と、
この取得部において取得された測定対象成分及び第1補助成分に関する情報と、促進処理が施されていない皮膚からの汗に含まれる第2補助成分に関する情報とに基づいて、測定対象成分を分析する解析部と
を備えたことを特徴としている。
前記成分の抽出を促進する処理が施された被験者の皮膚の一部に所定時間配置された収集部材から測定対象成分及び第1補助成分に関する情報を取得する取得部と、
この取得部において取得された測定対象成分及び第1補助成分に関する情報と、促進処理が施されていない皮膚からの汗に含まれる第2補助成分に関する情報とに基づいて、測定対象成分を分析する解析部と
を備えたことを特徴としている。
前記第2補助成分に関する情報を取得する第2取得部を更に備えていることが好ましい。
前記第2補助成分に関する情報を受け付ける情報受付部を更に備えていることが好ましい。
前記第2補助成分に関する情報を受け付ける情報受付部を更に備えていることが好ましい。
本発明の生体成分分析方法及び生体成分分析装置によれば、発汗した被験者の測定対象成分を正確に分析することができる。
以下、添付図面を参照しつつ、本発明の生体成分分析方法及び生体成分分析装置の実施の形態を詳細に説明する。
(第1の実施形態)
図1は、本発明の一実施の形態に係る生体成分分析装置20の外観を示す斜視説明図であり、図2は、図1に示される生体成分分析装置のブロック図である。まず図1を参照して、生体成分分析方法の概略を説明する。
図1は、本発明の一実施の形態に係る生体成分分析装置20の外観を示す斜視説明図であり、図2は、図1に示される生体成分分析装置のブロック図である。まず図1を参照して、生体成分分析方法の概略を説明する。
本実施形態の生体成分分析方法は、後述するように、被験者の皮膚に微細孔を形成し、微細孔を介して組織液を抽出し、抽出された組織液に含まれるグルコース及びナトリウムイオンを収集し、収集されたグルコース及びナトリウムイオンの濃度に基づいて、被験者における血中グルコース(血糖)を分析する方法である。より具体的には、血糖―時間曲線下面積(血糖AUC)を算出する方法である。
被験者が発汗すると、組織液に由来するナトリウムイオンに重畳するようにして汗由来のナトリウムイオンが収集され、ナトリウムイオン濃度が高くなる。本実施形態の生体成分分析方法では、グルコースとともに収集されたナトリウムイオンに基づいて被験者の血糖―時間曲線下面積を推定するため、汗由来のナトリウムイオンが過剰に収集されると、算出される血糖AUCの信頼性が低下することがある。
そこで、本実施形態の方法では、微細孔が形成された皮膚Sに本測定用収集部材10を貼り付けるとともに、微細孔が形成されていない皮膚Rに発汗チェック用収集部材100を貼り付ける。この状態で、本測定用収集部材10に、組織液に含まれるグルコース及びナトリウムイオンを収集する。同時に、発汗チェック用収集部材100に、微細孔が形成されていない皮膚からの汗に含まれるナトリウムイオンを収集する。そして、発汗チェック用収集部材100に収集されたナトリウムイオンを測定(以下、発汗測定ともいう)し、ナトリウムイオン濃度が閾値よりも高いときには、本測定用収集部材10に収集されたグルコース濃度及びナトリウムイオンの濃度の測定(以下、本測定ともいう)、並びにこれらに基づく血糖AUCの解析を行わないように促すエラーメッセージを表示することとしている。これにより、信頼性の低い血糖AUCの解析結果が出力されることが回避される。
〔生体成分分析装置〕
この生体成分分析装置20は、後述する本測定用収集部材10の収集体12に収集された組織液に含まれるグルコース及びナトリウムイオンを測定(以下、本測定と呼称することがある)して、グルコース濃度(CGlu)及びナトリウムイオン濃度(CNa1)を取得し、取得したCGlu及びCNa1に基づいて、被験者の血糖―時間曲線下面積(以下、血糖AUCともいう)を算出し、血糖AUCを含む解析結果を生成して表示する装置である。生体成分分析装置20は、検出部30と、解析部を含む制御部35と、解析結果やエラーメッセージなどを表示する表示部33と、測定開始の指示などを行うための操作部としての操作ボタン34とを備えている。
この生体成分分析装置20は、後述する本測定用収集部材10の収集体12に収集された組織液に含まれるグルコース及びナトリウムイオンを測定(以下、本測定と呼称することがある)して、グルコース濃度(CGlu)及びナトリウムイオン濃度(CNa1)を取得し、取得したCGlu及びCNa1に基づいて、被験者の血糖―時間曲線下面積(以下、血糖AUCともいう)を算出し、血糖AUCを含む解析結果を生成して表示する装置である。生体成分分析装置20は、検出部30と、解析部を含む制御部35と、解析結果やエラーメッセージなどを表示する表示部33と、測定開始の指示などを行うための操作部としての操作ボタン34とを備えている。
生体成分分析装置20は、厚みのある直方体形状の筐体を備えており、筐体上面の天板には凹部21が形成されている。凹部21には、当該凹部21よりもさらに深く形成された凹部からなるカートリッジ配置部22が設けられている。さらに凹部21には、当該凹部21の側壁の高さとほぼ同じ厚みを有する可動天板23が連結されている。可動天板23は、支軸23aを中心に折り畳むことによって、図1に示される状態から凹部21内に収納し、又は凹部21に収納された状態から図1に示されるように起立させることができる。カートリッジ配置部22は、後述する本測定用カートリッジ40を収納することができる大きさを有している。
可動天板23は、凹部21に収納される方向に付勢されるように、支軸23aに支持されている。したがって、カートリッジ配置部22に配置された本測定用カートリッジ40は、可動天板23によって上方から押さえつけられる。
検出部30は、本測定用収集部材10の収集体12に収集された組織液に含まれる成分の情報を取得するものであり、測定対象成分であるグルコースの濃度CGluを検出するグルコース検出部31と、第1補助成分であるナトリウムイオンの濃度CNa1を検出するナトリウムイオン検出部32とを備えている。
グルコース検出部31は、可動天板23の裏面、すなわち可動天板23が凹部21に収納されたときにカートリッジ配置部22と対向する側の面に設けられている。グルコース検出部31は、光を照射するための光源31aと、この光源31aによって照射された光の反射光を受光するための受光部31bとを備えている。これにより、グルコース検出部31は、カートリッジ配置部22に配置された本測定用カートリッジ40に対して光を照射するとともに、照射された本測定用カートリッジ40からの反射光を受光できるように構成されている。
ナトリウムイオン検出部32は、カートリッジ位置部22の底面に設けられている。ナトリウムイオン検出部32は、カートリッジ配置部22の底面に設けられた長方形状を有する板状の部材を備え、この板状部材の略中央には一対のナトリウムイオン濃度測定用電極が設けられている。ナトリウムイオン濃度測定用電極は、ナトリウムイオン選択膜を備えた銀/塩化銀からなるナトリウムイオン選択性電極と、対電極である銀/塩化銀電極を含んでいる。
制御部35は、生体成分分析装置20の内部に設けられており、解析部であるCPUや、記憶部であるROM、RAMなどを含んでいる。CPUは、ROMに記憶されたプログラムを読み出して実行することにより、各部の動作を制御する。RAMは、ROMに記憶されたプログラムが実行される際のプログラムの展開領域として利用される。
生体成分分析装置20は、その内部にポンプからなる供給部24、本測定用収集部材10の収集体12に収集された組織液を回収するための純水からなる回収液を収容するタンク26、及び廃液を収容する廃液タンク25を備えている。供給部24は、タンク26に空気を送り込むことにより、ニップル24aを介して、カートリッジ配置部22に配置された本測定用カートリッジ40にタンク26内に収容されている回収液を注入する。
廃液タンク25は、供給部24によって本測定用カートリッジ40に送液された純水が排出される機構であり、ニップル25aを介して、排出された液体を収容する。
図3は、カートリッジ配置部22に本測定用カートリッジ40が配置された状態を示す概略断面図である。まず図3を参照して本測定用カートリッジ40の構成について説明する。
本測定用カートリッジ40は、主な構成として、ゲル収容部42と、グルコース反応体41と、光導波部材44とを備えている。ゲル収容部42は、本測定用カートリッジ40の表面に形成された凹部からなる。ゲル収容部42の底部には、カートリッジ配置部22に設けられたニップル24aと連通する注入孔42aが設けられている。本測定用カートリッジ40の下面にはゲル収容部42と連通する溝が形成されている。この溝とカートリッジ配置部22の底部に設けられたナトリウムイオン検出部32とによって流路43aが形成される。この流路43aの一部は、ナトリウムイオン検出部32によりナトリウムイオン濃度が検出される第1貯留部43とされている。流路43aの下流は、第2貯留部45に連通している。第2貯留部45は本測定用カートリッジ40の表面に設けられた凹部からなり、その開口が光導波路を有する光導波部材44によって閉塞されている。この光導波部材44の下面に、グルコースと反応して変色するグルコース反応体41が設けられている。第2貯留部の底部には、カートリッジ配置部22に設けられたニップル25aと連なって通じる排出孔45aが設けられている。
生体成分分析装置20は、次のようにして本測定用収集部材10に収集された組織液に含まれるグルコースの濃度CGlu及びナトリウムイオンの濃度CNa1を測定する。まず、図1において、一点鎖線で示されるように、被験者の皮膚Sに所定時間貼り付けられた本測定用収集部材10が皮膚から取り外され、本測定用カートリッジ40のゲル収容部42に貼り付けられる。この本測定用カートリッジ40が生体成分分析装置20のカートリッジ配置部22に配置され、可動天板23が閉じられる。
操作ボタン34によって測定開始が指示されると、供給部24からタンク26に向けて空気が供給され、タンク26からニップル24aに向けて回収液が送られる。回収液は注入孔42aからゲル収容部42に注入され、ゲル収容部42が回収液で満たされる。この状態で所定時間が経過すると、収集体12に収集された組織液が回収液に拡散する。所定時間が経過したら、供給部24はバイパス路24aを介してゲル収容部42に空気を送り込む。これにより、ゲル収容部42内の液体が流路43aを通じて第1貯留部43および第2貯留部45に送液される。
ナトリウムイオン検出部32は、ナトリウムイオン濃度測定用電極によって第1貯留部43に貯留された液体に一定電圧を印加して電流値を取得する。このときの電流値は、液体に含まれるナトリウムイオン濃度に比例する。ナトリウムイオン検出部32は、得られた電流値を検出信号として制御部35に出力する。制御部35は、検出信号に含まれる電流値と予め制御部35の記憶部に記憶されている検量線とに基づいて、ナトリウムイオン濃度CNa1を取得する。
第2貯留部では、回収液中のグルコースとグルコース反応体41とが反応し、グルコース反応体41が変色する。グルコース検出部31は、光源31aから光導波部材44に向かって光を照射し、光導波部材44から出射した光を受光部31bによって受光する。光源31aから光が照射されると、光は、変色したグルコース反応体41により吸光されながら、光導波部材44の内部で反射を繰り返して受光部31bに入射する。受光部31bにおける受光量はグルコース反応体41の変色度合いに比例し、この変色度合いが回収液中のグルコース量に比例する。グルコース検出部31は、得られた受光量を検出信号として制御部35に出力する。制御部35は、検出信号に含まれる受光量と予め制御部35の記憶部に記憶されている検量線とに基づいてグルコース濃度CGluを取得する。
ナトリウムイオン濃度CNa1およびグルコース濃度CGluが取得されると、供給部24から本測定用カートリッジ40にさらに空気が送り込まれる。これにより回収液が排出孔45aおよびニップル25aを介して廃液タンク25に送られ、一連の測定が終了する。
〔微細孔形成装置〕
つぎに被験者の皮膚に微細孔を形成する微細孔形成装置の一例について説明する。微細孔形成装置は、被験者の皮膚の一部に多数の微細な孔を形成して当該被験者の皮膚からの組織液の抽出を促進する装置である。本実施形態では、組織液抽出促進のための微細孔が形成された被験者の皮膚S(図1参照)からグルコース及びナトリウムイオンが収集されるとともに、後述するように、微細孔が形成されていない被験者の皮膚Rからの汗に含まれるナトリウムイオンが収集される。
つぎに被験者の皮膚に微細孔を形成する微細孔形成装置の一例について説明する。微細孔形成装置は、被験者の皮膚の一部に多数の微細な孔を形成して当該被験者の皮膚からの組織液の抽出を促進する装置である。本実施形態では、組織液抽出促進のための微細孔が形成された被験者の皮膚S(図1参照)からグルコース及びナトリウムイオンが収集されるとともに、後述するように、微細孔が形成されていない被験者の皮膚Rからの汗に含まれるナトリウムイオンが収集される。
図4は、本発明の生体成分分析方法において被験者の皮膚に組織液抽出促進用の微細孔を形成するのに用いられる微細孔形成装置の一例に係る穿刺具Pの斜視説明図であり、図5は、図4に示される穿刺具Pに装着される微細針チップ200の斜視図であり、図6は、穿刺具Pによって微細孔が形成された皮膚Sの断面説明図である。
図4~6に示されるように、穿刺具Pは、滅菌処理された微細針チップ200を装着して、当該微細針チップ200の微細針201を生体の表皮(被験者の皮膚300)に当接させることによって、被験者の皮膚300に組織液の抽出孔(微細孔301)を形成する装置である。微細針チップ200の微細針201は、穿刺具Pにより微細孔301を形成した場合に、当該微細孔301が皮膚300の表皮内にとどまり真皮までは到達しないような大きさを有する。
図4に示されるように、穿刺具Pは、筐体101と、この筐体101の表面に設けられたリリースボタン102と、筐体101の内部に設けられたアレイチャック103及びバネ部材104とを備えている。筐体101の下部101aの下端面(皮膚に当接する面)には、前記微細針チップ200が通過可能な開口(図示せず)が形成されている。バネ部材104はアレイチャック103を穿刺方向に付勢する機能を有する。アレイチャック103は下端に微細針チップ200を装着することができる。微細針チップ200の下面には、複数の微細針201が形成されている。微細針チップ200の下面は、10mm(長辺)×5mm(短辺)の大きさからなる。また、穿刺具Pは、アレイチャック103をバネ部材104の付勢力に逆らって上方(反穿刺方向)に押し上げた状態で固定する固定機構(図示せず)を有しており、使用者(被験者)がリリースボタン102を押下することにより、当該固定機構によるアレイチャック103の固定が解除され、バネ部材104の付勢力によって当該アレイチャック103が穿刺方向に移動し、前記開口から突出した微細針チップ200の微細針201が皮膚を穿刺するように構成されている。なお、図4において、105は筐体101の下部101aに形成された凸部であり、穿刺具Pの使用時には前記凸部105の裏面が被験者の皮膚の所定箇所に当接される。
〔本測定用収集部材〕
つぎに被験者の皮膚から組織液を収集する本測定用収集部材10について説明する。本測定用収集部材10は被験者の皮膚から組織液を収集するために当該被験者の皮膚に貼付され、所定時間経過後に皮膚から剥がされるものである。
つぎに被験者の皮膚から組織液を収集する本測定用収集部材10について説明する。本測定用収集部材10は被験者の皮膚から組織液を収集するために当該被験者の皮膚に貼付され、所定時間経過後に皮膚から剥がされるものである。
図7は、保持シート11と、この保持シート11に保持された収集体12とを備えた本測定用収集部材10の斜視説明図であり、図8は、図7のA-A線断面図である。
収集体12は、被験者の皮膚から抽出した組織液を保持可能な保水性を有するゲルからなっており、抽出媒体としての純水を含有している。このゲルは、組織液を収集することが可能であれば特に限定されないが、ポリビニルアルコールやポリビニルピロリドンからなる群より選ばれる少なくとも一種の親水性ポリマーから形成されたゲルが好ましい。ゲルを形成する親水性ポリマーは、ポリビニルアルコール単独又はポリビニルピロリドン単独であってもよく、また両者の混合物であってもよいが、ポリビニルアルコール単独又はポリビニルアルコールとポリビニルピロリドンとの混合物であることがより好ましい。
ゲルは、親水性ポリマーを水溶液中で架橋する方法により形成することができる。ゲルは、親水性ポリマーの水溶液を基材上に塗工して塗膜を形成し、該塗膜中に含まれる親水性ポリマーを架橋する方法により形成することができる。親水性ポリマーの架橋法としては、化学架橋法や放射線架橋法などがあるが、ゲル中に各種化学物質が不純物として混入し難い点より、放射線架橋法を採用することが望ましい。
収集体12は、図7~8に示される例では直方体形状を呈しており、皮膚と接触する面のサイズは7mm×12mmである。ただし、収集体12の形状及びサイズは、これに限定されるものではない。
保持シート11は、小判形状のシート本体11aと、このシート本体11aの片面に形成された粘着剤層11bとで構成されており、前記粘着剤層11bが形成された側の面が粘着面とされている。収集体12は、同じく小判形状の、台紙としても機能する剥離シート13のほぼ中央に配設されており、この収集体12を覆うように前記保持シート11が剥離シート13に貼付されている。収集体12は、保持シート11の粘着面の一部によって当該保持シート11に保持されている。保持シート11の面積は、組織液収集時における収集体12の乾燥を防ぐために、収集体12を覆うことが可能な大きさを有している。すなわち、保持シート11によって収集体12を覆うことにより、組織液収集時に皮膚と保持シート11との間を気密に保つことができ、組織液収集時に収集体12に含まれる水分が蒸発するのを抑制することができる。
保持シート11のシート本体11aは、無色透明又は有色透明であり、当該シート本体11aの表面側(粘着剤層11bと反対側の面)から、保持シート11に保持されている収集体12を目視にて容易に確認することができる。シート本体11aは、組織液の蒸発や収集体の乾燥を防ぐため透湿性が低いものが好ましい。シート本体11aの材質としては、例えばポリエチレンフィルム、ポリプロピレンフィルム、ポリエステルフィルム、ポリウレタンフィルムなどが挙げられ、その中でもポリエチレンフィルム、ポリエステルフィルムが好ましい。シート本体11aの厚さは、特に限定されないが、概ね0.025~0.5mm程度である。
本測定用収集部材10は、収集体12が被験者の微細孔形成領域S(組織液の抽出を促進させるために穿刺具Pによって被験者の皮膚300に複数の微細孔301が形成された領域)に配置されるように、保持シート11の粘着面によって当該被験者の皮膚300に貼付される。そして、収集体12を微細孔形成領域に配置した状態で所定時間、例えば60分以上、好ましくは180分以上放置することにより、微細孔を介して抽出される組織液に含まれる成分を当該収集体12に収集する。
〔発汗チェック用収集部材〕
つぎに被験者の皮膚から汗を収集する発汗チェック用収集部材100について説明する。図9は、本実施形態における発汗チェック用収集部材100の構成を示す斜視図である。発汗チェック用収集部材100は、上述の本測定用収集部材10と同じ構成を備えており、保持シート110と、この保持シート110に保持された収集体120と剥離シート130とを備えている。発汗チェック用収集部材100の各部の構成については、図7および図8に示した本測定用収集部材10と同様であるため、詳細な説明は省略する。
つぎに被験者の皮膚から汗を収集する発汗チェック用収集部材100について説明する。図9は、本実施形態における発汗チェック用収集部材100の構成を示す斜視図である。発汗チェック用収集部材100は、上述の本測定用収集部材10と同じ構成を備えており、保持シート110と、この保持シート110に保持された収集体120と剥離シート130とを備えている。発汗チェック用収集部材100の各部の構成については、図7および図8に示した本測定用収集部材10と同様であるため、詳細な説明は省略する。
〔発汗測定装置〕
図10は、本実施形態の生体成分分析方法に用いられる発汗測定装置の概略説明図である。発汗測定装置60は、発汗チェック用収集部材100の収集体120が載せられる基台60a、基台60aの上面に設けられた対向電極61a及び61b、交流電源62a、対向電極61a及び61b間の電圧を計測する電圧計62b、解析部60b及び表示部60cを備えている。基台60a上に収集体120が載置されると、対向電極61a及び61bが収集体120に差し込まれ、対向電極61aと61bとが収集体120を通じて短絡する。この状態で交流電源62aによって電圧が印加されると、対向電極61a及び61b間の電圧が電圧計62bによって計測される。解析部60bは、計測された電圧値と検量線とに基づいて、発汗チェック用収集部材100の収集体12に収集されたナトリウムイオンの濃度CNa2を解析し、表示部に60cにナトリウムイオン濃度CNa2を表示させる。
図10は、本実施形態の生体成分分析方法に用いられる発汗測定装置の概略説明図である。発汗測定装置60は、発汗チェック用収集部材100の収集体120が載せられる基台60a、基台60aの上面に設けられた対向電極61a及び61b、交流電源62a、対向電極61a及び61b間の電圧を計測する電圧計62b、解析部60b及び表示部60cを備えている。基台60a上に収集体120が載置されると、対向電極61a及び61bが収集体120に差し込まれ、対向電極61aと61bとが収集体120を通じて短絡する。この状態で交流電源62aによって電圧が印加されると、対向電極61a及び61b間の電圧が電圧計62bによって計測される。解析部60bは、計測された電圧値と検量線とに基づいて、発汗チェック用収集部材100の収集体12に収集されたナトリウムイオンの濃度CNa2を解析し、表示部に60cにナトリウムイオン濃度CNa2を表示させる。
また、発汗測定装置として、図11に示されるように、ナトリウムイオン選択膜を備えた銀/塩化銀からなるナトリウムイオン選択性電極63と、対電極である銀/塩化銀電極64とからなる一対のナトリウムイオン濃度測定用電極を備えていてもよい。
〔生体成分分析方法〕
つぎに本発明の第1実施形態の生体成分分析方法の一実施の形態について説明する。
図12は、第1の実施の形態に係る生体成分分析方法のフローチャートである。
つぎに本発明の第1実施形態の生体成分分析方法の一実施の形態について説明する。
図12は、第1の実施の形態に係る生体成分分析方法のフローチャートである。
まずステップS1において、図4に示される穿刺具を用いて被験者の皮膚に微細孔が形成される。具体的には、被験者の皮膚300をアルコールなどを用いて清拭し、測定結果の外乱要因となる物質(塵など)を除去する。その後、当該被験者の皮膚に、前述した微細針チップ200を装着した穿刺具Pの凸部105を配置し、ついでリリースボタン102を押圧して微細針チップ200の微細針201を被験者の皮膚300に接触させることで、当該皮膚300に微細孔301を形成する。かかる微細孔を形成することで、皮膚300からの組織液の抽出を促進させることができる。
ついで、ステップS2において、穿刺具Pを被験者の皮膚300から離し、その後微細孔301が形成された領域S(微細孔形成領域)に収集体12が配置されるように、本測定用収集部材10の保持シート11を被験者の皮膚300に貼付する(図1参照)。
ついで、ステップS3において、発汗チェック用収集部材100を非穿刺部位R、例えば被験者の微細孔形成領域近傍の皮膚に貼付する。微細孔は、通常、被験者の腕に形成される。本測定用収集部材10と、発汗チェック用収集部材100とを別々の腕に貼付することも可能であるが、できるだけ測定条件を同じにするという観点からは、本測定用収集部材10と、発汗チェック用収集部材100とを、同じ腕に貼付することが好ましい。同じ腕に貼付することで、右腕と左腕とで発汗量が異なる場合であっても、本測定用収集部材10と発汗チェック用収集部材100とで、収集される汗由来のナトリウムイオンの量の差を小さくすることができる。
ついで、ステップS4において、本測定用収集部材10中に被験者の皮膚からの組織液が抽出され、組織液に含まれるグルコース及びナトリウムイオンが本測定用収集部材10の収集体12に収集され、蓄積される。このとき、被験者が発汗した場合には、組織液とともに被験者の皮膚から、汗に含まれるナトリウムイオンも本測定用収集部材10中に収集される。同時に、発汗チェック用収集部材100によって、汗に含まれるナトリウムイオンが収集される。収集時間は、例えば60分~180分程度である。
ついで、ステップS5において、本測定用収集部材10及び発汗チェック用収集部材100を被験者の皮膚から取り外す。
ステップS6~S11は、ステップS4において収集された各成分を分析する工程である。
まず、ステップS6において、被験者の皮膚から取り外された発汗チェック用収集部材100が発汗測定装置60にセットされる。発汗測定装置60の対向電極61a及び61bが、発汗チェック用収集部材100の収集体120に埋設されるように、発汗チェック用収集部材100が発汗測定装置60にセットされる。
まず、ステップS6において、被験者の皮膚から取り外された発汗チェック用収集部材100が発汗測定装置60にセットされる。発汗測定装置60の対向電極61a及び61bが、発汗チェック用収集部材100の収集体120に埋設されるように、発汗チェック用収集部材100が発汗測定装置60にセットされる。
ついで、ステップS7において、発汗チェック用収集部材100の収集体120の導電率を測定することで、収集体120に含まれるナトリウムイオン濃度CNa2を測定する。ゲルの導電率から推定したナトリウムイオン量は、イオンクロマトグラムを用いて別途測定をしたナトリウムイオン量と高い相関関係を有することが確認されている。したがって、ゲルの導電率を測定するという比較的簡便な方法で、ゲル中のナトリウムイオン量を推定することができる。発汗測定装置60によって測定されたナトリウムイオン濃度CNa2は、表示部60cに表示される。
ついで、ステップS8において、ステップS7において測定されたナトリウムイオン濃度CNa2が操作ボタン34によって生体成分分析装置20に入力される。ついで、ステップS8において、制御部35は、入力されたナトリウムイオン濃度CNa2が所定の閾値よりも高いか否かの判断をする。制御部35は、ナトリウムイオン濃度CNa2が閾値よりも高いと判断すると、表示部33にエラーメッセージ(発汗量が多いので、本測定を行っても精度が保証できない旨)を表示する。本測定(グルコース濃度CGlu及びナトリウムイオン濃度CNa1の測定、並びに血糖AUC推定値の算出)は、上述の本測定用カートリッジ40を用いて行われる。本測定用カートリッジ40は、グルコース反応体41を含む使い捨てのカートリッジであるので、発汗量のチェックを行って精度の低い分析の中止を促すことで、本測定用カートリッジ40の無駄な消費を抑えることができる。閾値は、後述する血糖AUC推定値、採血による血糖AUC及び発汗量についての実験データなどから、例えば、以下に述べるようにして予め求めることができる。
〔閾値の設定〕
発汗の多い症例と発汗の少ない症例とを分類するための指標としては、(1)非穿刺部位におけるナトリウムイオン抽出速度(単位時間あたりに発汗チェック用収集部材100に収集されたナトリウムイオンの総量)に対する閾値、及び(2)本測定用収集部材10に収集されたナトリウムイオンの濃度CNa1から得られるナトリウムイオン抽出速度に対する非穿刺部位のナトリウムイオン抽出速度(単位時間あたりに発汗チェック用収集部材100に収集されたナトリウムイオンの総量)の相対値(以下、「Na相対値」という)のいずれかを用いることができる。これらの指標に対して閾値を設定し、被験者から得られた指標と閾値とを比較することにより、グルコース濃度CGlu及びナトリウムイオン濃度CNa1に基づいて信頼性の高い血糖AUCが得られるか否かを判断することができる。かかる閾値は、実験により予め求めることができる。以下、実験的に設定される閾値の例を説明する。
発汗の多い症例と発汗の少ない症例とを分類するための指標としては、(1)非穿刺部位におけるナトリウムイオン抽出速度(単位時間あたりに発汗チェック用収集部材100に収集されたナトリウムイオンの総量)に対する閾値、及び(2)本測定用収集部材10に収集されたナトリウムイオンの濃度CNa1から得られるナトリウムイオン抽出速度に対する非穿刺部位のナトリウムイオン抽出速度(単位時間あたりに発汗チェック用収集部材100に収集されたナトリウムイオンの総量)の相対値(以下、「Na相対値」という)のいずれかを用いることができる。これらの指標に対して閾値を設定し、被験者から得られた指標と閾値とを比較することにより、グルコース濃度CGlu及びナトリウムイオン濃度CNa1に基づいて信頼性の高い血糖AUCが得られるか否かを判断することができる。かかる閾値は、実験により予め求めることができる。以下、実験的に設定される閾値の例を説明する。
図13は、複数の症例に関するグルコース透過率(縦軸)と、ナトリウムイオン抽出速度(横軸)との関係を示すグラフである。図14は、図13のデータを、ナトリウムイオン抽出速度JNa2に対する閾値に基づいて区分したグラフである。図15は、図13のデータを、相対Na値に対する閾値に基づいて区分したグラフである。
図13~15のデータを得るにあたっては、本実施形態における組織液および汗に含まれる成分の収集と並行して、所定時間毎に複数回採血を行った。組織液に含まれるグルコース及びナトリウムイオン並びに後述の式(1)に基づいて血糖AUCを算出した(推定血糖AUCという)。また、複数回の採血によって得られた複数時点における血糖値から周知の台形近似法によって血糖AUCを算出した(採血血糖AUCという)。
図13~15のデータを得るにあたっては、本実施形態における組織液および汗に含まれる成分の収集と並行して、所定時間毎に複数回採血を行った。組織液に含まれるグルコース及びナトリウムイオン並びに後述の式(1)に基づいて血糖AUCを算出した(推定血糖AUCという)。また、複数回の採血によって得られた複数時点における血糖値から周知の台形近似法によって血糖AUCを算出した(採血血糖AUCという)。
図13の縦軸に示したグルコース透過率とは、本測定用収集部材10に収集されたグルコース量を採血血糖AUCで除した値である。つまり、グルコース透過率は、体内の血糖AUCに対して体外で抽出されるグルコース量の比率を示している。一方、ナトリウムイオン抽出速度とは、単位時間あたりに本測定用収集体10に収集されたナトリウムイオンの量のことである。
図13に示した症例の中から、発汗が多い例(記号◆)と、発汗が少ない例(記号▲)とを抽出した。それぞれの測定結果を、以下の表1に示す。

なお、Na相対値は、次の式に基づいて求めた。
Na相対値={(JNa2)-(定数γ)}÷(JNa1)
ここで、定数γ=0.047として計算した。ナトリウムイオンは全く発汗しない場合でも皮膚からわずかな量だけ検出されるが、定数γは、このような場合に検出されるNa値の誤差を除去することができる値が用いられる。
Na相対値={(JNa2)-(定数γ)}÷(JNa1)
ここで、定数γ=0.047として計算した。ナトリウムイオンは全く発汗しない場合でも皮膚からわずかな量だけ検出されるが、定数γは、このような場合に検出されるNa値の誤差を除去することができる値が用いられる。
<ナトリウムイオン抽出速度JNa2に対する閾値>
ナトリウムイオン抽出速度JNa2に対する閾値の一例として、0.04(μmol/h)なる値を用いた。つまり、発汗チェック用収集体に収集された単位時間あたりのナトリウムイオン量が0.04(umol/h)を超える症例が除外される。この閾値を用いて図13に示される症例を区分した。結果を図14に示す。
ナトリウムイオン抽出速度JNa2に対する閾値の一例として、0.04(μmol/h)なる値を用いた。つまり、発汗チェック用収集体に収集された単位時間あたりのナトリウムイオン量が0.04(umol/h)を超える症例が除外される。この閾値を用いて図13に示される症例を区分した。結果を図14に示す。
図14において、縦軸は測定値乖離率、横軸は非穿刺部位におけるナトリウムイオン抽出速度JNa2である。測定値乖離率は、各症例について測定した推定血糖AUCと採血血糖AUCとの比であり、これが1に近いほど推定血糖AUCの信頼性が高いことを示す。図14に示されるように、ナトリウムイオン抽出速度JNa2に対する閾値を0.04とすることにより、測定値乖離率が0.8を下回るような信頼性の低い測定結果を多数排除することができる。
<Na相対値に対する閾値>
Na相対値に対する閾値の一例として、0.045なる値を用いた。この閾値を用いて図13に示される症例を区分した。結果を図15に示す。図15において、縦軸は測定値乖離率、横軸はNa相対値である。
図15に示されるように、Na相対値に対する閾値を0.045とすることにより、測定値乖離率が0.8を下回るような信頼性の低い測定結果を多数排除することができる。
Na相対値に対する閾値の一例として、0.045なる値を用いた。この閾値を用いて図13に示される症例を区分した。結果を図15に示す。図15において、縦軸は測定値乖離率、横軸はNa相対値である。
図15に示されるように、Na相対値に対する閾値を0.045とすることにより、測定値乖離率が0.8を下回るような信頼性の低い測定結果を多数排除することができる。
ナトリウムイオン抽出速度JNa2に対する閾値を用いる場合には、発汗量の多い症例を、ナトリウムイオン抽出速度JNa1を測定することなく除外することができる。したがって、信頼性の低い解析結果となることが予見されるような症例について、無駄な本測定を回避できる利点がある。
Na相対値に対する閾値を用いる場合には、ナトリウムイオン抽出速度JNa1に対してナトリウムイオン抽出速度JNa2の影響が相対的に大きい症例のみを排除することができる。したがって、ナトリウムイオン抽出速度JNa2の絶対値は比較的大きいものの、本測定への影響が小さいと考えられる症例については、本測定の結果を棄却することなく、本測定の結果を有効に活用することができる。
なお、第1実施形態においては、ナトリウムイオン抽出速度JNa2に対する閾値を用いて、発汗量の多い症例を除外する形態を説明する。
なお、第1実施形態においては、ナトリウムイオン抽出速度JNa2に対する閾値を用いて、発汗量の多い症例を除外する形態を説明する。
図12に戻って、ナトリウムイオン抽出速度JNa2が閾値以下である場合(ステップS8において「No」)、ステップS10において、本測定用収集部材10が本測定用カートリッジ40の所定箇所に貼付され、当該本測定用カートリッジ40が生体成分分析装置20のカートリッジ配置部22にセットされる。
ついで、ステップS11において、生体成分分析装置20によって上述した測定処理が実行されることにより、グルコース濃度CGlu及びナトリウムイオン濃度CNa1が測定される。ついで、制御部35は、グルコース濃度CGlu及びナトリウムイオン濃度CNa1と下記式(1)とに基づいて血糖AUCを算出する。
AUC=CGlu×V/{α×(CNa1×V/t)+β} ・・・(1)
式(1)において、Vは本測定用収集部材10の収集体12の体積である。α及びβは実験により求められる定数である。式(1)に基づいて血糖AUCが算出される原理については、国際公開公報第2010/013808号に詳細に説明されている。国際公開公報第2010/013808号は本明細書において参照として組み込まれる。
ついで、ステップS12において、算出された結果が制御部35によって表示部33に出力される。
AUC=CGlu×V/{α×(CNa1×V/t)+β} ・・・(1)
式(1)において、Vは本測定用収集部材10の収集体12の体積である。α及びβは実験により求められる定数である。式(1)に基づいて血糖AUCが算出される原理については、国際公開公報第2010/013808号に詳細に説明されている。国際公開公報第2010/013808号は本明細書において参照として組み込まれる。
ついで、ステップS12において、算出された結果が制御部35によって表示部33に出力される。
本実施の形態では、微細孔形成処理が施されていない皮膚Rからの汗に含まれるナトリウムイオンを収集し、収集されたナトリウムイオン濃度が閾値よりも高い場合に本測定(CGlu及びCNa1の測定並びに血糖AUCの解析)を行わないようにすることで、信頼性の低い血糖AUC解析を回避することができる。
〔効果の検証〕
以下、第1実施形態による生体成分分析方法による測定精度の向上例について説明する。 図16は、乖離症例を除外する前のグルコース透過率とナトリウムイオン抽出速度の相関を示すグラフである。図17は、推定血糖AUC値と採血血糖AUC値(測定血糖AUC値)の相関を示すグラフである。図18は、測定値乖離率と非穿刺部位におけるナトリウムイオン抽出速度の関係を示すグラフである。図19は、図16に対応するグラフであり、乖離症例を除外したグルコース透過率とナトリウムイオン抽出速度の相関を示すグラフである。図20は、図17に対応するグラフであり、乖離症例を除外した推定血糖AUCと採血血糖AUCの相関を示すグラフである。
以下、第1実施形態による生体成分分析方法による測定精度の向上例について説明する。 図16は、乖離症例を除外する前のグルコース透過率とナトリウムイオン抽出速度の相関を示すグラフである。図17は、推定血糖AUC値と採血血糖AUC値(測定血糖AUC値)の相関を示すグラフである。図18は、測定値乖離率と非穿刺部位におけるナトリウムイオン抽出速度の関係を示すグラフである。図19は、図16に対応するグラフであり、乖離症例を除外したグルコース透過率とナトリウムイオン抽出速度の相関を示すグラフである。図20は、図17に対応するグラフであり、乖離症例を除外した推定血糖AUCと採血血糖AUCの相関を示すグラフである。
図16~18において、「●」は糖尿病患者の症例であり、「×」は健常人の症例である。また、○で囲んだものが乖離症例(発汗量が多く、測定値乖離率が1から大きく離れている症例)である。乖離症例は、すべて糖尿病患者に認められた。
図16~20のデータを得るにあたっては、本実施形態における組織液および汗に含まれる成分の収集と並行して、所定時間毎に複数回採血を行った。組織液に含まれるグルコース及びナトリウムイオン並びに上述の式(1)に基づいて血糖AUCを算出した(推定血糖AUCという)。また、複数回の採血によって得られた複数時点における血糖値から周知の台形近似法によって血糖AUCを算出した(採血血糖AUCという)。
図16~20のデータを得るにあたっては、本実施形態における組織液および汗に含まれる成分の収集と並行して、所定時間毎に複数回採血を行った。組織液に含まれるグルコース及びナトリウムイオン並びに上述の式(1)に基づいて血糖AUCを算出した(推定血糖AUCという)。また、複数回の採血によって得られた複数時点における血糖値から周知の台形近似法によって血糖AUCを算出した(採血血糖AUCという)。
図16は、グルコース透過率を縦軸とし、ナトリウムイオン抽出速度を横軸としたグラフである。グルコース透過率とは、本測定用収集部材10に収集されたグルコース量を採血血糖AUCで除した値である。つまり、グルコース透過率は、体内の血糖AUCに対して体外で抽出されるグルコース量の比率を示している。ナトリウムイオン抽出速度とは、単位時間あたりに本測定用収集部材10に収集されたナトリウムイオンの量である。国際公開公報2010/013808号に詳細に記載されているように、ナトリウムイオン抽出速度とグルコース透過率とは相関関係にある。図16に示すように、ナトリウムイオン抽出速度とグルコース透過率をプロットすると、一定の傾きからなる回帰直線の周辺にプロットが収束する。
被験者が発汗すると、汗に由来するナトリウムイオンが本測定用収集部材10に余分に収集される。その結果、図16に丸印で示したように、ナトリウムイオン抽出速度のみが増大し、回帰直線に対してプロットが右側にシフトする。図16に示したプロット全てを対象として相関係数を求めたところ、相関係数は0.81であった。
図16に示したデータについて、推定血糖AUC値と採血血糖AUC値の相関を調べた。結果を図17に示す。
図17は、推定血糖AUCを縦軸とし、横軸を採血血糖AUCを横軸としたグラフである。図17に丸印で示したように、発汗の多い症例はナトリウムイオン濃度の増大に起因して、推定血糖AUCと血糖AUCとの乖離が大きい。図17に示した全症例について相関係数を求めたところ、相関係数は0.68であった。
図17は、推定血糖AUCを縦軸とし、横軸を採血血糖AUCを横軸としたグラフである。図17に丸印で示したように、発汗の多い症例はナトリウムイオン濃度の増大に起因して、推定血糖AUCと血糖AUCとの乖離が大きい。図17に示した全症例について相関係数を求めたところ、相関係数は0.68であった。
図18は、測定値乖離率を縦軸とし、非穿刺部位におけるナトリウムイオン抽出速度を横軸としたグラフである。図18に示した測定値乖離率とは、図17に示した推定血糖AUCを採血血糖AUCで除した値である。測定値乖離率が1に近いほど、推定血糖AUCの信頼性が高いことを意味する。図18に示すように、測定値乖離率は、非穿刺部位におけるナトリウムイオン抽出速度が増大するにしたがって、低下している。そこで、本例では、非穿刺部位におけるナトリウムイオン抽出速度が0.06(μmol/h)を超える5症例10部位のデータを解析対象から除外し、再度解析を行った。その結果を図19及び図20に示す。
5症例10部位の乖離症例を解析対象から除外すると、図19に示されるように、グルコース透過率とナトリウムイオン抽出速度との相関係数が0.81から0.90に向上した。さらに、図20に示されるように、推定血糖AUC値と血糖AUC値との相関係数が0.68から0.82に向上した。このことから、発汗チェック用収集部材100に収集されたナトリウムイオン量に基づいて、発汗の多い症例についての本測定を回避することにより、信頼性の低い血糖AUC推定値の解析がユーザに提供されることが防止されることが実証された。
(第2の実施形態)
つぎに本発明の第2実施形態の生体成分分析方法について説明する。図21は、第2の実施形態に係る生体成分分析方法のフローチャートである。
第1の実施形態では、発汗測定の結果(JNa2)に基づいて、本測定(CGlu及びCNa1の測定)及び血糖AUCの算出を実行するか否かを決定する形態を例示した。第2の実施形態では、発汗測定及び本測定を実行したうえで、血糖AUCの信頼性に関する情報を血糖AUCの解析結果とともに出力する。
つぎに本発明の第2実施形態の生体成分分析方法について説明する。図21は、第2の実施形態に係る生体成分分析方法のフローチャートである。
第1の実施形態では、発汗測定の結果(JNa2)に基づいて、本測定(CGlu及びCNa1の測定)及び血糖AUCの算出を実行するか否かを決定する形態を例示した。第2の実施形態では、発汗測定及び本測定を実行したうえで、血糖AUCの信頼性に関する情報を血糖AUCの解析結果とともに出力する。
図21のフローチャートにおいて、ステップS101~105の工程は、図12に示した第1実施形態におけるステップS1~5と同じであるから、ステップS101~S105については詳細な説明を省略し、ステップS106~S111の分析工程について詳細に説明する。ステップS106~S111は、ステップS104において収集された成分を分析する工程である。
まず、ステップS106において、発汗チェック用収集部材100が発汗測定装置60にセットされ、ステップS107において、収集体120に収集されたナトリウムイオンの濃度CNa2が測定される。ついで、ステップS108において、本測定用収集部材10が本測定用カートリッジ40の所定箇所に貼付され、本測定用カートリッジ40が生体成分分析装置20のカートリッジ配置部22にセットされる。ステップS109において、収集体12に収集されたグルコース濃度CGlu及びナトリウムイオン濃度CNa1が測定され、グルコース濃度CGlu及びナトリウムイオン濃度CNa1に基づいて血糖AUC推定値が算出される。
ついでステップS110において、ユーザによって、ステップS107において得られたナトリウムイオン抽出速度JNa2が生体成分分析装置20に入力される。ステップS111において、制御部35によって解析結果が生成され、ステップS112において、生成された解析結果が表示部33に出力される。
図22は、ステップS111において制御部35により実行される処理のフローチャートである。
まず、制御部35は、ステップS121において、入力されたナトリウムイオン抽出速度JNa2と閾値とを比較し、ナトリウムイオン抽出速度JNa2が閾値以上であるか否かを判断する。閾値以上であると判断した場合(ステップS121においてYES)、制御部35は、ステップS122に処理を進める。ステップS122において、制御部35は、ステップS109で算出された血糖AUCと、この血糖AUCの信頼性が低いことを示すフラグ情報とを含む解析結果を生成する。一方、ナトリウムイオン抽出速度JNa2が閾値未満であると判断した場合(ステップS122においてNO)、制御部35は、ステップS123に処理を進める。ステップS123において、制御部35は、ステップS109で算出された血糖AUCのみを含む解析結果を生成する。ナトリウムイオン抽出速度JNa2が閾値未満である場合には、血糖AUCの信頼性は高いため、解析結果にフラグ情報は含まれない。
第2実施形態によれば、被験者が血糖AUCの算出結果に影響を及ぼす程発汗した場合に、血糖AUCの信頼性が低下したことをユーザに知らせることができる。ユーザは、このフラグ情報を、出力された血糖AUCを利用するか否かの決定に役立てることができる。
なお、第2の実施形態では、JNa2を閾値と比較する形態を示したが、JNa1及びJNa2に基づいてNa相対値を求め、Na相対値と閾値とを比較する形態であってもよい。
まず、制御部35は、ステップS121において、入力されたナトリウムイオン抽出速度JNa2と閾値とを比較し、ナトリウムイオン抽出速度JNa2が閾値以上であるか否かを判断する。閾値以上であると判断した場合(ステップS121においてYES)、制御部35は、ステップS122に処理を進める。ステップS122において、制御部35は、ステップS109で算出された血糖AUCと、この血糖AUCの信頼性が低いことを示すフラグ情報とを含む解析結果を生成する。一方、ナトリウムイオン抽出速度JNa2が閾値未満であると判断した場合(ステップS122においてNO)、制御部35は、ステップS123に処理を進める。ステップS123において、制御部35は、ステップS109で算出された血糖AUCのみを含む解析結果を生成する。ナトリウムイオン抽出速度JNa2が閾値未満である場合には、血糖AUCの信頼性は高いため、解析結果にフラグ情報は含まれない。
第2実施形態によれば、被験者が血糖AUCの算出結果に影響を及ぼす程発汗した場合に、血糖AUCの信頼性が低下したことをユーザに知らせることができる。ユーザは、このフラグ情報を、出力された血糖AUCを利用するか否かの決定に役立てることができる。
なお、第2の実施形態では、JNa2を閾値と比較する形態を示したが、JNa1及びJNa2に基づいてNa相対値を求め、Na相対値と閾値とを比較する形態であってもよい。
(第3の実施形態)
前述した第1及び第2実施形態では、1つの閾値を設定し、ナトリウムイオン抽出速度JNa2が閾値よりも高いか否かの判断をしているが、複数の段階的な閾値を設定することもできる。例えば2つの閾値(第1の閾値と、これよりも大きい第2の閾値)を設定し、ナトリウムイオン抽出速度JNa2に応じて異なる解析結果を生成するように構成してもよい。
前述した第1及び第2実施形態では、1つの閾値を設定し、ナトリウムイオン抽出速度JNa2が閾値よりも高いか否かの判断をしているが、複数の段階的な閾値を設定することもできる。例えば2つの閾値(第1の閾値と、これよりも大きい第2の閾値)を設定し、ナトリウムイオン抽出速度JNa2に応じて異なる解析結果を生成するように構成してもよい。
図23は、第3の実施形態に係る生体成分分析方法における制御部の処理を示すフローチャートである。第3の実施形態は、制御部35による処理を除いて図21のステップS101~S112と同じであるので、ここでは説明を省略する。
まず、ステップS131において、制御部35は、ナトリウムイオン抽出速度JNa2が第1の閾値以上であるか否かを判断する。ここで、第1の閾値としては、血糖AUCの解析結果を棄却するほどではないが、血糖AUCの解析に影響を及ぼす値が設定される。制御部35は、ナトリウムイオン抽出速度JNa2が第1の閾値以上であると判断した場合(ステップS131においてYES)、ステップS132に処理を進め、ナトリウムイオン濃度CNa2が第1の閾値未満であると判断した場合(ステップS131においてNO)、ステップS136に処理を進める。
ステップS136において、制御部35は、ステップS109で算出された血糖AUCのみを含む解析結果を生成する。
ステップS132において、制御部35は、ナトリウムイオン抽出速度JNa2が、第2の閾値以上であるか否かを判断する。ここで、第2の閾値としては、第1の閾値よりも大きい値であって、血糖AUCの解析結果を棄却する必要が生じる値が設定される。制御部35は、ナトリウムイオン抽出速度JNa2が第2の閾値以上であると判断した場合(ステップS132においてYES)、ステップS133に処理を進め、ナトリウムイオン抽出速度JNa2が第2の閾値未満であると判断した場合(ステップS132においてNO)、ステップS134に処理を進める。
ステップS132において、制御部35は、ナトリウムイオン抽出速度JNa2が、第2の閾値以上であるか否かを判断する。ここで、第2の閾値としては、第1の閾値よりも大きい値であって、血糖AUCの解析結果を棄却する必要が生じる値が設定される。制御部35は、ナトリウムイオン抽出速度JNa2が第2の閾値以上であると判断した場合(ステップS132においてYES)、ステップS133に処理を進め、ナトリウムイオン抽出速度JNa2が第2の閾値未満であると判断した場合(ステップS132においてNO)、ステップS134に処理を進める。
ステップS134において、制御部35は、ステップS109で算出された血糖AUCと、この血糖AUCの信頼性が低い旨のフラグ情報を含む解析結果を生成する。
ステップS133において、制御部35は、「解析結果の信頼性を保証できないため血糖AUCの解析結果を表示できません。再測定を行ってください」といった内容のメッセージを含む解析結果を生成する。この場合、ステップS109で算出された血糖AUCは解析結果に含まれない。
ステップS133において、制御部35は、「解析結果の信頼性を保証できないため血糖AUCの解析結果を表示できません。再測定を行ってください」といった内容のメッセージを含む解析結果を生成する。この場合、ステップS109で算出された血糖AUCは解析結果に含まれない。
第3実施形態によれば、被験者の発汗量に応じて異なる解析結果を出力することができる。さらに、血糖AUCの解析結果を棄却する必要が生じる程被験者が発汗したときには、血糖AUCの解析結果を出力しない旨のメッセージを出力することにより、発汗量を抑えて再度測定を行うことを促すことができる。
なお、第3の実施形態では、JNa2を閾値と比較する形態を示したが、JNa1及びJNa2に基づいてNa相対値を求め、Na相対値と閾値とを比較する形態であってもよい。
なお、第3の実施形態では、JNa2を閾値と比較する形態を示したが、JNa1及びJNa2に基づいてNa相対値を求め、Na相対値と閾値とを比較する形態であってもよい。
(第4の実施形態)
前述した実施の形態では、JNa2を本測定に進むか否かの判断材料として用いるか(第1の実施形態)、又は、JNa2の測定に続いて本測定を行い、JNa2の値によっては血糖AUCの解析結果の信頼性が低い旨の表示をしている(第2又は第3の実施形態)が、第1補助成分の量に関する値から、第2補助成分の量に関する値を減じるなどの補正処理を行うことで、測定対象成分の解析の精度を向上させることも可能である。
前述した実施の形態では、JNa2を本測定に進むか否かの判断材料として用いるか(第1の実施形態)、又は、JNa2の測定に続いて本測定を行い、JNa2の値によっては血糖AUCの解析結果の信頼性が低い旨の表示をしている(第2又は第3の実施形態)が、第1補助成分の量に関する値から、第2補助成分の量に関する値を減じるなどの補正処理を行うことで、測定対象成分の解析の精度を向上させることも可能である。
本実施形態では、かかる補正処理を行うことで測定対象成分の解析の精度を向上させている。図25は、第4の実施形態における生体成分分析方法のフローチャートである。
ステップT1(微細孔形成処理)からステップT5(本測定用収集部材及び発汗用収集部材の取り外し)までの処理内容は、図12に示される第1の実施形態におけるステップS1からステップS5までのものと同様であるので、簡単のため、それらについての説明は省略する。
ステップT1(微細孔形成処理)からステップT5(本測定用収集部材及び発汗用収集部材の取り外し)までの処理内容は、図12に示される第1の実施形態におけるステップS1からステップS5までのものと同様であるので、簡単のため、それらについての説明は省略する。
ステップT6~ステップT10は、ステップT4において収集された各成分を分析する工程である。本実施の形態では、分析時間を短縮するために、発汗チェック用収集部材で収集された成分と、本測定用収集部材で収集された成分とを並行して分析している。
まず、ステップT6において、被験者の皮膚から取り外された発汗チェック用収集部材100が発汗測定装置60にセットされる。発汗測定装置60の対向電極61a及び61bが、発汗チェック用収集部材100の収集体120に埋設されるように、発汗チェック用収集部材100が発汗測定装置60にセットされる。
まず、ステップT6において、被験者の皮膚から取り外された発汗チェック用収集部材100が発汗測定装置60にセットされる。発汗測定装置60の対向電極61a及び61bが、発汗チェック用収集部材100の収集体120に埋設されるように、発汗チェック用収集部材100が発汗測定装置60にセットされる。
ついで、ステップT7において、発汗チェック用収集部材100の収集体120の導電率を測定することで、収集体120に含まれるナトリウムイオン濃度CNa2を測定する。発汗測定装置60によって測定されたナトリウムイオン濃度CNa2は、表示部60cに表示される。そして、測定されたナトリウムイオン濃度CNa2が操作ボタン34によって生体成分分析装置20に入力されると、制御部35は、入力されたナトリウムイオン濃度CNa2に基づいて以下の式に従い、非穿刺部位のナトリウムイオン抽出速度JNa2を算出する。
JNa2=CNa2×V2/t
ここで、V2は発汗チェック用収集部材100の収集体120の体積であり、tは抽出時間である。
JNa2=CNa2×V2/t
ここで、V2は発汗チェック用収集部材100の収集体120の体積であり、tは抽出時間である。
一方、ステップT6と並行して、ステップT8において、本測定用収集部材10が本測定用カートリッジ40の所定箇所に貼付され、当該本測定用カートリッジ40が生体成分分析装置20のカートリッジ配置部22にセットされる。
ついで、ステップT9において、生体成分分析装置20によって上述した測定処理が実行されることにより、グルコース濃度CGlu及びナトリウムイオン濃度CNa1が測定される。ついで、制御部35は、グルコース濃度CGlu及びナトリウムイオン濃度CNa1と下記式とに基づいて、抽出グルコース量MGlu及び穿刺部位のナトリウムイオン抽出速度JNa1を算出する。
MGlu=CGlu×V1
JNa1=CNa1×V1/t
ここで、V1は本測定用収集部材10の収集体12の体積であり、tは抽出時間である。
MGlu=CGlu×V1
JNa1=CNa1×V1/t
ここで、V1は本測定用収集部材10の収集体12の体積であり、tは抽出時間である。
ついで、ステップT10において、制御部35は、ステップT7において算出されたJNa2及びステップT9において算出されたMGlu及びJNa1を用いて下記式(2)に従い補正された血糖AUC推定値を算出する。

ここで、α及びβは実験により求められる定数である。
ついで、ステップT11において、制御部35によって解析結果が生成され、ステップT12において、生成された解析結果が表示部33に出力される。
ついで、ステップT11において、制御部35によって解析結果が生成され、ステップT12において、生成された解析結果が表示部33に出力される。
図26は、第4の実施形態に係る生体成分分析方法における制御部の処理を示すフローチャートである。
まず、ステップT131において、制御部35は、ナトリウムイオン抽出速度JNa2が第1の閾値以上であるか否かを判断する。ここで、第1の閾値としては、血糖AUCの解析結果を棄却するほどではないが、血糖AUCの解析に影響を及ぼす値が設定される。制御部35は、ナトリウムイオン抽出速度JNa2が第1の閾値以上であると判断した場合(ステップT131においてYes)、ステップT132に処理を進め、ナトリウムイオン抽出速度JNa2が第1の閾値未満であると判断した場合(ステップT131においてNo)、ステップT136に処理を進める。
ステップT136において、制御部35は、ステップT9で算出された血糖AUCを含む解析結果を生成する。
ステップT132において、制御部35は、ナトリウムイオン抽出速度JNa2が、第2の閾値以上であるか否かを判断する。ここで、第2の閾値としては、第1の閾値よりも大きい値であって、血糖AUCの解析結果を棄却する必要が生じる値が設定される。制御部35は、ナトリウムイオン抽出速度JNa2が第2の閾値以上であると判断した場合(ステップT132においてYes)、ステップT133に処理を進め、ナトリウムイオン抽出速度JNa2が第2の閾値未満であると判断した場合(ステップT132においてNo)、ステップT134に処理を進める。
ステップT132において、制御部35は、ナトリウムイオン抽出速度JNa2が、第2の閾値以上であるか否かを判断する。ここで、第2の閾値としては、第1の閾値よりも大きい値であって、血糖AUCの解析結果を棄却する必要が生じる値が設定される。制御部35は、ナトリウムイオン抽出速度JNa2が第2の閾値以上であると判断した場合(ステップT132においてYes)、ステップT133に処理を進め、ナトリウムイオン抽出速度JNa2が第2の閾値未満であると判断した場合(ステップT132においてNo)、ステップT134に処理を進める。
ステップT134において、制御部35は、ステップT10で算出された、補正された血糖AUC推定値を含む解析結果を生成する。
ステップT133において、制御部35は、「解析結果の信頼性を保証できないため血糖AUCの解析結果を表示できません。再測定を行ってください」といった内容のメッセージを含む解析結果を生成する。この場合、ステップT9及びT10で算出された血糖AUCは解析結果に含まれない。
ステップT133において、制御部35は、「解析結果の信頼性を保証できないため血糖AUCの解析結果を表示できません。再測定を行ってください」といった内容のメッセージを含む解析結果を生成する。この場合、ステップT9及びT10で算出された血糖AUCは解析結果に含まれない。
第4実施形態によれば、被験者の発汗量に応じて異なる解析結果を出力することができる。このような構成にすることにより、汗の影響が補正できる程度の発汗であれば、補正値を用いて血糖AUC推定値を出力することができる。さらに、血糖AUCの解析結果を棄却する必要が生じる程被験者が発汗したときには、血糖AUCの解析結果を出力しない旨のメッセージを出力することにより、発汗量を抑えて再度測定を行うことを促すことができる。
〔効果の検証〕
以下、第4実施形態に係る生体成分分析方法による測定精度の向上例について説明する。図27は、前述した発汗補正を行わなかったときの複数の被験者におけるグルコース透過率(PGlu)とナトリウムイオン抽出速度(JNa1)の相関を示すグラフであり、図28は、非穿刺部位におけるナトリウムイオン抽出速度(JNa2)と測定値乖離率との関係を示すグラフであり、図29は、上記式(2)による発汗補正を行ったときのグルコース透過率(PGlu)とナトリウムイオン抽出速度(JNa1-JNa2)の相関を示すグラフである。図27~29及び後出する図30において、「□」は室温24℃の条件下における実験例であり、「+」は室温31℃の条件下における実験例である。
以下、第4実施形態に係る生体成分分析方法による測定精度の向上例について説明する。図27は、前述した発汗補正を行わなかったときの複数の被験者におけるグルコース透過率(PGlu)とナトリウムイオン抽出速度(JNa1)の相関を示すグラフであり、図28は、非穿刺部位におけるナトリウムイオン抽出速度(JNa2)と測定値乖離率との関係を示すグラフであり、図29は、上記式(2)による発汗補正を行ったときのグルコース透過率(PGlu)とナトリウムイオン抽出速度(JNa1-JNa2)の相関を示すグラフである。図27~29及び後出する図30において、「□」は室温24℃の条件下における実験例であり、「+」は室温31℃の条件下における実験例である。
図27は、グルコース透過率を縦軸とし、ナトリウムイオン抽出速度を横軸としたグラフである。グルコース透過率とは、本測定用収集部材10に収集されたグルコース量を採血血糖AUCで除した値である。つまり、グルコース透過率は、体内の血糖AUCに対して体外で抽出されるグルコース量の比率を示している。ナトリウムイオン抽出速度とは、単位時間あたりに本測定用収集部材100に収集されたナトリウムイオンの量である。国際公開公報2010/013808号に詳細に記載されているように、ナトリウムイオン抽出速度とグルコース透過率とは相関関係にある。図27に示すように、ナトリウムイオン抽出速度とグルコース透過率をプロットすると、一定の傾きからなる回帰直線の周辺にプロットが収束する。
ところが、被験者が発汗すると、汗に由来するナトリウムイオンが本測定用収集部材10に余分に収集される。この傾向は、室温が高くなるほど増大する。31℃での測定においては、発汗由来のナトリウムイオン量がより多く上乗せされるため、発汗の少ない24℃での測定データに対して右方向に偏った分布となる。図27に示したプロット全てを対象として相関係数を求めたところ、相関係数は0.95であった。また、測定誤差(測定値乖離率の標準偏差)は10.8%であった。さらに、31℃における測定を行った10症例中3症例が発汗により、測定値乖離率0.8以下という低い値を示した。
図28より、31℃の場合は24℃の場合に比べ、発汗由来のナトリウムイオンの抽出速度が大幅に増大していること、及び、測定値乖離率が0.8以下の例が増加することが分かる。
図28より、31℃の場合は24℃の場合に比べ、発汗由来のナトリウムイオンの抽出速度が大幅に増大していること、及び、測定値乖離率が0.8以下の例が増加することが分かる。
これに対し、穿刺部位のナトリウムイオン抽出速度JNa1から非穿刺部位のナトリウムイオン抽出速度JNa2を減じるという発汗補正を行うと、図29に示されるように、24℃と31℃の測定データの分布の偏りは解消し、測定精度が向上した。図29に示したプロット全てを対象として相関係数を求めたところ、相関係数は0.96であった。また、測定誤差は8.6%に減少した。さらに、測定乖離率が0.8を下回る症例がゼロとなった。
図30は補正前と補正後のそれぞれの測定値乖離率を示すグラフである。発汗の少ない24℃では大きな変化が見られなかったが、発汗の多い31℃では、補正前の測定値乖離率の平均値は約0.87であったが、補正後の平均値は約1.0であり、測定精度が改善されたことが確認された。
〔他の変形例〕
なお、本発明は、前述した実施の形態に限定されるものではなく、種々の変更が可能である。
なお、本発明は、前述した実施の形態に限定されるものではなく、種々の変更が可能である。
上記実施形態では、測定対象成分としてグルコースを測定した例を示したが、本発明はこれに限らず、組織液中に含まれるグルコース以外の物質の量を測定してもよい。本発明により測定される物質としては、たとえば、生化学成分や被験者に投与された薬剤などが挙げられる。生化学成分としては、生化学成分の一種であるたんぱく質の、アルブミン、グロブリンおよび酵素などが挙げられる。また、たんぱく質以外の生化学成分として、クレアチニン、クレアチン、尿酸、アミノ酸、フルクトース、ガラクトース、ペントース、グリコーゲン、乳酸、ピルビン酸およびケトン体などが挙げられる。また、薬剤としては、ジギタリス製剤、テオフィリン、不整脈用剤、抗てんかん剤、アミノ酸糖体抗生物質、グリコペプチド系抗生物質、抗血栓剤および免疫抑制剤などが挙げられる。
また、上述した実施形態では、第1補助成分及び第2補助成分としてナトリウムイオンを用いる例を示したが、本発明はこれに限られない。
例えば、第1補助成分と第2補助成分は、異なる成分であってもよい。
第1補助成分としては、体内に一定の濃度で含まれている成分であって、微細孔の形成状態を反映する成分であればよく、ナトリウムイオンの他に、カリウムイオン、カルシウムイオン、マグネシウムイオンなどの無機イオンを用いることができる。
第2補助成分としては、汗に含まれる成分であればよく、ナトリウムイオンの他に、カリウムイオン、カルシウムイオン、マグネシウムイオンなどの無機イオン、または水分であってもよい。
例えば、第1補助成分と第2補助成分は、異なる成分であってもよい。
第1補助成分としては、体内に一定の濃度で含まれている成分であって、微細孔の形成状態を反映する成分であればよく、ナトリウムイオンの他に、カリウムイオン、カルシウムイオン、マグネシウムイオンなどの無機イオンを用いることができる。
第2補助成分としては、汗に含まれる成分であればよく、ナトリウムイオンの他に、カリウムイオン、カルシウムイオン、マグネシウムイオンなどの無機イオン、または水分であってもよい。
また、前述した実施の形態では、発汗測定装置60と、本測定を行う生体成分分析装置20とは別体であるが、両装置を一体化させることもできる。この場合、本測定用の収集部材10を貼付した本測定用カートリッジ40とは別に、発汗チェック用の収集部材100を貼付するための発汗チェック用カートリッジを設け、これを生体成分分析装置20の配置部22に配置することにより、生体成分分析装置20において、発汗測定及び本測定を行うようにしてもよい。さらなる変形例として、本測定用収集部材10と発汗チェック用収集部材100とを貼付可能な共通のカートリッジを設け、このカートリッジを受け入れ可能な分析装置を設けてもよい。これにより、二つの収集部材に収集された成分を同時に分析することができる。
また、前述した実施の形態では、本測定用収集部材10と発汗チェック用収集部材100とを別体とした例を示したが、図24に示すように、これらを一体としてもよい。図24は、共通収集部材400の構成を示す斜視図である。この共通収集部材400は、本測定用の第1収集部310と発汗チェック用の第2収集部320とを備えている。第1収集部310は、前述の本測定用収集部材10と同じ構成からなり、本測定用の収集体312を備えている。第2収集部320は、前述の発汗チェック用収集部材100と同じ構成からなり、発汗チェック用の収集体322を備えている。収集体312及び収集体322は、共通保持シート330に保持されている。共通保持シート330は、前述の保持シートと同じ構成からなっている。共通保持シート330には、第1収集部310と第2収集部320とを分断するためのミシン目340が設けられている。
この共通収集部材400は、次のようにして使用される。本測定用の収集体312が微細孔形成領域Sに位置し、発汗チェック用の収集体322が非穿刺部位Rに位置するように、共通保持シート330を被験者の皮膚に貼付する。成分の収集が終了したのち、共通収集部材400は皮膚から取り外され、ミシン目340に沿って第1収集部310と第2収集部320とに分断される。第1収集部310は生体成分分析装置20によって本測定が行われ、第2収集部320は発汗測定装置60によって発汗測定が行われる。
このように、収集部材を一体とすることにより、組織液が抽出される部位(穿刺部位S)に近い位置で汗を収集することができ、第1収集部310と第2収集部320とで、収集される汗の量の差を小さくすることができる。
このように、収集部材を一体とすることにより、組織液が抽出される部位(穿刺部位S)に近い位置で汗を収集することができ、第1収集部310と第2収集部320とで、収集される汗の量の差を小さくすることができる。
また、前述した実施の形態では、発汗測定装置によって測定されたナトリウムイオン抽出速度JNa2を、ユーザが生体成分分析装置に入力する形態を例示したが、このような形態に限られない。例えば、発汗測定装置と生体成分分析装置とを通信可能に接続し、発汗測定装置で得られた結果(データ)を生体成分分析装置の制御部に送信するように構成することもできる。
10 本測定用収集部材
11 保持シート
12 収集体
20 生体成分分析装置
22 カートリッジ配置部
23 可動天板
24 送液部
25 廃液部
26 タンク
30 検出部
31 グルコース検出部
32 ナトリウムイオン検出部
33 表示部
34 操作ボタン
35 制御部
40 本測定用カートリッジ
100 発汗チェック用収集部材
200 微細針チップ
201 微細針
300 皮膚
301 微細孔
400 共通収集部材
P 穿刺具(微細孔形成装置)
11 保持シート
12 収集体
20 生体成分分析装置
22 カートリッジ配置部
23 可動天板
24 送液部
25 廃液部
26 タンク
30 検出部
31 グルコース検出部
32 ナトリウムイオン検出部
33 表示部
34 操作ボタン
35 制御部
40 本測定用カートリッジ
100 発汗チェック用収集部材
200 微細針チップ
201 微細針
300 皮膚
301 微細孔
400 共通収集部材
P 穿刺具(微細孔形成装置)
Claims (22)
- 被験者の皮膚から抽出された組織液に含まれる成分を分析する生体成分分析方法であって、
組織液の抽出を促進する処理を被験者の皮膚の一部に施す工程と、
促進処理が施された皮膚から測定対象成分を収集する工程と、
促進処理が施された皮膚から第1補助成分を収集する工程と、
促進処理が施されていない皮膚から汗に含まれる第2補助成分を収集する工程と、
収集された測定対象成分、第1補助成分及び第2補助成分に基づいて、測定対象成分を分析する工程と
を含むことを特徴とする生体成分分析方法。 - 前記第1補助成分と第2補助成分は、同じ期間に収集される、請求項1に記載の生体成分分析方法。
- 前記第1補助成分と第2補助成分は、同じ腕において収集される、請求項1又は2に記載の生体成分分析方法。
- 前記分析工程は、
収集された第2補助成分を測定して第1測定値を取得する第1測定工程と、
第1測定値と所定の閾値とを比較する工程と、
第1測定値が所定の閾値より小さい場合に、収集された測定対象成分を測定して第2測定値を取得する第2測定工程と、
第1測定値が所定の閾値より小さい場合に、収集された第1補助成分を測定して第3測定値を取得する第3測定工程と、
第2及び第3測定値に基づいて、測定対象成分の量に関する値を含む解析結果を生成する工程を含む、請求項1~3のいずれか一項に記載の生体成分分析方法。 - 前記分析工程は、
収集された第2補助成分を測定して第1測定値を取得する第1測定工程と、
収集された測定対象成分を測定して第2測定値を取得する第2測定工程と、
収集された第1補助成分を測定して第3測定値を取得する第3測定工程と、
第1乃至第3測定値に基づいて、測定対象成分の解析結果を生成する工程と、
を含む、請求項1~3のいずれか一項に記載の生体成分分析方法。 - 前記解析結果を生成する工程は、
第1測定値と所定の閾値とを比較する工程と、
第1測定値が所定の閾値以上である場合に、第2及び第3の測定値に基づく測定対象成分の量に関する値と、この値の信頼性が低いことを示す情報とを含む解析結果を生成する工程を含む、請求項5に記載の生体成分分析方法。 - 前記解析結果を生成する工程は、
第1測定値と所定の閾値とを比較する工程と、
第1測定値が所定の閾値以上である場合に、測定対象成分の量に関する値を出力しない旨のメッセージを含む解析結果を生成する工程を含む、請求項5に記載の生体成分分析方法。 - 前記解析結果を生成する工程は、
第1測定値と、第1の閾値及び第1の閾値より大きい第2の閾値とを比較する工程と、
第1測定値が第1の閾値以上であり且つ第2の閾値より小さい場合に、第2及び第3の測定値に基づく測定対象成分の量に関する値と、この値の信頼性が低いことを示す情報とを含む解析結果を生成する工程と、
第1測定値が第2の閾値以上である場合に、測定対象成分の量に関する値を出力しない旨のメッセージを含む解析結果を生成する工程と、
を含む、請求項5に記載の生体成分分析方法。 - 第1測定値は、第2補助成分の量に関する値であり、
第2測定値は、測定対象成分の量に関する値であり、且つ
第3測定値は、第1補助成分の量に関する値である、請求項5に記載の生体成分分析方法。 - 分析工程は、第1測定値及び第3測定値に基づいて得られる補正値で第2測定値を補正することにより測定対象成分の解析結果を生成する、請求項9に記載の生体成分分析方法。
- 補正値は、第3測定値から第1測定値を減ずることにより得られた値である、請求項10に記載の生体成分分析方法。
- 量に関する値は、単位時間あたりの補助成分の抽出量である、請求項11に記載の生体成分分析方法。
- 前記解析結果を生成する工程は、
第1測定値と、第1の閾値及び第1の閾値より大きい第2の閾値とを比較する工程と、
第1測定値が第1の閾値以上であり且つ第2の閾値より小さい場合に、第1及び第3の測定値に基づく補正値で第2測定値を補正することにより測定対象成分の解析結果を生成する工程と、
第1測定値が第2の閾値以上である場合に、測定対象成分の量に関する値を出力しない旨のメッセージを含む解析結果を生成する工程と、
を含む、請求項9~12のいずれか一項に記載の生体成分分析方法。 - 前記測定対象成分はグルコースである、請求項1~13のいずれか一項に記載の生体成分分析方法。
- 前記第1補助成分及び第2補助成分は無機イオンである、請求項1~14のいずれか一項に記載の生体成分分析方法。
- 前記第1補助成分と第2補助成分は同一種類の成分である、請求項1~15のいずれか一項に記載の生体成分分析方法。
- 前記無機イオンはナトリウムイオンである請求項15に記載の生体成分分析方法。
- 前記測定対象成分及び第1補助成分が、被験者の皮膚に貼付可能な貼付面を有する保持シートの当該貼付面に配置された収集体に収集される、請求項1~17のいずれか一項に記載の生体成分分析方法。
- 前記収集体がゲルからなる、請求項18に記載の生体成分分析方法。
- 被験者の皮膚から抽出される組織液に含まれる成分を分析する生体成分分析装置であって、
前記成分の抽出を促進する処理が施された被験者の皮膚の一部に所定時間配置された収集部材から測定対象成分及び第1補助成分に関する情報を取得する取得部と、
この取得部において取得された測定対象成分及び第1補助成分に関する情報と、促進処理が施されていない皮膚からの汗に含まれる第2補助成分に関する情報とに基づいて、測定対象成分を分析する解析部と
を備えたことを特徴とする生体成分分析装置。 - 前記第2補助成分に関する情報を取得する第2取得部を更に備えている請求項20に記載の生体成分分析装置。
- 前記第2補助成分に関する情報を受け付ける情報受付部を更に備えている請求項20に記載の生体成分分析装置。
Priority Applications (2)
| Application Number | Priority Date | Filing Date | Title |
|---|---|---|---|
| CN201180016299.4A CN102812360B (zh) | 2010-03-29 | 2011-03-28 | 生物成分分析方法及生物成分分析装置 |
| US13/614,616 US20130006080A1 (en) | 2010-03-29 | 2012-09-13 | Living body component analyzing method and living body component analyzing apparatus |
Applications Claiming Priority (4)
| Application Number | Priority Date | Filing Date | Title |
|---|---|---|---|
| JP2010-075807 | 2010-03-29 | ||
| JP2010075807 | 2010-03-29 | ||
| JP2010-217638 | 2010-09-28 | ||
| JP2010217638A JP5735773B2 (ja) | 2010-03-29 | 2010-09-28 | 生体成分分析方法及び生体成分分析装置 |
Related Child Applications (1)
| Application Number | Title | Priority Date | Filing Date |
|---|---|---|---|
| US13/614,616 Continuation US20130006080A1 (en) | 2010-03-29 | 2012-09-13 | Living body component analyzing method and living body component analyzing apparatus |
Publications (1)
| Publication Number | Publication Date |
|---|---|
| WO2011122534A1 true WO2011122534A1 (ja) | 2011-10-06 |
Family
ID=44712230
Family Applications (1)
| Application Number | Title | Priority Date | Filing Date |
|---|---|---|---|
| PCT/JP2011/057558 Ceased WO2011122534A1 (ja) | 2010-03-29 | 2011-03-28 | 生体成分分析方法及び生体成分分析装置 |
Country Status (4)
| Country | Link |
|---|---|
| US (1) | US20130006080A1 (ja) |
| JP (1) | JP5735773B2 (ja) |
| CN (1) | CN102812360B (ja) |
| WO (1) | WO2011122534A1 (ja) |
Families Citing this family (7)
| Publication number | Priority date | Publication date | Assignee | Title |
|---|---|---|---|---|
| JP6130130B2 (ja) * | 2012-12-04 | 2017-05-17 | シスメックス株式会社 | 体液収集具 |
| JP5931776B2 (ja) * | 2013-02-26 | 2016-06-08 | シスメックス株式会社 | 体液収集体保持シートの支持キット、体液収集体の保護方法、及び体液収集体の取出方法 |
| EP2961471B1 (en) * | 2013-02-28 | 2023-10-25 | Sorrento Therapeutics, Inc. | Transdermal drug delivery device |
| US9377353B2 (en) * | 2014-06-27 | 2016-06-28 | Intel Corporation | Optical perspiration sensor using frustrated total internal reflection |
| JP2019132733A (ja) * | 2018-01-31 | 2019-08-08 | シスメックス株式会社 | 生体内成分測定装置及び生体内成分測定方法 |
| JP7412694B2 (ja) * | 2019-08-26 | 2024-01-15 | 公立大学法人公立諏訪東京理科大学 | 塩分濃度計測装置、頭部装着装置、及び塩分濃度計測方法 |
| JP2021038944A (ja) * | 2019-08-30 | 2021-03-11 | シスメックス株式会社 | 前処理方法及び生体内成分測定装置 |
Citations (8)
| Publication number | Priority date | Publication date | Assignee | Title |
|---|---|---|---|---|
| JPH06119B2 (ja) * | 1985-09-26 | 1994-01-05 | 株式会社日立製作所 | 汗中有機物及び電解質検出用経皮センサ |
| JP2004223115A (ja) * | 2003-01-27 | 2004-08-12 | Terumo Corp | 体液採取具 |
| JP2005334281A (ja) * | 2004-05-26 | 2005-12-08 | Matsushita Electric Works Ltd | 生体信号測定方法及び生体信号測定装置 |
| JP2007127424A (ja) * | 2005-10-31 | 2007-05-24 | Toray Ind Inc | 高脂血症またはその発症リスクの判定方法、総コレステロール測定方法およびキット |
| JP3963485B2 (ja) * | 1997-04-11 | 2007-08-22 | アルザ コーポレイション | 最小限での侵入性の検出用装置 |
| JP2009518113A (ja) * | 2005-12-09 | 2009-05-07 | フレキシブル メディカル システムズ, エルエルシー | 監視および送達のための可撓性装置および方法 |
| JP2009136526A (ja) * | 2007-12-07 | 2009-06-25 | Omron Corp | 分析チップ |
| WO2010013808A1 (ja) * | 2008-07-31 | 2010-02-04 | シスメックス株式会社 | 生体内成分測定方法、生体内成分測定のためのデータ処理方法、生体内成分測定装置および収集部材 |
Family Cites Families (6)
| Publication number | Priority date | Publication date | Assignee | Title |
|---|---|---|---|---|
| EP1270041A1 (en) * | 2001-06-22 | 2003-01-02 | Universite De Geneve | Device for non-invasively determining the relative levels of two substances present in a biological system |
| JP2008504881A (ja) * | 2004-07-01 | 2008-02-21 | ヴィヴォメディカル, インコーポレイテッド | 非侵襲性グルコース測定 |
| US20060127964A1 (en) * | 2004-07-30 | 2006-06-15 | Russell Ford | Microprocessors, devices, and methods for use in monitoring of physiological analytes |
| EP1719447A1 (de) * | 2005-05-07 | 2006-11-08 | F. Hoffmann-La Roche AG | Verfahren und Vorrichtung zur Bestimmung der Glucose-Konzentration in Gewebflüssigkeit |
| GB2441784A (en) * | 2006-09-13 | 2008-03-19 | Rtc North Ltd | Device for obtaining and analysing a biological fluid |
| JP2010271259A (ja) * | 2009-05-25 | 2010-12-02 | Sysmex Corp | 生体成分分析方法、生体成分分析装置、生体成分分析用カートリッジおよび生体成分分析用キット |
-
2010
- 2010-09-28 JP JP2010217638A patent/JP5735773B2/ja not_active Expired - Fee Related
-
2011
- 2011-03-28 WO PCT/JP2011/057558 patent/WO2011122534A1/ja not_active Ceased
- 2011-03-28 CN CN201180016299.4A patent/CN102812360B/zh not_active Expired - Fee Related
-
2012
- 2012-09-13 US US13/614,616 patent/US20130006080A1/en not_active Abandoned
Patent Citations (8)
| Publication number | Priority date | Publication date | Assignee | Title |
|---|---|---|---|---|
| JPH06119B2 (ja) * | 1985-09-26 | 1994-01-05 | 株式会社日立製作所 | 汗中有機物及び電解質検出用経皮センサ |
| JP3963485B2 (ja) * | 1997-04-11 | 2007-08-22 | アルザ コーポレイション | 最小限での侵入性の検出用装置 |
| JP2004223115A (ja) * | 2003-01-27 | 2004-08-12 | Terumo Corp | 体液採取具 |
| JP2005334281A (ja) * | 2004-05-26 | 2005-12-08 | Matsushita Electric Works Ltd | 生体信号測定方法及び生体信号測定装置 |
| JP2007127424A (ja) * | 2005-10-31 | 2007-05-24 | Toray Ind Inc | 高脂血症またはその発症リスクの判定方法、総コレステロール測定方法およびキット |
| JP2009518113A (ja) * | 2005-12-09 | 2009-05-07 | フレキシブル メディカル システムズ, エルエルシー | 監視および送達のための可撓性装置および方法 |
| JP2009136526A (ja) * | 2007-12-07 | 2009-06-25 | Omron Corp | 分析チップ |
| WO2010013808A1 (ja) * | 2008-07-31 | 2010-02-04 | シスメックス株式会社 | 生体内成分測定方法、生体内成分測定のためのデータ処理方法、生体内成分測定装置および収集部材 |
Also Published As
| Publication number | Publication date |
|---|---|
| US20130006080A1 (en) | 2013-01-03 |
| JP5735773B2 (ja) | 2015-06-17 |
| CN102812360B (zh) | 2015-06-10 |
| JP2011227042A (ja) | 2011-11-10 |
| CN102812360A (zh) | 2012-12-05 |
Similar Documents
| Publication | Publication Date | Title |
|---|---|---|
| JP5735773B2 (ja) | 生体成分分析方法及び生体成分分析装置 | |
| CN100356893C (zh) | 体液采样用具 | |
| JP4817692B2 (ja) | 分析装置 | |
| CN103040475B (zh) | 葡萄糖耐量分析装置、葡萄糖耐量分析系统及存储介质 | |
| US20050064528A1 (en) | Non-or minimally invasive monitoring methods | |
| JPH08504337A (ja) | 代謝的に有意義な物質の体液中の濃度の生体内測定のための方法及び装置 | |
| JP5470010B2 (ja) | 生体内成分測定方法および生体内成分測定装置 | |
| US8046043B2 (en) | Extraction device, analyzer, extraction method, and analysis method | |
| JP5350382B2 (ja) | 生体内成分測定方法、生体内成分測定のためのデータ処理方法、および、生体内成分測定装置 | |
| US20210148888A1 (en) | Accurate Sensing of Physiological Substance in Blood | |
| JP2009506810A (ja) | 体液を採集する構造およびその製造方法 | |
| JP5801590B2 (ja) | 生体成分測定方法 | |
| WO2004084727A1 (ja) | 体液採取具および体液採取方法 | |
| JP5419771B2 (ja) | 診断支援方法、診断支援システム及び診断支援装置 | |
| JP2019132733A (ja) | 生体内成分測定装置及び生体内成分測定方法 | |
| JP4987527B2 (ja) | 皮膚透過率測定方法、成分濃度分析方法、皮膚透過率測定装置および成分濃度分析装置 | |
| JP2004033376A (ja) | 穿刺針一体型体液採取具 | |
| EP2901929B1 (en) | Positioning tape | |
| JP4280033B2 (ja) | 体液採取具 | |
| JP2004290477A (ja) | 成分測定装置および成分測定キット | |
| JP4262499B2 (ja) | 穿刺具 | |
| CN103845086B (zh) | 体液收集用具 |
Legal Events
| Date | Code | Title | Description |
|---|---|---|---|
| WWE | Wipo information: entry into national phase |
Ref document number: 201180016299.4 Country of ref document: CN |
|
| 121 | Ep: the epo has been informed by wipo that ep was designated in this application |
Ref document number: 11762758 Country of ref document: EP Kind code of ref document: A1 |
|
| NENP | Non-entry into the national phase |
Ref country code: DE |
|
| 122 | Ep: pct application non-entry in european phase |
Ref document number: 11762758 Country of ref document: EP Kind code of ref document: A1 |