WO2010092919A1 - 医用画像表示方法、医用画像診断装置、及び医用画像表示装置 - Google Patents
医用画像表示方法、医用画像診断装置、及び医用画像表示装置 Download PDFInfo
- Publication number
- WO2010092919A1 WO2010092919A1 PCT/JP2010/051765 JP2010051765W WO2010092919A1 WO 2010092919 A1 WO2010092919 A1 WO 2010092919A1 JP 2010051765 W JP2010051765 W JP 2010051765W WO 2010092919 A1 WO2010092919 A1 WO 2010092919A1
- Authority
- WO
- WIPO (PCT)
- Prior art keywords
- line
- heart chamber
- volume
- trace line
- lumen
- Prior art date
- Legal status (The legal status is an assumption and is not a legal conclusion. Google has not performed a legal analysis and makes no representation as to the accuracy of the status listed.)
- Ceased
Links
Images





Classifications
-
- A—HUMAN NECESSITIES
- A61—MEDICAL OR VETERINARY SCIENCE; HYGIENE
- A61B—DIAGNOSIS; SURGERY; IDENTIFICATION
- A61B8/00—Diagnosis using ultrasonic, sonic or infrasonic waves
- A61B8/08—Clinical applications
- A61B8/0858—Clinical applications involving measuring tissue layers, e.g. skin, interfaces
-
- A—HUMAN NECESSITIES
- A61—MEDICAL OR VETERINARY SCIENCE; HYGIENE
- A61B—DIAGNOSIS; SURGERY; IDENTIFICATION
- A61B5/00—Measuring for diagnostic purposes; Identification of persons
- A61B5/103—Measuring devices for testing the shape, pattern, colour, size or movement of the body or parts thereof, for diagnostic purposes
- A61B5/107—Measuring physical dimensions, e.g. size of the entire body or parts thereof
- A61B5/1075—Measuring physical dimensions, e.g. size of the entire body or parts thereof for measuring dimensions by non-invasive methods, e.g. for determining thickness of tissue layer
-
- A—HUMAN NECESSITIES
- A61—MEDICAL OR VETERINARY SCIENCE; HYGIENE
- A61B—DIAGNOSIS; SURGERY; IDENTIFICATION
- A61B8/00—Diagnosis using ultrasonic, sonic or infrasonic waves
- A61B8/13—Tomography
- A61B8/14—Echo-tomography
-
- A—HUMAN NECESSITIES
- A61—MEDICAL OR VETERINARY SCIENCE; HYGIENE
- A61B—DIAGNOSIS; SURGERY; IDENTIFICATION
- A61B8/00—Diagnosis using ultrasonic, sonic or infrasonic waves
- A61B8/46—Ultrasonic, sonic or infrasonic diagnostic devices with special arrangements for interfacing with the operator or the patient
- A61B8/461—Displaying means of special interest
- A61B8/463—Displaying means of special interest characterised by displaying multiple images or images and diagnostic data on one display
-
- G—PHYSICS
- G06—COMPUTING OR CALCULATING; COUNTING
- G06T—IMAGE DATA PROCESSING OR GENERATION, IN GENERAL
- G06T7/00—Image analysis
- G06T7/60—Analysis of geometric attributes
- G06T7/62—Analysis of geometric attributes of area, perimeter, diameter or volume
-
- A—HUMAN NECESSITIES
- A61—MEDICAL OR VETERINARY SCIENCE; HYGIENE
- A61B—DIAGNOSIS; SURGERY; IDENTIFICATION
- A61B6/00—Apparatus or devices for radiation diagnosis; Apparatus or devices for radiation diagnosis combined with radiation therapy equipment
- A61B6/50—Apparatus or devices for radiation diagnosis; Apparatus or devices for radiation diagnosis combined with radiation therapy equipment specially adapted for specific body parts; specially adapted for specific clinical applications
- A61B6/503—Apparatus or devices for radiation diagnosis; Apparatus or devices for radiation diagnosis combined with radiation therapy equipment specially adapted for specific body parts; specially adapted for specific clinical applications for diagnosis of the heart
-
- A—HUMAN NECESSITIES
- A61—MEDICAL OR VETERINARY SCIENCE; HYGIENE
- A61B—DIAGNOSIS; SURGERY; IDENTIFICATION
- A61B8/00—Diagnosis using ultrasonic, sonic or infrasonic waves
- A61B8/08—Clinical applications
- A61B8/0883—Clinical applications for diagnosis of the heart
-
- G—PHYSICS
- G06—COMPUTING OR CALCULATING; COUNTING
- G06T—IMAGE DATA PROCESSING OR GENERATION, IN GENERAL
- G06T2207/00—Indexing scheme for image analysis or image enhancement
- G06T2207/10—Image acquisition modality
- G06T2207/10072—Tomographic images
-
- G—PHYSICS
- G06—COMPUTING OR CALCULATING; COUNTING
- G06T—IMAGE DATA PROCESSING OR GENERATION, IN GENERAL
- G06T2207/00—Indexing scheme for image analysis or image enhancement
- G06T2207/30—Subject of image; Context of image processing
- G06T2207/30004—Biomedical image processing
- G06T2207/30048—Heart; Cardiac
Definitions
- the present invention relates to a medical image display method, a diagnostic device, and a display device, and more particularly to a technique for accurately measuring the volume of a heart chamber of a subject by a disk method.
- an ultrasonic diagnostic apparatus transmits an ultrasonic wave inside a subject using an ultrasonic probe and receives an ultrasonic reflected echo signal corresponding to the structure of a living tissue from the inside of the subject, for example, a B-mode image Or the like.
- Such a medical diagnostic imaging apparatus is known to measure the volume of the heart chamber such as the left ventricle and the left atrium communicated via the heart valve of the subject.
- Volume measurement is to calculate the volume of the region surrounded by the inner wall of the heart chamber and the annulus using the Area-Length method or the Modified-Simpson method (disc method).
- the volume can be easily calculated from a two-dimensional image by assuming the heart chamber to be a rotating body, and therefore, it is used as a general volume measurement method in clinical examinations.
- the both ends of the trace line are connected to each other.
- An annulus corresponding to the annulus plane is generated, and a heart chamber axis is generated by connecting the center of the annulus and the farthest position of the inner chamber trace line.
- the heart chamber region is divided into a plurality of sections by a plurality of section lines perpendicular to the heart chamber axis, each section is regarded as a disk, the disk volume is obtained, and the sum of the respective disk volumes is calculated as the heart chamber volume.
- Patent Document 1 describes that a local volume change of the heart is calculated by cutting a part of the disk perpendicularly to the disk surface and calculating a partial volume, thereby detecting an abnormal local wall motion of the heart. .
- Patent Document 1 does not take into account accurate calculation of the heart chamber volume when the annulus surface and the heart chamber axis are not perpendicular.
- the annulus plane (the annulus line) and the heart chamber axis are vertical. It may not be possible. In this case, the volume is accurately calculated in the region where both ends of the segmented line generated perpendicular to the heart chamber axis intersect the heart chamber inner wall, but one end of the segment line intersects the heart chamber inner wall and the other end is In the area intersecting the valve annulus, the disk volume is calculated to be smaller than the actual volume, or because there are areas where the heart chamber axis is interrupted at the valve annulus and the disk itself is not created, the total volume is calculated too small. Will be.
- volume of the heart chamber is an important diagnostic material for grasping abnormalities in the form and function of the heart, more accurate calculation of the volume value is required.
- an object of the present invention is to accurately calculate the heart chamber volume even when the annulus surface of the heart and the heart chamber axis are not perpendicular to each other.
- the medical image display method of the present invention displays a tomographic image obtained by imaging a tomogram of an organ of a subject on a display unit, and based on the displayed tomographic image, a lumen surrounded by a lumen inner wall surface of the organ The volume of the area is obtained.
- the medical image display method of the present invention displays a tomographic image obtained by imaging a tomographic image of the heart of a subject on a display unit, and based on the displayed tomographic image, the inner wall surface and the annulus of the heart The volume of the heart chamber region surrounded by the surface is obtained.
- a step of calculating the heart chamber volume of the first heart chamber region by a plurality of segment lines by a disk method, a segment line closest to the annulus, annulus and heart The step of calculating the heart chamber volume of the second heart chamber region surrounded by the intracavity trace line by the pseudo disk method, and the total heart chamber by the sum of the calculated heart chamber volumes of the first and second heart chamber regions Calculating the volume; and first and second heart chamber regions It is characterized in that it comprises a step of displaying the cavity volume and the whole heart chamber volume.
- the volume is calculated by a conventionally known disk method, while the segment line and valve closest to the annulus are calculated.
- the volume is calculated by the pseudo disk method for the area (second heart chamber area) that is surrounded by the circular line and the inner wall trace line and the volume may be excessively calculated when the general disk method is applied. ing. According to this, since the volumes of both the first heart chamber region and the second heart chamber region can be obtained with high accuracy, the sum of these can be obtained with high accuracy as the volume of the entire heart chamber region.
- the step of calculating the heart chamber volume of the second heart chamber region by the pseudo disk method is a step of generating a virtual trace line opposed to the inner wall trace line constituting the second heart chamber region across the heart chamber axis. Generating a plurality of virtual segment lines perpendicular to the heart chamber axis and having one end intersecting the virtual trace line and the other end intersecting the heart chamber inner trace line, and the virtual trace line, virtual segment line, and heart chamber inner wall trace line Generating a virtual disk based on the above, and cutting the virtual disk at the annulus surface to calculate the volume of the partial disk on the side including the inner wall trace line as the heart chamber volume of the second heart chamber region And a virtual trace line and a virtual dividing line can be displayed on the display unit.
- a virtual disk is generated using the virtual trace line and the virtual segment line, and a necessary part of the virtual disk (including the inner wall trace line cut by the annulus surface) is included.
- the volume of the disk is calculated with the disk on the recording side as a partial disk.
- a medical image diagnostic apparatus includes a display unit that displays a tomographic image obtained by imaging a tomogram of an organ of a subject, and an inner wall of an organ based on the tomographic image displayed on the display unit. And a calculation unit for determining the volume of the enclosed lumen region.
- Means for displaying a means for calculating the lumen volume of the first lumen region by a plurality of segment lines by a disk method, a segment line closest to the line among a plurality of segment lines, the line and the lumen Means for calculating the lumen volume of the second lumen region surrounded by the trace line by the pseudo disk method, and the total lumen volume by the sum of the calculated lumen volumes of the first and second lumen regions Means for calculating the lumen volume of the first and second lumen
- the medical image diagnostic apparatus of the present invention includes a display unit that displays a tomographic image obtained by imaging a tomographic image of the heart of a subject, and a heart chamber inner wall surface based on the tomographic image displayed on the display unit. And a calculation unit for determining the volume of the heart chamber region surrounded by the annulus surface.
- the medical image display device of the present invention displays a tomographic image obtained by imaging a tomographic image of the heart of the subject on the display unit, and based on the displayed tomographic image, the inner wall surface of the heart chamber and the annulus The volume of the heart chamber region surrounded by the surface is obtained.
- the medical image consists of a heart chamber contour line consisting of a heart chamber inner wall trace line corresponding to the heart chamber inner wall surface and a valve annulus surface corresponding to the annulus surface, and the center of the valve ring line and the center of the heart chamber inner wall trace line. It can be configured with an image displaying a heart chamber axis passing through a distant position and a plurality of segment lines perpendicular to the heart chamber axis. In particular, a first heart chamber region where both ends of the segment line intersect the heart chamber inner trace line, and a second heart chamber region where one end of the segment line intersects the annulus and the other end intersects the heart chamber inner trace line.
- Different display modes can be displayed.
- the heart chamber volume can be calculated with high accuracy even when the annulus surface of the heart and the heart chamber axis are not perpendicular to each other.
- FIG. 1 is a block diagram showing an outline of the overall configuration of an ultrasonic diagnostic apparatus according to this embodiment.
- An example of an ultrasonic tomogram depicting the left ventricle and left atrium The figure which shows the processing flow which calculates
- the figure which shows the method of calculating the volume of the partial disk which cuts the virtual disk diagonally with the disk method of minute height The figure which shows the modification 1 of generation of a virtual trace line
- the figure which shows the modification 2 of generation of a virtual trace line The figure which shows the modification 3 of generation of a virtual trace line
- the figure which shows the modification 4 of generation of a virtual trace line The figure which shows the modification 1 of the method of calculating the volume of a virtual disk
- an ultrasonic diagnostic apparatus will be described as an example of a medical image diagnostic apparatus and a medical image display apparatus.
- the present invention can be applied to an apparatus that captures and displays a tomographic image of a tissue at an examination site of a subject, such as an X-ray CT apparatus and a magnetic resonance imaging (MRI) apparatus.
- MRI magnetic resonance imaging
- FIG. 1 is a block diagram showing an outline of the overall configuration of the ultrasonic diagnostic apparatus according to this embodiment.
- the ultrasound diagnostic apparatus includes an ultrasound signal generation unit 1 that transmits and receives ultrasound to and from the subject, an ultrasound image generation unit 2 that generates an ultrasound image from the ultrasound signal, and a trace.
- Calculation unit 3 for generating lines and disks and calculating the volume of the heart chamber, storage unit 4 for storing programs and measurement results, input unit 5 for specifying the contour position of the heart chamber, measurement values and results
- a display unit 6 for displaying an image and a control unit 7 for controlling the whole are provided. Solid arrows indicate control, and white arrows indicate the flow of image signal data.
- the ultrasonic signal generation unit 1 generates an ultrasonic signal by transmitting / receiving ultrasonic waves to / from the subject, and includes a probe 11 and an ultrasonic signal transmission / reception unit 12.
- the probe 11 is a device that transmits and receives ultrasonic waves and converts them into electrical signals, and has a scanning method such as a linear type, a convex type, and a sector type.
- the ultrasonic signal transmitting / receiving unit 12 transmits / receives an electrified ultrasonic signal to / from the probe. Then, the received signal is passed through a phasing circuit to obtain an ultrasonic signal.
- the ultrasonic image generation unit 2 generates an ultrasonic image from the signal input from the ultrasonic signal generation unit 1 based on the imaging setting of the apparatus, and includes a two-dimensional cross-sectional image generation unit 21.
- the two-dimensional cross-sectional image generation unit 21 generates a tomographic image such as a B-mode image from an ultrasonic signal obtained by imaging a tomogram of an imaging region such as the heart of the subject.
- the calculation unit 3 generates trace lines and disks for applying the disk method, and calculates the volume.
- the virtual trace line generation unit 31, the disk generation unit 32, the volume calculation unit 33, and the trace lines And a tracking calculation unit.
- the virtual trace line generation unit 31 performs an operation for generating a virtual trace line by extending the inner wall trace line, which is the outline of the inner wall surface of the heart chamber, to generate a disk so as to fill the heart chamber.
- the disk generation unit 32 performs an operation of generating a disk using the inner chamber wall trace line, the virtual trace line, and the annulus surface.
- the volume calculation unit 33 calculates the volume of the generated disk and calculates the sum as a heart chamber volume.
- the trace line tracking calculation unit 34 tracks the position of the trace line for each frame and calculates a deformed heart chamber outline position.
- the storage unit 4 is a device for storing an algorithm in the calculation unit 3 and a program for controlling each unit, and storing a calculation result and an ultrasonic signal.
- a storage device such as a hard disk, a semiconductor memory, or an optical disk
- a program storage unit 41 and a measurement result storage unit 42 are provided.
- the program storage unit 41 stores a program in which algorithms such as virtual trace line generation, disk generation, volume calculation, and trace line tracking calculation in the calculation unit 3 and programs for controlling each unit are stored.
- the measurement result storage unit 42 stores measurement result data calculated by the calculation unit 3, and stores ultrasonic signal data and the like output from each unit.
- the input unit 5 includes a heart chamber trace designating unit 51.
- the heart chamber trace specifying unit 51 can be used as an input interface such as a keyboard, a trackball, and a switch as an input device for tracing a position corresponding to the inner wall surface of the heart chamber on a tomographic image, for example, or can be traced by fully automatic processing. You can also In addition, there are provided a method in which the examiner designates several positions corresponding to the inner wall surface of the heart chamber and traces based on this, and an interface for setting manually.
- the display unit 6 includes an interface that displays and outputs measurement values and images
- the image display unit 61 includes a B-mode image output from the ultrasonic image generation unit 2, a disk generated by the calculation unit, and a volume value. Is displayed on the screen.
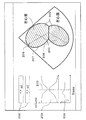
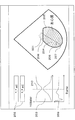
- FIG. 2 shows an example of an ultrasonic tomogram depicting the left ventricle and the left atrium.
- the examiner first draws an image including the heart chamber to be measured on the measurement screen based on the volume measurement by the conventional disk method.
- the contour of the position corresponding to the inner wall surface of the heart chamber is traced by the heart chamber trace designating unit 51 using the input device.
- the tracing may be performed manually by the examiner, or a known method in which the apparatus automatically traces may be used.
- the annulus line 208 and the cardiac chamber axis 206 are automatically generated by the apparatus. Further, a disk by the segment line 204 orthogonal to the heart chamber axis 206, a virtual disk by the virtual segment line 205, and the like are generated, and the volume is calculated. The calculated volume is displayed and output on the measurement screen. The examiner may manually trace up to the virtual trace.
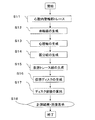
- FIG. 3 is a diagram showing a processing flow for obtaining the heart chamber volume of the present embodiment.
- the examiner first traces the contour corresponding to the inner wall surface of the heart chamber to generate the inner chamber wall trace line 207 (S11).
- the contour corresponding to the inner wall of the heart chamber is traced by the heart chamber trace designating unit 51 using the input device. This traces from the annulus of the heart chamber to the opposite annulus.
- a known method in which the apparatus automatically traces may be used.
- two trace lines of the left ventricle and the left atrium may be set and measured simultaneously.
- the annulus line 208 corresponding to the annulus surface is generated by connecting both ends of the intracardiac wall trace line (S12). Subsequently, a heart chamber axis 206 passing through the center of the annulus line 208 and the farthest point of the inner wall trace line 207 from the center is generated (S13). Subsequently, a plurality of segment lines 204 that are orthogonal to the heart chamber axis 206 and segment the heart chamber region are generated (S14).
- a virtual trace line 501 is generated by the virtual trace line generation unit 31 (S15). That is, in the disc method, it is assumed that the heart chamber axis 206 is perpendicular to the annulus 208 as shown in the left of FIG. After tracing from one annulus position to the opposite annulus position, the heart chamber axis 206 is set to connect the farthest position on the inner wall trace line 207 from the midpoint of the annulus line 208.
- the disc by segment line 204 has a diameter in a direction perpendicular to the chamber axis. The total volume of the created disks is obtained as the volume of the heart chamber.
- both ends of the partition line 204 intersect with the intracardiac wall trace line 207 to create a disc sandwiched between the intracardiac wall trace lines 207, but in the section 2, the partition line 204
- One end of the tube intersects the intracardiac trace line 207, but the other end intersects the annulus 208, so that the diameter of the disk is interrupted at the annulus 208, the disk becomes smaller than the actual, and the volume is calculated to be too small. It will be.
- the heart chamber axis 206 is interrupted, so that no disk is created and the volume is not calculated.
- the intracardiac trace line 207 is always interrupted at the annulus, by virtually extending this, a virtual disk that fills the area of sections 2 and 3 on the right side of FIG.
- the disk method is improved so as to create and calculate a more accurate volume value.
- FIG. 5 shows a method of extrapolating the virtual trace line 501 based on the inner wall trace line of the heart chamber.
- the virtual trace line 501 is generated so as to oppose the inner wall trace line 207 constituting the second cardiac chamber region and the cardiac chamber axis 206.
- the intracardiac trace line 207 is a set of points, which is applied to a curve function such as a spline, and a point where the intracardiac trace line is interrupted is generated by extrapolation calculation.
- the intracardiac trace line 207 in FIG. 5 generates a virtual trace line 501 (broken line portion) by extrapolation, although it is interrupted at the annulus.
- the intracardiac wall trace line 207 is extrapolated and extended from one end point of the intracardiac wall trace line 207 to form a virtual trace line 501.
- One end point is an end point where a line perpendicular to the heart chamber axis 206 intersects the annulus line 208 among both end points of the inner wall trace line 207.
- the virtual trace line 501 may have a closed shape connected to both ends of the intracardiac wall trace line 207 in accordance with an image processing method.
- a virtual trace line 501 extending from one end point of the intracardiac wall trace line 207 ends at a point where it intersects with a line orthogonal to the cardiac chamber axis 206 from the other end point of the intracardiac wall trace line 207.
- a virtual disk is created by the disk generation unit 32 (S16).
- the virtual trace line 501 is generated as described above, a plurality of virtual traces orthogonal to the heart chamber axis 206 are formed between the virtual trace line 501 and the heart chamber inner wall trace line 207 opposite to the heart chamber axis 206 in line symmetry.
- a virtual disk is created by the dividing line 205.
- the virtual segment line 205 is perpendicular to the heart chamber axis, one end intersects with the virtual trace line 501 and the other end intersects with the heart chamber inner wall trace line 207.
- a virtual disk is generated based on the virtual trace line 501, virtual partition line 205, and intracardiac wall trace line 207.
- the virtual disk is a partial disk that is cut obliquely by the annulus surface and includes the heart chamber inner wall trace line 207 and is necessary for volume calculation.
- FIG. 6 is a diagram showing a GUI in a correction mode in which the virtual trace line 501 is finely adjusted manually.
- a virtual trace line 501, a heart chamber axis 206, and a virtual segment line 205 are displayed.
- the examiner performs adjustment by operating the input device to change the position and length of the virtual trace line 501.
- the position and length of the virtual partition line 205 are also deformed, and the shape of the virtual disk is also deformed.
- the volume value also changes.
- the volume is recalculated and displayed in the cardiac chamber volume measurement value 202.
- the volume calculation unit 33 calculates the volume of the disk, sums the calculated volume, and obtains the volume of the heart chamber (S17).
- An area corresponding to the section 1 in FIG. 4, that is, an area (first cardiac chamber area) formed by a plurality of segment lines 204 whose both ends cross the cardiac chamber inner wall trace line 207 is obtained by a conventional general disk method.
- the region corresponding to the sections 2 and 3 in FIG. 4 that is, the segment line closest to the annulus line 208, the annulus line 208, and the inner wall of the heart chamber among a plurality of segment lines intersecting the inner chamber trace line 207 at both ends.
- the area surrounded by the trace line 207 (second heart chamber area) must be calculated using the pseudo disk method as the volume of the partial disk cut obliquely as shown in the upper part of FIG.
- the area where the volume is actually calculated is an area having a trapezoidal cross section on the right side indicated by a cylindrical cross section in the middle of FIG.
- This area is further divided into thin disks having a height ⁇ h.
- the volume of this thin disk is obtained as shown in the lower part of FIG.
- the lower part of FIG. 7 shows the upper surface of the disk.
- the bottom area of the disc can be obtained as the sum of the sector and the triangle.
- the volume of the thin disk is calculated. The volume is obtained for a number of divided thin disks, and the sum of them is calculated to obtain the volume value of the disk.
- the volume calculation processing on an image of one frame has been described.
- the heart is a moving tissue and it is desirable to be able to measure continuous volume changes.
- the trace line trace calculation unit 34 may track the intracardiac wall trace line 207 traced in the first frame.
- the heart chamber inner wall trace line 207 is deformed while fitting to the contour according to the deformation of the inner wall of the heart chamber, so that it is not necessary to perform manual tracing in the second and subsequent frames.
- S12 to S17 are automatically executed, and the volume value for each frame is calculated.
- the image display unit 61 displays and outputs the volume value and the image (S18).
- FIG. 2 shows a case where both the left ventricle and the left atrium are traced and the volume change over time is measured.
- the chamber volume measurement value 202 includes the volume value of the first area calculated by the conventional disk method and the volume value of the second area calculated by the pseudo disk method for each of the left ventricle and the left atrium.
- the total volume value by the sum of the volume values of the first and second regions is displayed.
- the volume value of the first region, the volume value of the second region, and the entire volume value are input to the display unit 6 by the examiner inputting a desired volume value via the input unit 5. Set the input so that it is displayed. Thereby, at least one of each volume value can be displayed on the display unit.
- the heart chamber volume change graph 203 displays a volume change graph of the left ventricle and the left atrium.
- a biological signal 209 is also displayed in parallel.
- the inner chamber wall trace line 207, the heart chamber axis 206, the annulus line 208, the segment line 204, and the virtual segment line 205 are superimposed and displayed.
- the virtual dividing line 205 it is shown that measurement is performed at a position where measurement was impossible with the conventional disk method.
- the virtual trace line 501 it can be shown that the measurement is performed at a position where measurement is impossible by the conventional disk method.
- the ultrasound image, heart chamber inner wall trace line 207, heart chamber axis 206, annulus line 208, segment line 204, virtual segment line 205, graph, etc. shown in FIG. 2 are displayed in synchronization with the movement of the subject's heart. .
- the time phase bar 210 on the graph indicates the position of the time phase of the ultrasonic image.
- the present embodiment it is possible to more accurately measure the volume in the vicinity of the annulus that has been conventionally measured to be too small. Moreover, since the measurement procedure is the same as that of the conventional method, the measurement can be easily performed without increasing the number of steps. Furthermore, since the position of the virtual trace line 501 or the virtual segment line 205 is displayed and output, measurement can be performed while confirming the position of the disk filling the heart chamber.
- FIG. 8 is a diagram showing a first modification example for generating the virtual trace line 501.
- a virtual trace line 501 parallel to the heart chamber axis 206 is generated from the end point of the heart chamber inner wall trace line 207.
- a virtual disk is generated between the virtual trace line and the opposite cardiac chamber trace line.
- a straight line parallel to the heart chamber axis 206 is extended from one end point of the inner wall trace line 207 to form a virtual trace line 501.
- the calculation amount is small, and the virtual trace line 501 can be easily set.
- FIG. 9 is a diagram showing a second modification example for generating the virtual trace line 501.
- a virtual trace line 501 is generated at a position symmetrical to the heart chamber axis 206 of the inner wall trace line 207 of the heart chamber.
- a virtual dividing line 205 is generated between the virtual trace line 501 and the intracardiac wall trace line 207.
- virtual trace lines are generated at positions symmetrical to the heart chamber axis 206 of the inner wall trace line 207 constituting the second heart chamber region. According to the above method, the amount of calculation is small and a virtual trace line can be set easily.
- FIG. 10 is a diagram showing a third modification example for generating the virtual trace line 501.
- a contour line 801 is generated by connecting the inner wall trace line 207 and the virtual trace line 501 and integrating them.
- the contour line 801 is deformed by a contour deformation algorithm such as a dynamic contour model or contour pattern matching.
- the entire contour line 801 is extracted while fitting the heart chamber trace line portion to the contour of the heart chamber by the effect of the contour model and controlling the contour of the virtual trace portion.
- a disc is generated in an area sandwiched between the contour lines.
- FIG. 11 is a diagram showing a fourth modification example for generating the virtual trace line 501.
- This is a method of closing the virtual trace line 501 along the shape of the valve as shown in FIG. Since the valve 1101 is closed when blood flows from the pulmonary artery into the left atrium, the left atrium and the valve are integrally closed. At this time, if the heart chamber inner wall trace line 207 is set in accordance with the shape of the valve, the volume of the left atrium and further the region of the valve can also be measured.
- the annulus line 208 it is also possible to measure separately the area surrounded by the valve and the annulus line, and the volume of the left atrial inner wall and the area surrounded by the annulus surface. . Furthermore, by subtracting the volume of the region surrounded by the valve and the annulus surface from the volume of the region surrounded by the inner wall of the heart chamber and the annulus surface of the left ventricle, the volume that the valve has entered the left chamber is subtracted This enables more accurate volume measurement at the end of the left ventricular systole.
- the volume can be calculated more accurately.
- FIG. 12 is a diagram showing a modification 1 of the method for calculating the volume of the virtual disk, and shows a modification of the disk volume calculation (S14) by the volume calculator 33.
- an analytical calculation is performed by an integration method in order to calculate the disk volume cut obliquely in the upper part of FIG.
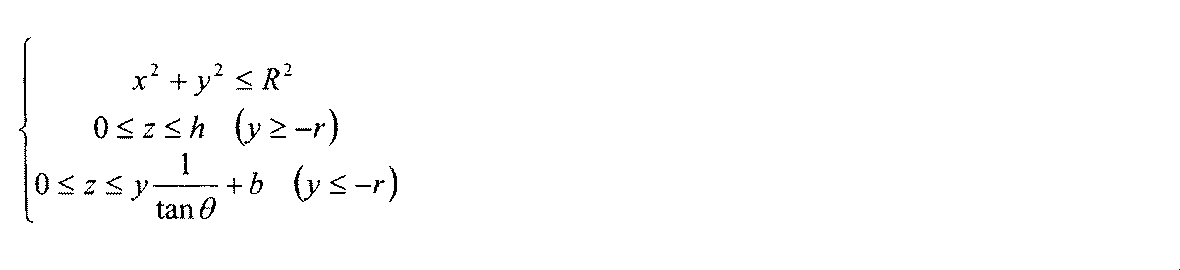
- the lower part of FIG. 12 is a view of the disk from the side. If the radius of the disk is R, the length from the center of the disk to the cutting surface is r, the cutting angle is ⁇ , and the height of the disk is h, the partial disk area to be obtained is expressed by the following equation (2).
- the volume V of the partial disk is calculated by calculating the area surrounded by Equation 2 by the integration method. This is obtained for all virtual disks, and the total volume is calculated to calculate the cardiac chamber volume.
- the single-plane disk method has been described regarding the processing for obtaining the heart chamber volume of the present embodiment, but it can also be applied to, for example, the biplane disk method using the apex 4 chamber image and the apex 2 chamber image.
- the disc shape is an elliptical cylinder.
- the calculation of the cylinder in the above embodiment only needs to be transformed into an elliptic calculation.
- the present invention is applicable to an organ other than the heart mentioned in the present embodiment when the shape can be expressed by a set of cylinders.
- the medical image display device of the present invention displays a tomographic image obtained by imaging a tomographic image of the heart of the subject on the display unit 6, and based on the displayed tomographic image, the inner wall surface and valve of the heart
- the volume of the heart chamber region surrounded by the annulus is obtained, and the display unit 6 has an intracardiac wall trace line 207 corresponding to the inner wall surface of the heart chamber and an annulus 208 corresponding to the annulus surface.
- a contour line, a heart chamber axis 206 that passes through the center of the annulus line 208 and a position farthest from the center of the inner chamber trace line 207, and a plurality of dividing lines that are orthogonal to the heart chamber axis 206 are displayed. Can be configured.
- the place where both ends of the segmentation line intersect the heart chamber inner wall trace line 207 is the first heart chamber region, and one end of the segmentation line intersects the annulus line 208 and the other end intersects the heart chamber inner wall trace line 207.
- the first heart chamber region and the second heart chamber region can be displayed in different display modes. This allows the examiner to recognize that the volume of each heart chamber region is calculated with the first heart chamber region and the second heart chamber region as different regions.
- a plurality of division lines in the first heart chamber region are defined as first division lines
- a plurality of division lines in the second heart chamber region are defined as second division lines
- the first division The display mode can be made different by displaying the line and the second dividing line with, for example, lines of different colors.
- the examiner recognizes that the volume of each heart chamber area is calculated with each area as a different area. Can be made.
- the volume of the first heart chamber region and the second heart chamber region is numerically displayed, for example, with a color corresponding to the color of the plurality of first segment lines and the plurality of second segment lines. The person can easily associate the volumes of the respective areas.
- the examiner can recognize that the volume of the second heart chamber region is calculated using the pseudo disk method. it can.
- the case where the volume of the heart is calculated has been described as an example.
- the present invention is applied to an organ capable of measuring the volume of the lumen such as the bladder, prostate, liver, and pancreas. be able to.
- the lumen wall surface orthogonal to the lumen wall substitutes for the annulus surface.
- the pseudo disk method is applied to the area. The total volume can be obtained more accurately by applying.
Landscapes
- Health & Medical Sciences (AREA)
- Life Sciences & Earth Sciences (AREA)
- Physics & Mathematics (AREA)
- Engineering & Computer Science (AREA)
- Biomedical Technology (AREA)
- Molecular Biology (AREA)
- Veterinary Medicine (AREA)
- Public Health (AREA)
- General Health & Medical Sciences (AREA)
- Animal Behavior & Ethology (AREA)
- Biophysics (AREA)
- Pathology (AREA)
- Surgery (AREA)
- Heart & Thoracic Surgery (AREA)
- Medical Informatics (AREA)
- Nuclear Medicine, Radiotherapy & Molecular Imaging (AREA)
- Radiology & Medical Imaging (AREA)
- Theoretical Computer Science (AREA)
- Geometry (AREA)
- Computer Vision & Pattern Recognition (AREA)
- Oral & Maxillofacial Surgery (AREA)
- Dentistry (AREA)
- General Physics & Mathematics (AREA)
- Ultra Sonic Daignosis Equipment (AREA)
- Apparatus For Radiation Diagnosis (AREA)
- Magnetic Resonance Imaging Apparatus (AREA)
Abstract
Description
続いて図2を用いて心腔容積を求める際の検者の操作を簡単に説明する。図2は、左心室と左心房を描画した超音波断層像の一例を示すものである。検者はまず、従来のディスク法による容積計測に基づいて、計測したい心腔を含む画像を計測画面に描画させる。次に、心腔トレース指定部51により入力機器を用いて心腔内壁面に相当する位置の輪郭をトレースする。なおこのトレースは検者がマニュアルで行なってもよいし、装置が自動でトレースする公知の方法を用いることもできる。

グラフ上の時相バー210は、超音波画像の時相の位置を示すものである。
続いて、仮想トレース線を生成する方法の変形例を説明する。図8は仮想トレース線501の生成の変形例1を示す図である。図8に示すように、心腔内壁トレース線207の端点から、心腔軸206に平行な仮想トレース線501を生成する。この仮想トレース線と対向する心腔トレース線の間で仮想ディスクを生成する。
続いて、仮想トレース線を生成する方法の変形例2を説明する。図9は仮想トレース線501の生成の変形例2を示す図である。図9のように、心腔内壁トレース線207の心腔軸206に線対称の位置に仮想トレース線501を生成する。この仮想トレース線501と心腔内壁トレース線207の間で仮想区分線205を生成する。
続いて、仮想トレース線を生成する方法の変形例3を説明する。図10は仮想トレース線501の生成の変形例3を示す図である。図10のように、心腔内壁トレース線207と仮想トレース線501を接続して一体化した輪郭線801を生成する。輪郭線801は、例えば動的輪郭モデルや輪郭パターンマッチングのような輪郭変形アルゴリズムによって変形される。輪郭モデルの効果によって心腔トレース線部分を心腔の輪郭にフィットさせるとともに、仮想トレース部分の輪郭を制御しながら、全体の輪郭線801を抽出する。
この輪郭線で挟まれる領域にディスクを生成する。
続いて、仮想トレース線を生成する方法の変形例4を説明する。図11は仮想トレース線501の生成の変形例4を示す図である。図11のように弁の形状に沿わせて仮想トレース線501を閉じる方法である。弁1101は肺動脈から左房に血液が流入するときに閉じているため、左房と弁は一体化して閉じた形状を持つ。このとき、弁の形状に合わせて心腔内壁トレース線207を設定すれば、左房とさらに弁の部分の領域の容積も合わせて計測可能である。また、弁輪線208で区切れば、弁と弁輪線で囲まれる領域と左房の心腔内壁面と弁輪面で囲まれる領域の容積とを別にして計測することも可能である。さらに、左室の心腔内壁面と弁輪面で囲まれる領域の容積から、弁と弁輪面で囲まれる領域の容積を引くことによって、弁が左室内に入り込んだ分の容積を差し引くことができるので、左室収縮末期のより正確な容積計測が可能になる。
続いて、仮想ディスクの容積を算出する方法の変形例1を説明する。図12は仮想ディスクの容積を算出する方法の変形例1を示す図であり、容積演算部33によるディスク容積の算出(S14)についての変形例を示すものである。この変形例は、図12上段の斜めに切断したディスク容積を算出するために積分法による解析的な演算を行うものである。
Claims (15)
- 被検体の臓器の断層を撮像して得られた断層画像を表示部に表示し、該表示された断層画像に基づいて前記臓器の内腔内壁面に囲まれる内腔領域の容積を求める医用画像表示方法であって、
前記断層画像上で前記内腔内壁面に相当する箇所をトレースして表示するステップと、トレースされた内腔トレース線の両端点を結んだ線を表示するステップと、前記線の中央と前記内腔トレース線の前記中央から最も離れた位置とを通る内腔軸を表示するステップと、前記内腔軸に直交し両端が前記内腔トレース線に交わる複数の区分線を表示するステップと、前記複数の区分線による第1の内腔領域の内腔容積をディスク法により算出するステップと、前記複数の区分線のうち最も前記線に近い区分線と前記線と前記内腔トレース線により囲まれる第2の内腔領域の内腔容積を擬似ディスク法により算出するステップと、前記算出された第1と第2の内腔領域の内腔容積の和により全体の内腔容積を算出するステップと、前記第1と第2の内腔領域の内腔容積又は前記全体の内腔容積の少なくとも1つを表示するステップとを備えることを特徴とする医用画像表示方法。 - 被検体の心臓の断層を撮像して得られた断層画像を表示部に表示し、該表示された断層画像に基づいて前記心臓の心腔内壁面及び弁輪面に囲まれる心腔領域の容積を求める医用画像表示方法であって、
前記断層画像上で前記心腔内壁面に相当する箇所をトレースして表示するステップと、トレースされた心腔内壁トレース線の両端点を結んで前記弁輪面に相当する弁輪線を表示するステップと、前記弁輪線の中央と前記心腔内壁トレース線の前記中央から最も離れた位置とを通る心腔軸を表示するステップと、前記心腔軸に直交し両端が前記心腔内壁トレース線に交わる複数の区分線を表示するステップと、前記複数の区分線による第1の心腔領域の心腔容積をディスク法により算出するステップと、前記複数の区分線のうち最も前記弁輪線に近い区分線と前記弁輪線と前記心腔内壁トレース線により囲まれる第2の心腔領域の心腔容積を擬似ディスク法により算出するステップと、前記算出された第1と第2の心腔領域の心腔容積の和により全体の心腔容積を算出するステップと、前記第1と第2の心腔領域の心腔容積又は前記全体の心腔容積の少なくとも1つを表示するステップとを備えることを特徴とする医用画像表示方法。 - 請求項2の医用画像表示方法において、
前記第2の心腔領域の心腔容積を擬似ディスク法により算出するステップは、前記第2の心腔領域を構成する前記心腔内壁トレース線と前記心腔軸を挟んで対向する仮想トレース線を生成するステップと、前記心腔軸に直交し一端が前記仮想トレース線と交わり他端が前記心腔内壁トレース線と交わる複数の仮想区分線を生成するステップと、前記仮想トレース線と前記仮想区分線と前記心腔内壁トレース線とに基づいて仮想ディスクを生成するステップと、前記仮想ディスクを前記弁輪面で切断して前記心腔内壁トレース線が含まれる側の部分ディスクの容積を前記第2の心腔領域の心腔容積として算出するステップとを含んでなり、前記仮想トレース線と前記仮想区分線を前記表示部に表示してなる医用画像表示方法。 - 請求項3の医用画像表示方法において、
前記仮想トレース線を生成するステップは、前記心腔内壁トレース線を曲線関数として前記心腔内壁トレース線の一方の端点から前記心腔トレース線を外挿して延長して仮想トレース線とする医用画像表示方法。 - 請求項3の医用画像表示方法において、
前記仮想トレース線を生成するステップは、前記心腔内壁トレース線の一方の端点から前記心腔軸に平行な直線を延長して仮想トレース線とする医用画像表示方法。 - 請求項3の医用画像表示方法において、
前記仮想トレース線を生成するステップは、前記第2の心腔領域を構成する前記心腔内壁トレース線の前記心腔軸に線対象の位置に仮想トレース線を生成する医用画像表示方法。 - 請求項3の医用画像表示方法において、
前記仮想トレース線を生成するステップは、輪郭曲線関数により前記心腔内壁トレース線と前記仮想トレース線とを一体にして生成する医用画像表示方法。 - 請求項3の医用画像表示方法において、
前記第2の心腔領域の心腔容積を算出するステップは、前記部分ディスクを微小高さの複数のディスクに区分し、該複数のディスクの容積の総和として算出する医用画像表示方法。 - 請求項3の医用画像表示方法において、
前記第2の心腔領域の心腔容積を算出するステップは、前記第2の心腔領域を積分法によって演算することにより算出する請求項2の医用画像表示方法。 - 被検体の臓器の断層を撮像して得られた断層画像を表示する表示部と、該表示部に表示された断層画像に基づいて前記臓器の内腔内壁面に囲まれる内腔領域の容積を求める演算部とを備えた医用画像診断装置であって、
前記表示部に表示された断層画像上で前記臓器の内腔内壁面に相当する箇所をトレースする手段と、前記トレースされた内腔トレース線の両端点を結んだ線を生成して表示する手段と、前記線の中央と前記内腔トレース線の前記中央から最も離れた位置とを通る内腔軸を生成して表示する手段と、前記内腔軸に直交し両端が前記内腔トレース線に交わる複数の区分線を生成して表示する手段と、前記複数の区分線による第1の内腔領域の内腔容積をディスク法により算出する手段と、前記複数の区分線のうち最も前記線に近い区分線と前記線と前記内腔トレース線により囲まれる第2の内腔領域の内腔容積を擬似ディスク法により算出する手段と、前記算出された第1と第2の内腔領域の内腔容積の和により全体の内腔容積を算出する手段と、前記第1と第2の内腔領域の内腔容積又は前記全体の内腔容積の少なくとも1つを表示する手段を備えることを特徴とする医用画像診断装置。 - 被検体の心臓の断層を撮像して得られた断層画像を表示する表示部と、該表示部に表示された断層画像に基づいて前記心臓の心腔内壁面及び弁輪面に囲まれる心腔領域の容積を求める演算部とを備えた医用画像診断装置であって、
前記表示部に表示された断層画像上で前記心臓の心腔内壁面に相当する箇所をトレースする手段と、前記トレースされた心腔内壁トレース線の両端点を結んで前記弁輪面に相当する弁輪線を生成して表示する手段と、前記弁輪線の中央と前記心腔内壁トレース線の前記中央から最も離れた位置とを通る心腔軸を生成して表示する手段と、前記心腔軸に直交し両端が前記心腔内壁トレース線に交わる複数の区分線を生成して表示する手段と、前記複数の区分線による第1の心腔領域の心腔容積をディスク法により算出する手段と、前記複数の区分線のうち最も前記弁輪線に近い区分線と前記弁輪線と前記心腔内壁トレース線により囲まれる第2の心腔領域の心腔容積を擬似ディスク法により算出する手段と、前記算出された第1と第2の心腔領域の心腔容積の和により全体の心腔容積を算出する手段と、前記第1と第2の心腔領域の心腔容積及び前記全体の心腔容積を表示する手段を備えることを特徴とする医用画像診断装置。 - 被検体の心臓の断層を撮像して得られた断層画像を表示部に表示し、該表示された断層画像に基づいて前記心臓の心腔内壁面及び弁輪面に囲まれた心腔領域の容積を求める医用画像表示装置であって、
前記医用画像は、前記心腔内壁面に相当する心腔内壁トレース線と前記弁輪面に相当する弁輪線からなる心腔輪郭線と、前記弁輪線の中央と前記心腔内壁トレース線の前記中央から最も離れた位置とを通る心腔軸と、該心腔軸に直交する複数の区分線とを表示する画像を有し、
前記区分線の両端が前記心腔内壁トレース線と交わる第1の心腔領域と、前記区分線の一端が前記弁輪線と交わり他端が前記心腔内壁トレース線と交わる第2の心腔領域とが異なる表示態様で表示されることを特徴とする医用画像表示装置。 - 請求項12の医用画像表示装置において、
前記医用画像は、前記第1の心腔領域内の複数の区分線を第1の区分線とし、前記第2の心腔領域内の複数の区分線を第2の区分線とし、前記第1の区分線と第2の区分線が異なる表示態様で表示されてなる医用画像表示装置。 - 請求項12の医用画像表示装置において、
前記医用画像は、前記第1の心腔領域の容積と前記第2の心腔領域の容積が、それぞれ前記第1の心腔領域と前記第2の心腔領域の表示態様又は前記複数の第1の区分線と前記複数の第2の区分線の表示態様に対応付けられて数値表示されてなる医用画像表示装置。 - 請求項12の医用画像表示装置において、
前記医用画像は、前記第2の心腔領域を構成する前記心腔内壁トレース線と前記心腔軸を挟んで対向する仮想トレース線と、前記心腔軸に直交し一端が前記仮想トレース線と交わり他端が前記心腔内壁トレース線に交わる複数の仮想区分線とが表示されてなる医用画像表示装置。
Priority Applications (2)
| Application Number | Priority Date | Filing Date | Title |
|---|---|---|---|
| JP2010550503A JP5536678B2 (ja) | 2009-02-13 | 2010-02-08 | 医用画像表示方法、医用画像診断装置、及び医用画像表示装置 |
| US13/201,392 US8419641B2 (en) | 2009-02-13 | 2010-02-08 | Medical image display method, medical image diagnostic apparatus, and medical image display device |
Applications Claiming Priority (2)
| Application Number | Priority Date | Filing Date | Title |
|---|---|---|---|
| JP2009-030739 | 2009-02-13 | ||
| JP2009030739 | 2009-02-13 |
Publications (1)
| Publication Number | Publication Date |
|---|---|
| WO2010092919A1 true WO2010092919A1 (ja) | 2010-08-19 |
Family
ID=42561761
Family Applications (1)
| Application Number | Title | Priority Date | Filing Date |
|---|---|---|---|
| PCT/JP2010/051765 Ceased WO2010092919A1 (ja) | 2009-02-13 | 2010-02-08 | 医用画像表示方法、医用画像診断装置、及び医用画像表示装置 |
Country Status (3)
| Country | Link |
|---|---|
| US (1) | US8419641B2 (ja) |
| JP (1) | JP5536678B2 (ja) |
| WO (1) | WO2010092919A1 (ja) |
Cited By (5)
| Publication number | Priority date | Publication date | Assignee | Title |
|---|---|---|---|---|
| CN102451005A (zh) * | 2010-11-02 | 2012-05-16 | 株式会社东芝 | 磁共振成像装置及其方法 |
| WO2013146710A1 (ja) * | 2012-03-30 | 2013-10-03 | 株式会社東芝 | 超音波診断装置、画像処理装置及び画像処理方法 |
| JP2017121520A (ja) * | 2012-03-30 | 2017-07-13 | 東芝メディカルシステムズ株式会社 | 超音波診断装置、画像処理装置及び画像処理方法 |
| JP2018512956A (ja) * | 2015-04-23 | 2018-05-24 | コーニンクレッカ フィリップス エヌ ヴェKoninklijke Philips N.V. | 解剖学的構造のモデルベースのセグメント化 |
| JP2019537035A (ja) * | 2016-11-11 | 2019-12-19 | オーフス・ウニベルジテートAarhus Universitet | ヒトの心臓および心房をモデル化するための方法およびシステム |
Families Citing this family (9)
| Publication number | Priority date | Publication date | Assignee | Title |
|---|---|---|---|---|
| US8419641B2 (en) * | 2009-02-13 | 2013-04-16 | Hitachi Medical Corporation | Medical image display method, medical image diagnostic apparatus, and medical image display device |
| US8983160B2 (en) * | 2009-03-31 | 2015-03-17 | Hitachi Medical Corporation | Medical image diagnostic apparatus and volume calculating method |
| US8934686B2 (en) * | 2009-11-26 | 2015-01-13 | Algotec Systems Ltd. | User interface for selecting paths in an image |
| US10379607B2 (en) * | 2012-07-30 | 2019-08-13 | Agilent Technologies, Inc. | Experimental chamber with computer-controlled display wall |
| US8887272B2 (en) * | 2012-08-24 | 2014-11-11 | General Electric Company | Medical device customization system |
| CN108309347B (zh) * | 2017-01-16 | 2021-04-09 | 深圳迈瑞生物医疗电子股份有限公司 | 基于超声图像的参数测量方法和超声成像系统 |
| CN108309354B (zh) * | 2017-01-16 | 2021-04-02 | 深圳迈瑞生物医疗电子股份有限公司 | 超声盆底检测引导方法和超声成像系统 |
| EP3691533B1 (en) | 2017-10-04 | 2023-11-29 | Verathon INC. | Multi-plane and multi-mode visualization of an area of interest during aiming of an ultrasound probe |
| US20240225610A9 (en) * | 2021-02-26 | 2024-07-11 | Ontact Health Co., Ltd. | Method and device for detecting medical indices in medical images |
Citations (5)
| Publication number | Priority date | Publication date | Assignee | Title |
|---|---|---|---|---|
| JPH0316556A (ja) * | 1989-06-15 | 1991-01-24 | Toshiba Corp | 心機能解析のための画像処理方法 |
| JPH09187448A (ja) * | 1996-01-12 | 1997-07-22 | Toshiba Corp | X線画像診断装置 |
| JP2003310616A (ja) * | 2002-04-25 | 2003-11-05 | Aloka Co Ltd | 超音波診断装置 |
| JP2004073850A (ja) * | 2002-06-18 | 2004-03-11 | Toshiba Medical System Co Ltd | 超音波診断装置、医用画像装置、データ処理装置、データ処理方法、及びソフトウェア記録媒体 |
| JP2006167080A (ja) * | 2004-12-15 | 2006-06-29 | Aloka Co Ltd | 超音波診断装置 |
Family Cites Families (23)
| Publication number | Priority date | Publication date | Assignee | Title |
|---|---|---|---|---|
| JP4006826B2 (ja) * | 1998-04-28 | 2007-11-14 | 株式会社日立製作所 | 生体光計測装置 |
| JP4076003B2 (ja) * | 1999-02-19 | 2008-04-16 | 株式会社日立製作所 | 生体光計測装置 |
| DE10052540A1 (de) * | 2000-10-23 | 2002-05-16 | Siemens Ag | Diagnostikeinrichtung mit Mitteln zur Einstellung von Transferfunktionen |
| US6957095B2 (en) * | 2001-10-04 | 2005-10-18 | Kabushiki Kaisha Toshiba | Imaging system for medical diagnosis |
| JP5202841B2 (ja) * | 2003-03-27 | 2013-06-05 | コーニンクレッカ フィリップス エレクトロニクス エヌ ヴィ | 医用イメージングシステム及び関心対象をセグメント化する方法 |
| JP2005237555A (ja) * | 2004-02-25 | 2005-09-08 | Jgs:Kk | 心臓壁運動の評価方法、心臓壁運動評価装置及びプログラム |
| DE102005038940B4 (de) * | 2005-08-17 | 2007-08-30 | Siemens Ag | Verfahren zur Filterung tomographischer 3D-Darstellungen nach erfolgter Rekonstruktion von Volumendaten |
| US8199984B2 (en) * | 2006-05-02 | 2012-06-12 | National University Corporation Nagoya University | System that assists in observing a luminal organ using the structure of the luminal organ |
| JP4745133B2 (ja) * | 2006-05-30 | 2011-08-10 | 株式会社東芝 | 超音波診断装置、医用画像処理装置及び医用画像処理プログラム |
| US20080117210A1 (en) * | 2006-11-22 | 2008-05-22 | Barco N.V. | Virtual endoscopy |
| US7853058B2 (en) * | 2006-11-22 | 2010-12-14 | Toshiba Medical Visualization Systems Europe, Limited | Determining a viewpoint for navigating a virtual camera through a biological object with a lumen |
| US8126227B2 (en) * | 2006-12-04 | 2012-02-28 | Kabushiki Kaisha Toshiba | X-ray computed tomographic apparatus and medical image processing apparatus |
| JP4988372B2 (ja) * | 2007-02-13 | 2012-08-01 | 日立アロカメディカル株式会社 | 超音波診断装置 |
| JP5049614B2 (ja) * | 2007-03-08 | 2012-10-17 | 株式会社東芝 | 医用画像表示装置 |
| JP2009160306A (ja) * | 2008-01-09 | 2009-07-23 | Ziosoft Inc | 画像表示装置、画像表示装置の制御方法、および画像表示装置の制御プログラム |
| JP5392644B2 (ja) * | 2008-06-13 | 2014-01-22 | 株式会社日立メディコ | 画像表示装置、方法、及びプログラム |
| GB2464212B (en) * | 2008-10-09 | 2013-03-06 | Siemens Medical Solutions | Methods and apparatus for analyzing medical imaging data |
| US8419641B2 (en) * | 2009-02-13 | 2013-04-16 | Hitachi Medical Corporation | Medical image display method, medical image diagnostic apparatus, and medical image display device |
| US8983160B2 (en) * | 2009-03-31 | 2015-03-17 | Hitachi Medical Corporation | Medical image diagnostic apparatus and volume calculating method |
| JP5575491B2 (ja) * | 2010-01-14 | 2014-08-20 | 株式会社東芝 | 医療画像診断装置 |
| JP5675227B2 (ja) * | 2010-08-31 | 2015-02-25 | 富士フイルム株式会社 | 内視鏡画像処理装置および作動方法、並びに、プログラム |
| US8674315B2 (en) * | 2010-11-12 | 2014-03-18 | Siemens Medical Solutions Usa, Inc. | Method and apparatus for using image cumulative distribution function for tomographic reconstruction quality control |
| DE102010055772B4 (de) * | 2010-12-23 | 2014-06-05 | Carl Zeiss Meditec Ag | Anordnung und Verfahren zur quantitativen Bestimmung des Blutflusses innerhalb von Blutgefäßen |
-
2010
- 2010-02-08 US US13/201,392 patent/US8419641B2/en not_active Expired - Fee Related
- 2010-02-08 WO PCT/JP2010/051765 patent/WO2010092919A1/ja not_active Ceased
- 2010-02-08 JP JP2010550503A patent/JP5536678B2/ja not_active Expired - Fee Related
Patent Citations (5)
| Publication number | Priority date | Publication date | Assignee | Title |
|---|---|---|---|---|
| JPH0316556A (ja) * | 1989-06-15 | 1991-01-24 | Toshiba Corp | 心機能解析のための画像処理方法 |
| JPH09187448A (ja) * | 1996-01-12 | 1997-07-22 | Toshiba Corp | X線画像診断装置 |
| JP2003310616A (ja) * | 2002-04-25 | 2003-11-05 | Aloka Co Ltd | 超音波診断装置 |
| JP2004073850A (ja) * | 2002-06-18 | 2004-03-11 | Toshiba Medical System Co Ltd | 超音波診断装置、医用画像装置、データ処理装置、データ処理方法、及びソフトウェア記録媒体 |
| JP2006167080A (ja) * | 2004-12-15 | 2006-06-29 | Aloka Co Ltd | 超音波診断装置 |
Cited By (9)
| Publication number | Priority date | Publication date | Assignee | Title |
|---|---|---|---|---|
| CN102451005A (zh) * | 2010-11-02 | 2012-05-16 | 株式会社东芝 | 磁共振成像装置及其方法 |
| CN102451005B (zh) * | 2010-11-02 | 2015-04-29 | 株式会社东芝 | 磁共振成像装置及其方法 |
| WO2013146710A1 (ja) * | 2012-03-30 | 2013-10-03 | 株式会社東芝 | 超音波診断装置、画像処理装置及び画像処理方法 |
| JP2013226400A (ja) * | 2012-03-30 | 2013-11-07 | Toshiba Corp | 超音波診断装置、画像処理装置及び画像処理方法 |
| CN103648402A (zh) * | 2012-03-30 | 2014-03-19 | 株式会社东芝 | 超声波诊断装置、图像处理装置以及图像处理方法 |
| CN103648402B (zh) * | 2012-03-30 | 2016-06-22 | 株式会社东芝 | 超声波诊断装置、图像处理装置以及图像处理方法 |
| JP2017121520A (ja) * | 2012-03-30 | 2017-07-13 | 東芝メディカルシステムズ株式会社 | 超音波診断装置、画像処理装置及び画像処理方法 |
| JP2018512956A (ja) * | 2015-04-23 | 2018-05-24 | コーニンクレッカ フィリップス エヌ ヴェKoninklijke Philips N.V. | 解剖学的構造のモデルベースのセグメント化 |
| JP2019537035A (ja) * | 2016-11-11 | 2019-12-19 | オーフス・ウニベルジテートAarhus Universitet | ヒトの心臓および心房をモデル化するための方法およびシステム |
Also Published As
| Publication number | Publication date |
|---|---|
| US20110301454A1 (en) | 2011-12-08 |
| US8419641B2 (en) | 2013-04-16 |
| JP5536678B2 (ja) | 2014-07-02 |
| JPWO2010092919A1 (ja) | 2012-08-16 |
Similar Documents
| Publication | Publication Date | Title |
|---|---|---|
| JP5536678B2 (ja) | 医用画像表示方法、医用画像診断装置、及び医用画像表示装置 | |
| US12138114B2 (en) | Apparatus and method to guide ultrasound acquisition of the peripheral arteries in the transverse plane | |
| Horton et al. | Assessment of the right ventricle by echocardiography: a primer for cardiac sonographers | |
| JP7375140B2 (ja) | 超音波診断装置、医用画像診断装置、医用画像処理装置及び医用画像処理プログラム | |
| JP6160487B2 (ja) | 超音波診断装置およびその制御方法 | |
| US20170367678A1 (en) | Ultrasound automated method for measuring the thickness of the walls of the left anterior descending, right and circumflex coronary arteries | |
| JP7278272B2 (ja) | 超音波撮像システム及び方法 | |
| US20140303499A1 (en) | Ultrasound diagnostic apparatus and method for controlling the same | |
| JP5645811B2 (ja) | 医用画像診断装置、関心領域設定方法、医用画像処理装置、及び関心領域設定プログラム | |
| US20200352542A1 (en) | Guided-transcranial ultrasound imaging using neural networks and associated devices, systems, and methods | |
| US20230255588A1 (en) | Workflow assistance for medical doppler ultrasound evaluation | |
| US20060004291A1 (en) | Methods and apparatus for visualization of quantitative data on a model | |
| Pemberton et al. | Real-time 3-dimensional Doppler echocardiography for the assessment of stroke volume: an in vivo human study compared with standard 2-dimensional echocardiography | |
| WO2012169646A1 (ja) | 超音波診断装置、医用画像処理装置、医用画像処理方法 | |
| US20090227867A1 (en) | Ultrasonograph | |
| Bjornerheim et al. | High frame rate Doppler echocardiography in the rat: an evaluation of the method | |
| JP4870449B2 (ja) | 超音波診断装置及び超音波画像処理方法 | |
| US12573040B2 (en) | Image processing apparatus and image processing method | |
| JP6858189B2 (ja) | 中心軸の湾曲及び横方向偏心を伴う心臓の超音波心臓評価 | |
| JP2010502245A (ja) | 左心室のねじれを測定するシステム及び方法 | |
| JP5987640B2 (ja) | 超音波を用いた被検体の3次元復元方法および装置 | |
| JP2013223625A (ja) | 超音波画像解析装置および超音波画像解析方法 | |
| Kemaloglu Oz et al. | From Traditional to Cutting‐Edge: Transforming Pulmonary Valve Assessment With Advanced Echocardiography Techniques | |
| Gianstefani et al. | New technical developments in imaging techniques | |
| CN121867838A (zh) | 一种左心室乳头肌目标切面的获取方法及其超声评估方法 |
Legal Events
| Date | Code | Title | Description |
|---|---|---|---|
| 121 | Ep: the epo has been informed by wipo that ep was designated in this application |
Ref document number: 10741196 Country of ref document: EP Kind code of ref document: A1 |
|
| WWE | Wipo information: entry into national phase |
Ref document number: 2010550503 Country of ref document: JP |
|
| WWE | Wipo information: entry into national phase |
Ref document number: 13201392 Country of ref document: US |
|
| NENP | Non-entry into the national phase |
Ref country code: DE |
|
| 122 | Ep: pct application non-entry in european phase |
Ref document number: 10741196 Country of ref document: EP Kind code of ref document: A1 |